management’s discussion and analysis of financial ... as measures for preventing railway crossing...
TRANSCRIPT
Management’s Discussion and Analysis of Financial Condition and Results of Operations
Forward-looking statements in the following discussion and analysis are
judgments of the JR East Group as of March 31, 2017.
Key Accounting Policies and EstimatesJR East prepares consolidated financial statements in accordance with
accounting principles generally accepted in Japan. Forward-looking esti-
mates included in those financial statements are based on a variety of factors
that, in light of JR East’s past performance and current circumstances, can be
reasonably assumed to have affected results for assets and liabilities on the
consolidated settlement date and consolidated revenues and expenses in
fiscal 2017, ended March 31, 2017. JR East continuously assesses those
factors. However, actual results may differ materially from those estimates,
given the uncertainty of forward-looking statements.
Performance AnalysisOverviewIn fiscal 2017, the Japanese economy improved in such areas as employment
and income conditions and continued to recover gradually. Under these
conditions, and guided by “JR East Group Management Vision V—Ever
Onward,” the Group (consisting of the Company, its consolidated subsidiaries,
and affiliated companies that were accounted for by the equity method)
steadily executed various initiatives centered on the railway, life-style service,
and IT & Suica businesses.
As a result of these initiatives, during the fiscal year under review, operating
revenues increased 0.5% year on year, to ¥2,880.8 billion ($25,721 million),
largely due to growth in the Company’s transportation revenues. However,
due to an increase in operating expenses, mainly arising from the recognition
of a provision for large-scale renovation of Shinkansen infrastructure, operating
income decreased 4.4%, to ¥466.3 billion ($4,163 million). Profit attributable
to owners of parent increased 13.3%, to ¥277.9 billion ($2,481 million), as a
result of an increase in gain on sales of fixed assets.
To pursue its priority task of improving the safety and reliability of
transportation, JR East is making rigorous efforts to prevent the reoccurrence
of accidents and incidents that affect transportation as well as efforts to
prevent the occurrence of such accidents and incidents by identifying risks
and weaknesses. Specifically, JR East improved its electrical equipment and
Shinkansen facilities to address their weaknesses. In addition, to deepen
each employee’s understanding of the nature of his or her work, the Company
introduced training equipment such as simulators at training centers, skill
training centers, and operational sites and conducted more practical
educational and training activities. Also, JR East took measures to improve
the technical capabilities of the Group as a whole by increasing personnel
exchanges with Group companies and other organizations and by collaborat-
ing with partner companies to solidify safety management with respect to
railway construction work. Further, as part of JR East’s efforts to provide
reliable transportation services, the Company implemented measures related
to ground facilities and railcars to prevent service disruptions. In addition,
JR East advanced initiatives to minimize the impact of transportation service
disruptions, resume operations following such disruptions as soon as
possible, and communicate with customers expeditiously, at the time of
such disruptions.
With respect to strategies for visitors to Japan from overseas, the Group as
a whole took measures to increase the number of and improve products and
develop capabilities to serve such customers. Specifically, in April 2016 JR
East launched the Tokyo–Osaka Hokuriku Arch Pass, which may be used for
the Hokuriku Shinkansen Line, and JR East-South Hokkaido Rail Pass, which
may be used for the Hokkaido Shinkansen Line. In August 2016, the
Company launched a new product for the Tohoku area, TOHOKU BUFFET,
and expanded and improved the lineup of travel products for visitors to Japan
under the JR East Railway Holiday brand. Further, the Company opened
JAPAN RAIL CAFE (Singapore) in December 2016 with the aim of distributing
information and providing support in relation to travel to Japan. JR East made
progress in introducing station name signs in four languages and station
numbering that displays both station numbers and line numbers. In addition,
the Company opened a new JR EAST Travel Service Center at the east exit of
Ikebukuro Station and increased the number of service counters in the
centers at Tokyo Station and Narita Airport Terminal 2·3 Station. Meanwhile,
Train Hostel HOKUTOSEI (Tokyo), a lodging facility that offers inexpensive,
long-term accommodation for visitors to Japan, was opened in December 2016.
With respect to the area surrounding Shinagawa Station and Tamachi
Station, JR East aims to develop an internationally attractive exchange hub,
as some of the land used for the Shinagawa Depot railway yard will become
available for other uses. As the urban development plans for some of this land
were approved in April 2016 for special treatment within the National Strategic
Special Zone, JR East is continuing the process of pursuing urban develop-
ment in cooperation with the Government of Japan, the Tokyo Metropolitan
Government, relevant wards, and other stakeholders. In March 2017, the
“Guideline for Community Development of the Northern Peripheral Area of
Shinagawa Station” was established. Further, the Company began the
construction of Shinagawa New Station (provisional name) with a view to its
interim opening in spring 2020 and its full opening around 2024, which is
scheduled to coincide with the opening of the town.
In June 2016, JR East concluded an agreement with The Tokyo Organising
Committee of the Olympic and Paralympic Games as an Official Passenger
Rail Transportation Services Partner of the Tokyo 2020 Olympic and
Paralympic Games and announced the “JR East 2020 Project,” which sets out
JR East’s objectives. In light of this, the Company took measures to help
ensure that the Games proceed smoothly and to contribute to the growing
enthusiasm surrounding the event. For example, JR East upgraded railway
stations near competition venues and improved the security level of railway
facilities. In conjunction with these efforts, the Company announced the
slogan of “TICKET TO TOMORROW” in October 2016 with the aims of meet-
ing customers’ expectations by offering high-quality services and leaving a
legacy for society beyond 2020.
With respect to regional revitalization, JR East made progress in such
initiatives as promotion of tourism, revitalization of local industries, and town
development centered on regional core railway stations. Specifically, the
Company publicly announced the service schedule and route of the TRAIN
SUITE SHIKI-SHIMA cruise train, which will begin operations in May 2017, and
accepted orders for travel products. At Ueno Station, JR East proceeded with
development of New Departure Platform 13.5 and the PROLOGUE SHIKI-
SHIMA lounge. As initiatives for the sextic industrialization of agriculture,
73Annual Report 2017

FACTS & FIGURES
fishing, and forestry, JR East’s in-station stores and other stores began sales
of various products that used tomatoes harvested by JR Tomato Land Iwaki
Farm Co., Ltd., as well as Niigata Shupoppo, a sake that uses brewer’s rice
from JR Niigata Farm Co., Ltd. At the same time, the Company jointly estab-
lished JR Agri Sendai Co., Ltd., with local farmers. Further, based on the
“Partnership Agreement in Relation to the Development of Compact Cities for
Regional Revitalization” concluded with Akita Prefecture and Akita City, JR
East established a tourist center in Akita Station. At the same time, the
Company proceeded with preparations for the station’s west exit parking
garage building, which opened in April 2017; a sports medicine clinic, which
is scheduled for completion in spring 2018; and JR Akita Gate Arena
(provisional name), which is scheduled for completion in winter 2019.
With respect to participation in overseas railway projects, in August 2016
the Purple Line (Bangkok, Thailand), an urban mass transit system, began
operations, and sustina stainless-steel railcars manufactured by subsidiary
Japan Transport Engineering Company (J-TREC) began operations. Further,
a local subsidiary established through a joint investment with other companies
began maintenance operations for railway systems. In relation to high-speed
railways in India, subsidiary Japan International Consultants for Transportation
Co., Ltd., received orders for “The Follow-up Study for the Mumbai-
Ahmedabad High-Speed Railway Corridor” and the “General Consultancy of
the Mumbai-Ahmedabad High-Speed Railway Project” from the Japan
International Cooperation Agency (JICA) and provided consultation services
accordingly. In conjunction with these efforts, JR East took advantage of its
experience as a Shinkansen operator to provide technological support. In
addition, the Company promoted its “Global Human Resource Development
Program—Ever Onward” to nurture personnel who can effectively take on
global business development.
Results by business segment were as follows.
Segment InformationTRANSPORTATION
In the Transportation segment, with railway operations as its core operations,
the Company promoted the use of its railway networks to secure revenues while
ensuring safe and reliable transportation and enhancing customer satisfaction.
With respect to safety, JR East steadily implemented measures based
on its sixth five-year safety plan, “Group Safety Plan 2018.” The Company
steadily implemented measures in preparation for a major earthquake, such
as a possible earthquake directly beneath the Tokyo metropolitan area. JR
East earmarked a total of ¥300.0 billion for investment in such measures for
a five-year intensive implementation period ended March 31, 2017. In accor-
dance with plans, approximately 80% of the work that is currently planned was
completed by the end of the fiscal year under review. Further, JR East pro-
ceeded with the installation of automatic platform gates based on a policy of
introducing them to all railway stations on the Yamanote Line and to all railway
stations on the line segment between Omiya Station and Sakuragicho Station
on the Keihin-Tohoku and Negishi Lines. The use of automatic platform gates
began at Shinagawa Station on the Yamanote Line and at Akabane Station on
the Keihin-Tohoku Line. Also, the Company announced that it would proceed
with installation ahead of schedule in light of an accident involving a fatality in
Warabi Station’s platform in January 2017. In addition, to shorten construction
periods and reduce costs, JR East commenced the trial introduction of a new
type of automatic platform gate at Machida Station on the Yokohama Line in
December 2016. As for other initiatives, the Company kicked off the Station
Platform Safety Campaign together with other railway operators to promote
safe usage of station platforms. Further, as measures for preventing railway
crossing accidents, JR East continued eliminating and consolidating railway
crossings, installing crossing gates, and installing more obstruction warning
devices and obstacle detection devices for railway crossings. The Company
also introduced a train approach alarm system that utilizes GPS to more line
segments in order to improve the safety of personnel who perform mainte-
nance work.
With respect to service quality, the Group promoted measures aimed at
becoming “No. 1 for customer satisfaction in the Japanese railway industry”
based on the “Medium-term Vision for Service Quality Reforms 2017.” For the
expansion of the direct service network, JR East took measures to improve
the quality of transportation by expanding contingency shuttle operations
when transportation services are disrupted. In addition, the Company
increased the line segments for which the JR EAST APP provides train position
information, and the number of app downloads reached approximately 2.46
million on a cumulative basis as of March 31, 2017. JR East made efforts
jointly with other companies to eliminate areas in tunnels where mobile phone
connection is poor and established environments that enable usage between
Takasaki and Annakaharuna on the Hokuriku Shinkansen Line, between
Iwate-Numakunai and (before) Ninohe on the Tohoku Shinkansen Line,
between Takasaki and (before) Jomo-Kogen Station on the Joetsu
Shinkansen Line, between Tokyo and Shinagawa on the Yokosuka Line, and
between Tokyo and Shiomi on the Keiyo Line. Further, the Company imple-
mented a Let’s Stop Viewing Smartphones while Walking campaign together
with other railway operators and other organizations from across Japan for
the first time. In regard to the assistance campaign in which personnel ask
nearby customers whether they require assistance, the Company com-
menced new collaborative initiatives with other railway operators in the Tokyo
metropolitan area.
With respect to transportation, JR East revised timetables in March 2017 to
increase the frequency of Hayabusa services between Tokyo and Sendai on
the Tohoku Shinkansen Line as well as to increase the frequency of and add
railcars to Narita Express services, which many visitors to Japan use. In addi-
tion, as part of efforts to increase the convenience of the “Tokyo Megaloop,”
JR East increased the frequency of services on the Keiyo Line.
With respect to marketing and sales activities, the Company conducted
such campaigns as the Ikuze, Tohoku. SPECIAL Fuyu no Gohobi Campaign
and the Japanese Beauty Hokuriku Campaign to increase inter-regional railway
travel. Further, JR East began operating an art-cafe Shinkansen, the GENBI
SHINKANSEN, between Echigo-Yuzawa and Niigata in April 2016 and collabo-
rated with IZUKYU CORPORATION to commence operations of the resort
train IZU CRAILE between Odawara and Izukyu-Shimoda in July 2016. In
relation to the JR East Dynamic Rail Pack, a travel product that allows a cus-
tomer to purchase a combined train–accommodation product based on his
or her choice, in November 2016 the Company launched the new Dynamic
TYO brand with the aim of increasing the flow of tourists to the Tokyo metro-
politan area from the Tohoku and Shinetsu regions. In addition, from
December 2016 JR East made it possible to receive tickets for all areas of
Hokkaido through eki-net, which is an Internet service for applying for JR tickets.
Management’s Discussion and Analysis of Financial Condition and Results of Operations
74 East Japan Railway Company
In Suica operations, in October 2016 JR East introduced compatibility
with Apple Inc.’s Apple Pay payment service, enabling usage of the service
through iPhone 7 and other terminals. The number of Suica cards issued and
outstanding was approximately 63.98 million as of March 31, 2017. Also, the
Company proceeded with preparations for an increase from April 2017 in the
number of railway stations on the Shinonoi Line, the Chuo Main Line, and the
Banetsu West Line in which Suica is usable.
As a result of these initiatives, JR East’s number of passengers for railway
operations exceeded that of the previous fiscal year, and operating revenues
in the Transportation segment increased 0.2% year on year, to ¥2,013.0 billion
($17,973 million). However, due to an increase in operating expenses, mainly
arising from the recognition of a provision for large-scale renovation of
Shinkansen infrastructure, operating income decreased 6.4% year on year,
to ¥326.4 billion ($2,914 million).
To restore line segments on the Pacific coast severely damaged by the
Great East Japan Earthquake, JR East worked in consultation with the
national government and relevant local authorities as the Company moved
forward with collaborative initiatives for rebuilding the area as a whole. JR East
proceeded with restoration work on the line segment between Miyako and
Kamaishi on the Yamada Line to integrate operation of the line segment with
that of the North and South Rias Lines by Sanriku Railway Company. Further,
with respect to the Bus Rapid Transit (“BRT”) systems on the Kesennuma Line
and the Ofunato Line, the Company improved services and other aspects of
operations. In addition, JR East resumed operations between Soma and
Hamayoshida on the Joban Line in December 2016.
JR East’s policy for areas within a 20-kilometer radius of the Fukushima
Daiichi Nuclear Power Station is to prepare to resume operations in the areas
designated as “areas to which evacuation orders are ready to be lifted,”
through the cooperation of the national government and local authorities that
are working to decontaminate line-side areas and return residents to their
homes. Based on this policy, JR East resumed operations between Odaka
and Haranomachi on the Joban Line in July 2016 and conducted restoration
work and took other measures with a view to resuming operations between
Namie and Odaka by April 2017 and between Tatsuta and Tomioka by
approximately October 2017. In the areas designated as “areas where it is
expected that the residents will have difficulties in returning for a long time,”
the Company aims to open lines after the restoration of damaged facilities,
the completion of decontamination work required for opening lines, and the
implementation of measures to ensure the safety of users in emergencies,
with the support and cooperation of the national government and local
authorities. JR East proceeded with restoration work with a view to resuming
operations between Tomioka and Namie on the Joban Line by March 31, 2020.
SHINKANSEN NETWORK
In the Shinkansen network, passenger kilometers increased 1.4% year on
year, to 23.2 billion, mainly due to the opening of the Hokkaido Shinkansen
Line and an increase in visitors to Japan among passengers. Revenues from
passenger tickets increased 1.1% year on year, to ¥584.4 billion ($5,218
million). Included in this figure, Shinkansen commuter pass revenues
increased 1.1% year on year, to ¥23.9 billion ($213 million), and non-com-
muter pass revenues rose 1.1%, to ¥560.5 billion ($5,004 million).
CONVENTIONAL LINES (KANTO AREA NETWORK)
For conventional lines in the Kanto area network, passenger kilometers
increased 0.4% year on year, to 106.3 billion. Revenues from passenger
tickets increased 0.6%, to ¥1,163.1 billion ($10,385 million). Included in this
figure, commuter pass revenues increased 0.8%, to ¥456.1 billion ($4,072
million), while non-commuter pass revenues increased 0.4%, to ¥707.0 billion
($6,313 million).
CONVENTIONAL LINES (OTHER NETWORK)
In the conventional lines other than the Kanto area network, passenger kilo-
meters decreased 1.7% year on year, to 5.6 billion. Revenues from passenger
tickets decreased 2.5%, to ¥68.8 billion ($614 million). Included in this figure,
commuter pass revenues were approximately unchanged at ¥18.5 billion
($165 million), while non-commuter pass revenues decreased 3.4%, to ¥50.3
billion ($449 million).
STATION SPACE UTILIZATION
In the Station Space Utilization segment, JR East opened phase 2 of
NEWoMan (Tokyo) at the JR Shinjuku Station New South Exit in April 2016.
Following the July 2016 openings of phase 1 of GranSta Marunouchi (Tokyo)
and a new area of GranSta (Tokyo), which are in the Marunouchi underground
area of Tokyo Station, JR East proceeded with preparations to open phase 2
of both areas in April 2017. Further, in November 2016 JR East opened the
renovated Ekibenya Matsuri GranSta (Tokyo), which features a menu boasting
an assortment of local tastes from across Japan. In addition, JR East opened
PERIE CHIBA EKINAKA (IN-STATION) (3rd floor) (Chiba) in November 2016 in
accordance with a plan to rebuild Chiba Station and its buildings. JR East
continued introducing stores with new designs for NewDays (convenience
stores) and introducing NewDays KIOSK, a new type of KIOSK store.
As a result of these initiatives, as well as favorable sales at stores in Sendai
Station and other stations, operating revenues of the Station Space Utilization
segment increased 0.3%, to ¥417.1 billion ($3,724 million). Operating income
decreased 6.0%, to ¥33.0 billion ($294 million), due to the impacts of factors
including store closures due to obstruction caused by work.
SHOPPING CENTERS & OFFICE BUILDINGS
In the Shopping Centers & Office Buildings segment, JR East expanded in
stages the common Groupwide service JRE POINT to a total of 71 station
buildings and other facilities. For example, JR East made this service usable
at S-PAL Sendai (Miyagi) and FES’AN (Iwate). In addition, JR East opened
nonowa Kunitachi WEST (Tokyo) in April 2016 and nonowa Musashisakai EAST
(Tokyo) in June 2016 in order to increase the value of the Chuo Line. Further,
JR East opened atré Ebisu West Building (Tokyo) in April 2016, JEBL Akihabara
Square (Tokyo) in September 2016, and LUSCA Atami (Shizuoka) in
November 2016. In addition, JR East proceeded with the construction of JR
Saitama-Shintoshin Building (Saitama), which opened fully in June 2017;
phase 1 of the Shibuya Station Area Development Plan (East Building), which
is scheduled for completion in the fiscal year ending March 31, 2020; and the
Yokohama Station West Exit Station Building (provisional name), which is
scheduled for completion in 2020.
75Annual Report 2017
FACTS & FIGURES
Management’s Discussion and Analysis of Financial Condition and Results of Operations
As a result of these initiatives, as well as factors including the earnings
contributions from the opening of JR SHINJUKU MIRAINA TOWER (Tokyo),
phase 1 of NEWoMan (Tokyo), and S-PAL Sendai East Building (Miyagi),
operating revenues of the Shopping Centers & Office Buildings segment
increased 4.8%, to ¥280.6 billion ($2,505 million). Similarly, operating income
increased 4.8%, to ¥75.0 billion ($670 million).
OTHERS
In hotel operations, to increase the competitiveness of existing hotels JR East
opened and renovated HOTEL METS Shibuya (Tokyo) and HOTEL METS
Kitakami (Iwate). In addition, JR East proceeded with construction work
on Hotel Metropolitan Sendai East (Miyagi), Hotel Metropolitan Saitama-
Shintoshin (Saitama), and Hotel Dream Gate Maihama Annex (provisional name).
In advertising and publicity services, JR East made efforts to promote
advertising sales for 11 Tokyo Metropolitan Area Railway Operators Nakazuri
(Hanging Posters) Dream Network Set, which enables the simultaneous
posting of advertisements that hang inside railcars on all target lines, includ-
ing those of other railway operators.
In credit card operations, JR East installed cash dispensers exclusively for
credit cards issued overseas at eight railway stations in the Tokyo metropoli-
tan area, including Shinjuku Station and Ueno Station.
In Suica shopping services (electronic money), JR East began providing
downloads of the Suica Point App in July 2016 to enhance the convenience
of the Suica Point Club service. JR East continued to develop the network of
participating stores and business establishments actively through efforts that
included introduction of Suica electronic money to chain stores with wide
operating areas. As a result of these measures, Suica electronic money was
usable at approximately 380,000 stores as of March 31, 2017. Further, JR East
proceeded with preparations to unify Suica Point with JRE POINT.
In other initiatives, as part of the HAPPY CHILD PROJECT, the Group
opened COTONIOR Nishi-Funabashi (Chiba) and COTONIOR Kunitachi (Tokyo),
both of which are multi-purpose child-rearing support and senior citizen care
facilities. In addition, the Group proceeded with the development of child-
rearing support facilities inside station buildings and other buildings, giving it
a total of 96 facilities as of March 31, 2017. Further, the Group announced that
it aims to establish 130 child-rearing support facilities by April 2020.
As a result of these initiatives, as well as higher revenues from advertising
and publicity services and credit card operations, operating revenues from
Others increased 0.4% year on year, to ¥636.7 billion ($5,685 million).
Operating income, meanwhile, decreased 0.1% year on year, to ¥35.0 billion
($312 million), following the rebound from system and work sales related
to the Hokkaido Shinkansen Line recorded in the previous fiscal year.
Notes: 1. The Group applies the Accounting Standard for Disclosures about Segments of an Enterprise and Related Information (Accounting Standards Board of Japan (ASBJ) Statement No. 17, June 30, 2010) and the Guidance on Accounting Standard for Disclosures about Segments of an Enterprise and Related Information (ASBJ Guidance No. 20, March 21, 2008). The operating income of each segment of the Group cor-responds to the segment income under the above Accounting Standard and Guidance.
2. The names “Apple Pay” and “iPhone” are registered trademarks of Apple Inc.
Operating Income
Operating expenses increased 1.5% year on year, to ¥2,414.5 billion ($21,558
million). Operating expenses as a percentage of operating revenues were
83.8%, compared with 83.0% in the previous fiscal year.
Transportation, other services and cost of sales increased 0.6%, to
¥1,852.2 billion ($16,538 million), because of an increase in cost of equipment.
Selling, general and administrative expenses increased 4.4%, to ¥562.3
billion ($5,020 million), which was due to an increase in cost of equipment.
Operating income declined 4.4%, to ¥466.3 billion ($4,163 million).
Operating income as a percentage of operating revenues was 16.2%, com-
pared with 17.0% in the previous fiscal year.
Income before Income TaxesOther income increased 28.6%, to ¥75.0 billion ($670 million), due mainly to
an increase in gain on sales of fixed assets.
Other expenses decreased 15.0%, to ¥137.0 billion ($1,223 million),
mainly as a result of a decrease in provision for allowance for earthquake-
damage losses.
Interest and dividend income and other financial income, net of interest
and other financial expenses, amounted to a ¥66.3 billion ($592 million)
expense, which was 8.4% lower than the expense recorded in the previous
fiscal year.
Income before income taxes increased 5.0%, to ¥404.3 billion ($3,610
million). Income before income taxes as a percentage of operating revenues
was 14.0%, compared with 13.4% in the previous fiscal year.
Profit Attributable to Owners of ParentProfit attributable to owners of parent increased 13.3%, to ¥277.9 billion
($2,481 million), mainly due to higher income before income taxes. Moreover,
profit attributable to owners of parent increased for the second consecutive
year to reach a new record high. Earnings per share were ¥714 ($6), up from
¥626 per share. Further, profit attributable to owners of parent as a percent-
age of operating revenues was 9.6%, compared with 8.6% in the previous
fiscal year.
Liquidity and Capital ResourcesCash FlowsIn fiscal 2017, net cash provided by operating activities totaled ¥652.9 billion
($5,830 million), ¥20.2 billion less than in the previous fiscal year. This result
was mainly due to an increase in payments of income taxes.
Net cash used in investing activities amounted to ¥557.5 billion ($4,978
million), ¥58.0 billion more than in the previous fiscal year. This result was
mainly due to higher payments for purchases of fixed assets.
Capital expenditures were as follows.
In transportation operations, JR East implemented capital expenditures to
further measures for ensuring transportation safety and reliability, institute
countermeasures for large-scale earthquakes, install automatic platform
gates, and produce new trains. In station space utilization operations, JR East
opened new stores and conducted renovation work at existing stores. These
efforts included GranSta Marunouchi (Tokyo) and a new area of GranSta
(Tokyo) in the Marunouchi underground area of Tokyo Station and PERIE
CHIBA EKINAKA (IN-STATION) (3rd floor) (Chiba). In shopping centers and
76 East Japan Railway Company

office buildings operations, capital expenditures included those for LUSCA
Atami (Shizuoka), nonowa Kunitachi WEST (Tokyo), and JEBL Akihabara
Square (Tokyo). In the Others segment, capital expenditures included those
for the new construction of a wind-power generation facility as well as the
renovation of existing hotels.
Further, free cash flows decreased ¥78.2 billion, to a positive ¥95.4 billion
($852 million).
Net cash used in financing activities came to ¥116.3 billion ($1,038 mil-
lion), ¥6.0 billion more than in the previous fiscal year. This result was mainly
due to an increase in payments of acquisition of treasury stock.
Consequently, cash and cash equivalents as of March 31, 2017, were
¥287.1 billion ($2,564 million), a decrease of ¥20.7 billion from ¥307.8 billion
on March 31, 2016.
Financial PolicyInterest-bearing debt at March 31, 2017, stood at ¥3,211.1 billion
($28,670 million).
Long-term liabilities incurred for purchase of railway facilities associated
with JR East’s assumption of Shinkansen railway facilities stood at ¥333.9
billion ($2,981 million), payable at a fixed annual interest rate of 6.55% through
September 30, 2051. These liabilities are paid in equal semi-annual install-
ments, consisting of principal and interest payments.
In addition, at the fiscal year-end JR East had long-term liabilities incurred
for purchase of railway facilities of ¥5.6 billion ($50 million) for the Akita hybrid
Shinkansen facilities and ¥1.5 billion ($13 million) for Tokyo Monorail Co., Ltd.
JR East operates a cash management system that integrates the manage-
ment of the surplus funds and the fund-raising of companies participating in
the cash management system, with the aim of reducing the Company’s total
interest-bearing debt. Also, JR East employs such capital management
methods as the offsetting of internal settlements among subsidiaries and the
operation of a payment agency system that consolidates payment operations
within the Group.
In fiscal 2017, JR East issued eight unsecured straight bonds in Japan,
with a total nominal amount of ¥110.0 billion ($982 million) and maturities from
2026 through 2057. Rating and Investment Information, Inc. (R&I), a Japanese
rating agency, rated these bonds AA+. Further, JR East received long-term
debt ratings from S&P Global Ratings Japan Inc. and Moody’s Japan K.K. of
AA– and Aa3, respectively.
In order to respond to short-term financing requirements, JR East has
bank overdraft facilities with its principal banks totaling ¥330.0 billion ($2,946
million). R&I and Moody’s rated JR East’s commercial paper a-1+ and P-1,
respectively, as of the end of fiscal 2017. As of March 31, 2017, the Company
did not have any outstanding balance of commercial paper issued by JR East
and did not have any bank overdrafts.
In April 2015, JR East established a committed bank credit line (a financing
framework that permits unrestricted borrowing within contract limits based on
certain conditions) with an amount of ¥60.0 billion ($536 million).
77Annual Report 2017

FACTS & FIGURES
Operational and Other Risk Information
The following are issues related to the operational and accounting
procedures that may have a significant bearing on the decisions of investors.
Forward-looking statements in the following section are based on the
assessments of the JR East Group as of March 31, 2017.
Legal Issues Relating to OperationsAs a railway operator, JR East manages its railway operations pursuant to the
stipulations of the Railway Business Act. JR East is generally excluded from
the provisions of the Act on Passenger Railway Companies and Japan Freight
Railway Company (hereinafter the “JR Law”). However, JR East is required to
manage its railway operations in accordance with guidelines relating to mat-
ters that should be considered for the foreseeable future, which are stipulated
in a supplementary provision of a partial amendment of the JR Law (hereinaf-
ter the “amended JR Law”). Details of relevant laws are as follows.
Railway Business Act (Act No. 92 of 1986)Under the Railway Business Act, railway operators are required to obtain the
permission of the Minister of Land, Infrastructure, Transport and Tourism
(hereinafter the “Minister”) for each type of line and railway business operated
(Article 3). Operators receive approval from the Minister for the upper limit of
passenger fares and Shinkansen limited express surcharges (hereinafter
“fares and surcharges”). Subject to prior notification, railway operators can
then set or change fares and surcharges within those upper limits (Article 16).
Operators are also required to give the Minister advance notice of the elimina-
tion or suspension of railway operations. In the case of eliminating operations,
the notice must be given at least one year in advance (Article 28, paragraphs
1 and 2).
JR Law (Act No. 88 of 1986)AIM OF THE ESTABLISHMENT OF THE JR LAW
Prior to its amendment, the JR Law regulated the investments and the estab-
lishment of JR East, Hokkaido Railway Company (JR Hokkaido), Central
Japan Railway Company (JR Central), West Japan Railway Company (JR
West), Shikoku Railway Company (JR Shikoku), Kyushu Railway Company
(JR Kyushu), and Japan Freight Railway Company (JR Freight) and included
provisions on the operational purposes and scopes of those companies
(hereinafter the “JR Companies”). In addition to the provisions of the Railway
Business Act, the JR Companies are subject to provisions of the JR Law that
require the approval of the Minister with respect to significant management
decisions. Also, under the JR Law preferential measures were applied to
the JR Companies, such as those entitling holders of the bonds of the JR
Companies to preferential rights over the claims of unsecured creditors
(general mortgage).
AMENDED JR LAW
(a) The amended JR Law enacted on December 1, 2001 (Act No. 61 of 2001),
excluded JR East, JR Central, and JR West (the three JR passenger
railway companies operating on Japan’s main island of Honshu, hereinaf-
ter the “three JR Honshu Companies”) from the provisions of the JR Law
that had been applicable to them until then.
(b) Further, the amended JR Law enables the Minister to issue guidelines
relating to matters that should be considered for the foreseeable future
with respect to the management of the railway operations of the new
companies, including any additional companies that may become
involved in the management of all or a part of those railway operations as
a result of assignations, mergers, divisions, or successions as designated
by the Minister on or after the date of enactment of the amended JR Law
(supplementary provision, Article 2, paragraph 1). Those guidelines were
issued on November 7, 2001, and applied on December 1, 2001.
(c) The guidelines stipulate items relating to the following three areas:
• Items relating to ensuring alliances and cooperation among companies
(among the new companies or among the new companies and JR
Companies) with respect to the establishment of appropriate passenger
fares and surcharges, the unhindered utilization of railway facilities, and
other factors relating to railway operations.
• Items relating to the appropriate maintenance of railway routes currently
in operation reflecting trends in transportation demand and other
changes in circumstances following the restructuring of Japanese
National Railways (JNR) and items relating to ensuring the convenience
of users through the development of stations and other railway facilities.
• Items stating that the new companies should give consideration to the
avoidance of actions that inappropriately obstruct business activities or
infringe upon the interests of small and medium-sized companies
operating businesses within the operational areas of the new compa-
nies that are similar to the businesses of the new companies.
(d) The Minister may advise and issue instructions to the new companies to
secure operations that are in accordance with those guidelines (supple-
mentary provision, Article 3). Moreover, the amended JR Law enables the
Minister to issue warnings and directives in the event that operational
management runs counter to the guidelines without any justifiable reason
(supplementary provision, Article 4).
(e) With respect to the provisions of those guidelines, JR East has always
given, and of course will continue to give, adequate consideration to such
items in the management of its railway operations. Therefore, JR East
does not anticipate that those provisions will have a significant impact on
its management.
(f) In addition, the amended JR Law includes required transitional measures,
such as the stipulation that all bonds issued by the three JR Honshu
Companies prior to the amended JR Law’s enactment date are and will
continue to be general mortgage bonds as determined in Article 4 of the
JR Law (supplementary provision, Article 7).
78 East Japan Railway Company
Establishment of and Changes to Fares and SurchargesThe required procedures when JR East sets or changes fares and surcharges
for its railway operations are stipulated in the Railway Business Act. Changes to
those procedures or the inability to flexibly change fares and surcharges based
on those procedures for whatever reason could affect JR East’s earnings.
Currently, fares and surcharges for passengers and freight spanning the
use of two or more JR companies are allowed to be added cumulatively
based on agreements among the JR companies, with fares adjusted accord-
ing to the tapering distance rate. This measure was intended to ensure user
convenience, etc., when implementing the JNR reforms, and does not prevent
the JR Companies from independently setting fares.
JR East’s Stance(a) JR East has not raised fares since its establishment in April 1987, other
than to reflect the consumption tax introduction (April 1989) and subse-
quent revisions (April 1997 and April 2014).
Through efficient business operation realized by securing revenues and
reducing expenses, JR East has worked to create a management base
that is not dependent on raising fares. However, if JR East was unable to
secure appropriate profit levels as a result of such factors as changes in
the operating environment, it would view the timely implementation of fare
revisions as necessary to secure appropriate profit levels.
(b) With the efficient management of operations as a precondition, JR East
believes securing a profit level that enables capital expenditures for the
future and the strengthening of its financial condition—in addition to the
distribution of profits to shareholders—to be essential.
(c) JR East primarily undertakes capital expenditures, which has a significant
impact on the capital usage of railway operations, with a view to establish-
ing a robust management base through ensuring safe and reliable trans-
portation, offering high-quality services, and implementing other
measures. Further, JR East appreciates the need to proactively conduct
capital expenditures while clearly defining the responsibilities of manage-
ment in business operation.
Stance of the Ministry of Land, Infrastructure, Transport and Tourism (hereinafter the “MLIT”)With respect to the implementation of fare revisions by JR East, the position of
the MLIT is as follows.
(a) The Minister will approve applications for the revision of the upper limits of
fares from railway operators, including from JR East, upon conducting
inspections to determine that the fares do not exceed the sum of reason-
able costs and reasonable profits that can be expected to be incurred
through the efficient management of those companies (hereinafter “total
cost”) (Railway Business Act, Article 16, paragraph 2).
In addition, a three-year period is stipulated for the calculation of costs.
(b) Even if the railway operator has non-railway businesses, the calculation
of total cost—which comprises reasonable costs and reasonable profits,
including required dividend payments to shareholders—is based only on
the operator’s railway operations.
Further, operators are required to submit their capital expenditure plans
for increasing transportation services to ease crowding of commuter
services and for other improvements in passenger services. The capital
usage necessary for such enhancements is recognized in the calculation
of total cost.
(c) Total cost is calculated using a “rate base method” that estimates the
capital cost (interest payments, dividend payments, and other financial
costs) arising from the provision of a fair and appropriate return, based on
the opportunity cost concept, in relation to the capital invested in the said
railway operations. The calculation of total cost is as follows:
• Total cost = operating cost*1 + operational return
• Operational return = assets utilized in railway business operations (rate
base) × operational return rate
• Assets utilized in railway business operations = railway business
operations fixed assets + construction in progress + deferred assets
+ working capital*2
• Operational return rate = equity ratio*3 × return rate on equity*4 +
borrowed capital ratio*3 x return rate on borrowed capital*4
*1 With respect to comparable costs among railway operators, in order to promote enhanced management efficiency, a “yardstick formula” is used to encourage indirect competition among respective operators. The results of those comparisons are released at the end of every fiscal year and form the basis for the calculation of costs.
*2 Working capital = operating costs and certain inventories*3 Equity ratio = 30%, Borrowed capital ratio = 70%.*4 Return rate on equity is based on the average of yields on public and corporate bonds and
the overall industrial average return on equity and dividend yield ratio. Return rate on bor-rowed capital is based on the average actual rate on loans and other liabilities.
(d) Subject to the prior notification of the Minister, railway operators can set or
change fares and surcharges within the upper limits approved along with
other charges. However, the Minister can issue directives requiring
changes in fares and surcharges by specified terms if the fares and
surcharges submitted are deemed to fall within the following categories
(Railway Business Act, Article 16, paragraph 5):
• The changes would lead to unjustifiable discrimination in the treatment
of certain passengers.
• There is concern that the changes would give rise to unfair competition
with other railway transportation operators.
79Annual Report 2017

FACTS & FIGURES
Operational and Other Risk Information
Plan for the Development of New Shinkansen LinesNew Shinkansen Line Segment OpeningsFollowing the division and privatization of JNR, JR East was selected as the
operator of the Takasaki–Joetsu segment of the Hokuriku Shinkansen Line
and the Morioka–Aomori segment of the Tohoku Shinkansen Line. JR East
started operation of the Hokuriku Shinkansen Line between Takasaki and
Nagano on October 1, 1997; the Tohoku Shinkansen Line between Morioka
and Hachinohe on December 1, 2002, and between Hachinohe and Shin-
Aomori on December 4, 2010; and then on the Hokuriku Shinkansen Line
between Nagano and Joetsumyoko on March 14, 2015.
Usage Fees for New Shinkansen Lines(a) In October 1997, the opening of the Takasaki–Nagano segment of the
Hokuriku Shinkansen Line was accompanied by new standards for the
amount of usage fees paid by the JR Companies as the operator of the
line. Those usage fees are now regulated under the Japan Railway
Construction, Transport and Technology Agency Law (enforcement
ordinance, Article 6).
(b) That enforcement ordinance stipulates that the Japan Railway Construction,
Transport and Technology Agency (hereinafter the “JRTT”) will determine
the amount of usage fees based on the benefit received as the operator
of the said Shinkansen line after opening and the sum of taxes and main-
tenance fees paid by the JRTT for railway facilities leased. Of those, the
expected benefits are calculated based on expected demand and rev-
enues and expenses over a 30-year period after opening. Further, a part
of the usage fees, which are calculated based on the expected benefits,
is fixed for the 30-year period after commencing services.
Note:The amount to be paid on top of the usage fee amount for the Hachinohe–Shin-Aomori segment of the Tohoku Shinkansen Line, which has been on loan from the JRTT since December 2010, as a result of the March 2016 opening of the Shin-Aomori–Shin-Hakodate Hokuto segment of the Hokkaido Shinkansen Line will be fixed for the 25-year period leading up to 2040.
(c) Compared with periods when there is no construction of new Shinkansen
lines, costs related to new Shinkansen lines, such as depreciation of railcars
and other costs, can have an impact on JR East’s single-year revenues and
expenses in the initial period after opening. However, given the nature of
usage fees mentioned in (b) above, JR East believes that such factors will not
have an impact on revenues and expenses over the 30-year period following
the opening.
End of Loan PeriodThe treatment of railway facilities along the Takasaki–Joetsumyoko segment
of the Hokuriku Shinkansen Line and the Morioka–Shin-Aomori segment of
the Tohoku Shinkansen Line will be discussed and re-determined 30 years
after the commence date of the loaning. The new Shinkansen line segments
on loan from the JRTT and the end years of their loan periods are as follows.
(a) Takasaki–Nagano segment of the Hokuriku Shinkansen Line; 2027
(b) Nagano–Joetsumyoko segment of the Hokuriku Shinkansen Line; 2044
(c) Morioka–Hachinohe segment of the Tohoku Shinkansen Line; 2032
(d) Hachinohe–Shin-Aomori segment of the Hokkaido Shinkansen Line; 2040
Safety MeasuresRailway operations can potentially suffer significant damage resulting from
accidents due to natural disasters, human error, crime, or terrorism; accidents
at nuclear power plants; the large-scale spread of infectious diseases; or
other factors.
The JR East Group regards ensuring safety as a top management priority.
Accordingly, JR East is taking measures to build a railway with high safety
levels by addressing infrastructural and operational issues, and is steadily
advancing the measures described in the sixth five-year safety plan, “JR East
Group Safety Plan 2018.”
Specifically, JR East implemented seismic reinforcement in preparation
for a major earthquake, such as a possible earthquake directly beneath the
Tokyo metropolitan area. JR East earmarked a total of ¥300.0 billion for invest-
ment in such measures for a five-year intensive implementation period ended
March 31, 2017. Approximately 80% of the work that is currently planned was
completed by the end of the fiscial year review. Further, JR East proceeded
with the installation of automatic platform gates based on a policy of introduc-
ing them to all railway stations on the Yamanote Line and to all railway stations
on the line segment between Omiya Station and Sakuragicho Station on the
Keihin-Tohoku and Negishi lines. Accordingly, the use of automatic platform
gates began at Shinagawa Station on the Yamanote Line and at Akabane
Station on the Keihin-Tohoku Line. In addition, JR East prepared for the intro-
duction of automatic platform gates at such railway stations as Sendagaya
Station and Shinanomachi Station on the Chuo Line and Shin-Koiwa Station
on the Sobu Line Rapid Service. As measures for preventing railway crossing
accidents, JR East continued eliminating and consolidating railway crossings,
installing alarms and crossing gates, and increasing the number of obstruc-
tion warning devices and obstacle detection devices for railway crossings. In
addition, to improve the safety of personnel that perform maintenance work,
JR East expanded the range of lines on which it will introduce the train
approach alarm system that utilizes GPS.
Information Systems and Protection of Personal DataThe JR East Group currently uses many information systems in its various
railway, life-style service, and IT & Suica businesses. Further, information
systems play an important role for travel agencies as well as Railway
Information Systems Co., Ltd., and other companies with which the JR East
Group has close business relationships. If the functions of those information
systems were seriously damaged as a result of natural disasters or human
error, this could have an impact on the operations of JR East. Moreover, in the
event that personal data stored in those information systems was leaked to
unrelated third parties or altered due to information systems becoming
infected by viruses or unauthorized manipulation, it could affect JR East’s
financial condition and business performance.
80 East Japan Railway Company

The JR East Group takes measures to prevent damage and ensure secu-
rity, such as continuously upgrading the functions of in-house systems and
training related personnel. In the unlikely event of a system problem, JR East
would minimize the impact by taking measures through an initial action frame-
work that would be promptly set up and coordinated across operational
divisions. Further, JR East is doing its utmost to ensure the strict management
and protection of personal data through the establishment of in-house regula-
tions that include stipulations for the appropriate treatment of personal data,
restricted authorization for access to personal data, control of access author-
ity, and the construction of a system of in-house checks.
Development of the Life-Style Service BusinessThe JR East Group has positioned the life-style service business as a central
pillar of management. In the life-style service business, JR East is developing
station space utilization, shopping centers and office buildings, and other
operations (hotel operations, advertising and publicity, and other services).
In the life-style service business, JR East faces the risk of a downturn in
consumption associated with an economic recession or unseasonable
weather, which could lead to lower revenues from its shopping centers, office
buildings, restaurants, and stores in railway stations, hotels, and other opera-
tions. Such eventualities could also adversely affect sales of advertisement
services and cause an increase in demands from tenants for rent reductions.
Further, a defect in manufactured products or sold products, such as an
outbreak of food poisoning or a similar incident, could reduce sales, damage
trust in the JR East Group, or result in the bankruptcy of tenants or business
partners. The occurrence of any of those contingencies could have an impact
on the JR East Group’s financial condition and business performance. The JR
East Group will fully leverage its railway stations as its largest management
resource to develop operations. At the same time, the JR East Group will
enhance earnings and secure customer trust by implementing stringent
management of hygiene and information on its business partners.
CompetitionThe JR East Group’s railway business competes with transportation sources
including airlines, automobiles, buses, and other railway companies. Further,
the JR East Group’s life-style service business competes with existing and
newly established businesses. The competition of the JR East Group’s railway
and life-style service businesses with such rivals could have an impact on the
JR East Group’s financial condition and business performance.
Intensified competition in the transportation market could adversely affect
earnings from JR East’s railway business. Such competition includes the
expansion of low-cost carrier (LCC) routes, toll discounts and other sales
promotion measures on expressways, and the advancement of large-scale
upgrading works by other railway operators in the Tokyo metropolitan area.
Also, developments such as the new entry of other companies into markets
or the renovation or reopening of existing commercial facilities could result in
increased competition, and thereby adversely affect earnings from JR East’s
life-style service business.
Reduction of Total Interest-Bearing DebtOn March 31, 2017, total interest-bearing debt stood at ¥3,211.0 billion
($28,670 million). In addition, interest expense in fiscal 2017 amounted to
¥70.2 billion ($627 million), which was equivalent to 15.1% of operating income.
JR East will continue to reduce interest-bearing debt and refinance to
obtain lower interest rates. However, a reduction in free cash flows due to
unforeseen circumstances or a change in borrowing rates due to fluctuation
in interest rates could affect JR East’s financial condition and business
performance.
ComplianceThe JR East Group conducts operations in a variety of areas, including the
railway, life-style service, and IT & Suica businesses. These operations are
advanced in a manner pursuant to the stipulations of related statutory laws
and regulations, such as the Railway Business Act, and in adherence to
corporate ethics. However, becoming subject to administrative measures or
losing public confidence due to a breach of those statutory laws and regula-
tions or corporate ethics could affect the JR East Group’s financial condition
and business performance.
The JR East Group, in addition to establishing the Legal Compliance and
Corporate Ethics Guidelines, works to ensure legal compliance through such
initiatives as enhancing employee education about legal compliance and
checking the status of compliance with statutory laws and regulations that
relate to all the areas of its operations.
81Annual Report 2017

FACTS & FIGURES
Consolidated Balance SheetsEast Japan Railway Company and SubsidiariesMarch 31, 2016 and 2017
Millions of Yen
Millions ofU.S. Dollars(Note 2 (1))
2016 2017 2017
Assets
Current Assets:
Cash and cash equivalents (Notes 5 and 9) ¥ 307,809 ¥ 287,126 $ 2,564 Receivables (Note 9):
Accounts receivable–trade 467,734 479,729 4,283 Unconsolidated subsidiaries and affiliated companies 10,665 10,370 93 Other 5,962 4,938 44 Allowance for doubtful accounts (Note 2 (4)) (1,573) (1,486) (13)
482,788 493,551 4,407 Inventories (Notes 2 (5) and 6) 47,835 50,862 454 Real estate for sale (Notes 2 (6) and 7) 904 500 4 Deferred tax assets (Note 21) 49,188 43,025 384 Other current assets 45,995 40,561 362
Total current assets 934,519 915,625 8,175
Investments:
Unconsolidated subsidiaries and affiliated companies (Notes 2 (2), (3) and 8) 53,529 57,324 512 Other (Notes 2 (7), 9 and 10) 160,574 208,679 1,863
214,103 266,003 2,375
Property, Plant and Equipment (Notes 2 (8), 11, 12 and 22):
Buildings 2,519,190 2,611,797 23,320 Fixtures 5,798,964 5,955,928 53,178 Machinery, rolling stock and vehicles 2,721,599 2,768,599 24,720 Land 2,002,530 2,013,900 17,981 Construction in progress 306,398 286,275 2,556 Other 236,498 246,065 2,196
13,585,179 13,882,564 123,951 Less accumulated depreciation 7,351,637 7,539,804 67,319
Net property, plant and equipment 6,233,542 6,342,760 56,632
Other Assets:
Long-term deferred tax assets (Note 21) 217,256 204,594 1,827 Other 190,342 182,133 1,626
407,598 386,727 3,453 ¥ 7,789,762 ¥ 7,911,115 $ 70,635
See accompanying notes.
82 East Japan Railway Company

Millions of Yen
Millions ofU.S. Dollars(Note 2 (1))
2016 2017 2017
Liabilities and Net Assets
Current Liabilities:Current portion of long-term debt (Notes 9, 11 and 13) ¥ 187,107 ¥ 276,731 $ 2,471 Current portion of long-term liabilities incurred for purchase of railway facilities (Notes 9, 11 and 14) 97,251 4,290 38 Prepaid railway fares received 102,494 99,217 886 Payables (Note 9):
Accounts payable–trade 46,375 44,825 400 Unconsolidated subsidiaries and affiliated companies 99,192 105,361 941 Other 611,977 568,280 5,074
757,544 718,466 6,415 Accrued expenses 110,373 109,904 981 Accrued consumption taxes (Notes 9 and 15) 23,956 19,513 174 Accrued income taxes (Notes 2 (14), 9 and 21) 83,239 55,639 497 Other current liabilities 42,996 53,631 479
Total current liabilities 1,404,960 1,337,391 11,941
Long-Term Debt (Notes 9, 11 and 13) 2,638,337 2,609,616 23,300 Long-Term Liabilities Incurred for Purchase of Railway Facilities (Notes 9, 11 and 14) 341,075 336,679 3,006 Net Defined Benefit Liability (Notes 2 (9) and 20) 675,784 641,394 5,727 Deposits Received for Guarantees 135,091 139,764 1,248 Long-Term Deferred Tax Liabilities (Note 21) 3,361 3,190 28
Allowance for partial transfer costs of railway operation (Note 2 (10)) 19,087 16,164 144 Provision for large-scale renovation of Shinkansen infrastructure (Note 2 (11)) — 24,000 214
Other Long-Term Liabilities 109,530 127,564 1,140
Contingent Liabilities (Note 16)
Net Assets (Note 17):
Common stock:
Authorized 1,600,000,000 shares;
Issued, 2017—389,407,900 shares;
Outstanding, 2017—388,750,243 shares 200,000 200,000 1,786 Capital surplus 96,812 96,812 864 Retained earnings 2,101,845 2,298,925 20,526 Treasury stock, at cost, 657,657 shares in 2017 (5,295) (5,162) (46)Accumulated other comprehensive income:
Net unrealized holding gains (losses) on securities 43,771 52,940 473 Net deferred gains (losses) on derivatives under hedge accounting 473 1,847 16 Revaluation reserve for land (Note 2 (18)) (473) (474) (4)Remeasurements of defined benefit plans 4,996 8,531 76
Non-Controlling Interests 20,408 21,934 196 Total net assets 2,462,537 2,675,353 23,887
¥7,789,762 ¥7,911,115 $70,635
83Annual Report 2017

FACTS & FIGURES
Consolidated Statements of Income and Comprehensive IncomeEast Japan Railway Company and SubsidiariesYears ended March 31, 2016 and 2017
(I) CONSOLIDATED STATEMENTS OF INCOME
(II) CONSOLIDATED STATEMENTS OF COMPREHENSIVE INCOME (Note 24)
Millions of Yen
Millions ofU.S. Dollars(Note 2 (1))
2016 2017 2017
Operating Revenues (Note 23) ¥2,867,200 ¥2,880,802 $25,721 Operating Expenses:
Transportation, other services and cost of sales 1,841,026 1,852,221 16,538Selling, general and administrative expenses 538,353 562,271 5,020
2,379,379 2,414,492 21,558 Operating Income (Note 23) 487,821 466,310 4,163
Other Income (Expenses):
Interest expense on short- and long-term debt (45,559) (44,957) (401)Interest expense incurred for purchase of railway facilities (30,773) (25,301) (226)Loss on sales of fixed assets (1,102) (723) (6)Impairment losses on fixed assets (Notes 2 (17), 12 and 23) (12,297) (6,605) (59)Interest and dividend income 3,918 3,943 35 Equity in net income (loss) of affiliated companies 2,566 2,057 18 Gain on sales of fixed assets 839 11,834 106 Other, net (20,552) (2,292) (20)
(102,960) (62,044) (553)Income before Income Taxes 384,861 404,266 3,610
Income Taxes (Notes 2 (14) and 21):
Current 128,972 111,481 996Deferred 9,327 13,350 119
Profit 246,562 279,435 2,495
Profit Attributable to Non-Controlling Interests (1,252) (1,510) (14)Profit Attributable to Owners of Parent ¥ 245,310 ¥ 277,925 $ 2,481
YenU.S. Dollars(Note 2 (1))
Earnings per Share (Note 2 (15)) ¥ 626 ¥ 714 $ 6Cash Dividends Applicable to the Year (Note 2 (15)) 130 130 1
See accompanying notes.
Millions of Yen
Millions ofU.S. Dollars(Note 2 (1))
2016 2017 2017
Profit ¥246,562 ¥279,435 $2,495Other Comprehensive Income: (29,143) 14,036 125
Net unrealized holding gains (losses) on securities (24,070) 9,117 81 Net deferred gains (losses) on derivatives under hedge accounting (1,091) 20 0Remeasurements of defined benefit plans (906) 2,210 20 Share of other comprehensive income of associates accounted for using equity method (3,076) 2,689 24
Comprehensive Income ¥217,419 ¥293,471 $2,620Comprehensive Income Attributable to:
Comprehensive income attributable to owners of parent ¥216,215 ¥291,968 $2,607Comprehensive income attributable to non-controlling interests 1,204 1,503 13
See accompanying notes.
84 East Japan Railway Company

Consolidated Statements of Changes in Net AssetsEast Japan Railway Company and SubsidiariesYears ended March 31, 2016 and 2017
Shares Millions of Yen
Number of Issued Shares of
Common StockCommon
StockCapital Surplus
Retained Earnings
Treasury Stock
Net Unrealized Holding Gains
(Losses) on Securities
Net Deferred Gains (Losses) on Derivatives under Hedge
Accounting
Revaluation Reserve for
Land
Remeasure-ments of
Defined Benefit Plans
Non-Controlling
Interests Total
Balance at March 31, 2015 393,500,000 ¥200,000 ¥96,833 ¥1,915,383 ¥ (4,421) ¥ 68,415 ¥ 2,533 ¥(484) ¥ 7,399 ¥19,318 ¥2,304,976
C ash dividends (¥130 per share) — — — (49,083) — — — — — — (49,083)
P rofit attributable to owners of parent — — — 245,310 — — — — — — 245,310
Increase due to merger — — — — — — — — — — —
Purchase of treasury stock — — — — (11,085) — — — — — (11,085)
Disposal of treasury stock — — — — — — — — — — —
Retirement of treasury stock (1,000,000) — — (10,211) 10,211 — — — — — —
Change of scope of consolidation — — — 424 — — — — — — 424
Purchase of shares of consolidated subsidiaries — — 0 — — — — — — — 0
Increase by corporate division in consolidated subsidiaries — — (21) 22 — — — — — — 1
Reversal of revaluation reserve for land — — — — — — — — — — —
Other — — — — — (24,644) (2,060) 11 (2,403) 1,090 (28,006)
Balance at March 31, 2016 392,500,000 ¥200,000 ¥96,812 ¥2,101,845 ¥ (5,295) ¥ 43,771 ¥ 473 ¥(473) ¥ 4,996 ¥20,408 ¥2,462,537
C ash dividends (¥130 per share) — — — (50,782) — — — — — — (50,782)
P rofit attributable to owners of parent — — — 277,925 — — — — — — 277,925
Increase due to merger — — — 86 — — — — — — 86
Purchase of treasury stock — — — — (30,018) — — — — — (30,018)
Disposal of treasury stock — — — (0) 1 — — — — — 1
Retirement of treasury stock (3,092,100) — — (30,150) 30,150 — — — — — —
Change of scope of consolidation — — — — — — — — — — —
Purchase of shares of consolidated subsidiaries — — — — — — — — — — —
Increase by corporate division in consolidated subsidiaries — — — — — — — — — — —
Reversal of revaluation reserve for land — — — 1 — — — — — — 1
Other — — — — — 9,169 1,374 (1) 3,535 1,526 15,603
Balance at March 31,2017 389,407,900 ¥200,000 ¥96,812 ¥2,298,925 ¥ (5,162) ¥ 52,940 ¥ 1,847 ¥(474) ¥ 8,531 ¥21,934 ¥2,675,353
Shares Millions of U.S. Dollars (Note 2 (1))
Number of Issued Shares of
Common StockCommon
StockCapital Surplus
Retained Earnings
Treasury Stock
Net Unrealized Holding Gains
(Losses) on Securities
Net Deferred Gains (Losses) on Derivatives under Hedge
Accounting
Revaluation Reserve for
Land
Remeasure-ments of
Defined Benefit Plans
Non-Controlling
Interests Total
Balance at March 31, 2016 392,500,000 $1,786 $864 $18,766 $ (47) $391 $ 4 $(4) $45 $182 $21,987
Cash dividends ($1 per share) — — — (453) — — — — — — (453)
P rofit attributable to owners of parent — — — 2,481 — — — — — — 2,481
Increase due to merger — — — 1 — — — — — — 1
Purchase of treasury stock — — — — (268) — — — — — (268)
Disposal of treasury stock — — — (0) 0 — — — — — —
Retirement of treasury stock (3,092,100) — — (269) 269 — — — — — —
Change of scope of consolidation — — — — — — — — — — —
Purchase of shares of consolidated subsidiaries — — — — — — — — — — —
Increase by corporate division in consolidated subsidiaries — — — — — — — — — — —
Reversal of revaluation reserve for land — — — 0 — — — — — — 0
Other — — — — — 82 12 0 31 14 139
Balance at March 31,2017 389,407,900 $1,786 $864 $20,526 $ (46) $473 $16 $(4) $76 $196 $23,887
See accompanying notes.
85Annual Report 2017

FACTS & FIGURES
Consolidated Statements of Cash FlowsEast Japan Railway Company and SubsidiariesYears ended March 31, 2016 and 2017
Millions of Yen
Millions ofU.S. Dollars(Note 2 (1))
2016 2017 2017
Cash Flows from Operating Activities:
Income before income taxes ¥ 384,861 ¥ 404,266 $ 3,610Depreciation 359,515 364,129 3,251 Impairment losses on fixed assets 12,297 6,605 59 Amortization of long-term prepaid expense 8,720 7,923 71 Net change in provision for large-scale renovation of Shinkansen infrastructure — 24,000 214Net change in net defined benefit liability (27,649) (31,255) (279)Interest and dividend income (3,918) (3,943) (35)Interest expense 76,332 70,258 627 Construction grants received (24,487) (27,541) (246)Insurance proceeds related to earthquake (3,625) (13,640) (122)Loss from disposition and provision for cost reduction of fixed assets 55,071 67,361 601 Net change in major receivables (27,638) (11,105) (99)Net change in major payables 13,688 11,309 101 Other 9,093 (19,604) (175)
Sub-total 832,260 848,763 7,578 Proceeds from interest and dividends 4,408 4,500 40 Payments of interest (76,488) (70,721) (631)Insurance proceeds related to earthquake 14,688 19,065 170 Payments of earthquake-damage losses (1,338) (4,353) (39)Payments of partial transfer costs of railway operation (452) (1,296) (11)Payments of income taxes (99,968) (143,051) (1,277)
Net cash provided by operating activities 673,110 652,907 5,830
Cash Flows from Investing Activities:
Payments for purchases of fixed assets (538,245) (581,672) (5,194)Proceeds from sales of fixed assets 11,531 14,334 128 Proceeds from construction grants 32,123 54,363 485 Payments for purchases of investment in securities (714) (35,561) (318)Proceeds from sales of investment in securities 4,664 1,053 9Other (8,934) (10,056) (88)
Net cash used in investing activities (499,575) (557,539) (4,978)
Cash Flows from Financing Activities:
Proceeds from long-term loans 140,600 137,950 1,232 Payments of long-term loans (118,212) (107,108) (956)Proceeds from issuance of bonds 100,000 110,000 982 Payments for redemption of bonds (55,000) (80,000) (714)Payments of liabilities incurred for purchase of railway facilities (106,881) (97,356) (869)Payments of acquisition of treasury stock (11,086) (50,782) (453)Cash dividends paid (49,082) (30,018) (268)Other (10,605) 1,034 8
Net cash used in financing activities (110,266) (116,280) (1,038)
Net Change in Cash and Cash Equivalents 63,269 (20,912) (186) Cash and Cash Equivalents at Beginning of Year 245,171 307,809 2,748 Decrease in Cash and Cash Equivalents Resulting from Exclusion of Subsidiaries from Consolidation (631) — — Increase in Cash and Cash Equivalents due to Merger — 229 2Cash and Cash Equivalents at End of Year ¥ 307,809 ¥ 287,126 $ 2,564
See accompanying notes.
86 East Japan Railway Company

Notes to Consolidated Financial StatementsEast Japan Railway Company and SubsidiariesYears ended March 31, 2016 and 2017
NOTE 1: INCORPORATION OF EAST JAPAN RAILWAY COMPANY
In accordance with the provisions of the Law for Japanese National Railways
Restructuring (the Law), Japanese National Railways (JNR) was privatized
into six passenger railway companies, one freight railway company and
several other organizations (JR Group Companies) on April 1, 1987.
East Japan Railway Company (the Company) is one of the six passenger
railway companies and serves eastern Honshu (Japan’s main island). The
Company operates 69 railway lines, 1,665 railway stations and 7,457.3
operating kilometers as of March 31, 2017.
In the wake of the split-up of JNR, assets owned by and liabilities
incurred by JNR were transferred to JR Group companies, the Shinkansen
Holding Corporation and JNR Settlement Corporation (JNRSC). Most JNR
assets located in eastern Honshu, except for the land and certain railway
fixtures used by the Tohoku and Joetsu Shinkansen lines, were transferred to
the Company. Current liabilities and employees’ severance and retirement
benefits, incurred in connection with railway and other operations in the
allotted area, and certain long-term debt were assumed by the Company.
The transfer values were determined by the Evaluation Council, a gov-
ernmental task force, in accordance with the provisions of the Law. In
general, railway assets such as railway property and equipment were valued
at the net book value of JNR. Nonrailway assets such as investments and
other operating property and equipment were valued at prices determined
by the Evaluation Council.
The land and railway fixtures of the Tohoku and Joetsu Shinkansen lines
were owned by the Shinkansen Holding Corporation until September 30,
1991, and the Company leased such land and railway fixtures at a rent
determined by Shinkansen Holding Corporation in accordance with related
laws and regulations. On October 1, 1991, the Company purchased such
Shinkansen facilities for a total purchase price of ¥3,106,970 million
($27,741 million) from the Shinkansen Holding Corporation (see Note 14).
Subsequent to the purchase, the Shinkansen Holding Corporation was
dissolved. The Railway Development Fund succeeded to all rights and
obligations of the Shinkansen Holding Corporation. In October 1997, the
Railway Development Fund and Maritime Credit Corporation merged to
form the Corporation for Advanced Transport & Technology. In October 2003,
Japan Railway Construction Public Corporation and the Corporation for
Advanced Transport & Technology merged to form the Japan Railway
Construction, Transport and Technology Agency.
Prior to December 1, 2001, in accordance with the provisions of the Law
for Passenger Railway Companies and Japan Freight Railway Company
(JR Law), the Company was required to obtain approval from the Minister
of Land, Infrastructure, Transport and Tourism as to significant management
decisions, including new issues of stock or bonds, borrowing of long-term
loans, election of representative directors and corporate auditors, sale of
major properties, amendment of the Articles of Incorporation and distribu-
tion of retained earnings.
The amendment to the JR Law took effect on December 1, 2001 (2001
Law No. 61) and the Company is no longer subject generally to the JR Law,
as amended (see Note 13).
NOTE 2: SIGNIFICANT ACCOUNTING POLICIES
1) Basis of Presentation of Financial StatementsThe Company and its consolidated subsidiaries maintain their books of
account in accordance with the Japanese Corporate Law and accounting
principles generally accepted in Japan (“Japanese GAAP”). Certain
accounting principles and practices generally accepted in Japan are different
from International Financial Reporting Standards in certain respects as to
application and disclosure requirements. The Company’s and certain
consolidated subsidiaries’ books are also subject to the Law for Railway
Business Enterprise and related regulations for regulated companies.
The accompanying consolidated financial statements have been
restructured and translated into English from the consolidated financial
statements prepared for Financial Instruments and Exchange Act of Japan
purposes. Certain modifications and reclassifications have been made for
the convenience of readers outside Japan.
Certain amounts in the prior year’s financial statements have been
reclassified to conform to the current year’s presentation.
The consolidated financial statements are stated in Japanese yen. The
translations of the Japanese yen amounts into U.S. dollars are included solely
for the convenience of readers, using the prevailing exchange rate at March
31, 2017, which was ¥112 to U.S.$1. The convenience translations should not
be construed as representations that the Japanese yen amounts have been,
could have been or could in the future be converted into U.S. dollars at this
or any other rate of exchange.
2) ConsolidationThe consolidated financial statements of the Company include the
accounts of all significant subsidiaries (together, the “Companies”).The
effective-control standard is applied according to Regulations concerning
Terminology, Forms and Method of Presentation of Consolidated Financial
Statements in Japan (Regulations for Consolidated Financial Statements).
For the year ended March 31, 2017, 67 subsidiaries were consolidated.
All significant intercompany transactions and accounts have been
eliminated. Differences between the acquisition costs and the underlying
net equities of investments in consolidated subsidiaries are recorded as
goodwill or negative goodwill.
Goodwill is amortized using the straight-line method over five years.
Negative goodwill is recognized as a profit at the time of occurrence.
In the elimination of investments in subsidiaries, the assets and liabilities of
the subsidiaries, including the portion attributable to non-controlling share-
holders, are recorded based on the fair value at the time the Company
acquired control of the respective subsidiaries.
87Annual Report 2017
FACTS & FIGURES
3) Equity MethodThe effective-influence standard is applied according to Regulations for
Consolidated Financial Statements. For the year ended March 31, 2017,
five affiliated companies were accounted for by the equity method, and
there was no change in those companies during the year.
Investments in unconsolidated subsidiaries and other affiliated
companies are stated mainly at moving-average cost since their equity
earnings in the aggregate are not material in relation to consolidated net
income and retained earnings.
4) Allowance for Doubtful AccountsAccording to the Japanese Accounting Standards for Financial
Instruments, the Companies provide an allowance based on the past loan
loss experience for a certain reference period in general.
Further, for receivables from debtors with financial difficulty, which could
affect their ability to perform in accordance with their obligations, the allow-
ance is provided for estimated unrecoverable amounts on an individual
basis.
5) InventoriesInventories are stated at cost as follows:
Merchandise and finished goods: Mainly retail cost method or gross
average cost method (carrying amount in the balance sheet is calculated with
consideration of write-downs due to decreased profitability of inventories)
Work in process: Mainly identified cost method (carrying amount in the
balance sheet is calculated with consideration of write-downs due to
decreased profitability of inventories)
Raw materials and supplies: Mainly moving-average cost method
(carrying amount in the balance sheet is calculated with consideration of
write-downs due to decreased profitability of inventories)
6) Real Estate for SaleReal estate for sale is stated at the identified cost (carrying amount in the
balance sheet is calculated with consideration of write-downs due to
decreased profitability of real estate for sale)
7) SecuritiesSecurities are classified and stated as follows:
(1) Trading securities are stated at market value. The Companies had no
trading securities through the year ended March 31, 2017.
(2) Held-to-maturity debt securities are stated at amortized cost.
(3) Equity securities issued by subsidiaries and affiliated companies that
are neither consolidated nor accounted for using the equity method are
mainly stated at moving-average cost.
(4) Available-for-sale securities are stated as follows:
(a) Available-for-sale securities with market value
According to the Japanese Accounting Standards for Financial
Instruments, available-for-sale securities for which market quotations
are available are stated at market value as of the balance sheet date.
Net deferred gains or losses on these securities are reported as a
separate item in net assets at an amount net of applicable income
taxes and non-controlling interests. The cost of sales of such securities
is calculated mainly by the moving-average method.
(b) Available-for-sale securities without market value
Available-for-sale securities for which market quotations are not avail-
able are mainly stated at moving-average cost.
If there are significant declines in the market values of held-to-maturity
debt securities, equity securities issued by subsidiaries and affiliated com-
panies that are neither consolidated nor accounted for using the equity
method or available-for-sale securities, the securities are stated at market
values in the balance sheet, and the difference between the market value
and the original book value is recognized as a loss in the period. The
Companies’ policy for such write-offs stipulates that if the market value as
of the year-end has declined by 50% or more of the book value of the said
security, it should be stated at the market value. If the market value has
declined by 30% or more but less than 50%, the said security should be
written off by the amount determined as necessary after taking the possibil-
ity of market value recovery into account.
8) Property, Plant and EquipmentProperty, plant and equipment are generally stated at cost or the transfer
value referred to in Note 1. To comply with the regulations, contributions
received in connection with construction of certain railway improvements
are deducted from the cost of acquired assets.
Depreciation is calculated primarily by the declining balance method
based on the estimated useful lives of the assets as prescribed by the
Japanese Tax Law. Buildings (excluding related fixtures) acquired from April
1, 1998 onward, facilities attached to buildings and structures acquired on
or after April 1, 2016 and some of the property, plant and equipment of
consolidated subsidiaries are depreciated using the straight-line method
according to the Japanese Tax Law. Replacement assets included in struc-
tures of railway fixed assets are depreciated using the replacement
method. Regarding the replacement method for certain fixtures, the initial
acquisition costs are depreciated to 50% of the costs under the condition
that subsequent replacement costs are charged to income.
The range of useful lives is mainly as follows:
Buildings 3 to 50 years
Fixtures 3 to 60 years
Machinery, rolling stock and vehicles 3 to 20 years
Notes to Consolidated Financial Statements
88 East Japan Railway Company

9) Accounting for Employees’ Retirement BenefitsAlmost all employees of the Companies are generally entitled to receive
lump-sum severance and retirement benefits (some subsidiaries have
adopted a pension plan of their own in addition to those severance and
retirement benefits). Further, some consolidated subsidiaries have estab-
lished retirement benefit trusts.
For the calculation of projected benefit obligations, the Companies
adopted the benefit formula basis as the method for attributing expected
benefits to periods.
The past service costs that are yet to be recognized are amortized by the
straight-line method and charged to income over the number of years (mainly
10 years), which does not exceed the average remaining service years of
employees at the time when the past service costs were incurred.
Actuarial gains and losses are recognized in expenses using the
straight-line basis over constant years (mainly 10 years) within the expected
average remaining working lives commencing with the following year.
10) Allowance for Partial Transfer Costs of Railway Operation
The Company provides an allowance based on the estimated cost of
restoration to the original state and other activities aimed at the transfer of
management of the section between Miyako and Kamaishi on the Yamada
Line from the Company to Sanriku Railway Company.
11) Provision for Large-Scale Renovation of Shinkansen Infrastructure
The provision for large-scale renovation of Shinkansen infrastructure has
been recognized based on Article 17 of the Nationwide Shinkansen Railway
Development Act (Act No. 71 of 1970).
On March 29, 2016, the Company received approval for a Plan for
Provision for Large-Scale Renovation of Shinkansen Infrastructure from the
Minister of Land, Infrastructure, Transport and Tourism based on Article 16,
Paragraph 1 of the Nationwide Shinkansen Railway Development Act. As a
result, from the fiscal year ending March 31, 2017, until the fiscal year
ending March 31, 2031, a provision of ¥24,000 million (total: ¥360,000
million) will be recognized each fiscal year, and from the fiscal year ending
March 31, 2032, until the fiscal year ending March 31, 2041, a reversal of
¥36,000 million (total: ¥360,000 million) will be recognized each fiscal year.
12) Accounting for Certain Lease TransactionsWith respect to finance leases that do not transfer ownership to lessees,
depreciation is calculated by the straight-line method based on the lease
term and estimated residual is zero.
With regard to finance leases that do not transfer ownership for which
the starting date for the transaction is prior to March 31, 2008, they continue
to be accounted for by a method used for operating lease.
13) Accounting for Research and Development CostsAccording to the Accounting Standards for Research and Development
Costs, etc., in Japan, research and development costs are recognized as
they are incurred. Research and development costs included in operating
expenses for the years ended March 31, 2016 and 2017 were ¥16,886
million and ¥17,914 million ($160 million), respectively.
14) Income Taxes Income taxes comprise corporation, enterprise and inhabitants’ taxes.
Deferred tax assets are recognized for temporary differences between the
financial statement basis and the tax basis of assets and liabilities.
15) Per Share Data(1) Earnings per share
Earnings per share shown in the consolidated statements of income
are computed by dividing income available to common shareholders
by the weighted average number of common stock outstanding during
the year. Diluted earnings per share are not shown, since there are no
outstanding securities with dilutive effect on earnings per share such as
convertible bonds.
(2) Cash dividends per share
Cash dividends per share comprises interim dividends for the interim
period ended September 30 and year-end dividends for the year ended
March 31, which were decided at the annual shareholders’ meeting in June.
16) Derivative TransactionsDerivative transactions that do not meet requirements for hedge account-
ing are stated at fair value and the gains or losses resulting from change
in the fair value of those transactions are recognized as income or expense
in the period.
Derivative transactions that meet requirements for hedge accounting are
stated at fair value, and the gains and losses resulting from changes in fair
value of those transactions are deferred until the losses and gains of the
hedged items are recognized on the consolidated statements of income.
Of those, certain derivative transactions of the Companies that meet
certain hedging criteria are accounted in the following manner:
(1) Regarding forward exchange contracts and foreign currency swap
contracts, the hedged foreign currency receivable and payable are
recorded using the Japanese yen amount of the contracted forward
rate or swap rate, and no gains or losses on the forward exchange
contracts or foreign currency swap contracts are recorded.
(2) Regarding interest rate swap contracts, the net amount to be paid or
received under the interest rate swap contract is added to or deducted
from the interest on the assets or liabilities for which the swap contract
was executed.
89Annual Report 2017

FACTS & FIGURES
Notes to Consolidated Financial Statements
17) Impairment of Fixed AssetsAccounting Standards for Impairment of Fixed Assets require that fixed
assets be reviewed for impairment whenever events or changes in circum-
stances indicate that the book value of an asset or asset group may not be
recoverable.
The impairment losses are recognized when the book value of an asset
or asset group exceeds the sum of the undiscounted future cash flows
expected to result from the continuing use and eventual disposition of the
asset or asset group.
The impairment losses are measured as the amount by which the book
value of the asset exceeds its recoverable amounts, which is the higher of
the discounted cash flows from the continuing use and eventual disposition
of the asset or the net selling price.
Restoration of previously recognized impairment losses is prohibited.
For cumulative impairment losses, the Companies deducted directly from
respective asset amounts based on the revised regulation on the consoli-
dated financial statements.
18) Revaluation of LandJTB Corp., an equity-method affiliated of the Company, absorbed JTB
Estate Corp. by merger on April 1, 2012. Prior to this absorption merger,
JTB Estate Corp. had been revaluating its land for business use pursuant
to the Law on Revaluation of Land (Law No. 34 of 1998) and the Law for
Partial Revision of the Law on Revaluation of Land (Law No. 19 of 2001).
Consequently, the Company’s equity-method portion of “Revaluation
reserve for land” recorded on JTB Corp.’s balance sheets was recorded in
the Company’s consolidated balance sheets as “Revaluation reserve for
land” under Net assets, Accumulated other comprehensive income.
(1) Revaluation method
Rational adjustment based on roadside land value and other standards
pursuant to the Order for Enforcement of the Law on Revaluation of
Land (Cabinet Order No. 119 of 1998) Article 2-4
(2) Revaluation date
March 31, 2002
(3) Difference between book value after revaluation and market value on
March 31, 2017
Difference was not recorded because the market value of the revalu-
ated land was higher than the book value after revaluation.
19) Changes in Accounting PoliciesIn accordance with an amendment of Japan’s Corporation Tax Act, the
Company has applied the “Practical Solution on a change in depreciation
method due to Tax Reform 2016” (Practical Issues Task Force No.32 issued
on June 17, 2016) beginning with this fiscal year and has changed its
depreciation method for facilities attached to buildings and structures
acquired on or after April 1, 2016, from the declining balance method to
the straight-line method.
The effect of this change on consolidated financial statements is
negligible.
20) Changes in Presentation Method(Consolidated statements of cash flows)
From the fiscal year under review, the Company has classified “Insurance
proceeds related to earthquake” of “Other” of “Cash Flows from Operating
Activities” separately because in the fiscal year under review the monetary
significance increased. In the previous fiscal year, the Company presented
and included “Insurance proceeds related to earthquake” in “Other” of
“Cash Flows from Operating Activities.” To reflect this change in the
presentation method, in the consolidated statement of cash flows for the
previous fiscal year the Company has reclassified ¥3,625 million that was
presented and included in “Other” as “Insurance proceeds related to
earthquake” of “Cash Flows from Operating Activities.”
90 East Japan Railway Company

NOTE 3: EARTHQUAKE DAMAGE
The Company’s Tohoku Shinkansen Line and conventional lines and vari-
ous other facilities were damaged severely in the Great East Japan
Earthquake on March 11, 2011.
There had also been further damage to the Company’s railroad and
other facilities due to intermittent earthquakes since April 2011.
For the damages caused by the Great East Japan Earthquake on March
11, 2011, the Companies recorded allowance for earthquake-damage
losses as “Other current liabilities” and “Other long-term liabilities” on the
consolidated balance sheets for the estimated amount of restoration and
other expenses in the fiscal year.
However, restoration and other expenses that are difficult to reasonably
estimate at this time are not included in allowance for earthquake-damage
losses.
Further, the Company’s railway line facilities, railway stop facilities
(excluding station buildings), electric cable facilities and other fixtures,
which were owned by or leased by the Company, were insured against
earthquakes for up to ¥71,000 million ($634 million) (¥10,000 million
deductible) as of March 11, 2011.
The aggregate amount of insurance proceeds received for such
insurance was ¥71,000 million ($634 million) as of March 31, 2017.
NOTE 4: APPLICATION OF THE REVISED IMPLEMENTATION GUIDANCE ON RECOVERABILITY OF DEFERRED TAX ASSETS
The Company applies the Revised Implementation Guidance on Recoverability of Deferred Tax Assets (Accounting Standards Board of Japan Guidance
No. 26, March 28, 2016) from this fiscal year.
NOTE 5: CASH AND CASH EQUIVALENTS
Cash and cash equivalents include all cash balances and highly liquid investments with maturities not exceeding three months at the time of purchase.
NOTE 6: INVENTORIES
Inventories at March 31, 2016 and 2017 consisted of the following:
Millions of YenMillions of
U.S. Dollars
2016 2017 2017
Merchandise and finished goods ¥ 8,890 ¥ 8,997 $ 80
Work in process 11,283 14,956 134
Raw materials and supplies 27,662 26,909 240
¥47,835 ¥50,862 $454
NOTE 7: REAL ESTATE FOR SALE
Real estate for sale represents the cost of land acquired and related land improvements in connection with residential home site developments in eastern Honshu.
91Annual Report 2017

FACTS & FIGURES
NOTE 9: FINANCIAL INSTRUMENTS
1) Items Relating to the Status of Financial Instrumentsa) Policy in relation to financial instruments
If surplus funds arise, the Companies use only financial assets with high
degrees of safety for the management of funds. The Companies principally
use bond issuances and bank loans in order to raise funds. Further, the
Companies use derivatives to reduce risk, as described below, and do not
conduct speculative trading.
b) Details of financial instruments and related risk
Trade receivables are exposed to credit risk in relation to customers,
transportation operators with connecting railway services, and other par-
ties. Further, short-term loans receivable, which principally comprise loans
receivable as a result of credit card cashing services, are exposed to credit
risk in relation to customers. Regarding the said risk, pursuant to the inter-
nal regulations of the Companies, due dates and balances are managed
appropriately for each counterparty. Securities are exposed to market price
fluctuation risk. Substantially all of trade payables—payables, accrued
consumption taxes and accrued income taxes—have payment due dates
within one year. Bonds and loans are exposed to risk associated with
inability to make payments on due dates because of unforeseen decreases
in free cash flows. Further, certain bonds and loans are exposed to market
price fluctuation risk (foreign exchange / interest rates). Long-term liabilities
incurred for purchase of railway facilities are liabilities with regard to the
Japan Railway Construction, Transport and Technology Agency and,
pursuant to the Law Related to the Transference of Shinkansen Railway
Facilities, comprise principally interest-bearing debt related to the Company’s
purchase of Shinkansen railway facilities for a total purchase price of
¥3,106,970 million ($27,741 million) from the Shinkansen Holding
Corporation on October 1, 1991. The Company pays such purchase price,
based on regulations pursuant to the Law Related to the Transference of
Shinkansen Railway Facilities, enacted in 1991, and other laws, in semian-
nual installments calculated using the equal payment method, whereby
interest and principal are paid in equal amounts semiannually, based on
interest rates approved by the Minister of Land, Infrastructure, Transport
and Tourism (at the time of enactment). Long-term liabilities incurred for
purchase of railway facilities are exposed to risk associated with inability to
make payments on due dates because of a decrease in free cash flows for
unforeseen reasons. Further, certain long-term liabilities incurred for purchase
of railway facilities are exposed to market price fluctuation risk (interest rates).
c) Risk management system for financial instruments
The Companies use forward exchange contract transactions, currency
swap transactions and interest rate swap transactions with the aim of
avoiding risk (market risk) related to fluctuation in future market prices
(foreign exchange / interest rates) in relation to, among others, bonds and
loans. Further, commodity swap transactions are used with the aim of
avoiding product price fluctuation risk related to fuel purchasing, and
natural disaster derivatives are used with the aim of avoiding revenue
expenditure fluctuation risk due to natural disasters. Because all of the
derivative transaction contracts that the Companies enter into are transac-
tions whose counterparties are financial institutions that have high credit-
worthiness, the Companies believe that there is nearly no risk of parties to
contracts defaulting on obligations. Under the basic policy approved by the
Board of Directors, with the aim of appropriately executing transactions and
risk management, financial departments in the relevant companies process
those derivative transactions following appropriate internal procedures or
approval of the Board of Directors, based on relevant internal regulations.
d) Supplementary explanation of items relating to the fair values of
financial instruments
The fair values of financial instruments include market prices or reasonably
estimated values if there are no market prices. Because estimation of fair
values incorporates variable factors, adopting different assumptions can
change the values.
Notes to Consolidated Financial Statements
NOTE 8: INVESTMENTS IN AND ADVANCES TO UNCONSOLIDATED SUBSIDIARIES AND AFFILIATED COMPANIES
Investments in and advances to unconsolidated subsidiaries and affiliated companies at March 31, 2016 and 2017 consisted of the following:
Millions of YenMillions of
U.S. Dollars
2016 2017 2017
Unconsolidated subsidiaries:
Investments ¥ 5,994 ¥ 5,963 $ 53
Advances 1,060 310 3
7,054 6,273 56
Affiliated companies:
Investments (including equity in earnings of affiliated companies) ¥46,439 ¥51,051 $456
Advances 36 — —
46,475 51,051 456
¥53,529 ¥57,324 $512
92 East Japan Railway Company

2) Items Relating to the Fair Values of Financial InstrumentsAmounts recognized for selective items in the consolidated balance sheets as of March 31, 2016 and 2017, fair values of such items, and the differences between
such amounts and values are shown below. Further, items for which fair values were extremely difficult to establish were not included in the following table.
Notes: 1. Items relating to securities, derivatives transactions and method of estimating the fair values of financial instruments
Assets a. Cash and cash equivalents b. Receivables Because these assets are settled over short terms, fair values and book values are
nearly equivalent. Therefore, relevant book values are used. c. Securities The fair values of these securities are based mainly on market prices.
Liabilities a. Payables b. Accrued consumption taxes c. Accrued income taxes Because these liabilities are settled over short terms, fair values and book values
are nearly equivalent. Therefore, relevant book values are used. d. Long-term debt Bonds The fair values of domestic bonds are based on market prices.The fair values of foreign currency-denominated bonds, which are subject to treatment using foreign currency swaps, are estimated by discounting the foreign currency swaps and future cash flows treated in combination with them based on estimated interest rates if similar domestic bonds were newly issued. Long-term loans The fair values of long-term loans are principally estimated by discounting future
cash flows based on estimated interest rates if similar new loans were imple-mented. Further, the fair values of certain long-term loans, which are subject to treatment using foreign currency swaps or interest rate swaps, are estimated by discounting the foreign currency swaps or interest rate swaps and future cash flows treated in combination with them based on estimated interest rates if similar new loans were implemented.
e. Long-term liabilities incurred for purchase of railway facilities Because these liabilities are special monetary liabilities that are subject to con-
straints pursuant to laws and statutory regulations and not based exclusively on free agreement between contracting parties in accordance with market principles, and
because repeating fund-raising using similar methods would be difficult, as stated in “1) Items relating to the status of financial instruments, b. Details of financial instruments and related risk,” the fair values of long-term liabilities incurred for purchase of railway facilities are estimated by assuming that future cash flows were raised through bonds, the Company’s basic method of fund-raising, and discounting them based on estimated interest rates if similar domestic bonds were newly issued. Further, certain long-term liabilities incurred for purchase of railway facilities with variable interest rates are estimated based on the most recent interest rates, notification of which is provided by the Japan Railway Construction, Transport and Technology Agency.
Derivative transactions (See Note 19)
2. Financial instruments whose fair values were extremely difficult to establishConsolidated balance sheet amount
Millions of YenMillions of
U.S. Dollars
Classification 2016 2017 2017Unlisted equity securities ¥6,653 ¥6,826 $61Unlisted corporate bonds 360 360 3Investment in anonymous associations (tokumei kumiai) — 3,629 32Preferred equity securities 1,000 1,000 9Natural disaster derivative transactions 1,131 1,153 10
*1 Because the fair values of these financial instruments were extremely difficult to establish, given that they did not have market prices and future cash flows could not be estimated, they were not included in “c. Securities–Available-for-sale securities.”
*2 The fair value of natural disaster derivative transactions was not measured because it is extremely difficult to establish a fair value.
3. The amounts recognized in the consolidated balance sheets and fair values related to bonds, long-term loans and long-term liabilities incurred for purchase of railway facilities included, respectively, the current portion of bonds, the current portion of long-term loans and the current portion of long-term liabilities incurred for purchase of railway facilities.
Millions of Yen Millions of U.S. Dollars
2016 2017 2017Consolidated
balance sheetamount Fair value Difference
Consolidatedbalance sheet
amount Fair value Difference
Consolidatedbalance sheet
amount Fair value Difference
a. Cash and cash equivalents ¥ 307,809 ¥ 307,809 ¥ — ¥ 287,126 ¥ 287,126 ¥ — $ 2,564 $ 2,564 $ —
b. Receivables 484,361 484,361 — 495,037 495,037 — 4,420 4,420 —
c. Securities:
Held-to-maturity debt securities 157 162 5 157 161 4 1 1 0
Available-for-sale securities 149,775 149,775 — 194,337 194,337 — 1,735 1,735 —
Assets ¥ 942,102 ¥ 942,107 ¥ 5 ¥ 976,657 ¥ 976,661 ¥ 4 $ 8,720 $ 8,720 $ 0
a. Payables ¥ 757,544 ¥ 757,544 ¥ — ¥ 718,466 ¥ 718,466 ¥ — $ 6,415 $ 6,415 $ —
b. Accrued consumption taxes 23,956 23,956 — 19,513 19,513 — 174 174 —
c. Accrued income taxes 83,239 83,239 — 55,639 55,639 — 497 497 —
d. Long-term debt:
Bonds 1,809,914 2,075,179 265,265 1,839,975 2,058,593 218,618 16,428 18,380 1,952
Long-term loans 1,015,530 1,089,102 73,572 1,046,372 1,108,612 62,240 9,343 9,899 556
e. Long-term liabilities incurred for purchase of railway facilities 438,326 867,081 428,755 340,969 727,697 386,728 3,044 6,497 3,453
Liabilities ¥4,128,509 ¥4,896,101 ¥767,592 ¥4,020,934 ¥4,688,520 ¥667,586 $35,901 $41,862 $5,961
Derivative transactions*1:
Hedge accounting applied ¥ 1,738 ¥ 1,738 ¥ — ¥ 1,767 ¥ 1,767 ¥ — $ 16 $ 16 $ —
*1 Net receivables / payables arising from derivatives are shown. Items that are net payables are shown in parentheses.
93Annual Report 2017

FACTS & FIGURES
Notes to Consolidated Financial Statements
4. The annual maturities of financial assets and securities with maturities at March 31, 2016 and 2017 were as follows:Millions of Yen Millions of U.S. Dollars
2016 2017 2017
1 year or less
5 years orless but
more than1 year
10 yearsor less butmore than
5 yearsMore than
10 years1 year or less
5 years orless but
more than1 year
10 yearsor less butmore than
5 yearsMore than
10 years1 year or less
5 years orless but
more than1 year
10 yearsor less butmore than
5 yearsMore than
10 years
Cash and cash equivalents ¥307,809 ¥ — ¥ — ¥— ¥287,126 ¥ — ¥ — ¥— $2,564 $— $— $—
Receivables 477,542 6,407 322 90 488,040 6,554 396 47 4,358 58 4 0
Securities:
Held-to-maturity debt securities (Government bonds) — 10 150 — — 150 10 — — 1 0 —
Available-for-sale securities which have maturity (Government bonds) — — 6 — — — 6 — — — 0 —
Total ¥785,351 ¥6,417 ¥478 ¥90 ¥775,166 ¥6,704 ¥412 ¥47 $6,922 $59 $ 4 $ 0
5. The annual maturities of bonds, long-term loans and long-term liabilities incurred for purchase of railway facilities at March 31, 2017 (See Notes 13 and 14)
NOTE 10: SECURITIES
For held-to-maturity debt securities, the amount on balance sheets and market value at March 31, 2016 and 2017 were as follows: Millions of Yen Millions of U.S. Dollars
2016 2017 2017Amount on
balancesheet Market value Difference
Amount onbalance
sheet Market value Difference
Amount onbalance
sheet Market value Difference
Of which market value exceeds the amount on balance sheet:
Government, municipal bonds, etc. ¥157 ¥162 ¥5 ¥157 ¥161 ¥4 $1 $1 $0
Of which market value does not exceed the amount on balance sheet:
Government, municipal bonds, etc. — — — — — — — — —
Total ¥157 ¥162 ¥5 ¥157 ¥161 ¥4 $1 $1 $0
For available-for-sale securities, the acquisition cost and amount on balance sheets at March 31, 2016 and 2017 were as follows:Millions of Yen Millions of U.S. Dollars
2016 2017 2017
Acquisition cost
Amount onbalance
sheet Difference Acquisition cost
Amount onbalance
sheet Difference Acquisition cost
Amount onbalance
sheet Difference
Of which amount on balance sheet exceeds the acquisition cost:
Equity shares ¥62,951 ¥126,580 ¥63,629 ¥ 92,713 ¥166,259 ¥73,546 $ 828 $1,484 $656
Debt securities 6 6 0 6 6 0 0 0 0
Of which amount on balance sheet does not exceed the acquisition cost:
Equity shares 29,544 23,189 (6,355) 30,973 28,072 (2,901) 277 251 (26)
Debt securities — — — — — — — — —
Total ¥92,501 ¥149,775 ¥57,274 ¥123,692 ¥194,337 ¥70,645 $1,105 $1,735 $630
Note: In the previous fiscal year and the fiscal year under review, treatment for impairment has not been implemented for other securities with market value. The Companies’ policy for such write-offs stipulates that if the market value as of the year-end has declined by 50% or more of the book value of the said security, it should be stated at the
market value. If the market value has declined by 30% or more but less than 50%, the said security should be written off by the amount determined as necessary after taking the possibility of market value recovery into account.
94 East Japan Railway Company

NOTE 11: PLEDGED ASSETS
Pledged assets at March 31, 2016 and 2017 were summarized as follows:
Pledged assets as a collateral
Millions of YenMillions of
U.S. Dollars
2016 2017 2017
Buildings and fixtures with net book value ¥19,406 ¥ 51 $0
Other assets with net book value 966 967 9
Counterpart long-term debt and other liabilities
Millions of YenMillions of
U.S. Dollars
2016 2017 2017
Long-term debt and other liabilities ¥1,232 ¥1,086 $10
Pledged assets as a mortgage for long-term liabilities
Millions of YenMillions of
U.S. Dollars
2016 2017 2017
Buildings and fixtures with net book value ¥49,367 ¥48,150 $430
Other assets with net book value 12,377 13,284 119
Counterpart long-term liabilities
Millions of YenMillions of
U.S. Dollars
2016 2017 2017
Long-term liabilities incurred for purchase of railway facilities ¥1,968 ¥1,477 $13
NOTE 12: IMPAIRMENT LOSSES ON FIXED ASSETS
In adherence with management accounting classifications, the Companies
generally categorize assets according to operations or properties. For
railway business assets, the Companies treat railway lines as a single asset
group because the railway network generates cash flow as a whole. Also,
the Companies separately categorize assets that are slated to be disposed
of or idle. The Companies determine recoverable amounts for the above
asset groups by measuring the net selling prices or values in use. In case
the Companies determine recoverable amounts for the above asset groups
by measuring the net selling prices, the prices and other amounts are
adjusted rationally applying the tax-appraised value of fixed assets. Values
in use for the measurement of recoverable amounts are based on the
present values of expected cash flows with the discount rate of 4.0% in the
fiscal year.
For assets with fair value in sharp decline compared with book value or
with profitability in sharp decline, the book values were reduced to the
recoverable amounts and the reductions were recognized as impairment
losses on fixed assets.
Impairment losses on fixed assets were ¥12,297 million and
¥6,605 million ($59 million) in the years ended March 31, 2016 and 2017,
respectively.
95Annual Report 2017

FACTS & FIGURES
Notes to Consolidated Financial Statements
NOTE 13: LONG-TERM DEBT
Long-term debt at March 31, 2016 and 2017 were summarized as follows:
Millions of YenMillions of
U.S. Dollars
2016 2017 2017
General mortgage bonds issued in 1997 to 2001 with interest rates ranging from 2.30% to 3.30% due in 2017 to 2021 ¥ 179,900 ¥ 139,900 $ 1,249
Unsecured bonds issued in 2002 to 2017 with interest rates ranging from 0.06% to 2.55% due in 2017 to 2057 1,390,932 1,460,943 13,044
Secured loans due in 2017 to 2018 from banks with interest rates 1.95% 233 29 0
Unsecured loans due in 2017 to 2045 principally from banks and insurance companies with interest rates mainly ranging from 0.10% to 2.80% 1,015,297 1,046,343 9,343
Euro-pound bonds issued in 2006 to 2007 with interest rates ranging from 4.50% to 5.25% due in 2031 to 2036 239,082 239,132 2,135
2,825,444 2,886,347 25,771
Less current portion 187,107 276,731 2,471
¥2,638,337 ¥2,609,616 $23,300
Issue and maturity years above are expressed in calendar years (ending
December 31 in the same year).
Although the Company is no longer subject generally to the JR Law, as
amended, all bonds issued by the Company prior to December 1, 2001, the
effective date of the amendment to the JR Law, are and will continue to be
general mortgage bonds as required under the JR Law, which are entitled
to a statutory preferential right over the claims of unsecured creditors of the
Company. Any bonds issued on or after December 1, 2001 are unsecured
bonds without general mortgage preferential rights.
The annual maturities of bonds at March 31, 2017 were as follows:
Year ending March 31, Millions of YenMillions of
U.S. Dollars
2018 ¥ 159,900 $ 1,428
2019 165,000 1,473
2020 125,000 1,116
2021 120,000 1,071
2022 90,000 804
2023 and thereafter 1,180,959 10,544
The annual maturities of long-term loans at March 31, 2017 were as
follows:
Year ending March 31, Millions of YenMillions of
U.S. Dollars
2018 ¥116,831 $1,043
2019 119,665 1,069
2020 110,423 986
2021 115,663 1,033
2022 133,290 1,190
2023 and thereafter 450,500 4,022
NOTE 14: LONG-TERM LIABILITIES INCURRED FOR PURCHASE OF RAILWAY FACILITIES
In October 1991, the Company purchased the Tohoku and Joetsu
Shinkansen facilities from the Shinkansen Holding Corporation for a total
purchase price of ¥3,106,970 million ($27,741 million) payable in equal
semiannual installments consisting of principal and interest payments in
three tranches: ¥2,101,898 million ($18,767 million) and ¥638,506 million
($5,701 million) in principal amounts payable through March 2017; and
¥366,566 million ($3,273 million) payable through September 2051. In
March 1997, the liability of ¥27,946 million ($250 million) payable in equal
semiannual installments through March 2022 to Japan Railway
Construction Public Corporation was incurred with respect to the acquisi-
tion of the Akita hybrid Shinkansen facilities. In February 2002, the
Company acquired a majority interest in Tokyo Monorail Co., Ltd. As a
result, the consolidated balance sheets as of March 31, 2002 included
liabilities of Tokyo Monorail Co., Ltd. amounting to ¥36,726 million
($328 million) payable to Japan Railway Construction Public Corporation.
96 East Japan Railway Company
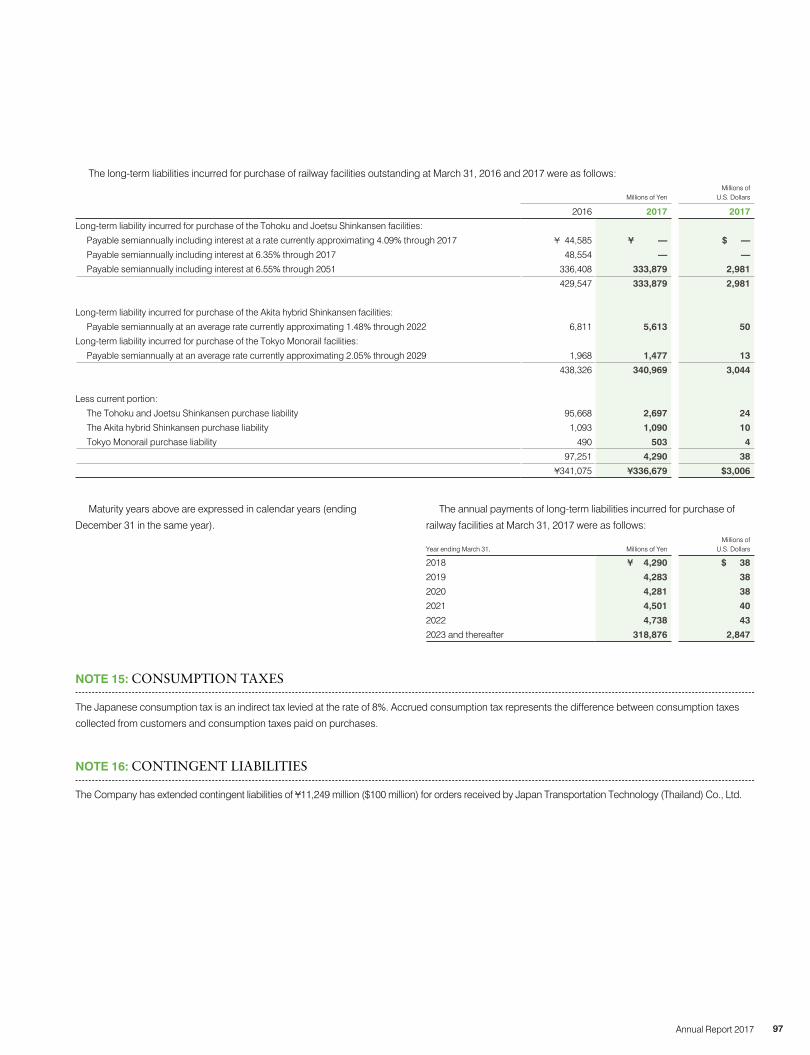
NOTE 15: CONSUMPTION TAXES
The Japanese consumption tax is an indirect tax levied at the rate of 8%. Accrued consumption tax represents the difference between consumption taxes
collected from customers and consumption taxes paid on purchases.
NOTE 16: CONTINGENT LIABILITIES
The Company has extended contingent liabilities of ¥11,249 million ($100 million) for orders received by Japan Transportation Technology (Thailand) Co., Ltd.
The long-term liabilities incurred for purchase of railway facilities outstanding at March 31, 2016 and 2017 were as follows:
Millions of YenMillions of
U.S. Dollars
2016 2017 2017
Long-term liability incurred for purchase of the Tohoku and Joetsu Shinkansen facilities:
Payable semiannually including interest at a rate currently approximating 4.09% through 2017 ¥ 44,585 ¥ — $ —
Payable semiannually including interest at 6.35% through 2017 48,554 — —
Payable semiannually including interest at 6.55% through 2051 336,408 333,879 2,981
429,547 333,879 2,981
Long-term liability incurred for purchase of the Akita hybrid Shinkansen facilities:
Payable semiannually at an average rate currently approximating 1.48% through 2022 6,811 5,613 50
Long-term liability incurred for purchase of the Tokyo Monorail facilities:
Payable semiannually at an average rate currently approximating 2.05% through 2029 1,968 1,477 13
438,326 340,969 3,044
Less current portion:
The Tohoku and Joetsu Shinkansen purchase liability 95,668 2,697 24
The Akita hybrid Shinkansen purchase liability 1,093 1,090 10
Tokyo Monorail purchase liability 490 503 4
97,251 4,290 38
¥341,075 ¥336,679 $3,006
Maturity years above are expressed in calendar years (ending
December 31 in the same year).
The annual payments of long-term liabilities incurred for purchase of
railway facilities at March 31, 2017 were as follows:
Year ending March 31, Millions of YenMillions of
U.S. Dollars
2018 ¥ 4,290 $ 38
2019 4,283 38
2020 4,281 38
2021 4,501 40
2022 4,738 43
2023 and thereafter 318,876 2,847
97Annual Report 2017
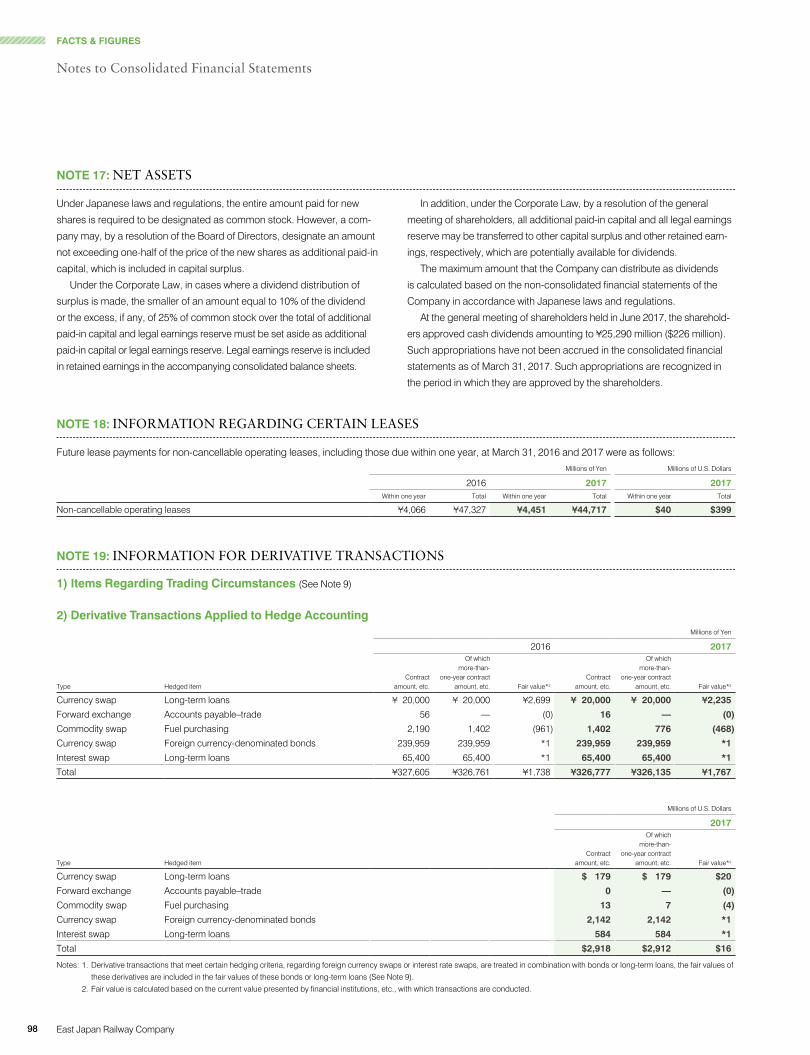
FACTS & FIGURES
Notes to Consolidated Financial Statements
NOTE 18: INFORMATION REGARDING CERTAIN LEASES
Future lease payments for non-cancellable operating leases, including those due within one year, at March 31, 2016 and 2017 were as follows:Millions of Yen Millions of U.S. Dollars
2016 2017 2017Within one year Total Within one year Total Within one year Total
Non-cancellable operating leases ¥4,066 ¥47,327 ¥4,451 ¥44,717 $40 $399
NOTE 19: INFORMATION FOR DERIVATIVE TRANSACTIONS
1) Items Regarding Trading Circumstances (See Note 9)
2) Derivative Transactions Applied to Hedge AccountingMillions of Yen
2016 2017
Type Hedged itemContract
amount, etc.
Of whichmore-than-
one-year contractamount, etc. Fair value*2
Contractamount, etc.
Of whichmore-than-
one-year contractamount, etc. Fair value*2
Currency swap Long-term loans ¥ 20,000 ¥ 20,000 ¥2,699 ¥ 20,000 ¥ 20,000 ¥2,235
Forward exchange Accounts payable–trade 56 — (0) 16 — (0)
Commodity swap Fuel purchasing 2,190 1,402 (961) 1,402 776 (468)
Currency swap Foreign currency-denominated bonds 239,959 239,959 *1 239,959 239,959 *1
Interest swap Long-term loans 65,400 65,400 *1 65,400 65,400 *1
Total ¥327,605 ¥326,761 ¥1,738 ¥326,777 ¥326,135 ¥1,767
Millions of U.S. Dollars
2017
Type Hedged itemContract
amount, etc.
Of whichmore-than-
one-year contractamount, etc. Fair value*2
Currency swap Long-term loans $ 179 $ 179 $20
Forward exchange Accounts payable–trade 0 — (0)
Commodity swap Fuel purchasing 13 7 (4)
Currency swap Foreign currency-denominated bonds 2,142 2,142 *1
Interest swap Long-term loans 584 584 *1
Total $2,918 $2,912 $16
Notes: 1. Derivative transactions that meet certain hedging criteria, regarding foreign currency swaps or interest rate swaps, are treated in combination with bonds or long-term loans, the fair values of these derivatives are included in the fair values of these bonds or long-term loans (See Note 9).
2. Fair value is calculated based on the current value presented by financial institutions, etc., with which transactions are conducted.
NOTE 17: NET ASSETS
Under Japanese laws and regulations, the entire amount paid for new
shares is required to be designated as common stock. However, a com-
pany may, by a resolution of the Board of Directors, designate an amount
not exceeding one-half of the price of the new shares as additional paid-in
capital, which is included in capital surplus.
Under the Corporate Law, in cases where a dividend distribution of
surplus is made, the smaller of an amount equal to 10% of the dividend
or the excess, if any, of 25% of common stock over the total of additional
paid-in capital and legal earnings reserve must be set aside as additional
paid-in capital or legal earnings reserve. Legal earnings reserve is included
in retained earnings in the accompanying consolidated balance sheets.
In addition, under the Corporate Law, by a resolution of the general
meeting of shareholders, all additional paid-in capital and all legal earnings
reserve may be transferred to other capital surplus and other retained earn-
ings, respectively, which are potentially available for dividends.
The maximum amount that the Company can distribute as dividends
is calculated based on the non-consolidated financial statements of the
Company in accordance with Japanese laws and regulations.
At the general meeting of shareholders held in June 2017, the sharehold-
ers approved cash dividends amounting to ¥25,290 million ($226 million).
Such appropriations have not been accrued in the consolidated financial
statements as of March 31, 2017. Such appropriations are recognized in
the period in which they are approved by the shareholders.
98 East Japan Railway Company

NOTE 20: NET DEFINED BENEFIT LIABILITY
Net defined benefit liability included in the liability section of the consoli-
dated balance sheets as of March 31, 2016 and 2017 consisted of
the following:
1) Movement in Retirement Benefit Obligations
Millions of YenMillions of
U.S. Dollars
2016 2017 2017
B alance at the beginning of the fiscal year ¥709,599 ¥684,526 $6,112
Service costs 28,003 27,489 245
Interest costs 4,382 4,063 36
Actuarial losses (gains) 2,713 (2,270) (20)
Benefits paid (60,309) (62,966) (562)
Past service costs 261 (69) (1)
Other (123) 2 0
Balance at the end of the fiscal year ¥684,526 ¥650,775 $5,810
2) Movements in Plan Assets
Millions of YenMillions of
U.S. Dollars
2016 2017 2017
B alance at the beginning of the fiscal year ¥8,279 ¥8,855 $79
Expected return on plan assets 98 97 1
Actuarial losses (gains) 23 224 2
Contributions paid by the employer 857 768 7
Benefits paid (402) (402) (4)
Balance at the end of the fiscal year ¥8,855 ¥9,542 $85
3) Reconciliation from Retirement Benefit Obligations and Plan Assets to Liability (Asset) for Retirement Benefits
Millions of YenMillions of
U.S. Dollars
2016 2017 2017
Funded retirement benefit obligations ¥ 10,793 ¥ 10,931 $ 97
Plan assets (8,855) (9,542) (85)
1,938 1,389 12
Unfunded retirement benefit obligations 673,733 639,844 5,713
T otal net liability (asset) for retirement benefits at March 31 675,671 641,233 5,725
Liability for retirement benefits 675,784 641,394 5,727
Asset for retirement benefits (113) (161) (2)
Total net liability (asset) for retirement benefits at March 31 ¥675,671 ¥641,233 $5,725
Employees’ severance and retirement benefit expenses included in the
consolidated statements of income for the years ended March 31, 2016
and 2017 consisted of the following:
4) Retirement Benefit Costs
Millions of YenMillions of
U.S. Dollars
2016 2017 2017
Service costs ¥28,003 ¥27,489 $245
Interest costs 4,382 4,063 36
Expected return on plan assets (98) (97) (1)
Net actuarial loss amortization 1,442 1,276 11
Past service costs amortization (316) (688) (6)
Other 47 214 3
T otal retirement benefit costs for the fiscal year ended March 31 ¥33,460 ¥32,257 $288
99Annual Report 2017

FACTS & FIGURES
Notes to Consolidated Financial Statements
NOTE 21: INCOME TAXES
The major components of deferred tax assets and deferred tax liabilities at March 31, 2016 and 2017 were as follows:
Millions of YenMillions of
U.S. Dollars
2016 2017 2017
Deferred tax assets:
Net defined benefit liability ¥206,670 ¥196,033 $1,750
Reserves for bonuses 22,640 22,672 202
Losses on impairment of fixed assets 21,518 21,409 191
Unrealized holding gains on fixed assets 12,902 13,989 125
Allowance for partial transfer costs of railway operation 6,013 6,013 54
Excess depreciation and amortization of fixed assets 5,202 5,233 47
Advances received of insurance proceeds related to earthquake 3,401 5,030 45
Asset retirement obligations 4,492 4,780 43
Loss carry forwards for tax purposes 4,367 4,193 37
Devaluation losses on fixed assets 3,856 3,665 33
Other 48,515 43,979 393
339,576 326,996 2,920
Less valuation allowance (24,897) (25,279) (226)
Less amounts offset against deferred tax liabilities (48,235) (54,098) (483)
Net deferred tax assets 266,444 247,619 2,211
Deferred tax liabilities:
Tax deferment for gain on transfers of certain fixed assets 25,571 27,504 246
Net unrealized holding gains on securities 18,768 21,927 196
Valuation for assets and liabilities of consolidated subsidiaries 2,341 2,315 21
Other 5,109 5,567 49
51,789 57,313 512
Less amounts offset against deferred tax assets (48,235) (54,098) (483)
Net deferred tax liabilities ¥ 3,554 ¥ 3,215 $ 29
5) Adjustments for Retirement Benefit CostsAdjustments for retirement benefit costs (before adjustments in tax effect
accounting) are as follows:
Millions of YenMillions of
U.S. Dollars
2016 2017 2017
P ast service costs that are yet to be recognized ¥ (578) ¥ (619) $ (5)
A ctuarial gains and losses that are yet to be recognized (1,247) 3,770 33
Total balance at March 31 ¥(1,825) ¥3,151 $28
6) Accumulated Adjustments for Retirement BenefitAccumulated adjustments for retirement benefit (before adjustments in tax
effect accounting) are as follows:
Millions of YenMillions of
U.S. Dollars
2016 2017 2017
P ast service costs that are yet to be recognized ¥ 4,125 ¥ 3,506 $ 31
A ctuarial gains and losses that are yet to be recognized 9,614 13,384 120
Total balance at March 31 ¥13,739 ¥16,890 $151
7) Plan Assets
2016 2017
Bonds 7% 7%
Equity securities 30% 30%
Cash and time deposits — —
General account of life insurers 53% 52%
Other 10% 11%
The discount rates are mainly 0.6% in the years ended March 31, 2016 and
2017. The rates of expected return on pension assets used by the
Companies were mainly 1.4% and 1.5% in the years ended March 31, 2016
and 2017, respectively.
The required contributions to the defined contribution plans of the
Company and its consolidated subsidiaries were ¥1,057 million and ¥900
million ($8 million) in the years ended March 31, 2016 and 2017, respectively.
100 East Japan Railway Company

For the year ended March 31, 2016, the actual effective income tax rate differed from the effective tax rate for the following reasons:
2016
The effective tax rate 32.9%
Adjustments:
Effect of tax rate change 3.8
Other, net (0.8)
The actual effective rate after applying tax effect accounting 35.9%
Note: The differences between the aggregate standard effective tax rate and the actual effective rate after applying tax effect accounting were omitted for the year ended March 31, 2017, as the variance between them was less than 5%.
NOTE 22: INVESTMENT AND RENTAL PROPERTY
The Companies own rental office buildings and rental commercial facilities
(hereafter “investment and rental property”) principally within the Company’s
service area. In the years ended March 31, 2016 and 2017, the amounts of
net income related to rental property were ¥70,239 million and ¥73,829
million ($659 million) (rental income is recognized in operating revenues
and rental expense is principally charged to operating expenses), respec-
tively. The amounts recognized in the consolidated balance sheets and fair
values related to investment and rental property were as follows.
Millions of Yen Millions of U.S. Dollars
Consolidated balance sheet amount Fair value
Consolidatedbalance sheet
amount Fair value
2016 Difference 2017 2017 2017 2017
¥592,106 ¥30,298 ¥622,404 ¥1,925,417 $5,557 $17,191
Notes: 1. The consolidated balance sheet amount is the amount equal to acquisition cost, less accumulated depreciation. 2. Regarding difference in the above table, the increases in the year ended March 31, 2017 were principally attributable to acquisition of real estate and renewal (¥47,324 million ( $423 million)),
and the decreases were mainly attributable to depreciation expenses ( ¥23,663 million ( $211million)). 3. Regarding fair values at the end of fiscal year, the amount for significant properties is based on real-estate appraisals prepared by external real-estate appraisers, and the amount for other
properties is estimated by the Company based on certain appraisal values or indicators that reflect appropriate market prices. If after obtaining a property from a third party or since the most recent appraisal there has been no material change in the relevant appraisal values or indicators that reflect the appropriate market prices, the amount is based on such appraisal values or indicators.
4. Because fair values are extremely difficult to establish, this table does not include property that is being constructed or developed for future use as investment property.
101Annual Report 2017

FACTS & FIGURES
Notes to Consolidated Financial Statements
Fiscal 2016 (April 1, 2015 to March 31, 2016) Millions of Yen
TransportationStation Space
UtilizationShopping Centers& Office Buildings
Others(Note 1) Total
Adjustment(Note 2)
Consolidated(Note 3)
Operating revenues:
Outside customers ¥1,954,588 ¥399,960 ¥ 255,979 ¥ 256,673 ¥2,867,200 ¥ — ¥2,867,200
Inside group 53,411 16,090 11,614 377,284 458,399 (458,399) —
Total 2,007,999 416,050 267,593 633,957 3,325,599 (458,399) 2,867,200
Segment income ¥ 348,576 ¥ 35,100 ¥ 71,611 ¥ 35,025 ¥ 490,312 ¥ (2,491) ¥ 487,821
Segment assets ¥6,282,910 ¥207,259 ¥1,060,236 ¥1,169,089 ¥8,719,494 ¥(929,732) ¥7,789,762
Depreciation 277,896 10,301 31,885 39,433 359,515 — 359,515
Increase in fixed assets (Note 5) 420,578 15,337 96,924 37,468 570,307 — 570,307
Notes: 1. “Others” represents categories of business that are not included in reportable segments and include hotel operations, and advertising and publicity services. 2. The ¥(2,491) million ($(22) million) downward adjustment to segment income included a ¥(2,681) million ($(24) million) elimination of unrealized holding gains (losses) on fixed assets and
inventory assets and a ¥196 million ($2 million) elimination for intersegment transactions. Moreover, the ¥(929,732) million ($(8,301) million) downward adjustment to segment assets included a ¥(1,190,930) million ($(10,633) million) elimination of intersegment claims and obligations, offset by ¥261,198 million ($2,332million) in corporate assets not allocated to each reportable segment.
3. Segment income was adjusted to ensure consistency with the operating income set forth in the consolidated statements of income. 4. Segment information on liabilities was omitted from record, as it is not a metric used in deciding the allocation of management resources or evaluating earnings performance. 5. Increase in fixed assets included a portion contributed mainly by national and local governments.
Fiscal 2017 (April 1, 2016 to March 31, 2017) Millions of Yen
TransportationStation Space
UtilizationShopping Centers& Office Buildings
Others(Note 1) Total
Adjustment(Note 2)
Consolidated(Note 3)
Operating revenues:
Outside customers ¥1,959,805 ¥399,679 ¥ 267,638 ¥ 253,680 ¥2,880,802 ¥ — ¥2,880,802
Inside group 53,208 17,435 12,926 383,033 466,602 (466,602) —
Total 2,013,013 417,114 280,564 636,713 3,347,404 (466,602) 2,880,802
Segment income ¥ 326,419 ¥ 32,991 ¥ 75,032 ¥34,978 ¥ 469,420 ¥ (3,110) ¥ 466,310
Segment assets ¥6,307,560 ¥224,782 ¥1,101,036 ¥1,218,731 ¥8,852,109 ¥(940,994) ¥7,911,115
Depreciation 275,234 12,190 34,793 41,912 364,129 — 364,129
Increase in fixed assets (Note 5) 414,644 22,830 72,089 28,653 538,216 — 538,216
NOTE 23: SEGMENT INFORMATION
1) General Information about Reportable SegmentsTransportation, Station Space Utilization, and Shopping Centers & Office
Buildings comprise the Company’s three reportable segments. Each
reportable segment is in turn comprised of business units within the Group
with respect to which separate financial information is obtainable. These
reportable segments are reviewed periodically by the Company’s Board of
Directors and form the basis on which to evaluate business performance
and decide on how to allocate management resources of the Company.
The Transportation segment is primarily engaged in passenger transpor-
tation services centered on railway operations, and railcar manufacturing
operations. The Station Space Utilization segment creates commercial
spaces in railway stations and develops various types of businesses,
including retail sales and restaurant operations. The Shopping Centers &
Office Buildings segment develops railway stations and land near railway
stations, operates shopping centers, and leases office buildings, etc.
2) Basis of Measurement about Reportable Segment Operating Revenues, Segment Income or Loss, Segment Assets, and Other Material Items
The accounting treatment for each reportable segment is largely the same
as that set forth in the “Significant accounting policies (Note 2).” Moreover,
intersegment transactions are between consolidated subsidiaries and
based on market prices and other fair values.
102 East Japan Railway Company
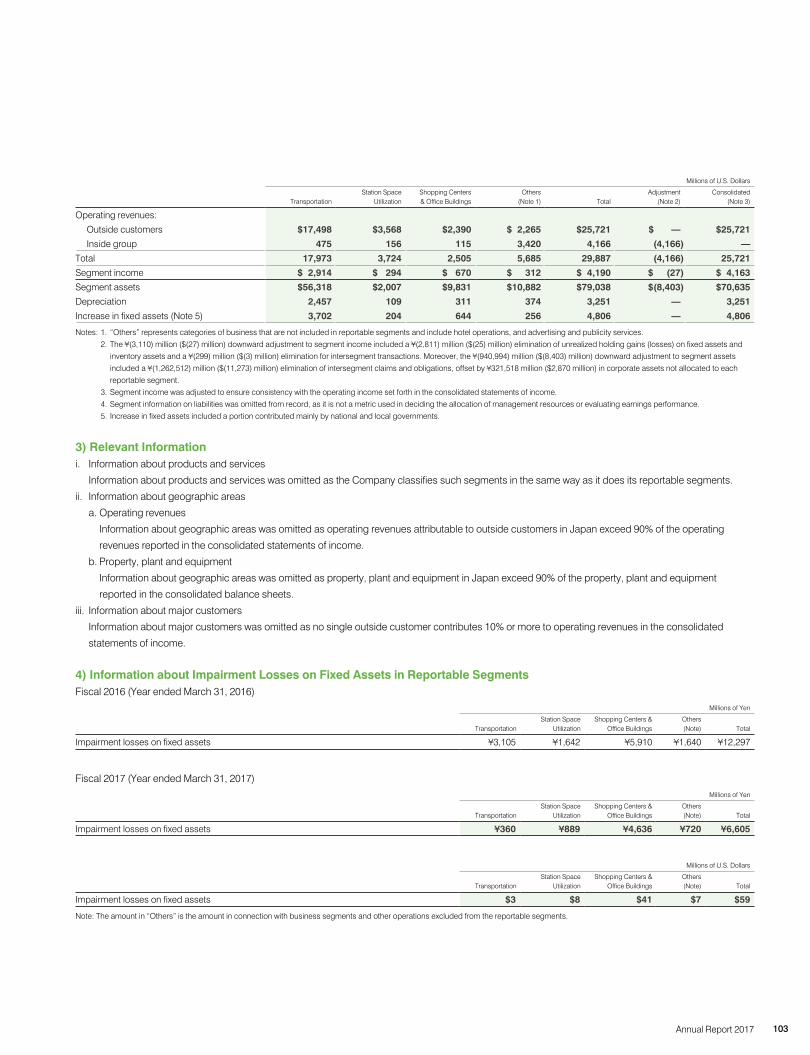
Millions of U.S. Dollars
TransportationStation Space
UtilizationShopping Centers& Office Buildings
Others(Note 1) Total
Adjustment(Note 2)
Consolidated(Note 3)
Operating revenues:
Outside customers $17,498 $3,568 $2,390 $ 2,265 $25,721 $ — $25,721
Inside group 475 156 115 3,420 4,166 (4,166) —
Total 17,973 3,724 2,505 5,685 29,887 (4,166) 25,721
Segment income $ 2,914 $ 294 $ 670 $ 312 $ 4,190 $ (27) $ 4,163
Segment assets $56,318 $2,007 $9,831 $10,882 $79,038 $(8,403) $70,635
Depreciation 2,457 109 311 374 3,251 — 3,251
Increase in fixed assets (Note 5) 3,702 204 644 256 4,806 — 4,806
Notes: 1. “Others” represents categories of business that are not included in reportable segments and include hotel operations, and advertising and publicity services. 2. The ¥(3,110) million ($(27) million) downward adjustment to segment income included a ¥(2,811) million ($(25) million) elimination of unrealized holding gains (losses) on fixed assets and
inventory assets and a ¥(299) million ($(3) million) elimination for intersegment transactions. Moreover, the ¥(940,994) million ($(8,403) million) downward adjustment to segment assets included a ¥(1,262,512) million ($(11,273) million) elimination of intersegment claims and obligations, offset by ¥321,518 million ($2,870 million) in corporate assets not allocated to each reportable segment.
3. Segment income was adjusted to ensure consistency with the operating income set forth in the consolidated statements of income. 4. Segment information on liabilities was omitted from record, as it is not a metric used in deciding the allocation of management resources or evaluating earnings performance. 5. Increase in fixed assets included a portion contributed mainly by national and local governments.
3) Relevant Informationi. Information about products and services
Information about products and services was omitted as the Company classifies such segments in the same way as it does its reportable segments.
ii. Information about geographic areas
a. Operating revenues
Information about geographic areas was omitted as operating revenues attributable to outside customers in Japan exceed 90% of the operating
revenues reported in the consolidated statements of income.
b. Property, plant and equipment
Information about geographic areas was omitted as property, plant and equipment in Japan exceed 90% of the property, plant and equipment
reported in the consolidated balance sheets.
iii. Information about major customers
Information about major customers was omitted as no single outside customer contributes 10% or more to operating revenues in the consolidated
statements of income.
4) Information about Impairment Losses on Fixed Assets in Reportable SegmentsFiscal 2016 (Year ended March 31, 2016)
Millions of Yen
TransportationStation Space
UtilizationShopping Centers &
Office BuildingsOthers(Note) Total
Impairment losses on fixed assets ¥3,105 ¥1,642 ¥5,910 ¥1,640 ¥12,297
Fiscal 2017 (Year ended March 31, 2017)Millions of Yen
TransportationStation Space
UtilizationShopping Centers &
Office BuildingsOthers(Note) Total
Impairment losses on fixed assets ¥360 ¥889 ¥4,636 ¥720 ¥6,605
Millions of U.S. Dollars
TransportationStation Space
UtilizationShopping Centers &
Office BuildingsOthers(Note) Total
Impairment losses on fixed assets $3 $8 $41 $7 $59
Note: The amount in “Others” is the amount in connection with business segments and other operations excluded from the reportable segments.
103Annual Report 2017

FACTS & FIGURES
Notes to Consolidated Financial Statements
NOTE 24: CONSOLIDATED STATEMENTS OF COMPREHENSIVE INCOME
For the Years Ended March 31, 2016 and 2017Amounts reclassified to net income (loss) in the current period that were recognized in other comprehensive income in the current or previous periods and
tax effects for each component of other comprehensive income are as follows:
Millions of YenMillions of
U.S. Dollars
2016 2017 2017
Net unrealized holding gains (losses) on securities:
Amount arising during the year ¥(36,478) ¥13,954 $125
Reclassification adjustments (10) (645) (6)
Sub-total, before tax (36,488) 13,309 119
Tax (expense) benefit 12,418 (4,192) (38)
Sub-total, net of tax (24,070) 9,117 81
Net deferred gains (losses) on derivatives under hedge accounting:
Amount arising during the year (1,747) (148) (2)
Reclassification adjustments (179) (134) (1)
Acquisition cost adjustments 277 311 3
Sub-total, before tax (1,649) 29 0
Tax (expense) benefit 558 (9) (0)
Sub-total, net of tax (1,091) 20 0
Remeasurements of defined benefit plans:
Amount arising during the year (2,951) 2,563 23
Acquisition cost adjustments 1,126 588 5
Sub-total, before tax (1,825) 3,151 28
Tax (expense) benefit 919 (941) (8)
Sub-total, net of tax (906) 2,210 20
Share of other comprehensive income of associates accounted for using equity method:
Amount arising during the year (3,798) 1,707 15
Reclassification adjustments 722 982 9
Sub-total (3,076) 2,689 24
Total other comprehensive income ¥(29,143) ¥14,036 $125
NOTE 25: SUBSEQUENT EVENTS
Change in Segment ClassificationAt the Board of Directors’ meeting held on April 28, 2017, JR East decided to revise its reportable segment classifications to focus on operational headquar-
ters in order to better enforce its management approach based on segments that carry out managerial decision-making.
Accordingly, JR East changed the segment classification used in the fiscal year under review, ended March 31, 2017, which was “Transportation,”
“Station Space Utilization,” “Shopping Centers & Office Buildings,” and “Others,” to “Transportation,” “Retail & Services,” “Real Estate & Hotels,” and
“Others” as of the current fiscal year, ending March 31, 2018.
The information below presents each reportable segment’s operating revenues and segment income in the fiscal year under review if the revised seg-
ment classification was applied.
5) Information about Amortized Amount of Goodwill and Unamortized Balance of Goodwill by Reportable Segments Information about amortized amount of goodwill and unamortized balance of goodwill by reportable segments was omitted as the amount was negligible.
6) Information about Gain on Negative Goodwill by Reportable SegmentsInformation about gain on negative goodwill by reportable segments was omitted as the amount was negligible.
104 East Japan Railway Company
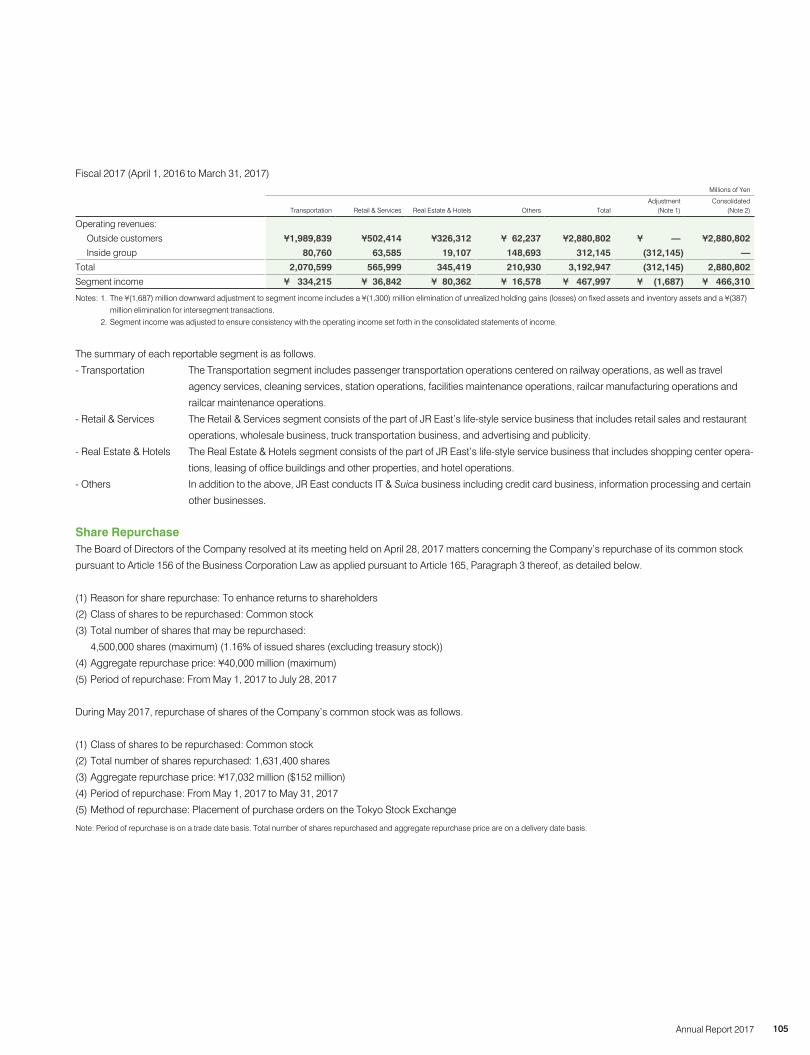
Fiscal 2017 (April 1, 2016 to March 31, 2017) Millions of Yen
Transportation Retail & Services Real Estate & Hotels Others TotalAdjustment
(Note 1)Consolidated
(Note 2)
Operating revenues:
Outside customers ¥1,989,839 ¥502,414 ¥326,312 ¥ 62,237 ¥2,880,802 ¥ — ¥2,880,802
Inside group 80,760 63,585 19,107 148,693 312,145 (312,145) —
Total 2,070,599 565,999 345,419 210,930 3,192,947 (312,145) 2,880,802
Segment income ¥ 334,215 ¥ 36,842 ¥ 80,362 ¥ 16,578 ¥ 467,997 ¥ (1,687) ¥ 466,310
Notes: 1. The ¥(1,687) million downward adjustment to segment income includes a ¥(1,300) million elimination of unrealized holding gains (losses) on fixed assets and inventory assets and a ¥(387) million elimination for intersegment transactions.
2. Segment income was adjusted to ensure consistency with the operating income set forth in the consolidated statements of income.
The summary of each reportable segment is as follows.
- Transportation The Transportation segment includes passenger transportation operations centered on railway operations, as well as travel
agency services, cleaning services, station operations, facilities maintenance operations, railcar manufacturing operations and
railcar maintenance operations.
- Retail & Services The Retail & Services segment consists of the part of JR East’s life-style service business that includes retail sales and restaurant
operations, wholesale business, truck transportation business, and advertising and publicity.
- Real Estate & Hotels The Real Estate & Hotels segment consists of the part of JR East’s life-style service business that includes shopping center opera-
tions, leasing of office buildings and other properties, and hotel operations.
- Others In addition to the above, JR East conducts IT & Suica business including credit card business, information processing and certain
other businesses.
Share RepurchaseThe Board of Directors of the Company resolved at its meeting held on April 28, 2017 matters concerning the Company’s repurchase of its common stock
pursuant to Article 156 of the Business Corporation Law as applied pursuant to Article 165, Paragraph 3 thereof, as detailed below.
(1) Reason for share repurchase: To enhance returns to shareholders
(2) Class of shares to be repurchased: Common stock
(3) Total number of shares that may be repurchased:
4,500,000 shares (maximum) (1.16% of issued shares (excluding treasury stock))
(4) Aggregate repurchase price: ¥40,000 million (maximum)
(5) Period of repurchase: From May 1, 2017 to July 28, 2017
During May 2017, repurchase of shares of the Company’s common stock was as follows.
(1) Class of shares to be repurchased: Common stock
(2) Total number of shares repurchased: 1,631,400 shares
(3) Aggregate repurchase price: ¥17,032 million ($152 million)
(4) Period of repurchase: From May 1, 2017 to May 31, 2017
(5) Method of repurchase: Placement of purchase orders on the Tokyo Stock Exchange
Note: Period of repurchase is on a trade date basis. Total number of shares repurchased and aggregate repurchase price are on a delivery date basis.
105Annual Report 2017

FACTS & FIGURES
Independent Auditor’s Report
106 East Japan Railway Company