management summary (1/2) -...
TRANSCRIPT


2
The global FinTech market is huge: according to estimates from the Statista Digital MarketOutlook the transaction value of the global FinTech markets has reached US$2.6 trillion in2016 and will continue to grow to almost US$7 trillion in 2021.
Digital Payments is the biggest segment with US$2.2 trillion transaction value in 2016,leaving Business and Personal Finance far behind. By 2021 however, Personal Finance willhave grown significantly as more people, especially in developing regions like China, willadopt the new technology to gain access to a financial service system previously barred tothem due to their lower income.
This also leads to China being expected to be the biggest FinTech market from 2017 on witha transaction value of nearly US$3 trillion before the U.S. with US$2 trillion in 2021.
Management Summary (1/2)
The Authors
Various parties are supporting the growth of this promising market, and in 2016 the globalFinTech companies were able to attract US$25 billion in funding deals from thousands ofinvestors.
FinTech business models evolve mainly around reducing transaction costs significantly andthus potentially provide financial advantages to all involved parties. They also lower entrybarriers, e.g. in the Wealth Management market where a lot of offers do not require aminimum investment or only a low one or in the CrowdFunding space where people nowcan get funding that they where not able to get before.
Still, most people in the U.S. and Germany do not know what the term “FinTech” is or means,but a high share of people use widespread services like internet payment providers. Thebiggest barrier to adopt some of the new technologies like Mobile Payments are fear offraud and the worry about data security.
Dev worked in various sectors, such asDigital Marketing, FinTech, Insurance andConsumer Goods after completing hisstudies in New Zealand and London.Ksenia studied Finance in Hamburg andEngineering Management in Russia andjoined Statista after several years inconsulting.
Combined they have over 10 yearsexperience as analysts.
We wish you a valuable and insightfulreading experience.Dev Mehta Ksenia Striapunina

3
Financial technology currently looks very promising when bundled with e-Commerce, asAlibaba’s financial products have demonstrated recently. The largest FinTech investmentdeal in 2016 was secured by Alibaba affiliate Ant Financial, which raised US$4.5 billion andhas been valued by investors at US$60 billion.
Key segments of the FinTech market are:› Blockchain technology developing crypto-currencies and instant transaction solutions› Mobile payments rapidly changing the payment instrument landscape› P2P lending improving small business and private financing and operating at a lower cost
than traditional lenders, i.e. banks› Wealth and portfolio management for personal investors with portfolios of all sizes
Major players in the industry, along with Ant Financial in China are U.S. headquarteredcompanies like Robo-Advisors Betterment and Wealthfront, payment providers Venmo andStripe, and various lenders and loan marketplaces like OnDeck, Prosper, Lending Club andSoFi.
The revenue migration from traditional banking institutions to FinTech companies currentlyremains on a modest level, as young companies are still gaining momentum and growingtheir customer base. Nevertheless, FinTech expansion is now supported by major U.S. banksthat have made a strategic decision to incorporate FinTech solutions into their businessmodel as well.
Management Summary (2/2)
4
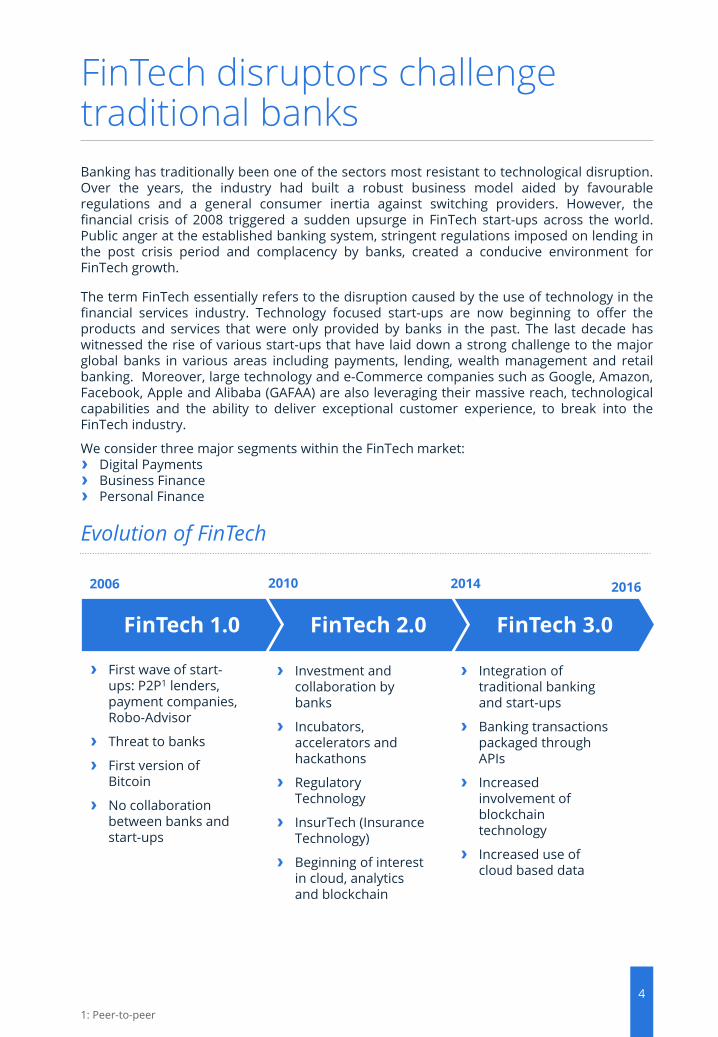
Banking has traditionally been one of the sectors most resistant to technological disruption.Over the years, the industry had built a robust business model aided by favourableregulations and a general consumer inertia against switching providers. However, thefinancial crisis of 2008 triggered a sudden upsurge in FinTech start-ups across the world.Public anger at the established banking system, stringent regulations imposed on lending inthe post crisis period and complacency by banks, created a conducive environment forFinTech growth.
The term FinTech essentially refers to the disruption caused by the use of technology in thefinancial services industry. Technology focused start-ups are now beginning to offer theproducts and services that were only provided by banks in the past. The last decade haswitnessed the rise of various start-ups that have laid down a strong challenge to the majorglobal banks in various areas including payments, lending, wealth management and retailbanking. Moreover, large technology and e-Commerce companies such as Google, Amazon,Facebook, Apple and Alibaba (GAFAA) are also leveraging their massive reach, technologicalcapabilities and the ability to deliver exceptional customer experience, to break into theFinTech industry.
We consider three major segments within the FinTech market:› Digital Payments› Business Finance› Personal Finance
FinTech disruptors challengetraditional banks
Evolution of FinTech
1: Peer-to-peer
FinTech 3.0FinTech 2.0FinTech 1.0
› Investment and collaboration by banks
› Incubators, accelerators and hackathons
› Regulatory Technology
› InsurTech (Insurance Technology)
› Beginning of interest in cloud, analytics and blockchain
› First wave of start-ups: P2P1 lenders, payment companies, Robo-Advisor
› Threat to banks
› First version of Bitcoin
› No collaboration between banks and start-ups
› Integration of traditional banking and start-ups
› Banking transactions packaged through APIs
› Increased involvement of blockchain technology
› Increased use of cloud based data
2006 2010 2014 2016
2016 2017
2,672
3%15%
93%
8%
15.9%2
5%
89%
2020
2,222
2018
3%
3,184
19%
2021
2%
80%
4,644
78%
3%12%
3,708
4,207
4%4%
85%
17%
2019
82%
5
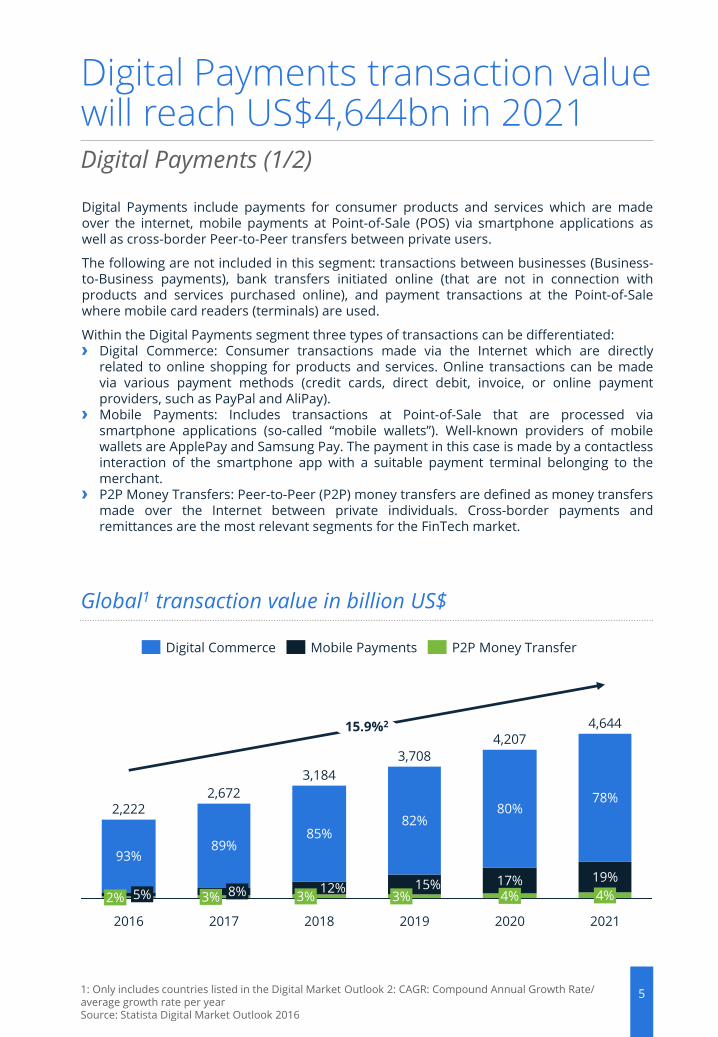
Digital Payments include payments for consumer products and services which are madeover the internet, mobile payments at Point-of-Sale (POS) via smartphone applications aswell as cross-border Peer-to-Peer transfers between private users.
The following are not included in this segment: transactions between businesses (Business-to-Business payments), bank transfers initiated online (that are not in connection withproducts and services purchased online), and payment transactions at the Point-of-Salewhere mobile card readers (terminals) are used.
Within the Digital Payments segment three types of transactions can be differentiated:› Digital Commerce: Consumer transactions made via the Internet which are directly
related to online shopping for products and services. Online transactions can be madevia various payment methods (credit cards, direct debit, invoice, or online paymentproviders, such as PayPal and AliPay).
› Mobile Payments: Includes transactions at Point-of-Sale that are processed viasmartphone applications (so-called “mobile wallets”). Well-known providers of mobilewallets are ApplePay and Samsung Pay. The payment in this case is made by a contactlessinteraction of the smartphone app with a suitable payment terminal belonging to themerchant.
› P2P Money Transfers: Peer-to-Peer (P2P) money transfers are defined as money transfersmade over the Internet between private individuals. Cross-border payments andremittances are the most relevant segments for the FinTech market.
Digital Payments transaction value will reach US$4,644bn in 2021Digital Payments (1/2)
1: Only includes countries listed in the Digital Market Outlook 2: CAGR: Compound Annual Growth Rate/ average growth rate per year Source: Statista Digital Market Outlook 2016
Global1 transaction value in billion US$
Digital Commerce Mobile Payments P2P Money Transfer
6
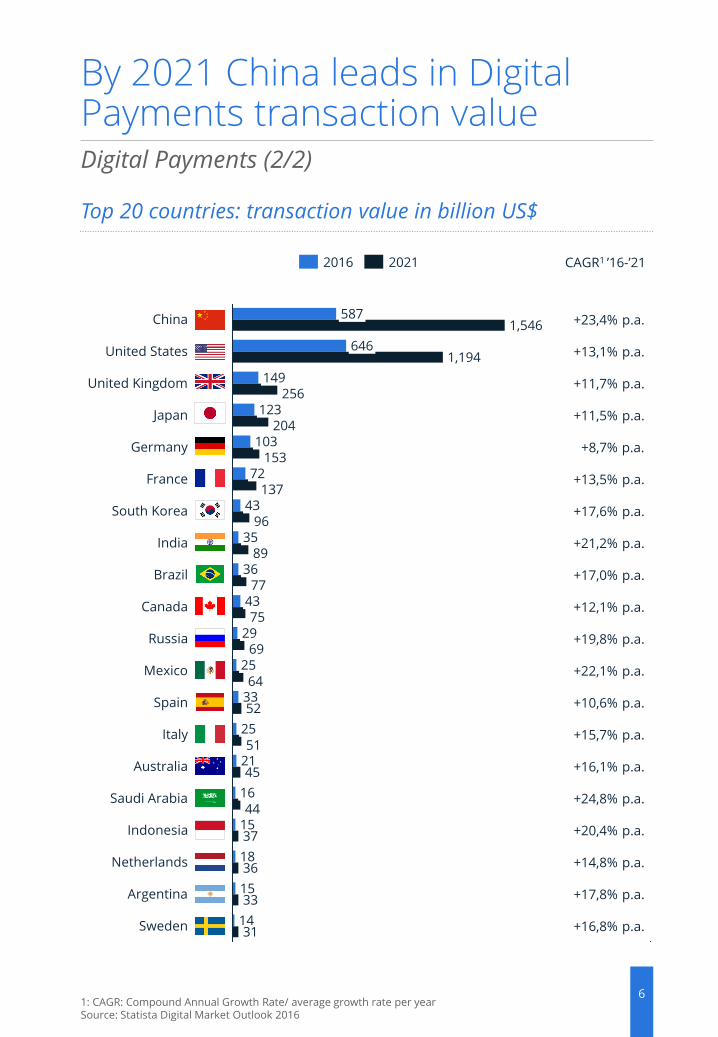
By 2021 China leads in Digital Payments transaction value
Top 20 countries: transaction value in billion US$
Digital Payments (2/2)
1: CAGR: Compound Annual Growth Rate/ average growth rate per year Source: Statista Digital Market Outlook 2016
587
646
China 1,546
31
33
204
United Kingdom
153Germany 103
149
United States
Japan
256
1,194
123
37
36
72
29
25
25
Spain
16
15
18
4396
43
15
14
69
Saudi Arabia
Russia
137
64
77
Australia
89
52
51
35
South Korea
45
Netherlands
44
Canada
33
21
Indonesia
36
France
75
India
Brazil
Mexico
Italy
Argentina
Sweden
2016 2021
+10,6% p.a.
+19,8% p.a.
+15,7% p.a.
+20,4% p.a.
+12,1% p.a.
+17,0% p.a.
+16,8% p.a.
+14,8% p.a.
+22,1% p.a.
+21,2% p.a.
+24,8% p.a.
+17,8% p.a.
+13,5% p.a.
+16,1% p.a.
+17,6% p.a.
+11,5% p.a.
+13,1% p.a.
+23,4% p.a.
+11,7% p.a.
+8,7% p.a.
CAGR1 ’16-’21
7
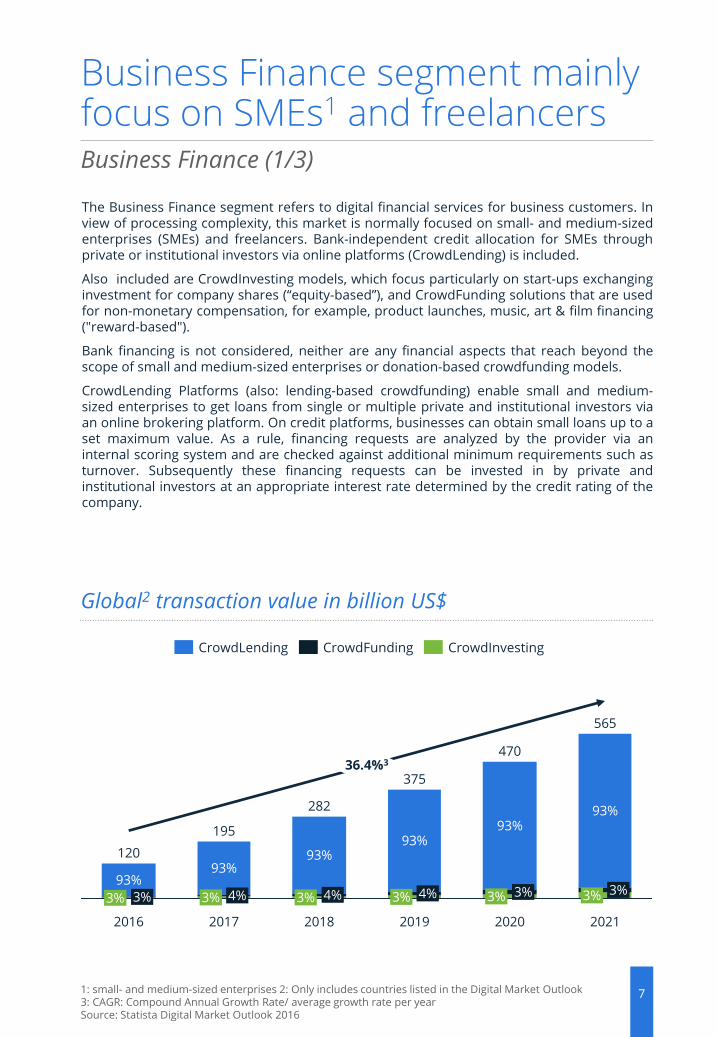
The Business Finance segment refers to digital financial services for business customers. Inview of processing complexity, this market is normally focused on small- and medium-sizedenterprises (SMEs) and freelancers. Bank-independent credit allocation for SMEs throughprivate or institutional investors via online platforms (CrowdLending) is included.
Also included are CrowdInvesting models, which focus particularly on start-ups exchanginginvestment for company shares (“equity-based”), and CrowdFunding solutions that are usedfor non-monetary compensation, for example, product launches, music, art & film financing("reward-based").
Bank financing is not considered, neither are any financial aspects that reach beyond thescope of small and medium-sized enterprises or donation-based crowdfunding models.
CrowdLending Platforms (also: lending-based crowdfunding) enable small and medium-sized enterprises to get loans from single or multiple private and institutional investors viaan online brokering platform. On credit platforms, businesses can obtain small loans up to aset maximum value. As a rule, financing requests are analyzed by the provider via aninternal scoring system and are checked against additional minimum requirements such asturnover. Subsequently these financing requests can be invested in by private andinstitutional investors at an appropriate interest rate determined by the credit rating of thecompany.
Business Finance segment mainly focus on SMEs1 and freelancersBusiness Finance (1/3)
1: small- and medium-sized enterprises 2: Only includes countries listed in the Digital Market Outlook 3: CAGR: Compound Annual Growth Rate/ average growth rate per year Source: Statista Digital Market Outlook 2016
2016 2017
195
3% 4%93%
4%
36.4%3
3%
93%
2020
120
2018
3%
282
3%
2021
3%
93%
565
93%
3% 4%
375
470
3%3%
93%
3%
2019
93%
Global2 transaction value in billion US$
CrowdLending CrowdFunding CrowdInvesting

8
CrowdFunding (also: reward-based crowdfunding) is a financing form independent fromfinancial institutions, location of the campaign creator or investor. Reward-basedcrowdfunding campaigns can be initiated for a wide range of different purposes such asproduct launches, art- and film-financing, scientific research etc. Usually there is a financinggoal defined by funding volume and time to reach this goal for every campaign. Thecampaign creator publishes engaging content (e.g. videos, text) that explains the goal andmotivation of the fundraising. Almost everyone can participate as an investor (prerequisite isonly a valid payment account).
The term CrowdInvesting (also: equity crowdfunding) defines a variety of transactions wherean unspecified number of investors come together in order to invest in a well-definedpurpose. The following segment exclusively considers “equity-based crowdfunding”;investments in equity shares or profit-related returns (for example, royalties or convertibleloans). CrowdFunding has become a popular financing option for startups and is consideredas part of venture capital financing. Well-known platforms in this area are EquityNet,CrowdCube and Seedrs.
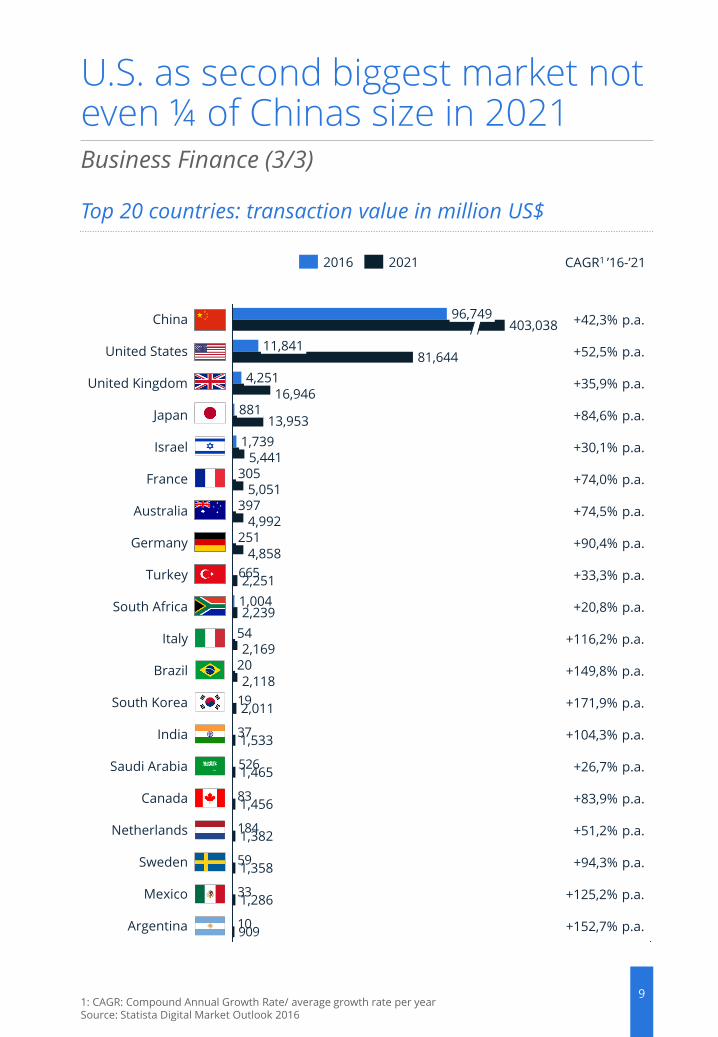
China is by far the biggest marketfor Business FinanceBusiness Finance (2/3)
Source: Statista Digital Market Outlook 2016
Regional split: transaction value in billion US$
2021
348
3263
2016
29
157
5 9
2020
8297
1312
2018 2019
287
2017
222
2039
403
2046
United States China Europe
9
U.S. as second biggest market not even ¼ of Chinas size in 2021
Top 20 countries: transaction value in million US$
Business Finance (3/3)
1: CAGR: Compound Annual Growth Rate/ average growth rate per year Source: Statista Digital Market Outlook 2016
10
33
59
184
83
526
37
19
665
909
India
Turkey
South Korea
2,251
United Kingdom
Australia
11,841
1,533
2,239
Germany
Italy
France 5,051
5,441
13,953
Brazil
4,858
305
16,9464,251
United States 81,644
2,011
2,118
1,739
Japan
403,03896,749
881
2,169
South Africa
4,992
Israel
China
251
1,004
54
20
Argentina
397
Mexico
Sweden 1,358
Netherlands
Canada
1,286
1,456
Saudi Arabia
1,382
1,465
20212016
+42,3% p.a.
+90,4% p.a.
+125,2% p.a.
+52,5% p.a.
+104,3% p.a.
+84,6% p.a.
+30,1% p.a.
+20,8% p.a.
+74,0% p.a.
+94,3% p.a.
+83,9% p.a.
+152,7% p.a.
+116,2% p.a.
+149,8% p.a.
+26,7% p.a.
+171,9% p.a.
+33,3% p.a.
+35,9% p.a.
+74,5% p.a.
+51,2% p.a.
CAGR1 ’16-’21

10
Bank-independent distribution of credit between private borrowers and private orinstitutional investors via online marketplaces (so-called online Peer-to-Peer lendingplatforms) are included in the Personal Finance segment. Automated investment services(Robo-Advisors) that enable private investors to align their investment strategy or portfoliousing automated recommendations are also included.
Online marketplaces for classic bank loans or online brokers without automated orrecommendation-based advisory roles are not included in the Personal Finance market.
Marketplace Lending platforms offer private users the option to place requests for loans inan online marketplace to find private investors who would invest at an appropriate interestrate. Portals such as Lending Club, Zopa, auxmoney and Prosper apply a credit score and listthe financial requests by intended purpose before fixing a lending rate. One or moreinvestors can then serve the credit request. Although banks act in co-operation alongsidethe platform providers, the lending is done, in principle, without direct exposure, risk auditsor the formal requirements normally associated with credit lending. This is attractive formany users because the processes are expedited, there is less demanded in terms of theborrower’s creditworthiness and the conditions are often more flexible than with traditionalbank loans. Users are defined in this case as active borrowers on an online platform;applicants or investors who are only partially recorded as users are not included. Theamount of outstanding, short-term installments or consumer loans recognized during theapplicable year is used as a benchmark.
The Robo-Advisors segment contains private asset management providers who offerautomated online portfolios in which private investors can choose investment volumesdepending on their scope and private appetite for risk. Providers such as Wealthfront,Schwab Intelligent Portfolios and Betterment allow private and/or institutional investors toinvest their money (starting at very small amounts) in pre-existing portfolios which areautomatically managed by individually configured algorithms. The advantage of theseservices lie in the passive role of the investor, who may not want or cannot afford, ongoing,personal monitoring of their portfolio development. Such automated investment servicesallow for the possibility of reaching attractive returns with low starting capital and withoutspecific investment know-how, which stands in contrast to classic investments offered bytraditional banks.
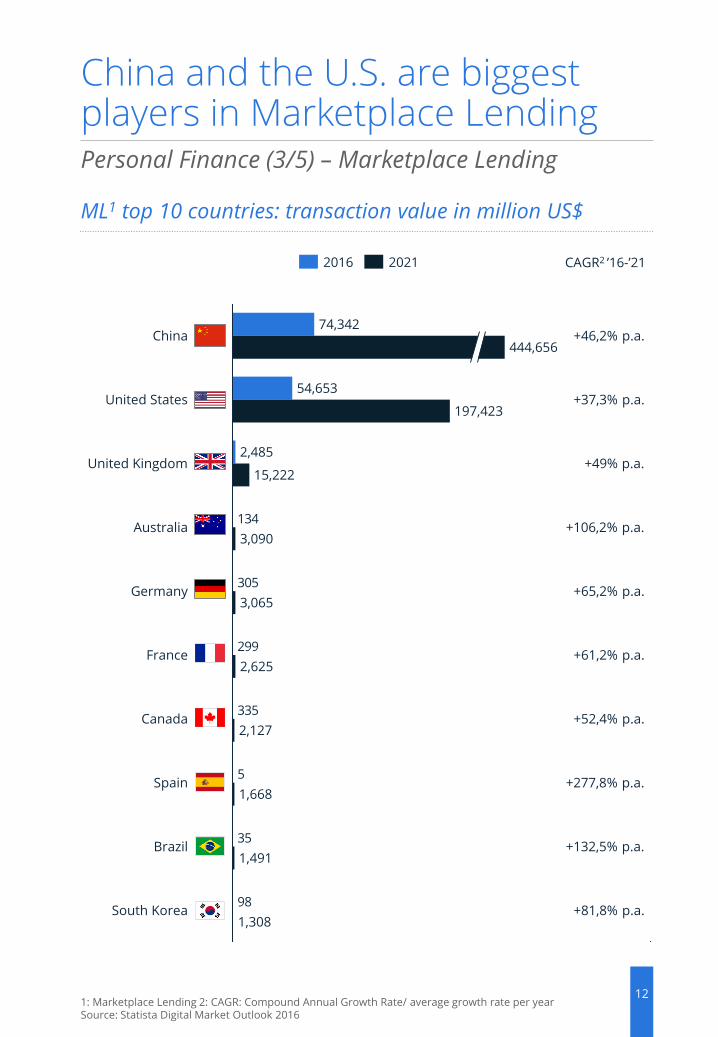
Marketplace Lending grows by almost 40% CAGR1 from 2016 to 2021, reaching a totalglobal2 transaction value of US$689bn. China is expected to be the biggest market withUS$445bn in 2021, followed by the U.S. with almost US$200bn. In all other countriesMarketplace Lending is not expected to be very big. The biggest growth driver is the growingnumber of users as average transaction values grow only by 5% CAGR1 from 2016 to 2021.
Robo-Advisors are expected to reach US$1064bn assets under management in 2021 whichis more than 50% average growth rate per year. Similar to Marketplace Lending the U.S. andChina are the biggest markets with US$510bn and US$468bn assets under managementrespectively. As users grow with 75% CAGR1 from 2016 to 2021 they drive the growth, whilethe average amount of assets under management shrinks by almost 13% average growthper year. This is due to the fact that early adopters are mostly high net worth individualswith a technical affinity, while mass market adoption especially in China and other lower-income countries drives down average investment sizes.
Personal Finance focuses on lending and investment servicesPersonal Finance (1/5)
1: Compound Annual Growth Rate/ average growth rate per year 2: Only includes countries listed in the Digital Market OutlookSource: Statista Digital Market Outlook 2016

2021
32
445
197
2020
2315
340
174
85
6
116
2016 2018
74
3 10
116
55
146
249
20192017
174
2021
547
304
2018
689
417
2020
38.9%2
20192017
209
133
2016
11
Marketplace Lending: China out-paces the U.S. in transaction value
Marketplace Lending: global1 transaction value in billion US$
Marketplace Lending: transaction value in billion US$
Personal Finance (2/5) – Marketplace Lending
1: Only includes countries listed in the Digital Market Outlook 2: CAGR: Compound Annual Growth Rate/ average growth rate per year Source: Statista Digital Market Outlook 2016
China EuropeUnited States
12
China and the U.S. are biggest players in Marketplace Lending
ML1 top 10 countries: transaction value in million US$
Personal Finance (3/5) – Marketplace Lending
1: Marketplace Lending 2: CAGR: Compound Annual Growth Rate/ average growth rate per year Source: Statista Digital Market Outlook 2016
98
35
5
335
299
305
134
South Korea
2,485
China
1,668
United States 54,653
1,308
3,065
Canada
Australia
France
444,656
Spain
Germany
Brazil
197,423
15,222
3,090
2,127
1,491
United Kingdom
74,342
2,625
2016 2021
+81,8% p.a.
+52,4% p.a.
+49% p.a.
+132,5% p.a.
+61,2% p.a.
+277,8% p.a.
+65,2% p.a.
+106,2% p.a.
+37,3% p.a.
+46,2% p.a.
CAGR2 ’16-’21

2021
51
468510
2020
3725
321
436
183
8
266
2016 2018
7 4 1527
112
354
182
20192017
81
2021
820
374
2018
1,064
579
2020
53.2%3
20192017
225
126
2016
13
Europe lags far behind in Robo-Advisory business
Robo-Advisors: global1 total AUM2 in billion US$
Robo-Advisors: total AUM2 in billion US$
Personal Finance (4/5) – Robo-Advisors
1: Only includes countries listed in the Digital Market Outlook 2: Assets under management 3: CAGR: Compound Annual Growth Rate/ average growth rate per year Source: Statista Digital Market Outlook 2016
China EuropeUnited States

14
Despite China‘s growth U.S. still leading in Robo-Advisors in 2021
RA1 top 10 countries: total AUM2 in million US$
Personal Finance (5/5) – Robo-Advisors
1: Robo-Advisors 2: Assets under management 3: CAGR: Compound Annual Growth Rate/ average growth rate per year Source: Statista Digital Market Outlook 2016
336
191
19
62
511
971
4,796
Germany 1,499
Hong Kong 1,970
Belgium 2,316
Australia
Singapore 6,155
Japan 6,511
1,486
Canada 10,990
United Kingdom 34,980
3,350
China
United States 111,653
6,635
467,831
509,555
2016 2021
+83,9% p.a.
+42,5% p.a.
+66,9% p.a.
+42,9% p.a.
+169,6% p.a.
+74,2% p.a.
+69,2% p.a.
+56,4% p.a.
+139% p.a.
+98,3% p.a.
CAGR3 ’16-’21

Marketplace Lending
15
Most prominent FinTech players can be found in Digital Payments
Digital Payments – representative key players
Business Finance – representative key players
Personal Finance – representative key players
CrowdLending CrowdInvestingCrowdFunding
Robo-Advisors
Mobile PaymentsDigital Commerce P2P Money Transfers

16
An online Statista-Survey from 2016 with 1,003 people in the U.S. and 1,004 people inGermany, shows that almost two thirds of U.S. citizens have not heard of the term FinTechbefore and only 14% have a clear idea of what it is. In Germany this difference is even morepronounced with only 6% having a clear idea of it and 76% that have never heard of FinTech.
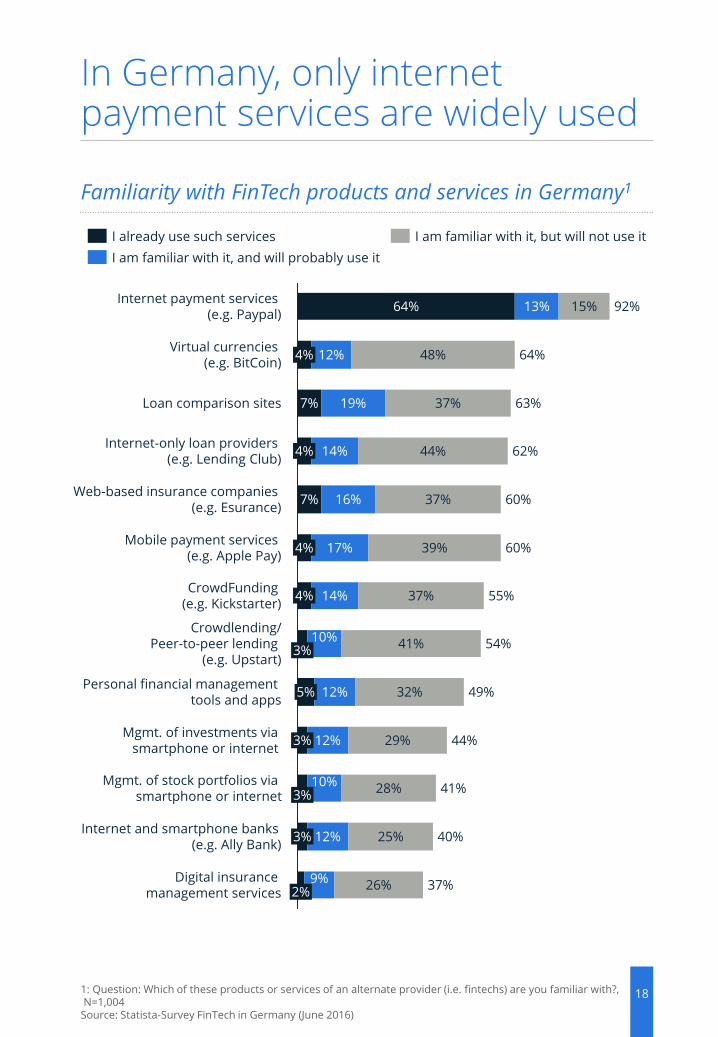
Although a lot of people have not heard of the term “FinTech” before, a lot more knowservices and companies providing FinTech services. 91% of respondents in the U.S. arefamiliar with Internet payment services like PayPal and 82% with Mobile Payment serviceslike Apple Pay. Other FinTech areas like CrowdFunding and –Lending, stock portfoliomanagement or digital insurance management services are less known. In Germany thedifference between familiarity of internet payment services and other FinTech services iseven more pronounced. While 92% are familiar with internet payment services, all otherFinTech products and services are known to less than 64%.
Another interesting difference between the U.S. and Germany is the usage of internetpayment services. While almost the same number of respondents are familiar with theseservices, 64% of Germans use them but only 53% of Americans. This is even more surprisingas the usage of other FinTech products in Germany is well below 10%, while some of themare more commonly used in the U.S., like internet and smartphone banks (44%), investmentmanagement via smartphone or internet (34%) or Mobile Payments (21%).
Awareness of FinTech is low in the U.S., but even lower in Germany
Awareness of the term “FinTech” in the U.S. vs Germany1
1. Question: Have you ever heard of so-called FinTechs before? 2: N=1,003 3: N=1,004Source: Statista-Survey FinTech in the U.S. (September 2016) and in Germany (June 2016)
18%
Never heard of it
23%
14%
76%
6%
63%
Heard of it, and have a clear idea of it
Heard of it, but don’t really know what it is
Germany3U.S.2

17
Almost a quarter of Americans use Mobile Payment services
1: Question: Which of these products or services of an alternate provider (i.e. fintechs) are you familiar with?,N=1,003
Source: Statista-Survey FinTech in the U.S. (September 2016)
Familiarity with FinTech products and services in the U.S.1
24%
21%
31%
Internet and smartphone banks (e.g. Ally Bank)
15%
75%
27% 34%
17%21%
Web-based insurance companies (e.g. Esurance)
25%
22%
26%
15%
58%
73%
12%
29%
82%
30% 69%24%
Internet payment services (e.g. Paypal)
Personal financial management tools and apps
35%
Mobile payment services (e.g. Apple Pay)
19%
91%53%
Mgmt. of investments via smartphone or internet
25%
22%
22%
68%33%
11% 21%
69%
Mgmt. of stock portfolios via smartphone or internet
12%
22%
Virtual currencies (e.g. BitCoin)
51%Digital insurance
management services20% 18%
53%10%
Crowdlending/Peer-to-peer lending
(e.g. Upstart)10% 29%
CrowdFunding (e.g. Kickstarter)
22%
Internet-only loan providers (e.g. Lending Club)
13%
21%
61%
30% 64%
13%
69%37%
Loan comparison sites 12%
I am familiar with it, and will probably use it
I already use such services I am familiar with it, but will not use it
18
In Germany, only internet payment services are widely used
1: Question: Which of these products or services of an alternate provider (i.e. fintechs) are you familiar with?,N=1,004
Source: Statista-Survey FinTech in Germany (June 2016)
Familiarity with FinTech products and services in Germany1
37%
10%
Mgmt. of investments via smartphone or internet
37%26%
Internet and smartphone banks (e.g. Ally Bank)
2%
40%12%
Digital insurance management services
Mgmt. of stock portfolios via smartphone or internet
41%3%
9%
3% 25%
28%
44%3% 12% 29%
Personal financial management tools and apps
49%12% 32%
Crowdlending/Peer-to-peer lending
(e.g. Upstart)54%
3%10%
41%
CrowdFunding (e.g. Kickstarter)
5%
55%4% 14%
Mobile payment services (e.g. Apple Pay)
15%
Internet-only loan providers (e.g. Lending Club)
17%
Loan comparison sites 7%
12%
4% 44%
19%
62%
60%
4% 64%
92%64%
37%
Internet payment services (e.g. Paypal)
60%
7%
14%
39%
63%
Virtual currencies (e.g. BitCoin)
13%
Web-based insurance companies (e.g. Esurance)
4%
37%
16%
48%
I already use such services I am familiar with it, but will not use it
I am familiar with it, and will probably use it

FINTECHStatista Report 2017
FinTech has become an important issue in the financial industry – more and more start-upsare being founded and also big banks increasingly use FinTech products. Most innovations arestill driven by the USA, but China is expected to take the lead in 2017.
Find out how big FinTech is, what business models it involves, what consumers think about itand who the big players in the market are.
Get the report for only $1,950
Market size Business modelsConsumer perspective
Blockchain
Case study: Ant Financial
Company profilesList of US start-ups & banks
in the area of FinTech
Any more questions?Get in touch with us quickly and easily. We are happy to help!
Daven PengCorporate Relations [email protected]
Contact (US) Contact (Europe)
Lodovica BiagiCustomer [email protected]

Released:
ImprintStatista ▪ Johannes-Brahms-Platz 1 ▪ 20355 Hamburg ▪ +49 40 413 49 89 0 ▪ www.statista.com
DisclaimerThis study is based on survey and research data of the previously mentioned sources. The forecasts and marketanalysis presented were researched and prepared by Statista with great care.
For the presented survey data, estimations and forecasts Statista cannot assume any warranty of any kind.Surveys and forecasts contain information not naturally representing a reliable basis for decisions in individualcases and may be in need of further interpretation. Therefore, Statista is not liable for any damage arising fromthe use of statistics and data provided in this report.
June 2017
Dev Mehta has over 10 years of experience working in various capacities forinternational market research, legal and consulting companies. Throughouthis career Dev worked in various sectors such as Defense, Digital Marketing,FinTech, Cards and Payments, Insurance and Consumer Goods.
Dev completed his Post Graduate Diploma from Massey University NewZealand, majoring in Business Management and a Masters in MarketingManagement from Middlesex University, London.
Dev Mehta
Ksenia Striapunina studied Business with focus on Finance in Hamburgand Engineering Management in Perm.
Before joining Statista as an Analyst she gathered experience intelecommunications, working for ER-Telecom and T-SystemsMultimedia Solutions and in financial markets, working as a consultant.
Ksenia Striapunina
Authors, imprint and disclaimer