management practices in manufacturing in mozambique
TRANSCRIPT

Working paper
Management
Practices in
Manufacturing
in Mozambique
Renata Lemos
Daniela Scur
December 2014
Management Practices in Manufacturing in Mozambique
Renata Lemos∗ Daniela Scur†
December 17, 2014
Report for the International Growth Centre (IGC)1
∗University of Cambridge and the Centre for Economic Performance, London School of Economics. Email:[email protected], [email protected]†University of Oxford and the Centre for Economic Performance, London School of Economics. Email:
[email protected], [email protected] partnership with Nicholas Bloom, Raffaella Sadun and John Van Reenen has been particularly
important for the development of this project. We would like to thank IGC Mozambique for financialsupport through the Centre for Economic Performance, LSE.
1

Executive Summary
Introduction: This report explores differences in management practices in the
manufacturing sector in Mozambique. In early 2014, the research team of the World
Management Survey (WMS) implemented a methodology that systematically measures
the quality of management practices at the establishment level. We used an interview-
based evaluation tool that defines and scores a set of 18 basic management practices
from one (“worst practice”) to five (“best practice”) to assess management quality of
108 Mozambican manufacturing firms.
The 18 practices fall into four broad areas:
1. Operations Management: have companies adopted both the letter and the spirit
of modern manufacturing techniques?
2. Performance Monitoring: how well do companies track what goes on inside their
firms?
3. Target Setting: do companies set the right targets, track the right outcomes and
take appropriate action if the two dont tally?
4. Talent Management: are companies hiring, developing and keeping the right peo-
ple (rather than people they could do without) and providing them with incentives
to succeed?
Findings: We use management practices data from Mozambique as well as other
32 developed and developing countries and focus on a comparative analysis of firms
within and across countries. We find four sets of results:
• First, African countries are towards the bottom of the international rank of man-
agement practices, and Mozambique in particular is ranked at the bottom of our
management index. Mozambican firms have only limited monitoring of produc-
tion processes, infrequent, short-term and narrow targets, and relatively ineffec-
tive human-resource management.
• Second, although some firms in Mozambique have high quality management prac-
tices, there is a substantial number of badly-managed firms co-existing with these
2
well managed firms, dragging down the country’s average management scores. In
fact, we show that 89% of Mozambican firms score within the range of the bot-
tom quartile of US firms. However, the spread of management practices within
Mozambique is quite wide, suggesting that while it is possible to implement man-
agement best practices more widely across firms.
• Third, when considering the four areas of management practices separately, we
see that operations management seem to show the largest gap followed by per-
formance monitoring and target setting between Mozambique and other African
countries. When comparing Mozambique with India and China, we observe that,
again, operations, monitoring and targets seem to be significant areas of improve-
ment opportunity. That is, Mozambican firms are lagging behind their peers
within their region and within other emerging economies.
• Fourth, drawing from the previous three results, we observe two factors that can
potentially be determining the low management quality implemented in Mozam-
bican firms: informational barriers and workforce skills.
Recommendations: There remain large gaps between the best and the worst
managed firms in Mozambique. As Mozambique is at the bottom of our management
index, its position and overall productivity could be significantly increased by rais-
ing the management quality of Mozambican firms especially in the lower tail of the
management distribution.
Ways to improve management quality include,
• Improving Workforce Education and Skills: Adapting existing successful initia-
tives within the Technical and Vocational Education and Training (TVET) reform
framework to add a management practices training component such as:
– Offering technical training and workshops to current managers and employees
taking into account and incorporating the types of managerial skills needed
and previously identified in each sector.
3

– Offering government-supported apprenticeships programs in partnership
with private organizations and industry in order to train and develop the
youth workforce and to provide an avenue for matching workforce skills and
firm-specific management practices.
• Closing the Information Gap:
– Creating management demonstration projects, showcasing modern manage-
ment techniques with the aim of enabling managers to envision ways to in-
corporate best practices in their own firms.
– Helping managers critically evaluate their own management practices by us-
ing a diagnostic measurement tool which would allow managers to identify
management performance strengths and areas for improvement.
– Holding workshops about best practices, create easy-to-read publications to
disseminate latest best practices developments.
4

1 Introduction
The causes and consequences of the vast inequality of GDP across countries has been the
subject of research projects for decades and will continue to be so as we dig into the black
box of economic development. One factor long thought to be linked to these differences is the
quality of management practices implemented at the establishment level across industries
and sectors (Bloom et al., 2014). Naturally, the management of an establishment can have a
number of distinctive features. Understanding the diversity in management quality as well
as its relationship with economic performance is a crucial step towards understanding the
emergence and expansion of a sector, as well as its contribution to economic development as
whole.
This report explores differences in management practices in Mozambique. The Instituto
Nacional de Estatistica (INE) reports that the principal sector in the Mozambican economy
continues to be agriculture, representing between 27-29 percent of the GDP in the last
5 years and making a vital contribution to the country’s economy. However, its relative
importance is declining in the face of rapid industrialization in other sectors. In the same
period, INE reports that the manufacturing sector contributes between 10-12 percent of the
GDP (also followed by the transportation industry representing another 10-12 percent of the
GDP). Given the manufacturing sector’s increasing importance in the economy, it becomes
paramount to understand how establishments in this sector are managed across the country.
In early 2014, the research team of the World Management Survey (WMS) implemented
a methodology that systematically measures the quality of management practices at the
establishment level. We used an interview-based evaluation tool that defines and scores a
set of 18 basic management practices from one (“worst practice”) to five (“best practice”)
to assess management quality of 108 Mozambican manufacturing firms.2
The World Management Survey is a decade long initiative aiming to systematically mea-
2For more information and for the full survey grid for manufacturing, seewww.worldmanagementsurvey.org.
5

sure the quality of management practices across countries and industries. After collecting
management data for over 13,000 manufacturing firms around the world,3 we have seen
interesting patterns emerge that start to shed some light on this topic.
Previous studies have found that management practices - defined in terms of monitoring,
targets and incentives - are robustly linked to firm and national performance. In short, these
studies find that, on average, better managed manufacturing firms have higher productivity
(as measured by sales per employee, Tobin’s Q, and ROCE), better managed retail stores have
higher sales per employee performance, better managed hospitals have lower risk-adjusted
heart attack mortality rates, and better managed schools have higher standardized test
scores (Bloom and Van Reenen, 2007; Bloom et al., 2012). Our past research shows that
improving management practices is a highly leveraged means of getting more output from
firms existing labour and capital. Increasing the quality of management, as we measure it,
by one point is the equivalent of a 65% increase in capital, or a 25% increase in labour,
and is true for all companies independent of sector, profitability, past productivity growth
and size. A simple correlation between our country-level aggregated management measure
and the log of GDP (in PPP per capita) shows that our measure does indeed hold some
information about country productivity (Figure 1).
Of course, we do not claim any causal relationship in this report, but the results are
indicative that this is an interesting area to study. The one claim of causality that this
body of research can make comes from a recent field experiment on 28 large Indian textile
factories (Bloom et al., 2013). Free management consulting was provided to a set of randomly
selected treatment plants to help them adopt modern management practices and compared
their performance to another randomly chosen set of control. This experiment revealed
that the adoption of these management practices for monitoring, targets, and incentives was
significant, leading to an average increase in productivity of 18%.4
3The WMS team has also collected management data from nearly 1,100 retail firms, 1,700 hospitals and1,800 schools across countries
4Considering the broader literature on management and productivity, Ichniowski et al. (1997) documenthigher levels of productivity associated with using sets of modern or innovative practices instead of traditional
6

Figure 1: Average management scores and GDP per capita
In this report, we will provide the first set of results for the Mozambican manufacturing
sector using our current dataset as a comparison group. The structure of this report is as
follows: Section 2 describes the methodology of the survey and the data used in this paper.
Section 3 describes the data we collected and the patterns that emerged. Section 4 discusses
two important drivers of management quality: informational barriers and workforce skills.
Section 5 outlines some policy implications of this research and concludes.
practices. They also find that clusters of complementary human resource management practices have largeand positive effects on productivity, while individual work practices show little to no effect on productivity.Black and Lynch (2001) also find similar results when estimating a standard Cobb-Douglas productionfunction with cross-sectional data in the US. More importantly, they find that the manner in which apractice is implemented is more important for the productivity effect than whether the practice is said to beused or not. Bertrand and Schoar (2003) use a panel of manager-firm matched data to isolate the managerfixed effects and find that there are significant patterns that indicate management style is related to managerfixed effects in performance, who in turn are more likely to be in better managed firms.
7

2 Data and Methodology
2.1 Defining and scoring management practices
To measure management practices, the WMS team has developed a new survey method-
ology described in Bloom and Van Reenen (2007). We use an interview-based evaluation
tool, initially developed by an international consulting firm, that defines and scores from one
(worst practice) to five (best practice) a set of 18 basic management practices on a scoring
grid. A high score represents a best practice in the sense that an establishment that adopts
the practice will, on average, improve their performance. The combination of many of these
indicators reflects good management as commonly understood, and our main measure of
management practices represents the average of these 18 scores.
This evaluation tool can be interpreted as attempting to measure management practices
in four broad areas:5
Operations Management
Introducing Lean (Modern) Techniques : Measures how well lean (modern) manufacturing
management techniques have been introduced
Rationale for Introducing Lean (modern) Techniques : Measures the motivation/impetus
behind changes to the operational processes, and whether a change story was well commu-
nicated turning into company culture
Performance Monitoring
Continuous Improvement : Measures attitudes towards process documentation and con-
tinuous improvement
Performance Tracking : Measures whether firm performance is measured with the right
methods and frequency
Performance Review : Measures whether performance is reviewed with appropriate fre-
quency and follow-up
5Note: Survey instruments with full set of questions asked available at www.worldmanagementsurvey.org
8

Performance Dialogue: Measures the quality of review conversations
Consequence Management : Measures whether differing levels of firm performance (not
personal but plan/process based) lead to different consequences
Target Setting
Target Balance: Measures whether targets cover a sufficiently broad set of metrics and
whether financial and non-financial targets are balanced
Target Interconnection: Measures whether targets cover a sufficiently broad set of metrics
and whether financial and non-financial targets are balanced
Time Horizon of Targets : Measures whether targets are tied to the organization’s objec-
tives and how well they cascade down the organization
Target Stretch: Measures whether targets based on a solid rationale and are appropriately
difficult to achieve
Clarity and Comparability of Targets : Measures how easily understandable performance
measures are and whether performance is openly communicated to staff
Talent Management6
Managing Talent : Measures what emphasis is put on overall talent management within
the organization
Rewarding High Performers : Measures whether there is a systematic approach to iden-
tifying good and bad performers and rewarding them proportionately
Removing Poor Performers : Measures how well the organization is able to deal with
underperformers
Promoting High Performers : Measures whether promotion is performance-based and
whether talent is developed within the organization
Retaining Talent : Measures whether the organization will go out of its way to keep its
top talent
Creating a Distinctive Employee Value Proposition: Measures the strength of the em-
6These practices are similar to those emphasized in earlier work on management practices, by for exampleIchniowski et al. (1997) and Black and Lynch (2001).
9
ployee value proposition
2.2 Collecting management practices data
Our research design consisted of a two-step approach. First, we constructed a database
of medium and large-sized firms (employing between 50 and 5000 employees) throughout the
country using online and offline resources. We focus on this size band because these firms
are large enough to benefit from structured management practices as we measure them, but
not too large that they would not rely primarily on local management.
Second, to ensure the collection of accurate responses, we hired students and young
professionals from top universities in the UK who had some business experience and whose
native language was Portuguese. We trained them to conduct the interviews using the same
methodology we have used for the past decade in the WMS. We focused on interviewing
plant managers who were involved in and had full knowledge of the day-to-day running of
the plant7 and had been in their positions with the company for a minimum of one year.
Due to being part of the middle management team, these managers have an overview of their
firm’s overall management practices without being detached from its day-to-day operations.
In Mozambique, interviews lasted for an average of 58 minutes.
In Appendix A, we provide additional information on how we built a sampling frame,
maximized response rates, obtained interviews with managers and collected accurate re-
sponses.
7Enumerators identified plant managers by calling the firm and asking for the person responsible for theday-to-day operations of the plant, and, thus, we focused on the role and job performed by a plant managerinstead of focusing on the title per se.
10

3 Describing Management Practices
3.1 Firm characteristics across countries
Our survey results indicate that the median firm establishment in Mozambique is 18 years
old, employs 109 plant employees, operates in only one site and does not export. Overall,
the median firm in other African countries, Mozambique’s regional competitors, has similar
characteristics to median firm in Mozambique, that is, it is 19 years old, employs 106 plant
employees, operates in only one site and export a very small portion of its production (3%).
For comparison purposes, we also look at the median firm establishment in India and in
China, Mozambique’s international competitors. In India, the median firm is 24 years old,
employs 170 plant workers, operates across 2 plants and exports 15% of its production. In
China, the median firm is 16 years old, employs 500 plant workers, operates in only one site
and exports 30% of its production.
The median firm in the US, used in this report as a benchmark, employs a higher number
of plant workers (145) than the overall Mozambican median firm, is 42 years old, operates
across 4 production plants and exports 10% of its production (Figures 2 and 3).
3.2 Overall management practices
The cross-country ranking for manufacturing management is in Figure 4. The US, Ger-
many, Japan, Sweden have the best management, while southern European countries such
as Portugal, Spain, and Greece, and emerging economies such as Brazil, China and India
have mid to low management practices, on average. While Kenya and Nigeria outperform
the other African countries surveyed, African economies are at the bottom of the ranking,
presenting poor management practices, and Mozambique in particular is ranked at the bot-
tom of our management index. From previous work, we find a strong correlation between
firm size and quality of management, and thus we also control for firm size when present-
ing results on the average management scores across countries in Figure 4b. It is evident
11

Figure 2: Plant age, by country
Figure 3: Plant size, by country
12

that the score changes slightly, but not quite substantially enough to have any effect on its
overall ranking.
Figure 4: Management scores across countries
(a) Average Scores, raw
(b) Average Scores, controlling for size
13

Figure 5 shows a firm-level distribution of management practices by plotting smoothed
(kernel) fits of the data for Mozambique (dark red line), other African countries (range of
blue toned lines) and the Unites States (black line). The black line indicates that there are
very few badly-managed firms in the US while for all lines representing African countries, we
observe a much thicker left tail. As the graph shows, 89% of Mozambican firms score within
the range of the bottom quartile of US firms. Notably, however, Mozambique (as well as
Kenya) has a slightly more dispersed distribution with some (albeit very few) firms reaching
upper 3s-low 4s average scores while Ghana and Ethiopia have quite narrow distributions.
This simple analysis shows that, although some firms in Mozambique have high quality
management practices, there is a substantial number of badly-managed firms co-existing with
these well managed firms, dragging down the country’s average management scores. In fact,
our cross-country dataset indicates that 61% of the differences in management practices is
attributed to the variation across firms within the same country while only 20% is attributed
to the variation between countries. That is, both the overall poor management practices
and, particurlarly, the large differences in management practices within countries could be an
important factor behind the lower levels of development in middle- and low-income countries.
As evident from Figures 4 and 5, we find management practices in Mozambique to be,
on average, poorer than all other countries surveyed. However, the spread of management
practices within Mozambique is quite wide, suggesting that while it is possible to implement
management best practices across firms, for some reason they are not being implemented
more widely. The distribution of firm management practices in Mozambique is distinctive
from that of other African countries whose share of firms scoring above a 3 in our management
index (the right-tail of well-managed firms) seems larger than in Mozambique. Also, the
average management score at the left tail of badly-managed firms in Mozambique seems
to be truncated at 1, that is, a portion of firms present unstructured or poor management
practices across all or most of the 18 management topics measured in our survey.
14

Figure 5: Distribution of management scores
3.3 Management decompositions
As a useful exercise, we decompose our main management quality score into four scores
measuring (i) operations management, (ii) performance monitoring, (iii) target setting, and
(iv) people management - as described in the Data section - to investigate which particular
areas of management are driving low management quality in Mozambique.
Operations measures the degree to which modern manufacturing processes have been
implemented, and the rationale behind implementing these changes. An average score of
1.55 implies that very few, if any, modern processes have been implemented, and if they
have been, they were generally implemented to catch up with competitors rather than to
reach forward-looking business objectives or stay ahead of the curve.
An average score of 2.01 in performance monitoring implies that the average firm lack
measures to track and review their performance in a meaningful way. Instead these firms
might only have some measures in place to roughly inform plant operations and perfor-
mance. Discussions about performance often lack enough information and are conducted
15

infrequently. These firms lack a system to document processes and rarely encourage workers
suggestion and participation in decision making in the day to day running of the business.
In terms of targets, an average score of 2.02 implies that the firms have at least an
informal set of targets, but that these targets that are perhaps ‘broad objectives’ rather
than actionable and measurable targets with clear time frames. For a score above a 3 in
target-setting, firms also need to have a good rationale for benchmarking their targets such
that these targets are challenging yet achievable. However, this is naturally harder to achieve
if the targets are not measurable and actionable in first place.
For higher scores on the targets area of management, firms need to also have a system
where all employees not only understand the targets, but also understand their role in achiev-
ing these targets. For example, having a target that is clear and actionable such as “Increase
ROCE by 1% in the next fiscal year” is very good in terms of being measurable, concrete
and with a timeline attached, but it might only be clear if the employee understands the
concept of ROCE. For a better score here there should be a link created between this target
and individual employees’ day-to-day responsibilities.
Relative to other areas of management, Mozambican firms present a better people man-
agement score on average: 2.21. This score implies that some mechanisms are in place to
identify and reward good and bad performers, albeit it is still a reactive management process.
Figure 6 shows the distribution of each management practice area within firms in Mozam-
bique, indicating that there is a wide dispersion in management quality across all 4 areas of
management across Mozambican firms.
We also compare the four areas of management across the other six African countries
in our dataset – Ethiopia, Ghana, Kenya, Nigeria, Tanzania, and Zambia – in order to
understand Mozambique’s regional context.
When considering the four areas of management practices, we see that the gap between
Mozambique and other African countries is somewhat consistent throughout all four areas,
though operations seem to show the largest gap (Figure 7a) followed by performance moni-
16

Figure 6: Distribution of management scores
toring and target setting. Interestingly, across most countries, people management has the
highest management score (with the exception of Kenya where people management has the
second highest average score and Ethiopia where it has the lowest average score).
When comparing Mozambique with India, China, and the US, two emerging economies
in our dataset and potential international competitors and our benchmark country, we see
that, again, operations, monitoring and targets seems to be significant areas of improvement
opportunity (Figure 7b). Examples of a range of practices across all four areas of management
are described in Appendix B.
4 Drivers of Management Practices
4.1 Informational barriers
An important driver of management quality stems from the manager’s perception of the
quality of management of their establishment. The last question in our survey asks managers
17

Figure 7: Management scores across countries, by area
(a) Mozambique vs other African countries
(b) Mozambique vs India, China and US
18

to score the quality of the management practices in their firm on a scale of 1 to 108, and the
average results are quite telling. Dividing their “own score” in half to match our management
score scale and taking the difference, it is obvious that Mozambican managers believe the
management practices followed by their establishments are substantially better than our
measures would indicate. The main issue this raises is that, if managers are not aware of the
opportunities for improvement, they are not likely to pursue any initiatives to do so. The
gap across countries is shown in Figure 8.
Figure 8: Information gap across countries
4.2 Workforce skills
The level of skills of the workforce may be a potential factor linked to the informational
gap observed in Mozambican firms. Figure 9 shows the percentage of the workforce with
a college degree as reported by the plant manager and indicates very low levels of skilled
8Excluding themselves, of course.
19
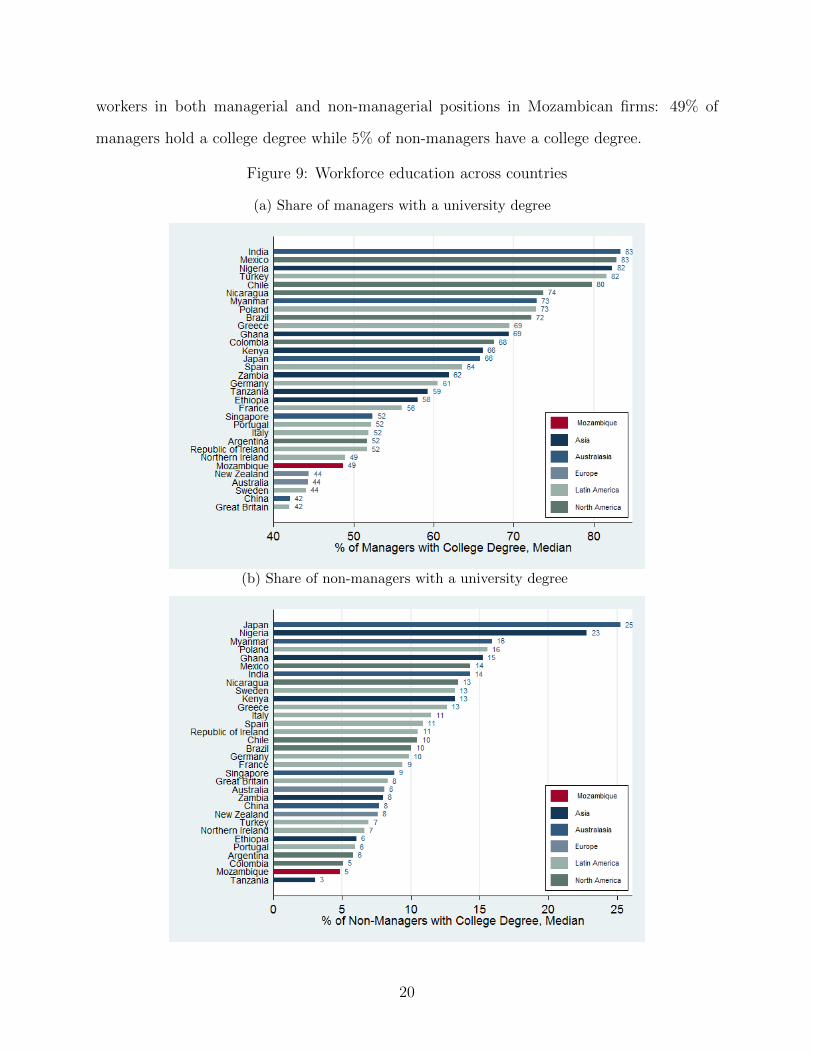
workers in both managerial and non-managerial positions in Mozambican firms: 49% of
managers hold a college degree while 5% of non-managers have a college degree.
Figure 9: Workforce education across countries
(a) Share of managers with a university degree
(b) Share of non-managers with a university degree
20

Given such low numbers, we investigate whether skill set of the workforce is linked to
management quality. Figure 10 shows that a qualified and educated workforce is linked to
better management practices across countries.
Figure 10: Workforce education and management practices
5 Conclusion and Policy Implications
5.1 Policy points
In this report we have taken the first look at the quality of management practices in
Mozambican manufacturing firms. A key question that arises is: why are there so many badly
managed firms? Over years of our research we see a set of 2 related drivers of management
which have direct policy implications in this context.9
9Competition and Ownership are two other main drivers of management. Competition: One of thereasons that the United States has practically no left tail (when compared to Latin American countries) is thatthe level of competition in the US is substantially higher than elsewhere. Competition drives badly run firmsout of the market as the better firms tend to win larger shares of the market and effectively “compete out” thebadly run firms. Policy aimed at fostering competition should thus be given more attention. Ownership:
21

• Skills/education: We find a strong relationship between the share of managers and
workers with college degrees and quality of management. This makes sense when con-
sidering the importance of not just knowledge of best practices, but also of implemen-
tation of these best practices. Cultural changes within companies are only successful
when there is significant buy-in from the employees themselves, and this is often easier
to achieve when workers have higher education levels and can be included in discussions
about these changes.
Thus, creating incentives for continuing education of managers as well as employees
aimed at improving workforce skills and closing the skills gap is an important policy
action point. We can see human capital formation as a longer-term policy strategy
in the general sense of the clear benefits accrued from a more educated populace.
However, there are a few short-term action points as well:
1. Offering technical training and workshops to current managers and employees
taking into account and incorporating the types of managerial skills needed and
previously identified in each sector. For example, a useful management train-
ing program which can be tapped on is the ILO SCORE Training which follows
a methodology that combines classroom training with on-site consultations to
fully address each firms needs. Among other aspects, the ILO SCORE Train-
ing program focuses on basic firm operations management such as encouraging
workplace cooperation, continuous improvement and quality assurance culture,
improved recruitment, identification and development of skills.
2. Offering government-supported apprenticeships programs in partnership with pri-
vate organizations and industry in order to train and develop the youth workforce
We find that founder/family owned--and-managed firms tend to be significantly worse managed than otherfirms. This could be an information story - which we will expand on below - but the key point here isthat founder/family ownership is not the main issue, but rather control. Founder/family firms that have afounder/family member as CEO are at the bottom of the ranking in terms of average quality of managementpractices, but founder/family firms with an external (non-family) CEO are just as good as other privatelyowned firms. We see room for policy development in terms of minority shareholder protection to allow peaceof mind for firm owners to hire professional managers without fear of expropriation.
22

and to provide an avenue for matching workforce skills and firm-specific manage-
ment practices. Competence of apprentices can be assessed through a rigorous
independent body as well as through employer-led standards to ensure that the
specific needs of their industry are being met. For instance, the UK has embarked
on such a strategy, partnering with UKs leading businesses to deliver apprentice-
ships and youth vocational training schemes.
In the context of Mozambique, it is important to emphasize that initiatives to im-
prove management practices can be based on and added as a component to existing
successful programmes run by the National Institute of Employment and Vocational
Training (INEFP) and the Ministry of Education and Culture as well as other insti-
tutions and complement existing government initiatives to tackle labour market needs
within the Technical and Vocational Education and Training (TVET) reform frame-
work. Furthermore, a possible interpretation of our results (despite being unable to
infer causality) suggest that more educated managers are more likely to be aware of
the benefits of introducing or complying with modern management practices and that
more educated non-managers might be more receptive towards the introduction and
more knowledgeable during the implementation of these practices.
• Information: Our research indicates that managers are often unaware they are not
following best practices, as mentioned above. We find that a firm’s human capital, that
is, the stock of competencies and knowledge constituting the skill set of the workforce, is
linked to management quality. This suggests that the unawareness of new management
techniques and the skills gap may be important factors hampering the absorption of
modern management practices in Mozambican firms.
Policies aimed at the diffusion of information regarding best practices in management
across sectors can be the first step towards improving management practices.
1. Creating Management Demostration Projects, providing a live classroom, show-
23

casing modern management techniques which can be observed and learned from,
enabling managers to envision ways to incorporate modern management tech-
niques in their own firms. Successful examples include the US Agriculture Exten-
sion Program and the Japanese Industrial Program.
2. Helping managers critically evaluate their own practices in a non-threatening way
would be particularly beneficial. For instance, the 2013 South African Excellence
Model is a diagnostic measurement tool recently developed in South Africa (based
on the Management Excellence Model (MEG), a business management system
disseminated in Brazil by the National Foundation Quality (FNQ)) that allows
organisations to do a regular self-assessment of their performance, identifying
performance strengths and areas for improvement. The tool has been tailored to
the African context and will be used by the South African Excellence Foundation
(SAEF) to help firms assess their own management practices.
3. Holding workshops about best practices. Officials could provide opportunities and
promote events to collaborate and share best practices techniques and learning
with multiple methods to support the implementation of such practices. Other
points include creating easy-to-read publications to disseminate latest best prac-
tice developments and giving managers a “basic tool pack” to help them get
started (for instance, include an example of a basic profit and loss statement,
or inventory checklist, or guidelines for developing effective targets). The score
for firms in Mozambique are low enough that even these basic and non-capital-
intensive changes could make a large difference.
5.2 Concluding remarks
Using a unique dataset evaluating the quality of management practices in firms across
Mozambique, we present the first snapshot of manufacturing management in the country.
We broadly find Mozambican management practices are, on average, poorer than in the
24

other countries we have surveyed, but with encouraging signs. The spread of management
practices within Mozambique is wide, suggesting there is certainly room for improvement
that is implementable in the Mozambican context.
If we accept the link between firm management and productivity, these findings suggest
that poor management practices could be a factor behind the lower levels of productivity in
many countries. This is also an opportunity for policy development: many improvements
in management practices can be effected with relatively low capital investment, which is
particularly important in middle-income economies. Understanding the drivers of better
management in establishments is a fruitful area for policy development.
The main policy relevance of this academic work stems from the fact that many of the
best practice management changes do not require a high level of physical capital investment,
but rather an investment on the part of the owners/managers to drive a deep culture change
within their firm to change the managerial processes in place.
25

References
Bertrand, M., and Schoar, A. (2003). Managing with Style: The Effect of Managers on Firm
Policies. The Quarterly Journal of Economics 118, 1169-1208.
Black, S.E., and Lynch, L.M. (2001). How to Compete: The Impact of Workplace Practices
and Information Technology on Productivity. The Review of Economics and Statistics 83,
434-445.
Bloom, N., and Van Reenen, J. (2007). Measuring and Explaining Management Practices
Across Firms and Countries. The Quarterly Journal of Economics 122, 1351-1408.
Bloom, N., Benn, E., Mahajan, A., McKenzie, D., and Roberts, J. (2013). Does Management
Matter? Evidence From India. The Quarterly Journal of Economics 128, 1-51.
Bloom, N., Genakos, C., Sadun, R., and Van Reenen, J. (2012). Management Practices
Across Firms and Countries. The Academy of Management Perspectives 26, 12-33.
Bloom, N., Lemos, R., Sadun, R., Scur, D. and Van Reenen, J. (2014). The New Empirical
Economics of Management. Journal of the European Economic Association 12, 835-876.
Ichniowski, C., Shaw, K., and Prennushi, G. (1997). The Effects of Human Resource Manage-
ment Practices on Productivity: A Study of Steel Finishing Lines. The American Economic
Review 87, 291-313.
26

6 Appendix A: Measuring management practices
6.1 Building a sampling frame & maximizing response rates
Given the lack of a publicly available list of firms in the manufacturing sector from
which to draw our sampling frame, we constructed the sampling frame using several online
sources and documents from different entities. Our sampling frame includes lists from the
Ministry of Commerce and Industry, The Mozambique and Portugal Business Chamber,
The Mozambique Exporters Directory, Facim, Acismoz, the USA Embassy in Maputo, and
online business directories. We began by searching for phone numbers for all the firms and
built a sampling frame of firms which we could confirm were active, manufacturing, and had
working phone numbers. Our current sampling frame has 198 companies employing between
50 and 5000 employees in the manufacturing sector in total. Of these firms, we were able to
contact and interview 108.
Particularly given our limited sampling frame, we are encouraged by our very high
response rate. Table 1 shows the survey response rates in Mozambique. “Scheduling in
progress” indicates firms which have been contacted by an interviewer and which have not
refused to be interviewed (for example they may schedule an interview but cancel or post-
pone it or simply take more time to respond). The high share of “scheduling in progress”
firms was due to the need for interviewers to keep a stock of firms to cycle through when
trying to arrange interviews. As the analysts conducted on average 1 interview per day, the
majority of their time was spent trying to contact managers to schedule future interviews.
Unfortunately, the survey ended before these managers could be interviewed, which left large
stocks of initially contacted firms without possibility of following up but were still considered
under the “scheduling in progress” category.
27

Table 1: Response Rates
Sampling frame # of firms Share
Interview conducted 108 54.54%Scheduling in progress 51 25.76%Interviews refused 32 16.16%Not yet eligible 7 3.53%
Total 198 100%
1) “Interviews completed” reports all the companies contacted for which amanagement interview was completed.2) “Scheduling in progress” reports all the companies contacted with no inter-view run nor any manager refusing to be interviewed.3) “Interviews refused” reports all companies contacted in which the managerrefused to take part in the interview.4) “Not yet eligible” reports all companies contacted in which the manager hasbeen in the company for less than one year.
6.2 Obtaining interviews with managers
We used a variety of procedures to obtain a high response rate and to remove potential
sources of bias from our estimates. First, we monitored interviewers’ performance in con-
tacting firms and scheduling interviews. The interviewers were encouraged to be persistent,
that is, they run on average one interview a day lasting approximately 58 minutes each and
spend the remainder of their time repeatedly contacting managers to schedule interviews.
Second, we presented the study as a “piece of work” (never using the word “survey” or
“research”) and the interview as a confidential conversation about management experiences,
starting with non-controversial questions on management practices within the firm. Third,
we sent informational letters, and, if necessary, copies of a World Bank endorsement letter
as well.
6.3 Collecting accurate responses
During the interview itself, we used a double-blind technique by:
1. Conducting a telephone survey without informing the managers that their answers
would be evaluated against a scoring grid and thus, gathering information about ac-
28

tual management practices (as opposed to managers aspirations, perceptions and in-
terviewer’s impressions).
2. Not informing the interviewers about the establishment’s performance. Interviewers
are only provided with the establishment’s name and telephone number.
We also follow several other steps to guarantee the quality of the data such as:
3. Asking open-ended questions until an accurate assessment of the actual management
practices could be made, for example, on the first performance monitoring dimension we
start by asking the open question “what kinds of indicators do you use for performance
tracking”, rather than closed questions such as “do you use indicators for performance
tracking” which may lead to a yes/no answer. The second question on the performance
monitoring dimension is “how frequently are these measured? Who gets to see this
data?” and the third is “If I were to walk through your plant could I tell how your are
doing against your indicators?” The combined responses to this dimension are scored
against a grid which goes from 1, defined as “Measures tracked do not indicate directly
if overall business objectives are being met. Tracking is an ad-hoc process (certain
processes aren’t tracked at all).”, up to 5, defined as “Performance is continuously
tracked and communicated, both formally and informally, to all staff using a range
of visual management tools.” The interviewers are also encouraged to ask follow-up
questions beyond the ones we give them as guides, whenever necessary.
4. Ensuring that each interviewer conducted a minimum amount of interviews in order
to correct any inconsistent interpretation of responses.
5. Double-scoring, i.e, having another interviewer silently listening and scoring the re-
sponses provided by the managers during the interview to be discussed with the pri-
mary interviewer.
6. Collecting a series of noise controls on the interview process itself (such as the time of
29

day and the day of the week), characteristics of the interviewee and the identity of the
interviewer. We include these controls in the regression analysis to help improve the
precision of our estimates by reducing some of the measurement error.10
10To check the methodology at the project’s inception, in the 2006 manufacturing wave we re-surveyed5% of the sample collected using a second interviewer to independently interview a second plant manager inthe same firm. Two independent management interviews on different plants within the same firms shouldhelp to reveal how consistently we are measuring management practices within that firm. In the sample of222 additional interviews, we found that the correlation of the score between our independently run firstand second interview was 0.51. Part of this difference across plants within the same firms is likely to be realinternal variations in management practices, with the rest presumably reflecting survey measurement error.However, the correlation across the two interviews is highly significant (p-value 0.001). This suggests thatwhile some substantial noise exists in our interview process there are significant differences in managementquality across firms.
30

7 Appendix B: Examples of management practices
7.1 Lean Operations
Best practice example: Lean processes are fully implemented across all areas of the firm,
and have been in place for several years. Lean is part of the culture of the company, and
was introduced as a means of achieving the business objectives of the company and thus
be the best in the industry. The employees of the firm constantly analyse the production
process as part of their normal duties. Critical areas of production are thoroughly analysed
in regular meetings aimed at the continued improvement of processes in the firm. Every
problem is registered in a special database that monitors critical processes and each issue
must be reviewed and signed off by a manager.
Intermediate example: The firm has introduced some lean processes, but these are limited
to a certain area in the firm, or are in start-phase. The implementation of such processes is
geared towards reducing costs, and thus increasing the efficiency of the production process.
Employees identify problems in the production process, and possible solutions are discussed
in regular meetings involving employees and a manager.
Weak example: The firm has not introduced any lean or modern processes, retaining a
traditional form of management. The firm has no formal or informal mechanism in place
for either process documentation or improvement. The manager mentioned that production
takes place in an environment where nothing has been done to encourage or support process
innovation.
7.2 Performance Management
Best practice example: The firm tracks performance using a good range of indicators,
which are measured formally and continuously. Records are updated automatically in com-
puter systems which all staff can access. Various visual systems around the plant allow
staff to check their performance against the indicators. Performance is reviewed is regular
31

meetings involving the senior management, resulting in action plans for each issue raised in
the meetings. The results of all meetings and the details of actions plans are communicated
to all staff. Action plans are monitored continuously to ensure adequate progress.
Intermediate example: The firm has a range of performance indicators that are tracked
daily and measured in regular meetings involving the senior management. Staff has access to
performance data, which is published on the company server. This is updated monthly. The
manager responsible regularly checks up action plans resulting from these meetings, with
action taken to rectify potential problems.
Weak example: The firm tracks its performance using only volume as an indicator. Senior
management sees this data, but it is not communicated to the rest of the staff. Performance is
reviewed informally, with meetings being called to deal with specific problems in production.
Little or no action is taken to rectify problems or delays in a plan.
7.3 Target Management
Best practice example: The firm has a good balance of financial and non-financial targets
which are considered key to the long-term success of the firm, and which are regularly revised
to reflect economic changes and ensure achievability. These goals are cascaded through the
firm down to the individual worker. The goals and targets are clearly communicated to
encourage individual workers to compare their performance against their targets and to
encourage competition.
Medium example: The firm has some concrete non-financial goals that form part of the
managers appraisal, but these are not a priority. Performance measures and targets are clear
and are broken down to department level. Targets are set taking into account a variety of
factors that will affect their achievability, such as availability of raw materials and machine
capability. Team or department performance is made public and is accessible to all staff.
Weak example: The firms goals are exclusively financial and operational, and are largely
of a short-term nature. The firm has general goals that are not cascaded down through the
32

firm, staff being mostly unaware of their targets. Targets are generally surpassed, and are
set based on the managements experience.
7.4 Talent management
Best practice example: Attracting and developing talent at all levels of the firm is for-
malized through targets and rewards. Both managers and non-managers are paid on a
performance basis, and are given both financial and non-financial rewards for achieving their
targets. Regular reviews are in place to assess each individual employees performance, and
identify the best and worst performers. Underperformers are put on performance improve-
ment plans immediately. The best performers are given personalized career plans to develop
the skills necessary for growth within the firm. The firm has a policy of offering the best
opportunities for top performers within the firm, as well as for top prospective employees.
Medium example: Senior management in the firm believes that attracting and developing
talent is important, but managers are not held accountable for it. All staff are regularly
evaluated and are paid based on their individual performance. Underperformers are identified
through these reviews and are removed or moved to less critical positions in the firm. The
best performers are identified, and are identified as potential candidates for promotion.
Weak example: The firm has no system to attract or develop talent. Both managers and
workers are paid equally regardless of their performance and there are no consequences for
poor performance beyond some disciplinary measures (workers are never fired). The firm
has not got a promotion system in place as there is very little room for growth and no one
has been promoted in years.
33

Designed by soapbox.co.uk
The International Growth Centre (IGC) aims to promote sustainable growth in developing countries by providing demand-led policy advice based on frontier research.
Find out more about our work on our website www.theigc.org
For media or communications enquiries, please contact [email protected]
Subscribe to our newsletter and topic updates www.theigc.org/newsletter
Follow us on Twitter @the_igc
Contact us International Growth Centre, London School of Economic and Political Science, Houghton Street, London WC2A 2AE