management practices, competition, innovation and the ......daniel ershov university of toronto...
TRANSCRIPT

Management Practices, Competition, Innovation and the Performance of Enterprises in Canada
Dany Brouillette, Industry Canada Daniel Ershov, University of Toronto Working Paper 2014-02
ECONOMIC RESEARCH AND POLICY ANALYSIS BRANCH
Working Paper Series

This publication is also available online in HTML: http://www.ic.gc.ca/eic/site/eas-aes.nsf/eng/h_ra02343.html. To obtain a copy of this publication or an alternate format (Braille, large print, etc.), please contact: Economic Research and Policy Analysis Branch Industry Canada C.D. Howe Building 235 Queen Street Ottawa, ON Canada K1A 0H5 Telephone: 343-291-2627 Facsimile: 613-991-1261 and E-mail: [email protected]
Permission to Reproduce
Except as otherwise specifically noted, the information in this publication may be reproduced, in part or in whole and by any means, without charge or further permission from Industry Canada, provided that due diligence is exercised in ensuring the accuracy of the information reproduced; that Industry Canada is identified as the source institution; and that the reproduction is not represented as an official version of the information reproduced, nor as having been made in affiliation with, or with the endorsement of, Industry Canada. For permission to reproduce the information in this publication for commercial purposes, please contact the: Web Services Centre Industry Canada C.D. Howe Building 235 Queen Street Ottawa, ON Canada K1A 0H5 Telephone (toll-free in Canada): 1-800-328-6189 Telephone (Ottawa): 613-954-5031 Fax: 613-954-2340 TTY (for hearing-impaired): 1-866-694-8389 Business hours: 8:30 a.m. to 5:00 p.m. (Eastern Time) Email: [email protected] © Her Majesty the Queen in Right of Canada, represented by the Minister of Industry, 2014 Cat. No. Iu172-1/2014-2E-PDF ISBN 978-1-100-24707-6
Aussi offert en français sous le titre Pratiques de gestion, concurrence, innovation et performance des entreprises au Canada.

Management Practices, Competition, Innovation and the Performance of Enterprises inCanada
The views and opinions expressed in the report are those of the authors alone and do not represent, in anyway, the views or opinions of the Department of Industry or of the Government of Canada.
Dany BrouilletteIndustry Canada*
Daniel ErshovUniversity of Toronto
Abstract
Using data from the Survey of Innovation and Business Strategy 2009, a management practices index ( )à la Bloom and Van Reenen (2007) is built to analyze the relationships between management practices,competition, innovation and firm performance in Canada. The results show that the distribution of varies among industries and that large firms tend to have more structured management practices. A positivecorrelation between ( ) and the intensity of sales and profits is found for manufacturing firms. There isalso a positive correlation between ( ) and business innovation, a result that holds for enterprises in allsectors. Finally, the importance of competition depends on how it is measured: the number of competitors in theenterprise's main market is associated with a higher intensity of sales and profits, while it is the entry of newcompetitors in the main market that matters for innovation.
Final version: July 25, 2013
Now with the Bank of Canada*
1

Table of Contents
4.1 Determinants of the MPindex
4.2 Relationships between Sales, Profits and MPindex
4.3 Relationships between Innovation and MPindex
A.2 Details on MPindex
Appendix D. Detailed Results
2
1. Introduction2. Analytical Framework
2.1 Construction of the Management Practices Index
2.2 Determinants of MP
2.3 MP and Labour Productivity
2.4 MP and Innovation
3. Data
4. Results
5. Conclusion
References
Appendix A. The Management Practices Indices
A.1 Comparison of MP Indicators from the BVR survey and the SIBS
Appendix B. Variables Definition
Appendix C. Descriptive Statistics (weighted)

1. Introduction
A number of recent reports by industry observers highlight that Canada's lagging performance in terms ofproductivity growth is associated with the low levels of business innovation (Competition Policy Review Panel,2008; Expert Panel on Business Innovation, 2009; Drummond and Bentley, 2010; Expert Review Panel onResearch and Development, 2012). Several possible causes have been put forward such as industry structure,subpar investments in tangible capital, small market size, "business complacency" and the low importanceattributed to education by Canadian managers. The last two factors are of particular interest as they areintangible in nature. Also falling in this intangible assets category, are management practices (MP).
The role of MP in the success of enterprises has long been recognized in economics and other social sciences (seefor example Huselid, 1995). And put by Alchian and Demsetz (1972), "efficient production… is a result not ofhaving better resources but in knowing more accurately the relative productive performances of those resources."
The recent empirical work by Bloom and Van Reenen (2007) defines a tractable framework for measuring MP andassessing their relationship with firm performance. MP, and more generally intangible assets, may be animportant factor explaining the persistent productivity differentials observed across countries, but also within acountry in narrowly defined industries (Bartelsman and Doms, 2000; Syverson, 2004a,b, 2011). If firms in asame industry are observed to use the same inputs and technologies and face the same level of competition, thenthere must be something else affecting their productivity. Supporting the view that MP matter for productivity,Bloom et al. (2012b) estimated that better MP of US firms accounts on average for 30 percent of the total factorproductivity differential between the US and other countries such as France, the UK, Sweden and Germany.
Manufacturing enterprises in Canada fare well compared to their counterparts located in other countries. Only USenterprises have better MP compared to those in Canada (Institute for Competitiveness and Prosperity, 2009).Bloom and Van Reenen (2010) showed that the US has the lowest proportion of badly managed enterprisescompared to any other countries, including Canada. Moreover, there is no statistical difference between averageMP in Canada, Germany, Sweden and Japan, while Canada is outperforming the UK and France, among others.From a broad perspective, Bloom (2010) mentioned that the marketplace framework in Canada is favourable tothe implementation of good MP due to, for example, the high levels of competition and low market regulation.Firms in Canada, however, should make better use of skilled workers.
The objective of this paper is to determine the relationships between MP, firm performance and innovation usinga framework similar to the one developed by Bloom and Van Reenen (2007). There are three main researchquestions: i) what are the firms' characteristics associated with better structured MP; ii) what is the relationshipbetween MP and firm performance; and iii) what is the relationship between MP and innovation. Answering thelast question is one of the main contributions of the paper as very little evidence exists on the link between MPand innovation. In addition to MP, the role of competition in firm performance and innovation is also considered.This analysis is based on the data from the Survey of Innovation and Business Strategy 2009 (SIBS) and otheradministrative sources (Statistics Canada).
The main results can be summarized as follows: i) the distribution of the management practices index
differs by sector; ii) the variables positively correlated with include firm size, percentage of
workers with a university degree, the presence of a multinational in the enterprise's main market and whetherthe head office is located in the United States; iii) is positively correlated with sale and profit intensityfor manufacturing enterprises only; iv) is positively correlated with innovation—no matter howinnovation is defined—for enterprises in all industries; and v) the links between competition, performance andinnovation depend on the nature of competition. More precisely, the number of competitors in the enterprise mainmarket is positively correlated with higher performance but it is the entry of new enterprises that matter forinnovation.
The rest of the paper is organized as follows. The analytical framework is presented in the second section whilethe data discussion is in the third one. Section 4 shows the results and Section 5 concludes.
3

(1)
(2)
2. Analytical Framework
2.1 Construction of the Management Practices Index
The used in this paper is based on the framework introduced by Bloom and Van Reenen (2006, 2007)(BVR). SIBS provided an opportunity to collect additional MP data for Canada and linked them to economicindicators such as sales, profits and innovation. Most SIBS questions on MP were derived from the BVR survey onMP. This allowed to build a similar but not identical .
The main contribution of BVR was to develop a comprehensive and tractable framework to analyze MP. The BVRindex is based on four types of indicators referring to a specific aspect of MP: operational practices, monitoring ofperformance, target setting and incentives. See the Appendix in Bloom and Van Reenen (2007) for more details.
The BVR work can be linked to several strains of the economic literature: management style (Bertrand andSchoar, 2003); innovative work practices (Ichniowski et al., 1997; Macduffie, 1995; Osterman, 1994); workersempowerment (Cappelli and Neumark, 1999); incentives pay (Lazear, 2000; Bandiera et al., 2007); hiringpractices (Oyer and Schaefer, 2011; Autor and Scarborough, 2008); total quality management (Powell, 1995);and information and communication technologies use (Black and Lynch, 2001; Bresnahan, 1999; Bresnahan etal., 2002; Bloom et al., 2012a).
The SIBS MP index is built for 2009 using 19 indicators. Each indicator has been normalized between
zero and one, the latter denoting the best practices and zero the worst. A simple average is taken, as shown byEquation (1), so also ranges from zero to one. has at least one element in each type ofindicator of the BVR index, but as shown in Section A.1 of Appendix A, the coverage is unequal.
All SIBS MP questions were used, except for the share of workers with a university degree (Q63) and the oneabout who set the pace of work to achieve production performance targets (Q57). Exclusion of these variables arebased on the fact that it is unclear which response should be attributed a higher score. Q63 was neverthelessincluded as a separate variable in the regression analysis.
The normalization process is specific to each indicator and is consistent with the spirit of the BVR framework. SeeSection A.2 for more details on the normalization rules used (Appendix A).
Apart from the contents, the other main difference between the BVR survey and the SIBS is the way data werecollected. BVR used face-to-face interviews to collect in-depth information on the firm MP. In contrast,paper/electronic questionnaires were used for the SIBS. Because of their collection method, BVR can argue thattheir index is effectively a proxy for the quality of a firm's MP, but this is less clear for the SIBS. Therefore, theresults are going to be interpreted as "more structured MP" rather than as "better MP." This interpretation isborrowed from Bloom et al. (2013), who also used MP data from a paper/electronic MP survey in the US.
The differences listed in this section raises the question of comparability between the BVR and the SIBS MP index.Comparison of the non-parametric distributions from Figure 2 in Bloom (2010) and Figure 2 shows that, overall,both indices yield similar distributions for manufacturing enterprises. The only noticeable difference is theseemingly fatter tails in Figure 2.
2.2 Determinants of MP
The first part of the regression analysis examines the relationship, at the firm level, between and anumber of characteristics such as firm size and the degree of competition the firm faces. The relationship takesthe following linear form (for 2009):
4

Firms are denoted by and the usual error term. is a vector of firm characteristics that includes workerseducation and binary variables for firm size, firm structure, industry and province. See Appendix B for a detaileddescription of all variables used in this analysis. The inclusion of most of these variables is justified given resultsfrom the BVR literature. Bloom (2010) and Institute for Competitiveness and Prosperity (2009) are especiallyrelevant because of their focus on Canada.
Bloom (2010) found that large firms in Canada have the best MP, a evidence supported by SIBS data as shown inFigure 1. There is a clear pattern suggesting that the larger the enterprise, the more structured their MP.
average is 0.40 for small enterprises and 0.66 for the x-large, while the average for medium and largeones are around 0.55. It is however unclear which factor is the cause. Large enterprises may need to implementgood MP to conduct efficiently their operations, but it may be that good MP are required for growth. As for theother variables, the results must be interpreted as correlations, not causal effects. This applies to all relationshipsestimated in this paper and to other works in the BVR literature apart from Bloom et al. (2011).
Structure and ownership of the enterprise also matters for MP. Multinational enterprises (MNE) were found byBloom and Van Reenen (2010) to have better MP compared to other enterprises. In this paper, a set of binaryvariables for the location of the headquarters (HQ) outside Canada is used as a proxy for MNE status. A countryof control variable was also available, but it was so closely correlated with HQ variables that it could not beincluded. Note that the drawback of using the HQ variables is their inability to distinguish between a MNE and anon-MNE that both have their HQ in Canada. Another binary variable indicating the multi-establishment status ofthe enterprise was included as Bloom et al. (2013) reported that multiple establishment enterprises tend to havebetter MP. Finally, family-owned and managed enterprises are the worst managed compared to dispersedshareholders and private equity ownership (Van Reenen, 2011; Bloom and Sadun, 2009). Unfortunately,ownership information was not available in the SIBS.
Education is summarized by the percentage of workers with a university degree . Unfortunately, theSIBS did not collect data on managers' education. Bloom et al. (2013) showed that the magnitude of thecorrelation between MP and the workers' education is similar to the one between MP and managers' education.This means that the estimated coefficient of may be overestimated.
Figure 1: Distributions for by firm size– Weighted densities, total sample N = 4,227 –
Source: Survey of Innovation and Business Strategy 2009Note: Firm sizes are based on individual labour units.
5

The original BVR framework focussed on manufacturing enterprises, but a project was developped in collaborationwith the Institute for Competitiveness and Prosperity to extend their framework to the retail sector. They foundthat in Canada, the US and the UK, manufacturing enterprises are better managed compared to retail sectorenterprises (Institute for Competitiveness and Prosperity, 2010). SIBS data are again consistent with thisevidence as shown in Figure 2. It is shown that the left tail of the distribution for non-manufacturing enterprisesis much fatter compared to one for manufacturing enterprises. Given the difference between sectors, alldescriptive statistics and regression analyses are going to be presented for manufacturing and non-manufacturingsector separately.
Caution must, however, be exercised with non-manufacturing data because the SIBS coverage for this sector isnot as comprehensive as for the manufacturing sector. For example, out of a population of 13,280 enterprises inthe retail trade sector, only 26 were sampled (for more details see Appendix A of Industry Canada, 2011). Incontrast, a third of all manufacturing enterprises in the target population (4,394 out of 12,846) were included inthe sample. This implies that some non-manufacturing enterprises have large sampling weights that should bekept in mind when analyzing the results.
Despite this potential issue with sampling weights, it is possible to further decompose the distributionby two-digit NAICS industry. Two conclusions can be drawn from Figures 5, 6, 7 and 8 in Appendix C. First, thereis a lot of variation in within a sector, no matter which sector is considered. Second, there is muchmore variation among the distributions of non-manufacturing sectors compared to two-digit manufacturingsectors. As mentioned in the previous paragraph, part of these results are due to small sample sizes and highsampling weights for non-manufacturing industries.
The ICAP report on retail also reported that the relationships between MP and size, MNE status, education andownership have the same sign as in the manufacturing sector. In addition, the authors found that US-owned retailenterprises in Canada are better managed compared to Canadian-owned. Other non-manufacturing sectorsstudied by BVR, in separate initiatives, are health care services and school (Bloom et al., 2010).
Competition was found to be an important determinant of MP by BVR. Bloom et al. (2012b) mentioned thatcompetition may affect MP through at least two mechanisms. First, this can happen through reallocation of
Figure 2: Distributions of by sector– Weighted densities, total sample N = 4,227 –
Source: Survey of Innovation and Business Strategy 2009
6

(3)
resources toward better managed enterprises. In other words, competition drives badly managed enterprises outof business. Second, competition may reveal information about competitors' MP. This causes managers to revisetheir "over-optimistic" perceptions of their own performance and to increase managerial efforts. Overall, BVRfound that more competition is associated with better MP.
Competition in the BVR literature is measured by the number of competitors, the penetration rate of imports andthe Lerner index. In this study, the vector includes four indicators of competition related to theenterprise's main market: the number of goods that compete against the enterprise's highest selling product; thepresence of a MNE; the number of competitors; and the entry of new competitors. The main market of anenterprise is defined as the geographic area from which the highest share of revenue from its highest sellingproduct is derived. 1 Figure 3 shows that enterprises facing a MNE in their main market tend to have morestructured MP. This is, again, consistent with the BVR results mentioned previously. In addition to , aLerner index is also included in Equation (2) as done in Bloom and Van Reenen (2006). A sensitivity analysis wasalso conducted for the Lerner index and it was bounded to a -10 to 1 interval.
2.3 MP and Labour Productivity
This part aims to estimate the relationship between MP and performance of enterprises operating in Canada,controlling for environmental factors and firm characteristics. The relationship estimated is given by:
denotes the performance of the enterprise in 2008, either measured by sales over employment (sales) orprofits over employment (profits). The estimated parameter , is expected to be positive as in the BVRliterature (see for example Bloom and Van Reenen, 2010). Note that while SIBS data are only available for 2009,sales and profits for 2009 were not timely available. It is thus assumed that MP were consistent between the twoyears. In addition to the variable in , the ratio of capital over employment (cap) is also included. It is as thesum of tangible and intangible assets over employment.
Figure 3: Distributions of by presence of MNE– Weighted densities, total sample N = 4,227 –
Source: Survey of Innovation and Business Strategy 2009
7

(4)(5)
There is some evidence in the empirical literature that competition increases productivity. For example, Nickell(1996) reported that the increase in the number of competitors is associated with significantly higher total factorproductivity growth. Aghion et al. (2009) suggested that entry of new firms may increase productivity growth, butonly in industries that are close to the technology frontier. Griffith et al. (2010) also show that the increasedcompetition in the European Union, measured by the level of profitability, had a positive impact on productivitygrowth. However, Blanchflower and Machin (1995) did not find much evidence to support a positive relationshipbetween competition and productivity growth. This suggests that different measures of competition matter forfirm performance, which justify the inclusion of the variables in Equation (3).
Equation (3) is estimated using the ROBUSTREG SAS procedure which uses residuals from an initial linearregression to identify the outliers and leverage points. Based on these residuals, a set of weights is produced andapplied to the data and the model is estimated using an iterative algorithm. 2 Consequently, each outlier and badleverage point receives a lower weight, which can be set to zero in extreme cases. Finally, observations for whichthe sales to employment ratio was equal to zero were removed, but negative profits were allowed.
2.4 MP and Innovation
There is some evidence in the non-BVR literature that other intangibles, such as human capital and organizationalchanges, are positively related to innovation (Becheikh et al., 2006). Using the Workplace and Employee Surveyfrom 1999–2006, Dostie and Paré (2013) showed that both firm-sponsored classroom and on-the-job traininglead to more innovation in Canada. Arvanitis et al. (2013) found similar results for Switzerland for human capitaland organizational changes. There are no results on the relationship between innovation output and MP in theBVR literature, but Bloom et al. (2013) reported a positive correlation between R&D (innovation input) and MP forUS establishments.
SIBS data suggest that innovation and MP are indeed positively associated. Figure 4 clearly shows thatenterprises that have introduced innovation tend to have more structured MP compared to non-innovators. Tofurther investigate this relationship, the following empirical specifications were estimated:
In Equation (4), I is a binary variable capturing whether the enterprise innovated from 2007–09. An innovator isdefined as an enterprise that introduced any of the usual four types of innovation: process (PRCS), organizational(ORGZ), product (PRDT) or marketing (MRKT). The vector X contains the same variables as for Equation (2) plusR&D expenditures in 2004—results are robust to other definitions of R&D, 2004–06 average for instance—and thenumber of advanced technologies used by the enterprises in 2009. As µi is assumed to be normally distributed, soa simple Probit is used to estimate the relationship.
8

For Equation (5), three additional definitions of innovation were used: i) technological (PRCS–PRDT) versusnon-technological (ORGZ–MRKT); ii) PRCS–ORGZ versus PRDT–MRKT; iii) and PRCS, ORGZ, PRDT and MRKT.Innovation variables remained binary variables, but sets of parameters were estimated. It was assumed that were normally distributed and correlated with each other, so multivariate Probits were used to estimateEquation (5). It was expected that some of will be positive, but it was unclear whether this relationship were tochange depending on the type of innovation.
The impact of competition on innovation is not clear from the literature. Aghion et al. (2001) showed that anincrease in product market competition has a positive impact on innovation. Similarly, Aghion et al. (2009) notedthat entry of competitors spurs innovation in industries close to the technology frontier, a result that reflects theirresult for productivity. However, Boone (2000) reported that the effect of competition on innovation depends onthe relative efficiency of the enterprise compared to its competitors. Therefore, in light of this brief overview ofthe literature, it is unclear what to expect about the relationship between and .
Figure 4: Distributions of by innovator status– Weighted densities, total sample N = 4,227 –
Source: Survey of Innovation and Business Strategy 2009
Suppose that an enterprise's highest selling product revenue is distributed as follows: 45 percent comes from Canada, 25percent from the US and 30 percent from the rest of the world. The main market for this enterprise is thus Canada.
1
These weights should not be confused with sampling weights. Both types of weights were used in this paper.2
9

3. Data
Most variables were derived from the Survey of Innovation and Business Strategy 2009 (SIBS). The SIBS targetpopulation included all enterprises with at least 20 employees and $250,000 of revenue in NAICS 11 to 56, butmanufacturing enterprises were oversampled. The statistics and results presented in this paper are weighted, sothe results can be generalized to the target population. The SIBS final sample consists of 4,227 enterprises.
Data on MP, competition intensity (except the Lerner index), innovation and use of advanced technology weretaken from the SIBS. In addition, some control variables such as location of head office and the share of workerswith a university degree were also extracted from the SIBS. The other control variables were derived from theBusiness Register (province of location, industry and multi-establisment status).
SIBS data needed to be supplemented by information from other Statistics Canada administrative databases.Sales, profits, assets (tangible and intangible) and cost of goods sold variables were extracted from the GeneralIndex of Financial Information database. Dollars variables were expressed in $M and were deflated using theNational Account Productivity price index (KLEMS) produced by Statistics Canada.
Employment was extracted from the Longitudinal Employment Analysis Program database. The individual labourunit (ILU) was used to construct all employment variables, including firm size. ILU is not a count of the number ofemployees, but a constructed variable reflecting the share of employment attributable to an enterprise. Forexample, if an employee works in two enterprises and derived half of his salary from each, ILU is equal to 0.5 forboth enterprises for this employee.
The Research and Development in Canadian Industry database provides data on R&D expenditures. As a practicalmatter for the year 2004, this database was a census of all R&D performers in Canada, so any missingobservation was considered to be a zero.
4. Results
4.1 Determinants of the
Table 1 summarizes the results from the regression of on firm characteristics and competitionindicators. The full set of estimated parameters is presented in Table 4 of Appendix D. Overall, results are fairlyrobust across sectors and consistent with the BVR literature.
Firm size is one of the most important variables. Consistent with the evidence in Figure 1, there is a positiverelationship between firm size and and the magnitude of the estimated parameters increases with size.These results hold for both sectors and estimated parameters for the non-manufacturing sector are larger.Enterprises with a higher percentage of workers with a university degree tend to have morestructured MP. The location of head office also matters, especially if it is located in the US. The multipleestablishments variable is negatively correlated with for non-manufacturing enterprises only.
10

Table 1: Summary of Eq. (2): Determinants of – Dep. var.: , weighted OLS regressions –
Variable Manufacturing Non-manufacturing– Characteristics –
MEDIUM 0.1025 0.1544LARGE 0.1083 0.1827XLARGE 0.1873 0.2378%LARGE 0.0018 0.0026HQ_US 0.0586 0.0943HQ_EU 0.0668 0.0543HQ_ROW 0.0199 -0.0994MULTI 0.0083 -0.0211
– Competition variables –MNE 0.0587 0.1022#COMP -0.0081 -0.0006ENTRY 0.0143 -0.0306#GOODS 0.0006 0.0106LERNER -0.0063 0.0998Estimated parameters significant at a 0.10 level or less are in bold.Detailed results are presented in Table 4 of Appendix D.
In terms of competition, the presence of a MNE in the enterprise's main market for its highest selling product ispositely correlated with . Few other competition variables are found to be significant. For themanufacturing sector, there is a negative relationship between the number of competitors in the main market
and as in Bloom and Van Reenen (2007). For non-manufacturing enterprises, a positivelink has been identified between the Lerner index and . Exclusion of the Lerner index does not havemuch impact as shown in Table 4.
4.2 Relationships between Sales, Profits and
Table 2 summarizes the results for sales and profits regressions. The full set of estimated parameters ispresented in Table 5 of Appendix D. The main difference between sectors relates to as the estimatedcoefficient for this variable is positive and significant for manufacturing enterprises, but not fornon-manufacturing enterprises.
One possible explanation for this result is the heterogeneity among enterprises outside the manufacturing sector.Complementary evidence on this heterogeneity is provided in Figures 6 to 8 in Appendix C. These figures showthat, at least in terms of MP distributions, non-manufacturing industries are less similar among themselvescompared to the three-digit manufacturing industries (Figure 5). The results may also be driven by somenon-manufacturing enterprises with large sampling weights—the SIBS coverage being much less comprehensiveoutside the manufacturing sector.
11

Table 2: Summary of Eq. (3): Economic performance and – Dep. var.: sales and profits (intensity), weighted robust regressions –
Manufacturing Non-manufacturingVariable Sales Profits Sales Profits
– Characteristics –cap + + + +
+ + MEDIUM + + –XLARGE + – –LARGE + – – –%UNIV + + +HQUS + + + +HQEU + + HQROW – MULTI + + + +
– Competition Variables –MNE + – –#COMP + + +ENTRY – –#GOODS – – –+/−: significant at a 0.10 level or less.Detailed results are presented in Table 5 of Appendix D.
To further investigate this issue, Equation (3) was estimated for two additional non-manufacturing sectorsgroupings: resources-based and best-managed. The first group includes NAICS 11 (agriculture), 21 (mining andoil and gas extraction), 22 (utilities) and 23 (construction). The second is a grouping of NAICS 52 (finance andinsurance) and 54 (professional services), which are the two services sectors with the highest average(Figure 7). The estimated coefficient for (not shown here) is negative and significant in the salesregression for the best-managed group and in the profits regression for the resources-based group. While theseresults seems to confirm the importance of heterogeneity and the effect of the sampling strategy used, it is hardto explain why the sign for is negative.
A second explanation for the non-significance of in Table 2 is that the SIBS MP questions were lessappropriate for non-manufacturing activities. Testing of the questionnaire revealed that respondents innon-manufacturing enterprises had more difficulty answering some of these questions. A different framework forthe non-manufacturing sector would have been better, as in Institute for Competitiveness and Prosperity (2010)for the retail trade sector—but this was not possible to implement at the time SIBS was developed. In turn, thissuggests that may not accurately measure the extent of MP in non-manufacturing industries.
Turning to the competition indicators, the results in Table 2 indicate that facing more competitors (#COMP) isassociated with better performance while a higher number of goods competing with the enterprise's highest sellingproduct (#GOODS) has the opposite effect. Presence of a MNE and entry of new competitors are also negativelycorrelated with profits in both sectors. Two conclusions can be drawn from the competition results. First, not allaspects of competition correlate in the same way with firm performance. Second, profits seem more sensitive tocompetition compared to sales.
Among the other variables, the estimated coefficient of asset-to-employment ratio cap has a positive sign in allspecifications, which is also the case for HQ_US (head office located in the United States) and MUTLI(multi-establishments). The percentage of workers with a university degree is positively correlated withperformance, except for the sales regression for manufacturing enterprises. Finally, performance increased withfirm size only for manufacturing enterprises in the sales regression.
12

4.3 Relationships between Innovation and
Table 3 summarizes the results from the innovation regressions. Column (1) shows the results for the generalindicator of innovation; Column (2) shows the ones for technological and non-technological innovations;Column (3) shows the results for the PRDT–MRKT and PRCS–ORGZ innovation groupings; and the last columnshows them for the four types of innovation. All estimated parameters are presented in Tables (5) to (7) inAppendix D.
The most important result is the estimated positive correlation between and innovation. This holds formanufacturing enterprises no matter how innovation is measured and for most indicators for non-manufacturingenterprises. This is an important result because it shows how critical MP is for innovation even when accountingfor other control variables such as innovation inputs, firm size, enterprise structure and competition indicators.
13

Table 3: Summary of Eq. (4) and (5): Innovation and – Dep. var.: see table, weighted Probit –
Manufacturing
Variable(1) (2) (3) (4)
INNO TECH NTECH PD–MK PC–OG PRCS ORGZ PRDT MRKT– Characteristics –
+ + + + + + + + +RD ADVTECH + + + + + – MEDIUM – – LARGE – – –XLARGE – – + + + +%UNIV + + + +HQ_US – – HQ_EU + – HQ_ROW – – – – – MULTI –
– Competition Variables –MNE + + + #COMP – – – ENTRY + + + + + + + + +#GOODS + + + +
Non-Manufacturing
Variable(1) (2) (3) (4)
INNO TECH NTECH PD–MK PC–OG PRCS ORGZ PRDT MRKT– Characteristics –
MP + + + + + +RD + ADVTECH + + + + + + MEDIUM + LARGE + – + + +XLARGE – + + + %UNIV HQ_US – + + HQ_EU HQ_ROW – MULTI – – – –
– Competition variables –MNE + + + + + #COMP – + – – ENTRY + + + + + + +#GOODS – – – +/–: significant at a 0.10 level or less.Detailed results are presented in Tables 5, 6 and 7 of Appendix D.
14

Of the two inputs to innovation, R&D expenditures (RD) and the number of advanced technologies used(ADVTECH), only the latter is found to be positively correlated with innovation. For manufacturing enterprises, thisrelationship holds for all aggregated measures of innovation as shown by Columns (1), (2) and (3). In contrast,for non-manufacturing enterprises, the results suggest that ADVTECH is positively correlated with PRCS, ORGZand PRDT innovations.
RD is significant only for technological innovation introduced by non-manufacturing enterprises (Column (2)).Although a similar result was found in Brouillette (2013), R&D is nevertheless still important for innovation inCanada. It is likely that R&D expenditures affect indirectly innovation, for example, through the use of advancedtechnology.
The influence of the competition indicators depend on how competition is measured. The most striking result isthe entry of new competitors in the enterprise's main market for its highest selling product. The estimatedparameters for ENTRY is systematically positive and significant for all types of innovation in the manufacturingsector regressions and for almost all cases in the nonmanufacturing sector regressions, a result consistent withAghion et al. (2009). Another aspect of competition that is positively correlated with innovation is the presence ofa MNE in the enterprise's main market although fewer significant relationships were found. Results are consistentfor both manufacturing and non-manufacturing sectors. The link between the number of competitors (#COMP) inthe main market is negative overall for both sectors. This contrasts with the results for the performance analysiswhere this variable was found to have a positive and significant sign.
The results also show that a small number of positive estimated correlations between innovation and %UNIV werefound in the manufacturing sector, but no such association was found in the non-manufacturing sector. This is incontrast to the results of the performance analysis where %UNIV is more important for non-manufacturingenterprises.
The relationship between firm size and innovation is less clear. Compared to small ones, large and x-largenon-manufacturing enterprises are more susceptible to innovate, but results depend on the innovation indicatorused. Results are even more mixed for manufacturing enterprises. Finally, the links between innovation and thelocation of headquarters and multi-establishment status are mostly negative.
5. Conclusion
This analysis confirms the presence of a positive correlation between firms' financial performance and businessinnovation and well structured management practices (MP). This study also provides evidence on the role playedby competition.
The results show large differences in MP distribution across industries. Firm size, presence of a multinationalenterprise (MNE) in the enterprise’s main market, head office located in the United States and the percentage ofworkers with a university degree are the main determinants of MP. In terms of firm performance, MP arepositively correlated with the intensity of sales and profits in the manufacturing sector, but not in thenon-manufacturing sector. In contrast, MP are important for all industries when it comes to innovation. Finally, therole of competition depends on its nature and to a certain extent of the industry considered. The presence of aMNE and entry of new competitors are positively correlated with innovation, while it is the number of competitorsthat is important for firm performance.
From a policy perspective, this analysis highlights the importance of intangible capital for firm performance andbusiness innovation. While this analysis focusses on MP, other intangibles such as managers’ education,investments in skills and intellectual property management are perhaps equally important for growth andinnovation. More research at the enterprise-level on theses intangibles is needed to better understand theirinteractions with productivity growth. This would allow better support to enterprises so that they can achieve theirfull potential.
Two caveats should be mentioned. The first one relates to data limitation for performance indicators. As describedin Section 3, the last year available for these data was 2008. Since most SIBS data cover 2009 only—this is thecase for MP and competition indicators—the implicit assumption made is that these variables did not changebetween 2008 and 2009.
15

The second caveat is about the endogeneity of the MP index. Although this is acknowledged as a serious issue, itwas not possible to address it in this paper for lack of instruments. This may change with the availability of theSIBS 2012 data in 2014. By combining the 2009 and 2012 waves, this will provide a measure of the change inmanagement practices that could be compared to the change in firms' performance or innovation.
16

References
Aghion, Philippe, Christopher Harris, Peter Howitt, and John Vickers (2001) 'Competition, Imitation and Growthwith Step-by-Step Innovation.' Review of Economic Studies 68(3), 467–492.
Aghion, Philippe, Richard Blundell, Rachel Griffith, Peter Howitt, and Susanne Prantl (2009) 'The Effect of Entry onIncumbent Innovation and Productivity.' Review of Economics and Statistics 91(1), 20–32.
Alchian, Armen A., and Harold Demsetz (1972) 'Production, Information Costs, and Economic Organization.'American Economic Review 62(5), 777–795.
Arvanitis, Spyros, Euripidis N. Loukis, and Vasiliki Diamantopoulou (2013) 'Are ICT, Workplace Organization andHuman Capital Relevant for Innovation? A Comparative Study Based on Swiss and Greek Micro Data.' KOFWorking Paper No. 333.
Autor, David H., and David Scarborough (2008) 'Does Job Testing Harm Minority Workers? Evidence from RetailEstablishments.' Quarterly Journal of Economics 123(1), 219–277.
Bandiera, Oriana, Iwan Barankay, and Imran Rasul (2007) 'Incentives for managers and inequality amongworkers: Evidence from a firm-level experiment.' The Quarterly Journal of Economics 122(2), 729–773.
Bartelsman, Eric J., and Mark E. Doms (2000) 'Understanding Productivity: Lessons from Longitudinal Microdata.'Journal of Economic Literature 38(3), 569–594.
Becheikh, Nizar, Réjean Landry, and Nabil Amara (2006) 'Lesson from Innovation Empirical Studies in theManufacturing Sector: A Systematic Review of the Literature from 2993–2003.' Technovation 26(5–6),644–664.
Bertrand, Marianne, and Antoinette Schoar (2003) 'Managing with Style: The Effect of Managers on FirmsPolicies.' Quarterly Journal of Economics 68(4), 1169–1208.
Black, Sandra, and Lisa M. Lynch (2001) 'How to Compete: The Impact of Workplace Practices and InformationTechnology on Productivity.' The Review of Economics and Statistics 83(3), 434–445.
Blanchflower, David, and Stephen Machin (1995) 'Product Market Competition, Wages, and Productivity:International Evidence from Establishment-Level Data'.
Bloom, Nicholas (2010) 'Measuring and Explaining Management Practices in Canada'.
Bloom, Nicholas, and John Van Reenen (2006) 'Measuring and Explaining Management Practices Across Firms andCountries'.
—(2007) 'Measuring and Explaining Management Practices Across Firms and Countries.' Quarterly Journal ofEconomics 122(4), 1351–1408.
—(2010) 'Why Do Management Practices Differ across Firms and Countries?' Journal of Economic Perspectives24(1), 203–224.
Bloom, Nicholas, and Raffaella Sadun (2009) 'Do Private Equity-Owned Firms Have Better Management Practice?'In Globalization of Alternatice Investments, Working Papers Volume 2 – The Global Economic Impact ofPrivate Equity Report 2009, ed. Anuradha Guring and Josh Lerner (World Economic Forum).
Bloom, Nicholas, Benn Eifert, Aprajit Mahajan, David McKenzie, and John Roberts (2011) 'Does ManagementMatter? Evidence from India.' International Growth Center Working Paper no. 10/0873.
Bloom, Nicholas, Carol Propper, Stephan Seiler, and John Van Reenen (2010) 'The Impact of Competition onManagement Quality: Evidence from Public Hospital.' Center for Economic Performance Discussion PaperNo 983.
Bloom, Nicholas, Erik Brynjolfsson, Lucia Foster, Ron Jarmin, Itay SaportaEksten, and John Van Reenen (2013)'Management in America.' Presented at the American Economic Association Meeting 2013.
Bloom, Nicholas, Raffaella Sadun, and John Van Reenen (2012a) 'Americans Do IT Better: US Multinationals andthe Productivity Miracle.' American Economic Review 102(1), 167–201.
17

—(2012b) 'Management as a Technology.' Presented at the American Economic Association Meeting 2013.
Boone, Jan (2000) 'Competitive Pressure: The Effects on Investments in Product and Process Innovation.' RANDJournal of Economics 31(3), 549–569.
Bresnahan, Timothy F. (1999) 'Computerisation and Wage Dispersion: An Analytical Reinterpretation.' EconomicJournal 109(456), F390–415.
Bresnahan, Timothy F., Erik Brynjolfsson, and Lorin M. Hitt (2002) 'Information Technology, WorkplaceOrganization, and the Demand for Skilled Labor: Firm-Level Evidence.' The Quarterly Journal of Economics117, 339–376.
Brouillette, Dany (2013) 'Drivers of Innovation, Complementarity of Innovation, and Performance of Enterprises inCanada.' mimeo, Industry Canada.
Cappelli, Peter, and David Neumark (1999) 'Do "High Performance" Work Practices Improves Establishment-LevelOutcomes?' NBER Working Paper 7374.
Competition Policy Review Panel (2008) 'Compete to Win.' Government of Canada, Ottawa.
Dostie, Benoit, and Jonathan Paré (2013) 'Formation Parrainée par l'Employeur et Performance en Innovation.'Centre sur la productivité et la prospérité.
Drummond, Don, and Alistair Bentley (2010) 'The productivity puzzle: Why is the Canadian record so poor andwhat can be done about it?' TD Economics Special Report.
Expert Panel on Business Innovation (2009) 'Innovation and Business Strategies: Why Canada Falls Short.'Council of Canadian Academies (CCA).
Expert Review Panel on Research and Development (2012) 'Innovation Canada: A Call to Action.' Government ofCanada, Ottawa.
Griffith, Rachel, Rupert Harrison, and Helen Simpson (2010) 'Product Market Reform and Innovation in the EU.'Scandinavian Journal of Economics 112(2), 389–415.
Huselid, Mark A. (1995) 'The Impact of Human Resource Management Practices on Turnover, Productivity, andCorporate Financial Performance.' Academy of Management Journal 38(3), 635–672.
Ichniowski, Casey, Kathryn Shaw, and Giovanna Prennushi (1997) 'The Effects of Human Resource ManagementPractices on Productivity: A Study of Steel Finishing Lines.' American Economic Review 87(3), 291–313.
Industry Canada (2011) 'Business Innovation and Strategy: A Canadian Perspective.' Government of Canada,Ottawa.
Institute for Competitiveness and Prosperity (2009) 'Management Matters.' ICAP Working Paper 12, Toronto.
—(2010) 'Management Matters in Retail.' ICAP Working Paper 13, Toronto. Lazear, Edward P. (2000).
—'Performance Pay and Productivity.' American Economic Review 90(5), 1346–1361.
Macduffie, John Paul (1995) 'Human Resource Bundles and Manufacturing Performance: Organizational Logic andFlexible Production Systems in the World Auto Industry.' Industrial and Labour Relations Review 48(2),197–221.
Nickell, Stephen J. (1996) 'Competition and Corporate Performance.' Journal of Political Economy 104(4),724–746.
Osterman, Paul (1994) 'How Common Is Workplace Transformation and Who Adopts it?' Industrial and LabourRelations Review 47(2), 173–188.
Oyer, Paul, and Scott Schaefer (2011) 'Personnel Economics: Hiring and Incentives.' In Handbook of LaborEconomics, Vol 4b, ed. Orley Ashenfelter and David Card (North Holland) pp. 1769–1823.
Powell, Thomas C. (1995) 'Total Quality Management as Competitive Advantage: A Review and Empirical Study.'Strategic Management Journal 16(1), 15–37.
Syverson, Chad (2004a) 'Market Structure and Productivity: A Concrete Example.' Journal of Political Economy112(6), 1181–1222.
18

—(2004b) 'Product Substitutability and Productivity Dispersion.' The Review of Economics and Statistics 86(2),534–550.
—(2011) 'What Determines Productivity.' Journal of Economic Literature 49(2), 326–365.
Van Reenen, John (2011) 'Boss-Onomics: Does Management Matter?' Industry Canada's Distinguished SpeakerSeries.
19

Appendix A. The Management Practices Indices
A.1 Comparison of MP Indicators from the BVR Survey and the SIBS
Contents comparison between BVR and SIBS indices
BVR index(Bloom and Van Reenen, 2007)
BVR typesof
indicators
SIBS index( )
1 Modern manufacturing, introduction Operations No equivalent2 Modern manufacturing, rationale Operations No equivalent3 Process documentation Operations Q52 The enterprise has a systematic process to resolve problems
associated with production of goods or delivery of services4 Performance tracking Monitoring Q53 Number of key production performance indicators (KPPI)
monitored in the enterprise5 Performance review
Monitoring
Q54 Frequency at which KPPI are shown to managers ofoperations
Q55 Frequency at which KPPI are shown to workersQ56 Frequency of review of KPPI by top and middle managers
6 Performance dialogue Monitoring Q62 Employees' involvement in the decision-making process ontask allocation
7 Consequence management Monitoring No equivalent8 Target breadth Targets No equivalent9 Target interconnection Targets No equivalent10 Target time horizon Targets Q58 Time frame of the enterprise production performance targets
for its highest product11 Targets are stretching Targets No equivalent12 Performance clarity Monitoring Q64d Formal performance agreements based on objective,
quantifiable results are prepared for managerial/supervisory/executive employees at least annually
Q64e,Q64f
Formal appraisals are conducted for the majority ofmanagerial and non-managerial staff at least annually
13 Managing human capital Targets No equivalent14 Rewarding high-performance Incentives Q59 How does the enterprise reward production performance
target achievement15 Removing poor performers Incentives Q61 Enterprise's main policy to deal with employees not meeting
expectations16 Promoting high performers
Incentives
Q60 Enterprise's main way to promote employeesQ64b Formal training programs are available to employees to teach
them the skills required to perform their jobQ64c Formal training programs are available to employees to
increase their promotability17 Attracting human capital Incentives Q64a At least one of the following selection methods to select
candidates is used: personality/attitude tests, intelligence oraptitude tests, work sample
18 Retaining human capital
Incentives
Q64g Incentives programs such as employee stock ownership,profit-sharing, gain-sharing or merit bonus are available tonon-managerial employees
Q64h Incentives programs are available to managerial,supervisory, or executive employees
Q64i Incentives programs are available to all employees
20
Appendix A (continued)
A.2 Details on
Indicators and score of
QUESTION SCORE QUESTION SCOREQ52 Systematic process No 0 Q64a Use selection No 0to solve problems Yes 1 methods for candidates Yes 1Q53 #KPPI None 0 Q64b Training No 0 At least one 1 for skills Yes 1Q54 Frequency KPPI Never/don't know 0 Q64c Training for No 0shown to managers Any frequency 1 promotion Yes 1Q55 Frequency KPPI Never/don't know 0 Q64d Performance No 0shown to workers Any frequency 1 agreements Yes 1Q56 Frequency KPPI Don't know 0 Q64e Appraisal No 0shown to executives Rarely for workers Yes 1 Periodically Continually 1 Q58 Time frame No targets 0 Q64f Appraisal No 0for performance Short-term for managers Yes 1targets Long-term Both 1 Q59 Rewards None 0 Q64g Incentives No 0 Managers only ½ for workers Yes 1 All staff 1 Q60 Promotion Tenure 0 Q64h Incentives No 0based on … Effort and tenure ½ for managers and Yes 1 Effort 1 executives Q61 If employees Never moved 0 Q64i Incentives No 0don't meet Warned for all Yes 1expectations Warned, re-trained Removed 1 Q62 Employees No 0 make decisions yes 1
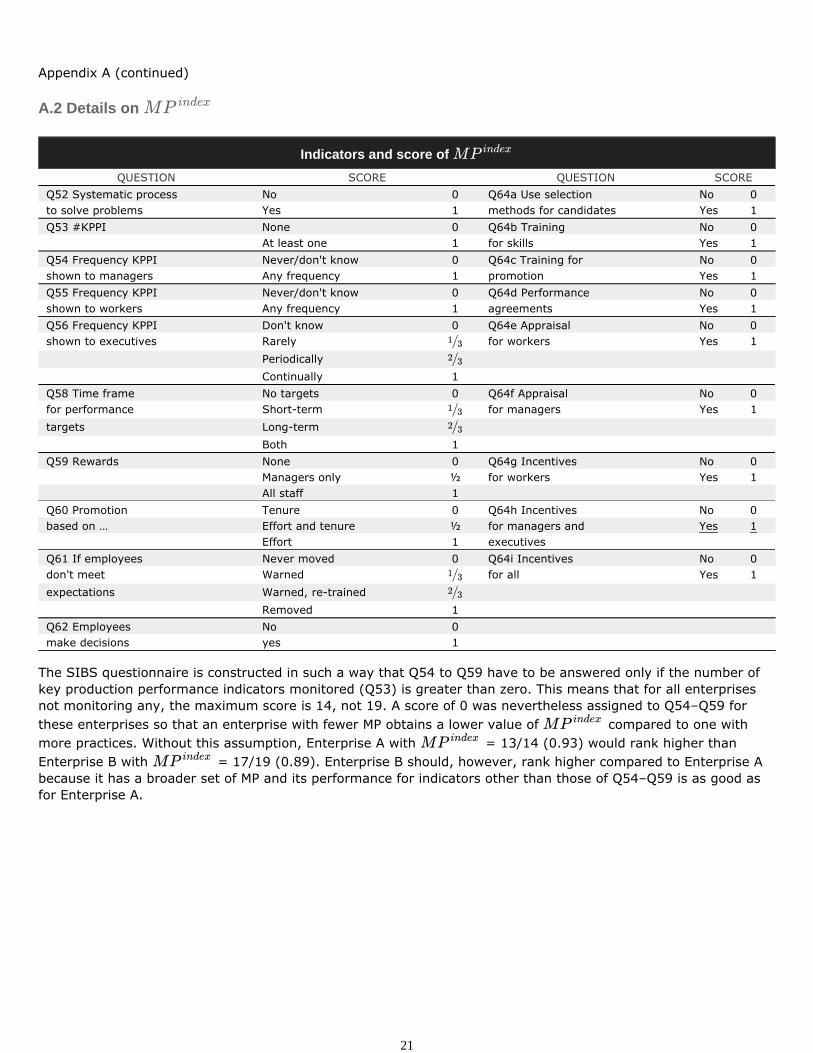
The SIBS questionnaire is constructed in such a way that Q54 to Q59 have to be answered only if the number ofkey production performance indicators monitored (Q53) is greater than zero. This means that for all enterprisesnot monitoring any, the maximum score is 14, not 19. A score of 0 was nevertheless assigned to Q54–Q59 forthese enterprises so that an enterprise with fewer MP obtains a lower value of compared to one withmore practices. Without this assumption, Enterprise A with = 13/14 (0.93) would rank higher thanEnterprise B with = 17/19 (0.89). Enterprise B should, however, rank higher compared to Enterprise Abecause it has a broader set of MP and its performance for indicators other than those of Q54–Q59 is as good asfor Enterprise A.
21

Appendix B. Variables Definition
Dependent variables
NAME DESCRIPTION SOURCEMP Management practice index (2009) SIBSsales Sales over employment ratio in $M (2008) GIFI,
LEAPprofits Profits over employment ratio in $M (2008) GIFI,
LEAPINNO = 1 if enterprise has innovated (2007–09) SIBS
= 1 if PRCS innovation has been introduced (2007–09) SIBS= 1 if ORGZ innovation has been introduced (2007–09) SIBS= 1 if PRDT innovation has been introduced (2007–09) SIBS= 1 if MRKT innovation has been introduced (2007–09) SIBS= 1 if PRCS or PRDT have been introduced (2007–09) SIBS= 1 if ORGZ or MRKT have been introduced (2007–09) SIBS= 1 if PRDT or MRKT have been introduced (2007–09) SIBS= 1 if PRCS or ORGZ have been introduced (2007–09) SIBS
Competition variables
NAME DESCRIPTION SOURCEMNE = 1 if a MNE is present in the main market (2009) SIBS#COMP Number of competitors in the main market (2009)
Categories: 1 = 1 comp.; 2 = 2 comp.; 3 = 3 comp.;4 = 4–5 comp.; 5 = 6–10 comp.;6 = 11–20 comp.; 7 = 20+ comp.
SIBS
ENTRY = 1 if a new competitor entered main market (2009) SIBS#GOODS Number of competing products in main market (2009)
Categories: 1 = 1–2 prod.; 2 = 2–4 prod.; 3 = 5–7 prod.;4 = 8–9 prod.; 5 = 10–19 prod.; 6 = 20–49 prod.;7 = 50–100 prod.; 8 = 100+ prod.
SIBS
SALES Sales in $M (2008) GIFICOGS Cost of goods sold in $M (2008) GIFILERNER Lerner index (2008): GIFI
22

Appendix B (continued)
Control variables
NAME DESCRIPTION SOURCESIZE Binary variables for firm size (ILU) (2009)
SMALL: [20-50[ ILU; MEDIUM: [50-100[ ILU;LARGE: [100-250[ ILU; XLARGE: 250+ ILU.SMALL size is the reference.
LEAP
PROV Binary variables for the location of the enterprise (2009)QC: Québec; ON: Ontario; AB: Alberta;BC: British Columbia; ROC: Rest of Canada.ON is the reference.
BR
NAICS Binary variables for industries (2009)MANU 1: NAICS 31; MANU 2: NAICS 32;MANU 3: NAICS 33; RES: NAICS 11, 21, 22 and 2SERV : NAICS 41, 44–45, 48–49, 51, 52, 53, 54, 55 and 56.MANU 1 is the reference for manufacturing and RES is the reference fornon-manufacturing.
BR
HQ Binary variables for location of head office (2009)HQ CA: Canada; HQ US: United States;HQ EU: Europe; HQ ROW: All other countries.HQ CA is the reference.
SIBS
%UNIV Percentage of workers with university degree (1009) SIBSMULTI = 1 if the enterprise has multiple establishments BRCAP Sum of tangible and intangible assets in $M (2008) GIFIcap CAP over employment ratio in $M (2008) GIFIRD R&D expenditures in $M (2004) RDCIADVTECH Number of advanced technologies used (2009) SIBS
23

Appendix C. Descriptive Statistics (weighted)
Statistics by sector
– Manufacturing N = 2,890 –MP 0.54 [0.4] #COMP (%) SIZE (%)
sales ∗ ($M) 0.16 [0.2] 1 3.9 [0.4] SMALL 54.3
profits ∗∗ ($M) 0.04 [0.1] 2 4.9 [0.5] MEDIUM 24.3
INNO (%) 81.2 [0.9] 3 9.0 [0.6] LARGE 13.858.1 [1.2] 4–5 24.4 [1.0] XLARGE 7.253.9 [1.2] 6–10 23.2 [1.0] PROV (%)48.6 [1.1] 11–20 9.8 [0.7] ON 41.940.0 [1.1] 20+ 24.8 [1.0] QC 28.5
70.3 #GOODS (%) AB 9.164.5 0–2 18.4 BC 12.261.8 2–4 23.4 ROC 8.371.5 5–7 15.1 HQ (%)
CAP ∗ ($M) 0.08 [0.2] 8–9 2.3 HQ_CA 88.2 [0.5]
RD ∗∗∗∗ ($M) 0.90 [12.6] 10–19 16.0 HQ_US 7.6 [0.4]
ADVTECH 1.64 [3.8] 20–49 10.2 HQ_EU 3.1 [0.3]%UNIV † (%) 11.1 [2.7] 50–100 3.6 HQ_ROW 1.1 [0.2]MULTI (%) 15.5 100+ 11.2MNE (%) 66.0 [1.1] NAICS (%)ENTRY (%) 31.1 [1.1] MANU_1 16.7
LERNER ∗∗∗ 0.28 MANU_2 30.4
MANU_3 52.9
When available, standard error is in brackets.
Sources: Statistics Canada SIBS, GIFI, LEAP, RDCI and BR.
Coefficients of variation are reported in brackets.†
Sample size: N = 2,534 (manufacturing); N = 1,001 (non-manufacturing).∗
Sample size: N = 2,584 (manufacturing); N = 1,142 (non-manufacturing).∗∗
Sample size: N = 2,730 (manufacturing); N = 1,129 (non-manufacturing).∗∗∗
Mean (> 0) N = 806 (manufacturing); N = 170 (non-manufacturing).∗∗∗∗
24

Appendix C (continued)
– Non-Manufacturing * N = 2,890 –MP 0.45 [1.4] #COMP (%) SIZE (%)
sales ∗ ($M) 0.18 [1.0] 1 2.9 [1.5] SMALL 59.1
profits ∗∗ ($M) 0.05 [0.3] 2 6.1 [3.4] MEDIUM 18.8
INNO (%) 63.6 [5.4] 3 13.9 [2.3] LARGE 17.027.9 [3.9] 4–5 9.8 [1.5] XLARGE 5.130.2 [4.2] 6–10 28.9 [4.4] PROV (%)31.6 [4.2] 11–20 17.4 [4.4] ON 36.234.3 [4.3] 20+ 21.1 [3.2] QC 27.1
47.3 #GOODS (%) AB 12.147.0 0–2 24.4 BC 11.844.1 2–4 22.7 ROC 12.945.3 5–7 12.6 HQ (%)
CAP ∗ ($M) 0.09 [1.2] 8–9 4.1 HQ_CA 95.4 [0.9]
RD ∗∗∗∗ ($M) 3.26 [40.1] 10–19 18.2 HQ_US 3.8 [0.9]
ADVTECH 0.97 [9.5] 20–49 9.2 HQ_EU 0.5 [0.1]
% UNIV † (%) 16.9 [7.7] 50–100 3.1 HQ_ROW 0.3 [0.1]
MULTI (%) 21.1 100+ 5.7MNE (%) 46.4 [5.5] NAICS (%)ENTRY (%) 32.7 [5.2] SERV 75.5
LERNER ∗∗∗ 0.45 RES 24.5
When available, standard error is in brackets.
Sources: Statistics Canada SIBS, GIFI, LEAP, RDCI and BR.
Sample size for sales and profits regressions are smaller than the full SIBS sample (4,227). There are fourexplanations to this. First, sales and profits (GIFI) have some missing records. Second, as mentioned inSection 2.3, the ROBUSTREG SAS procedure assigned a weight—not the sampling weights—of zero to someoutliers and bad leverage points which effectively removed them. Third, enterprises with a sales to employmentratio equals to zero were removed. Negative profits, however, are permitted. Fourth, the Lerner index wasbounded between -10 and 0.
Coefficients of variation are reported in brackets.†
NAICS 11, 21, 22, 23, 41, 44–45, 48–49, 51, 52, 53, 54, 55 and 56.*
Sample size: N = 2,534 (manufacturing); N = 1,001 (non-manufacturing).∗
Sample size: N = 2,584 (manufacturing); N = 1,142 (non-manufacturing).∗∗
Sample size: N = 2,730 (manufacturing); N = 1,129 (non-manufacturing).∗∗∗
Mean (> 0) N = 806 (manufacturing); N = 170 (non-manufacturing).∗∗∗∗
25

Appendix C (continued)
Figure 5: Distributions of for NAICS 31, 32 and 33
26

Appendix C (continued)
Figure 6: Distributions of for NAICS 21 and 22
27

Appendix C (continued)
Figure 7: Distributions of for NAICS 51, 52 and 54
28

Appendix C (continued)
* All covered industries except NAICS 21, 22, 31-33, 48, 51, 52 and 54.
Figure 8: Distributions of for NAICS 48 and other
29

Appendix D. Detailed Results
Table 4: Detailed Results of Equation (2)– Dep. var.: , weighted OLS regressions –
(Characteristics)
Variable Manufacturing Non-manufacturing
– Characteristics –CONS 0.4032 * 0.4067 * 0.2514 * 0.3127 *
(0.0001) (0.0001) (0.0002) (0.0001)MEDIUM 0.1025 * 0.1001 * 0.1544 * 0.1539 *
(0.0004) (0.0004) (0.0003) (0.0001)LARGE 0.1083 * 0.1060 * 0.1827 * 0.1855 *
(0.0001) (0.0001) (0.0001) (0.0001)XLARGE 0.1873 * 0.1851 * 0.2378 * 0.2465 *
(0.0001) (0.0001) (0.0001) (0.0001)%UNIV 0.0018 * 0.0019 * 0.0026 * 0.0027 *
(0.0003) (0.0001) (0.0001) (0.0001)HQ_US 0.0586 * 0.0602 * 0.0943 * 0.0606
(0.0003) (0.0001) (0.0081) (0.1111)HQ_EU 0.0668 * 0.0671 * −0.0121 0.02690
(0.0006) (0.0004) (0.8326) (0.6497)HQ_ROW 0.0199 0.0199 0.0543 0.1040
(0.4080) (0.389) (0.5673) (0.2006)MULTI 0.0083 0.0080 −0.0994 * −0.1031 *
(0.5735) (0.5698) (0.0188) (0.0046)SERV −0.0211 −0.0215
(0.6316) (0.5758)MANU_2 0.0489 * 0.0459 *
(0.0004) (0.0006)MANU_3 0.0579 * 0.0550 *
(0.0004) (0.0006)QC −0.0331 ** −0.0303 ** 0.0373 0.0292
(0.0660) (0.0863) (0.3890) (0.4438)AB −0.007 −0.0058 0.0210 0.0368
(0.7708) (0.7975) (0.6766) (0.3742)BC −0.0212 −0.0156 −0.0530 −0.0556
(0.3229) (0.4534) (0.3054) (0.2627)ROC −0.0101 −0.0118 −0.0109 0.0293
(0.6409) (0.5826) (0.7510) (0.3104)
P-values are between parenthesis.
Significant at a 0.05 level.*
Significant at a 0.10 level.**
30
Appendix D (continued)
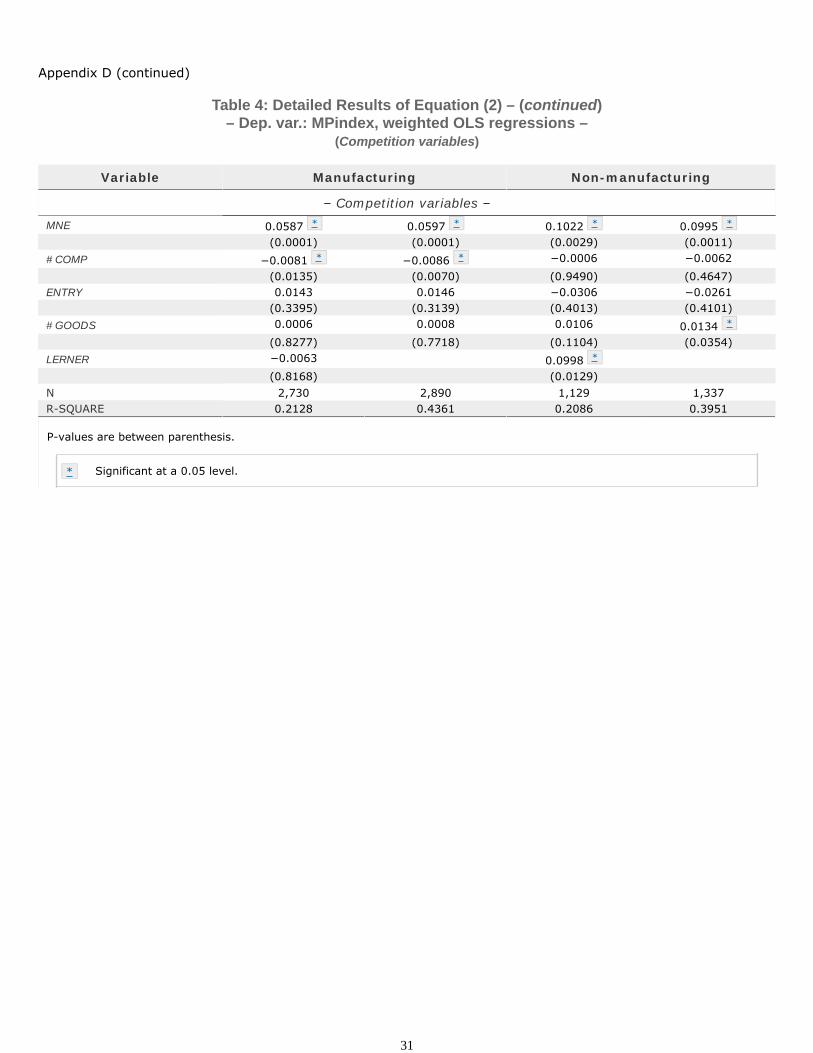
Table 4: Detailed Results of Equation (2) – (continued)– Dep. var.: MPindex, weighted OLS regressions –
(Competition variables)
Variable Manufacturing Non-manufacturing
– Competition variables –MNE 0.0587 * 0.0597 * 0.1022 * 0.0995 *
(0.0001) (0.0001) (0.0029) (0.0011)#COMP −0.0081 * −0.0086 * −0.0006 −0.0062
(0.0135) (0.0070) (0.9490) (0.4647)ENTRY 0.0143 0.0146 −0.0306 −0.0261
(0.3395) (0.3139) (0.4013) (0.4101)#GOODS 0.0006 0.0008 0.0106 0.0134 *
(0.8277) (0.7718) (0.1104) (0.0354)LERNER −0.0063 0.0998 *
(0.8168) (0.0129)N 2,730 2,890 1,129 1,337R-SQUARE 0.2128 0.4361 0.2086 0.3951
P-values are between parenthesis.
Significant at a 0.05 level.*
31
Appendix D (continued)
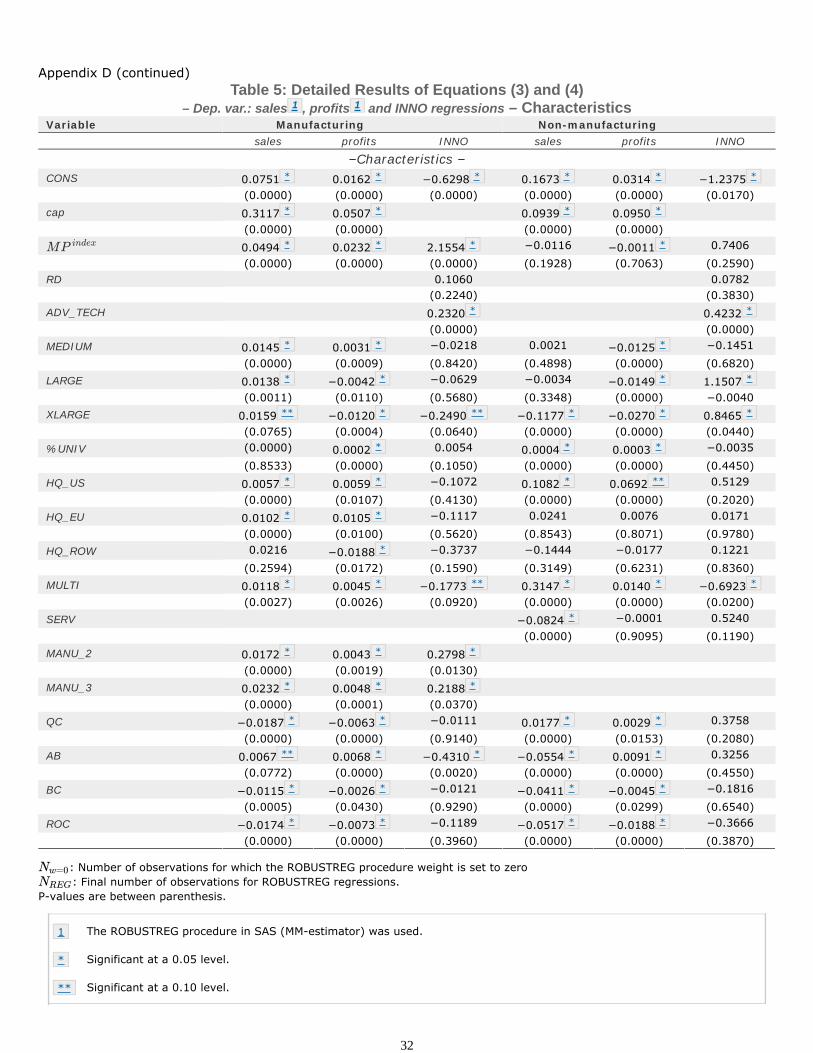
Table 5: Detailed Results of Equations (3) and (4)– Dep. var.: sales 1 , profits 1 and INNO regressions – Characteristics
Variable Manufacturing Non-manufacturingsales profits INNO sales profits INNO
–Characteristics –CONS 0.0751 * 0.0162 * −0.6298 * 0.1673 * 0.0314 * −1.2375 *
(0.0000) (0.0000) (0.0000) (0.0000) (0.0000) (0.0170)cap 0.3117 * 0.0507 * 0.0939 * 0.0950 *
(0.0000) (0.0000) (0.0000) (0.0000)0.0494 * 0.0232 * 2.1554 * −0.0116 −0.0011 * 0.7406(0.0000) (0.0000) (0.0000) (0.1928) (0.7063) (0.2590)
RD 0.1060 0.0782(0.2240) (0.3830)
ADV_TECH 0.2320 * 0.4232 *
(0.0000) (0.0000)MEDIUM 0.0145 * 0.0031 * −0.0218 0.0021 −0.0125 * −0.1451
(0.0000) (0.0009) (0.8420) (0.4898) (0.0000) (0.6820)LARGE 0.0138 * −0.0042 * −0.0629 −0.0034 −0.0149 * 1.1507 *
(0.0011) (0.0110) (0.5680) (0.3348) (0.0000) −0.0040XLARGE 0.0159 ** −0.0120 * −0.2490 ** −0.1177 * −0.0270 * 0.8465 *
(0.0765) (0.0004) (0.0640) (0.0000) (0.0000) (0.0440)%UNIV (0.0000) 0.0002 * 0.0054 0.0004 * 0.0003 * −0.0035
(0.8533) (0.0000) (0.1050) (0.0000) (0.0000) (0.4450)HQ_US 0.0057 * 0.0059 * −0.1072 0.1082 * 0.0692 ** 0.5129
(0.0000) (0.0107) (0.4130) (0.0000) (0.0000) (0.2020)HQ_EU 0.0102 * 0.0105 * −0.1117 0.0241 0.0076 0.0171
(0.0000) (0.0100) (0.5620) (0.8543) (0.8071) (0.9780)HQ_ROW 0.0216 −0.0188 * −0.3737 −0.1444 −0.0177 0.1221
(0.2594) (0.0172) (0.1590) (0.3149) (0.6231) (0.8360)MULTI 0.0118 * 0.0045 * −0.1773 ** 0.3147 * 0.0140 * −0.6923 *
(0.0027) (0.0026) (0.0920) (0.0000) (0.0000) (0.0200)SERV −0.0824 * −0.0001 0.5240
(0.0000) (0.9095) (0.1190)MANU_2 0.0172 * 0.0043 * 0.2798 *
(0.0000) (0.0019) (0.0130)MANU_3 0.0232 * 0.0048 * 0.2188 *
(0.0000) (0.0001) (0.0370)QC −0.0187 * −0.0063 * −0.0111 0.0177 * 0.0029 * 0.3758
(0.0000) (0.0000) (0.9140) (0.0000) (0.0153) (0.2080)AB 0.0067 ** 0.0068 * −0.4310 * −0.0554 * 0.0091 * 0.3256
(0.0772) (0.0000) (0.0020) (0.0000) (0.0000) (0.4550)BC −0.0115 * −0.0026 * −0.0121 −0.0411 * −0.0045 * −0.1816
(0.0005) (0.0430) (0.9290) (0.0000) (0.0299) (0.6540)ROC −0.0174 * −0.0073 * −0.1189 −0.0517 * −0.0188 * −0.3666
(0.0000) (0.0000) (0.3960) (0.0000) (0.0000) (0.3870)
: Number of observations for which the ROBUSTREG procedure weight is set to zero: Final number of observations for ROBUSTREG regressions.
P-values are between parenthesis.
The ROBUSTREG procedure in SAS (MM-estimator) was used.1
Significant at a 0.05 level.*
Significant at a 0.10 level.**
32
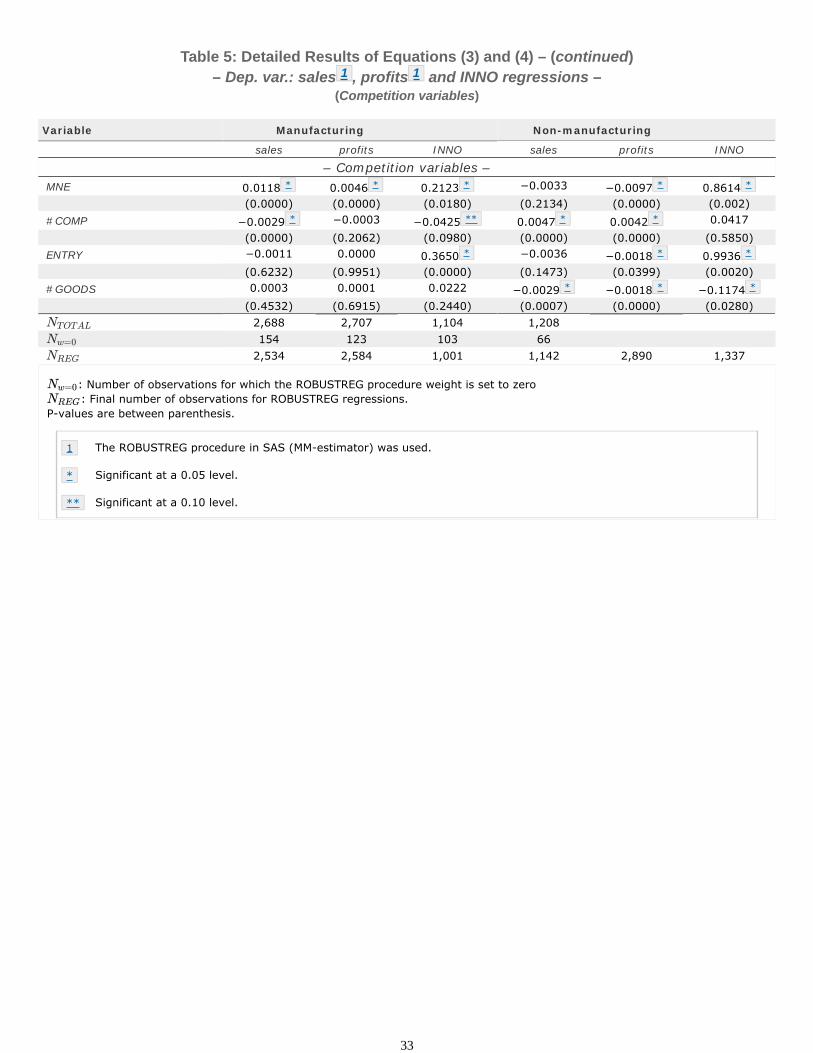
Table 5: Detailed Results of Equations (3) and (4) – (continued)– Dep. var.: sales 1 , profits 1 and INNO regressions –
(Competition variables)
Variable Manufacturing Non-manufacturing
sales profits INNO sales profits INNO
– Competition variables –MNE 0.0118 * 0.0046 * 0.2123 * −0.0033 −0.0097 * 0.8614 *
(0.0000) (0.0000) (0.0180) (0.2134) (0.0000) (0.002)#COMP −0.0029 * −0.0003 −0.0425 ** 0.0047 * 0.0042 * 0.0417
(0.0000) (0.2062) (0.0980) (0.0000) (0.0000) (0.5850)ENTRY −0.0011 0.0000 0.3650 * −0.0036 −0.0018 * 0.9936 *
(0.6232) (0.9951) (0.0000) (0.1473) (0.0399) (0.0020)#GOODS 0.0003 0.0001 0.0222 −0.0029 * −0.0018 * −0.1174 *
(0.4532) (0.6915) (0.2440) (0.0007) (0.0000) (0.0280)2,688 2,707 1,104 1,208154 123 103 66
2,534 2,584 1,001 1,142 2,890 1,337
: Number of observations for which the ROBUSTREG procedure weight is set to zero: Final number of observations for ROBUSTREG regressions.
P-values are between parenthesis.
The ROBUSTREG procedure in SAS (MM-estimator) was used.1
Significant at a 0.05 level.*
Significant at a 0.10 level.**
33

Appendix D (continued)
Table 6: Detailed Results of Equations (5)– Dep. var.: , , and weighted Biprobit –
(Characteristics)
Variable Manufacturing Non-Manufacturing
– Characteristics –
CONS −0.6765 * −1.6133 * −0.9958 * −0.9958 * −1.2980 * −1.4362 * −1.8312 * −2.2768 *
(0.0000) 0.0 0.0 0.0 (0.0190) (0.0060) (0.0010) 0.0
1.7467 * 2.6589 * 0.9284 * 2.2058 * 0.5456 1.8365 * 1.1644 * 2.3178 *
(0.0000) 0.0 (0.010) 0.0 (0.3590) (0.0010) (0.030) 0.0RD 0.0318 −0.0060 0.0042 0.0195 0.1112 * 0.0119 0.0085 0.0009
(0.4630) (0.1850) (0.6680) (0.2840) (0.0460) (0.6550) (0.5960) (0.970)ADV_TECH 0.2234 * 0.1646 * 0.1824 * 0.2070 * 0.3061 * 0.0886 0.1099 0.4023 *
(0.0000) (0.0000) (0.0000) (0.0000) (0.0000) (0.2430) (0.180) (0.0000)MEDIUM −0.0538 −0.0533 −0.2077 ** 0.0401 0.1792 −0.2415 0.2386 −0.0027
(0.5970) (0.5750) (0.0740) (0.6820) (0.5960) (0.4150) (0.4720) (0.9940)LARGE 0.0130 −0.1907 * −0.0325 −0.0340 −0.0076 0.7307 * 0.5528 ** 0.4802
(0.8960) (0.0410) (0.7280) (0.730) (0.9810) (0.0270) (0.0960) (0.1240)XLARGE −0.0369 −0.2931 * −0.1640 −0.1525 0.3593 0.5537 0.9272 * 0.5116
(0.7560) (0.0090) (0.1360) (0.1950) (0.3750) (0.1570) (0.010) (0.1720)%UNIV 0.0041 0.0048 * 0.0114 * −0.0001 −0.0067 0.0039 0.0035 −0.0047
(0.1550) (0.0450) (0.0020) (0.9730) (0.1020) (0.2970) (0.2920) (0.3120)HQ_US −0.3205 * −0.0663 −0.0137 −0.1171 0.0313 0.5603 0.0074 0.9015 *
(0.0130) (0.5640) (0.9090) (0.3480) (0.9460) (0.1480) (0.9870) (0.0110)HQ_EU −0.2037 −0.0274 −0.0901 −0.0114 −0.0334 0.2686 0.1417 0.4095
(0.2500) (0.8690) (0.5790) (0.9480) (0.9330) (0.5260) (0.7450) (0.460)HQ_ROW −0.4840 * −0.4585 * −0.1836 −0.4398 * −0.0381 −0.1424 −0.7232 0.2596
(0.0240) (0.0310) (0.420) (0.0430) (0.9370) (0.8430) (0.3220) (0.580)MULTI −0.1537 −0.0205 −0.0395 −0.1111 −0.4203 −0.2184 −0.0370 −1.3776 *
(0.1050) (0.8220) (0.6770) (0.240) (0.1390) (0.5030) (0.9060) 0.0SERV 0.3677 0.7463 * 0.8700 * 0.1605
(0.2490) (0.0250) (0.0150) (0.5560)MANU_2 0.1751 ** 0.0576 0.0388 0.2439 *
(0.0820) (0.5630) (0.6860) (0.0170)MANU_3 0.1560 ** 0.0446 0.0061 0.1191
(0.0990) (0.6330) (0.950) (0.2110)QC 0.0810 0.1486 ** 0.1962 * 0.0795 −0.1634 0.5942 * 0.5393 ** 0.1118
(0.3840) (0.0960) (0.0440) (0.3850) (0.5670) (0.0460) (0.0690) (0.6590)AB −0.4756 * −0.0838 −0.2624 ** −0.210 0.0206 −0.2266 −0.4468 0.4930
(0.0000) (0.4910) (0.0530) (0.1010) (0.960) (0.5130) (0.2290) (0.1710)BC −0.0627 0.1824 0.1030 0.0478 −0.0686 −0.0363 0.1013 0.3182
(0.6180) (0.110) (0.4090) (0.6940) (0.8560) (0.9290) (0.7970) (0.3360)ROC −0.0955 −0.0665 0.0603 −0.1195 −0.3637 −0.5107 −0.0939 −0.4863 **
(0.4560) (0.5850) (0.6510) (0.3380) (0.3310) (0.1150) (0.8030) (0.0950)
P-values are between parenthesis.
Significant at a 0.05 level.*
Significant at a 0.10 level.**
34

Appendix D (continued)
Table 6: Detailed Results of Equations (5) – (continued)– Dep. var.: , , and weighted Biprobit –
(Competition variables)
Variable Manufacturing Non-Manufacturing
– Competition variables –
MNE 0.0882 0.0920 0.1353 ** 0.0257 1.0230 * 0.1318 0.0496 0.8919 *
(0.2770) (0.2440) (0.0940) (0.7530) (0.0000) (0.5940) (0.8410) (0.0000)#COMP −0.0582 * 0.0207 −0.0335 −0.0019 0.0358 −0.1326 ** −0.0226 0.0435
(0.0170) (0.3720) (0.140) (0.9350) (0.6710) (0.0520) (0.7640) (0.4580)ENTRY 0.3330 * 0.3186 * 0.3157 * 0.1446 ** 0.9473 * 1.1182 * 1.1408 * 0.3007
(0.0000) (0.0000) (0.0000) (0.0770) (0.0020) (0.0000) (0.0000) (0.2060)#GOODS 0.0336 * 0.0264 0.0391 * 0.0151 −0.0986 * −0.0450 −0.0745 −0.0116
(0.0440) (0.1160) (0.0220) (0.3710) (0.0340) (0.3250) (0.1190) (0.7920)N 2,890 2,890 1,337 1,337
0.4132 * 0.3988 * 0.4007 * 0.3190 *
P-values are between parenthesis.
Significant at a 0.05 level.*
Significant at a 0.10 level.**
35

Appendix D (continued)
Table 7: Detailed Results of Equations (5)– Dep. var.: , , and weighted multivariate Probit –
(Characteristics)
Variable Manufacturing Non-manufacturing PRDT ORGZ PRDT MRKT PRDT ORGZ PRDT MRKT
– Characteristics –
CONS -1.0364 * -1.9299 * −0.9625 * -1.2442 * -1.9216 * -2.5825 * -1.7676 * -1.9739 *
(0.0000) 0.0000 0.0000 0.0000 0.0000 0.0000 −0.0010 0.0000MPindex 1.8407 * 2.6694 * 0.6937 * 1.1656 * 0.8562 ** 2.7276 * 0.7409 1.2384 *
(0.0000) 0.0000 −0.0140 0.0000 −0.0970 0.0000 −0.1830 −0.0110RD 0.0076 −0.0010 0.0193 0.0006 0.0000 −0.0035 0.0147 0.0208
(0.4520) −0.8490 −0.1510 −0.8930 −0.9960 −0.7050 −0.2210 −0.1490ADVTECH −0.0217 −0.0090 −0.1835 * −0.1128 0.3478 * 0.2003 * 0.1951 * −0.0174
(0.8220) −0.9240 −0.0740 −0.2780 0.0000 −0.0040 −0.0120 −0.7810MEDIUM −0.0467 −0.1560 ** 0.0525 −0.0719 −0.2673 0.3136 0.5614 ** −0.0559
(0.6040) −0.0800 −0.5570 −0.4130 −0.4260 −0.2880 −0.0800 −0.8490LARGE −0.0679 −0.2733 * −0.0893 −0.2020 ** −0.0585 0.5997 * 0.0001 0.6742 *
(0.5330) −0.0150 −0.4120 −0.0640 −0.8630 −0.0230 -1.0000 −0.0290XLARGE 0.2315 * 0.1500 * 0.1738 * 0.1514 * 0.2761 0.7148 * 0.7894 * 0.1917
(0.0000) 0.0000 0.0000 0.0000 −0.4460 −0.0280 −0.0250 −0.6100%UNIV −0.0030 0.0028 0.0102 * 0.0056 * −0.0049 0.0044 0.0020 −0.0012
(0.2100) −0.1890 0.0000 −0.0300 −0.3080 −0.1900 −0.5100 −0.7140HQUS −0.4647 * −0.0632 0.0092 −0.1693 0.5480 1.2791 * 0.4407 −0.2119
(0.0000) −0.5930 −0.9360 −0.1490 −0.2390 0.0000 −0.3250 −0.6120HQEU −0.2752 ** 0.1438 0.0396 −0.1822 −0.0519 0.2798 −0.2781 −0.0202
(0.0840) −0.3590 −0.7910 −0.2180 −0.8900 −0.4840 −0.4680 −0.9630HQROW −0.3801 ** −0.4642 * −0.3653 ** −0.1109 0.2865 0.0554 −0.8006 −0.2358
(0.0620) −0.0140 −0.0850 −0.6110 −0.4280 −0.9250 −0.2680 −0.7020MULTI −0.1030 0.0290 −0.0678 0.0700 −0.6982 * −0.9863 * −0.1215 0.0374
(0.2470) −0.7480 −0.4660 −0.4670 −0.0030 0.0000 −0.6680 −0.9000SERV −0.0605 0.4740 ** 0.8704 * 0.9717 *
(0.8330) −0.0920 −0.0130 −0.0060MANU2 0.1313 0.1357 0.0643 −0.1028
(0.1700) −0.1720 −0.5070 −0.2680MANU3 0.0488 0.0955 0.0185 −0.1863 *
(0.5920) −0.3120 −0.8460 −0.0440QC 0.0642 0.1648 ** 0.2001 * 0.1048 −0.4710 ** 0.4666 * 0.3214 0.4472
(0.4620) −0.0550 −0.0250 −0.2420 −0.0970 −0.0500 −0.2400 −0.1000AB −0.2618 * −0.1483 −0.3305 * −0.1085 0.2341 −0.0632 −0.1259 −0.4815
(0.0410) −0.2190 −0.0090 −0.4240 −0.5460 −0.8320 −0.7250 −0.1500BC −0.0696 0.1150 0.0146 0.1665 −0.3708 0.5167 0.3947 0.0269
(0.5410) −0.3050 −0.9020 −0.1470 −0.2420 −0.1350 −0.2990 −0.9480ROC −0.0583 0.0304 −0.0279 −0.0951 −0.4455 −0.2113 0.2105 −0.4242
(0.6400) −0.8030 −0.8230 −0.4550 −0.1380 −0.4650 −0.5860 −0.1700
P-values are between parenthesis.
Significant at a 0.05 level.*
Significant at a 0.10 level.**
36

Appendix D (continued)
Table 7: Detailed Results of Equations (5) – (continued)– Dep. var.: , , and weighted multivariate Probit –
(Competition variables)
Variable Manufacturing Non-manufacturing PRDT ORGZ PRDT MRKT PRDT ORGZ PRDT MRKT
– Competition variables –
MNE −0.0559 0.0388 0.1735 * −0.0141 0.7933 * 0.284 0.5025 * 0.1515
−0.478 −0.613 −0.027 −0.86 −0.001 −0.145 −0.029 −0.514#COMP −0.0058 0.032 −0.0506 * −0.0058 0.1699 * −0.1275 * −0.1682 * −0.0552
−0.796 −0.158 −0.022 −0.794 −0.027 −0.016 −0.025 −0.443ENTRY 0.2032 * 0.2623 * 0.3076 * 0.2975 * −0.16 0.7168 * 1.3516 * 1.1618 *
−0.008 −0.001 0 0 −0.499 0 0 0#GOODS 0.014 0.01 0.0503 * 0.0366 * −0.0731 ** 0.0125 −0.0553 −0.0367
−0.367 −0.545 −0.002 −0.023 −0.077 −0.75 −0.222 −0.404N 2,890 1,337ρ12 0.4217 * 0.2087 **
ρ13 0.3842 * 0.2726 *
ρ14 0.2368 * −0.0518
ρ23 0.2547 * 0.5523 *
ρ24 0.3565 * 0.5062 *
ρ34 0.4040 * 0.6603 *
P-values are between parenthesis.
Significant at a 0.05 level.*
Significant at a 0.10 level.**
37