management of information technology and quality performance in health care facilities
TRANSCRIPT

MANAGEMENT OF INFORMATION TECHNOLOGY AND QUALITY
PERFORMANCE IN HEALTH CARE FACILITIES
JAMES A. RODGER University of Pittsburgh
PARAG C. PENDHARKAR Pennsylvania State Capital College
DAVID J. PAPER Utah State University
ABSTRACT: The objective of this research was to investigate the moderating effect of information technology (IT) infrastructure on the relationship between health care information management and quality performance within health care departments. The variables that were measured included both management and customer perceptions of quality, management of health care information (MOHCI), and IT infrastructure. This research focused on the determinants of departmental quality. The study conceptual- ized and developed measures for quality, MOHCI, and IT infrastructure variables. A significant relationship was observed between the management of health care informa- tion and quality performance. IT infrastructure exhibited a direct, rather than a moder- ating, effect on quality pe~ormance. The research also found/ that signijkant differ- ences exist between customer and manager perceptions of quality.
In the study, emphasis was placed on defining health care quality by integrating the mar- keting view with those of the Joint Commission on Accreditation of Hospital Organiza- tions (JCAHO) and total quality management (TQM) (Baldrige Award Criteria, 1995;
Direct all correspondence to: James A. Rodger, University of Pittsburgh, 109 Krebs Hall, Johnstown, PA 15904.
INTERNATIONAL JOURNAL OF APPLIED QUALITY MANAGEMENT, Volume 2, Number 2, pages 251-269 Copyright 0 1999 by Elsevier Science Inc. All rights of reproduction in any form reserved. ISSN: 1096-4738

252 JOURNAL OF APPLIED QUALITY MANAGEMENT Vol. ~/NO. 2/1999
Berry, Parasuraman, & Zeithaml, 1994; Dean & Evans, 1994; JCAHO, 1995; Parasura- man, Zieithaml, & Leonard, 1985).
The JCAHO, a national voluntary accreditation agency that was organized to assess and improve the quality of health care in the United States, reviews the quality of health care provided in U.S. health care institutions based on how well these organizations meet established standards in areas such as medical records, nursing, and laboratory services. TQM is a managerial innovation that emphasizes an organization’s total commitment to the customer and to continuous improvement of every process through the use of data- driven, problem-solving approaches based on empowerment of employee teams (Dean & Bowen, 1994). Incorporating data gathered from the National Quality Survey, JCAHO, Health Care Investment Analysts, and the Annual Survey of Hospitals conducted by the American Hospital Association, the findings of Westphal, Gulati, and Shortell (1997) show that the rate of TQM adoption among hospitals is close to the adoption rate for the population.
As illustrated in Figure 1, the research model consists of three constructs: IT infrastruc- ture, management of health care information, and quality performance.
The first construct presented is management of health care information (MOHCI), the four major dimensions of which include scientific/technical, patient care, customer satis- faction, and administrative information. Information technology (IT) infrastructure, the second construct of the research model, involves the integration, standardization, and sophistication of IT hardware, software, databases, and networks. Finally, the quality per- formance construct comprises of appropriateness of services, availability of services, con- tinuity of services, effectiveness of services, efficacy of procedures, efficiency of services, respect and caring for customers, timeliness of services, service tangibles, and customer safety.
ITIdaaNam i----l * Illtegxation of IT + standardization of IT * Sophistication of IT
Management of Health care Jnformation
*Scientific/Technical * Patient Care * Customer
satisfaction * Administdvc
- FIGURE 1
Research Model
+ Appropriateness * Effeetivcness * Efficacy * Timeliness + Availability ?? Respect and
caring ?? contilluity * Safety ?? Tangibles ?? Efficiency

Management of Information Technology and Quality Performance 253
BACKGROUND
Little systematic theory has evolved in the management of health care quality performance using industrial engineering techniques. “The clinical professionals have generally looked with suspicion upon the technically sophisticated tools for operational improvement” (Sahney, 1993). This statement portrays the status of quality performance, management of health care information, and IT infrastructure by clinical professionals in health care facil- ities. This research study addressed this problem by answering the following research questions:
Research Question 1. What is the relationship between management of health care information and quality performance in health care departments?
Research Question 2. How does IT infrastructure moderate the relationship between management of health care information and quality performance in health care departments?
The implementation of total quality management (TQM) in the health care field has made basic industrial engineering techniques available to hospitals and their employees. Fur- thermore, concern over costs has made the application of quality performance measures more acceptable within the health care industry. Several instruments have been developed to measure quality in the manufacturing sector (Flynn, Schroeder, & Sakakibara, 1994; Saraph, Benson, & Schroeder, 1989); however, only conceptual attempts have been made to define these constructs in health care. This research has developed an instrument to measure the connection between information management, IT infrastructure, and quality performance in health care departments.
Quality Performance and Health Care
Kano, Se&u, Takahashi, and Tsuji (1984) describe three different measures of quality: one-dimensional quality, attractive or unexpected quality, and “must-be” or expected qual- ity. Waiting time or reduced cycle time is a one-dimensional quality measure that can readily be perceived. An example of unexpected quality is when a staff person stops a task to assist a lost visitor. One example of must-be, or expected, quality is the avoidance of a hospital-acquired infection, which at a minimum, patients do not expect to acquire while in the hospital (Gaucher & Coffey, 1993).
O’Leary (1994) presents a more elaborate framework to assess quality performance by suggesting that quality performance in health care departments can be measured using nine dimensions: appropriateness, continuity, effectiveness, efficacy, efficiency, timeliness, availability, respect and caring, and safety.
Literature on quality service emphasizes quality performance assessment. Given that health care is part of the service industry, it is important to examine relevant work per- formed in this area in order to understand our conceptualization of health care quality. For example, Fiegenbaum, Ishikawa, Taguchi, Crosby, Kearns, Mazda, Taylor, Deming, and Juran have made significant contributions to TQM (Deming, 1986; Gabor, 1990; Ishikawa, 1985; Juran, 1988).
254 JOURNAL OF APPLIED QUALITY MANAGEMENT Vol. ~/NO. 2/l 999
The work of Parasuraman et al. (1985, 1988), Zeithaml, Parasuraman, and Berry (1990), Berry and Parasuraman (1991, 1993), and Berry et al. (1994) focuses on conceptu- alizing quality performance in the service industry. They draw on 11 dimensions of service quality: reliability, responsiveness, competence, access, courtesy, communication, credi- bility, security, understanding/knowing the customer, empathy, and facilities and person- nel tangibles.
A comparison of Parasuraman, Zeithaml, and Berry’s service quality measures (1985; 1988; 1990; 1991; 1993; 1994), those proposed by O’Leary (1994), and JCAHO (1995) guidelines for quality reveal many similarities. For example, all three emphasize coordina- tion, courtesy, respect, efficiency, and effectiveness. O’Leary, the JCAHO, and Parasura- man et al., embody many quality dimensions suggested by the major quality awards (Baldrige Award Criteria, 1995; JCAHO, 1995; Parasuraman, Zeithaml, & Berry, 1985; 1987, 1990, 1991, 1993, 1994; Shingo Prize, 1995).
The survey items in this research are patterned after the SERVQUAL instrument devel- oped by Zeithaml et al. (1990) and validated by Pitt, Watson, and Kavan (1995). Each quality performance item is grounded in a validated instrument, and every attribute in this study has been rigorously examined and validated.
Management of Health Care Information
A common thread throughout the TQM literature is the supportive role that information management plays in quality performance. Information and analysis are core components of the Malcolm Baldrige Award (Garvin, 1987; George, 1992; Haavind et al., 1992; Hart & Bogan, 1992), the Shingo Prize for Excellence in Manufacturing (1994), and the Accredita- tion Manual for the JCAHO (1995). As Davenport (1994) points out, information manage- ment plays a supportive role in making processes more efficient and effective.
The health care sector is an information-laden industry (Pegels, 1995); however, today’s health care information requirements differ from those of the past, in terms of both the internal and external reporting needs of health care departments (DesHarnais, Mar- shall, & Dulski, 1994). Today, physicians, quality managers, TQM teams, marketing staff, financial managers, regulators, insurance providers, accreditation agencies, purchasers, coalitions, and other customers generate greater demands for information related to scientific/ technical aspects, patient care, customer satisfaction, and administrative functions.
The authors of this study have drawn on the JCAHO objectives for continuously improv- ing information management. These provide a useful base but do not reflect an adequate list of attributes; therefore, we have expanded on these items to at least partially fill this gap.
The management of scientific/technical, patient care, customer satisfaction, and admin- istrative information is composed of several attributes, a comprehensive list of which has been constructed based on the literature. The attributes accessibility, accuracy, standard- ized definition, timeliness, completeness, security, analysis, reporting, and quality have their origins in the JCAHO (1995), Baldrige Award (1995), Shingo Award Criteria (1995), Deming Prize (1994), European Quality Award (1995) and textbooks (Parker & Case, 1993; Stair, 1992).
Information Technology Infrastructure
Traditionally, IT infrastructures closely paralleled the rigid functional hierarchy of the health care organization. Hardware, software, databases, and networks were rarely inte-

Management of information Technology and Quality Performance 255
grated, standardized, or sophisticated. As a result of these fragmented, unstandardized sys- tems, information flows were uncoordinated, unreliable, and disjointed (Anderson, Aydin, & Jay, 1994). Today, IT infrastructures are increasingly challenged in terms of responsive- ness to scientific/technical, patient care, customer satisfaction, and administrative informa- tion needs. To achieve requisite responsiveness, the information technology infrastructure is evolving in its ability to connect professionals to one another and to deliver timely infor- mation within and among functional departments (Nolan & Crosan, 1995). Our research model hypothesizes that IT infrastructure (Zl) is a moderator variable on the relationship between management of information (X) and quality performance (Y). This moderation effect can be analyzed using the four-step typology of Sharma, Durand and Oded (1981) as shown in Figure 2.
The first step was to use the moderated regression procedure (MRP) to determine whether a significant interaction occurred between the predictor variable (X) and the mod- erator variable (Z). The second step was to determine the relationship between the moder- ator variable and the criterion variable. The third step was to determine if (Z) was related to the predictor or criterion variable. If there was a relationship, then (Z) was a quasi mod- erator variable. If not, then (Z) was a pure moderator variable.
The third step is to determine if (Z) is related to the predictor or criterion variable. (If (Z) was related, it is an exogenous, intervening, antecedent, suppressor or predictor vari- able.) We proceeded to step four if (Z) was not related to either the criterion or predictor variables. The fourth step was to use median or other types of splits to subgroup the total sample using the hypothesized moderator variable. We did a test of significance for differ- ences in predictive validity across subgroups. If no significant differences were found, then (Z ) was not a moderator. (Z) is a homologizer operating through the term if signifi- cant differences were found.
Health care IT infrastructures enable health care professionals in functional depart- ments to perform their work (Rodger, Pendharkar, & Paper, 1995). Various health care teams draw on the IT infrastructure in order to gather, coordinate, and deliver scientific/ technical, patient care, customer satisfaction, and administrative information. IT infra-
Related to Criterion and or Predictor
Variable
Not Related to Criterion and
Predictor Variable
No Interaction With Predictor Variable
Interaction With Predictor Variable
Intervening Exogenous Antecedent Suppressor Predictor
2
Homologizer Moderator
3 “Quasi”
Moderator
Adapted from Sharma et at. (
4 “Pure”
Moderator
985)
FIGURE 2 Typology of Specification Variables
256 JOURNAL OF APPLIED QUALITY MANAGEMENT Vol. ~/NO. 2/l 999
structure can be defined by the standardization, sophistication, and integration of its con- stituent components.
Systems integration, standardization, and sophistication are additional ingredients nec- essary for coordinating the data repositories of scientific/technical, patient care, customer satisfaction, and administrative information systems (Duncan, Ginter, & Swayne, 1995). As the number and type of health care workers using computers as a part of their daily activities increase, it becomes evident that an integrated, standardized, and sophisticated IT infrastructure is essential to maintain and improve quality performance (Luttman, Siren, & Laffel, 1994).
IT infrastructure is an important differentiating factor between high- and low-quality performance in health care departments (Collins, 1994). Hardware, software, networks, and databases comprise the major components of information technology that gather, store, and disseminate information about quality (Glasser, 1994; Goverman, 1994). The integration, standardization, and sophistication of these components significantly improve the capabilities of organizational information systems (Keen, 1991; Schyve & Kamowski, 1994; Scott-Morton, 1991).
A comprehensive list of attributes for IT infrastructure was constructed based on the lit- erature. Each IT infrastructure attribute proposed in this research is grounded in theory or adopted from a validated instrument. The attributes-integration, standardization, and sophistication-are theoretically addressed (Keen, 1991; Scott-Morton, 1991; Sprague & McNurlin, 1993). In addition, the JCAHO (1995) expressly states the existence of four distinct types of information and information systems. Several items in our instrument were directly adopted from the JCAHO on scientific/technical, patient care, customer sat- isfaction, and administrative information systems.
SAMPLE
Two groups of constituents, managers and customers, were selected to participate in this study. The first step was to identify managers from 10 health care facilities who would agree to complete the questionnaires. The managers were personally contacted, by tele- phone, or through written communication and asked if they would be willing to complete the surveys. Managers included key administrative directors, as well as supervisors from the major functional levels of radiology, medical laboratory, pharmacy, nursing, respira- tory, billing, surgery, nuclear medicine, emergency room, and pediatrics.
It was deemed feasible to collect customer surveys from these same functional areas. A mall intercept approach was adopted in which customers were asked to complete the sur- vey in waiting areas and other high-traffic locations associated with the various depart- ments. One strength of this method was that the customers could have the survey shown and explained to them. Inherent in this technique, however, are the distractions associated with respondents who may be in a hurry or not in the proper frame of mind, in addition to an increased probability of interviewer bias and nonprobability sampling problems.
The functional department was the unit of analysis in this study. These departments, listed in Table 1, provide the fundamental services in most health care organizations. Hospi- tal and departmental demographics are a rich source of information for describing the research sample. The number of total respondents and descriptions of the hospitals, respec- tive departments, responding managers, and customers are also summarized in Table 1.

257 Management of Information Technology and Quality Performance
TABLE 1 Respondent Demographics
Department Radiology Medical laboratory Pharmacy Nursing Respiratory Billing/medical records Surgery Nuclear medicine Emergency room Pediatrics Administration Physical therapy
Title Director Manager Supervisor Administrator Doctor
Number of employees Less than 5 5-l 0 11-15 16-20 21-25 More than 25
7 (76.9%) lO(ll.O%)
9 (9.9%) 14 (15.4%)
6 (6.6%) 12 (13.2%)
8 (8.8%) 5 (5.5%) 8 (8.8%) 5 (5.5%) 5 (5.5%) 2 (2.2%)
40 (44.0%) 20 (13.2%j 17 (18.7%) 10 (11 .O%)
4 (4.4%)
20 (13.2%) 17 (18.7%) 18 (19.9%)
6 (6.6%) 5 (5.5%)
25 (27.5%)
Type of employee Administrative Health care professional Technical/support Administrative/technical Professionals/technical Administrative/professionals All three types
Operating budget Less than 100,000 100,001-500,000 500,001-999,999 l-5.9 million 6-l 0 million More than 10 million Did not respond
Number of patients served Less than 50 51-100 101-200 201-300 More than 300 Did not respond
Hospital size 75-600 beds
8 (6.5%) 3 (3.3%) 3 (3.3%)
11 (12%) 12 (13.0%)
8 (8.7%) 47 (51 .q %)
12 (13.0%) 20 (21.7%)
6 (6.5%) 22 (23.9%)
2 (2.2%) 2 (2.2%)
27 (30.4%)
35 (38.5%) 18 (19.7%) 10 (10.9%)
7 (7.6%) 5 (5.5%)
16 (17.6%)
10 (100%)
RESEARCH INSTRUMENT Instrument pretesting and validity reviews were undertaken as a trial run on a small scale before the final instrument was deployed (Kervin, 1992). The instrument was tested for content validity at both the manager and customer levels. The initial response to the instru- ment was generally positive, and the feasibility of the research seemed reasonable. Mem- bers of health care facility departments were asked to participate if they had instituted quality initiatives. Quality performance was assessed using respondent answers ranging from “strongly disagree” to “strongly agree.” MOHCI was conceptualized as ranging from “very low” to “very high.” Respondents covered the entire range of IT infrastructure. Sophistication ranged from “very old technology” to “leading edge technology.” Standard- ization and integration of IT infrastructure ranged from “very low” to “very high.” Repre- sentatives from each health care facility were asked to complete a survey for at least one department; however, most of the respondents provided input on at least five of their departments.
The research instrument was initially purported to have face validity because the author had over 15 years of experience working in the health care field at five separate health care facilities. Face validity was also verified through the expertise of several professors and medical doctors. The instrument was refined through the efforts of a pharmacist and a

258 JOURNAL OF APPLIED QUALITY MANAGEMENT Vol. ~/NO. 2/l 999
Doctor of Pharmacy at two different health care facilities. These individuals did not respond on the finalized survey in order to eliminate any bias that may have been inherent in the refinement process.
Pilot test study respondents included a representative from a 400-bed teaching hospital in western Pennsylvania and a representative from a loo-bed health care facility in central Pennsylvania. From this pilot study, several points were clarified and refined. First, the department as the unit of analysis was judged as appropriate for the study. Second, the review indicated that the questionnaire was too lengthy; therefore, the IT infrastructure properties of sophistication, integration, and standardization were reduced from 30 to 12 items. The original 30 items included questions on hardware, software, databases and net- works for scientific/technical, patient-care, administrative, and customer satisfaction. These components of information systems were reduced to the common denominator of information technology, in order to simplify the instrument and reduce its size. Third, the instructions given in several sections of the survey were ambiguous and imprecise. Sug- gestions from the pilot respondents were incorporated into the introductory text of each of the major sections of the instrument. Finally, individual items were modified based on sug- gestions from the respondents to enhance clarity and reduce redundancy. The response format of the instrument was iteratively adapted to ensure respondent readability and ease of use. In effect, much effort was expended to ensure the instrument was “user friendly.”
Following numerous refinements of the instrument, a second questionnaire for manag- ers was tested with respondents from a 200-bed facility in Johnstown, Pennsylvania. In this test, a laboratory director and a director of nursing were asked to complete the survey and comment on the accuracy, reliability, and validity of the instrument. Results were pos- itive, and no further adjustments were made to the instrument.
In a similar manner, a separate instrument was tested for measuring the perceptions of quality in health care departments. Customers who received health care services from one of the key functional departments at five different health care facilities were asked to com- plete the survey and provide comments regarding the clarity, readability, and content of the instrument. In general, these customers were satisfied with the survey instrument; how- ever, several refinements were deemed necessary, specifically in the wording of the instructions. Comments received from these patients were more generally directed toward shortcomings in departmental health care service rather than in the content of the ques- tionnaire itself.
A refined customer survey was then tested on five different customers from five sepa- rate departments of five different health care facilities. Customers generally responded positively on the wording and meaning of the 30 items on the instrument; therefore, the customer questionnaire was adopted without further refinement.
Administration of the Instrument
The next step in the data collection process was to actually administer the instrument to gather the data from the subset of units of the population (Kervin, 1992). To facilitate the data-gathering process, the questionnaires were hand delivered to a key contact manager at each of the 10 participating sites. On completion of the questionnaire, the author person- ally gathered, identified, and categorized the surveys from the respondents. From these same 10 health care facilities, the author also collected customer data on designated func-

Management of Information Technology and Quality Performance 259
tional areas, including radiology, lab, pharmacy, nursing, respiratory, billing, surgery, nuclear medicine, emergency room, and pediatrics. By having the quality performance portion of the questionnaire completed by both customers and managers, it is possible to compare the means (descriptive statistics) between these two groups using MANOVA and a two-tail t-test in order to observe significant differences.
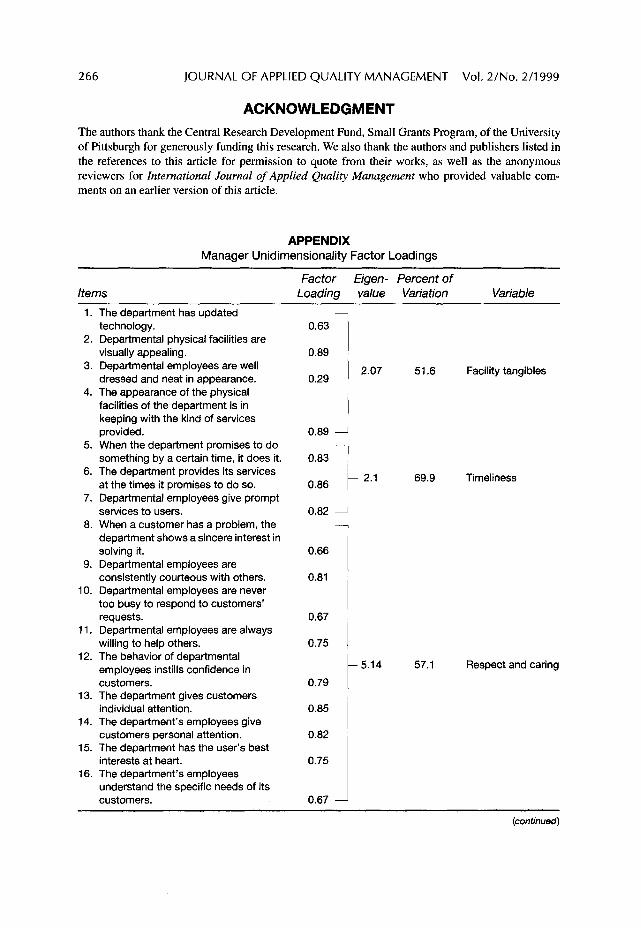
Unidimensionality and Factor Analysis
The unidimensionality of the different constructs was validated using exploratory fac- tor analysis. Principal components analysis, with Varimax rotation, was used. Factor anal- ysis was run separately on manager and customer data. Appendix A shows the results of factor analysis of items constituting 10 manager quality performance variables. All of the items in each variable generally loaded on a single factor. The 10 manager quality perfor- mance variables and customer quality performance variables were factor analyzed sepa- rately. Two factors were retained in each case. The manager factor loadings are shown in Table 2.
RESULTS
Hypothesis 1. Better overall management of health care information should be directly related to increased quality performance at the departmental level of health care facilities.
A significant relationship was found between overall management of health care infor- mation and increased quality performance at the departmental level of health care facili- ties. The R-square, F-value, and Pr > F are shown in Table 3.
Testing of Interaction Hypotheses
Hypothesis 2. The integration of IT infrastructure should moderate the effect of management of health care information and quality performance at the departmental level of health care facilities.
Variable
TABLE 2 Manager Factor Loadingsa
Factor 1 Factor 2
Appropirateness 0.37 0.71 Facility tangibles -0.02 0.68 Continuity 0.26 0.80 Efficiency 0.39 0.66 Timeliness 0.82 0.13 Respect and caring 0.72 0.45 Safety 0.51 0.65 Effectiveness 0.82 0.13 Availability 0.71 0.28 Efficacy 0.57 0.55
a Factor 1: eigenvalue = 5.29; factor 2: eigenvalue = 1.09.

260 JOURNAL OF APPLIED QUALITY MANAGEMENT Vol. ~/NO. 2!1999
TABLE 3 Testing Direct Relationshipa
Management of Health Care Information R-Square F-Value Pr > F Significance
Overall 0.22 25.05 0.0001 Significant
a Dependent variable is quality performance.
Hypothesis 3. The sophistication of IT infrastructure should moderate the effect of management of health care information and quality performance at the depart- mental level of health care facilities.
Hypothesis 4. The standardization of IT infrastructure should moderate the effect of management of health care information and quality performance at the depart- mental level of health care facilities.
To determine if the IT infrastructure variables were indeed true, moderators required the following steps according to Sharma et al’s (1981) typology. First, it had to be determined if there is an interaction between the predictor variable and the proposed moderator vari- able. A moderated regression analysis was run to determine this interaction. It was found that management of health care information had no interaction with integration of IT infrastructure (p = 0.18), sophistication of IT (p = 0.26) and standardization of IT infra- structure (p = 0.16). Because no significant interaction was found between management of health care information and all three IT infrastructure variables (integration and stan- dardization and sophistication), we proceeded to step three of the typology.
The third step is to determine if the moderator variable is related to the predictor or cri- terion variable. There was a significant relationship between quality performance and inte- gration of IT infrastructure (p = 0.007) and between management of health care information and integration of IT infrastructure (p = 0.0001). In a similar manner, there was a significant relationship between quality performance and standardization of IT infrastructure (p = 0.002) and between management of health care information and stan- dardization (p = 0.0001). Finally, while there was not a significant relationship between quality performance and sophistication of IT infrastructure (p = 0.61), there was a signif- icant relationship between management of health care information and sophistication (p = 0.0001). Therefore, integration, standardization, and sophistication fall into the first cell of Sharma et al.‘s typology and are all considered to be either intervening, exogenous, ante- cedent, suppressor, or predictor variables. In effect this tells us that IT infrastructure does not act as a moderator through interaction effects. Rather IT infrastructure exerts a direct effect on quality performance.
A comparison of means between customers and managers led to several conclusions. In general, managers tended to rate quality performance higher than customers in nearly all cases. Notable exceptions were in the fact that the customers found the physical facilities more appealing than the managers. (Perhaps the managers were tired of looking at the same surroundings on a daily basis.) The customers also had a higher mean than the man- agers in perceiving that the department possessed updated technology. (It may look new to
Management of Information Technology and Quality Performance 261
customers, but the managers know that it is not state of the art.) There was also a signifi- cant difference (at the 0.05 level) between manager and customer means for nearly all of the items, with the notable exception that both groups agreed that employees were well dressed and neat, (p = 0.16), the department used the correct technology (p = 0.21), the department had convenient operating hours (p = 0.61), and that customers were satisfied with the range of services (p = 0.24).
Customer and manager perceptions of quality were compared using a two-tail t-test of significance. Results of these comparisons are shown in Table 4. The results of the univari- ate tests of significance suggest that, in general, the differences between customer and manager means are statistically significant. Significant differences were found for appro- priateness (0.02), continuity (O.OOOl), efficiency (O.OOOl), timeliness (O.OOOl), respect and caring (O.OOOl), safety (0.002), effectiveness (O.OOOl), efficacy (0.009), and facility tangi- bles (0.002). No significant difference was observed between customer and manager means for availability (0.12). Univariate significance, as well as customer and manager means, for each quality performance factor are shown in Table 5.
Although tests for unidimensionality showed similar results for both customers and managers, factor analysis also illustrated some different perceptions. For example, the manager rotated factor matrix of the original 10 variables loaded on two factors. Appropri- ateness, facility tangibles, continuity, efficiency, and safety loaded on one factor. Timeli- ness, respect and caring, effectiveness, and availability loaded on another factor. Initially, these factor loadings do not appear to make logical sense; however, an important objective of this research was to test the unidimensionality and stability of the factor structure of the dependent variable-quality performance. In addressing the unidimensionality issue, a uni- dimensional factor emerged for each variable for both customer and manager quality per- formance constructs. At the factor level, initially, it appears that some instability exists in the factor structure. Following a more thorough examination of the factor structures, how- ever, we can conclude that the factor structures are not as different as they appear. For example, if a cutoff of 0.3 is used, all 10 items will load on the customer’s first factor, and 8 of the 10 items, excluding facility tangibles and continuity, will load on the managers’ first factor. In a similar manner, the loadings on the customers’ first factor have the same two items with the lowest loadings; therefore, with some qualifications, all 10 factors can be used as part of the quality measure. In other words, the instability is not evidenced by the 0.3 cutoff, therefore, this can be used as a basis for suggesting that the structures are similar, or at the least, evidence exists to suggest similarity. ¬ated structures suggest the same findings.
Objectives
Modem theories of quality performance have provided the health care industry with a conceptual framework (Berry et al., 1994; Berry & Parasuraman, 1991, 1993; Deming, 1986; JCAHO, 1995; Juran, 1989; Parasuraman et al., 1985, 1988; Pitt et al., 1995; Z&ham1 et al., 1990, 1993). This conceptual framework can be used to link the Donabedian trilogy of structure, process, and outcome of care into a cohesive system for evaluating the quality of health care performance at the departmental level (Donabedian, 1988).
Opportunities to improve quality performance are typically stimulated by an examina- tion of the structure or process of care that affects the outcomes (Donabedian, 1988). The

262 JOURNAL OF APPLIED QUALITY MANAGEMENT Vol. ~/NO. 2/l 999
TABLE 4
Item
Descriptive Statistics for Managers and Customers
Customer Manager Signifi- Mean Mean cance
The department has the user’s best interests at heart Department personal employees give customers individual attention The department gives customers individual attention Department employees are consistently courteous with others The department obtains maximum benefit for its customers with
the least expenditure of resources When the department promises to do something by a certain time
it does so The department provides its services at the times it promises to
do so Departmental employees give prompt service to users The behavior of departmental employees instills confidence in
customers Departmental employees have the knowledge to do their job well The department’s employees understand the specific needs of its
customers Departmental employees are never too busy to respond to
customers’ requests The appearance of the physical facilities of the department are in
keeping with the kind of services provided Employees are always willing to help others Departmental employees are well dressed and neat in
appearance The department insists on error-free records Departmental physical facilities are visually appealing The department is dependable The department uses the correct technology and procedures
given the current state of knowledge The department tells customers exactly when services will be
performed Customers feel safe in their transactions with departmental
employees The department has updated technology When the customers have a problem, the department shows a
sincere interest in solving it The department has operating hours convenient to all its
customers The department provides a safe environment for its customers The tasks/procedures utilized by the department leads to the
desired/projected outcomes The department coordinates its services over time with respect to
each customer The department coordinates its services with other departments Customers are satisfied with the range of services available in the
department The department provides appropriate and relevant services to its
customers
3.7 4.3 0.0001
3.8 4.3 0.0001 3.9 4.3 0.001 3.7 4.1 0.0001
3.4 4.0 0.0001
3.3 4.1 0.0001
3.4 4.3 0.0001 3.5 4.2 0.0001
3.6 4.2 0.0001 4.1 4.4 0.002
3.9 4.3 0.0001
3.3 3.8 0.001
4.0 3.5 0.002 3.7 4.2 0.0001
4.1 4.2 0.16 3.6 4.3 0.0001 3.8 3.2 0.0001 3.9 4.6 0.0001
4.2 4.3 0.21
3.7 4.2 0.002
3.9 4.2 0.003 4.0 3.8 0.05
3.7 4.5 0.0001
4.1 4.0 0.61 4.2 4.4 0.03
4.0 4.2 0.02
3.8 4.2 0.001 3.9 4.2 0.002
3.9
4.0
4.0
4.3
0.24
0.003

Management of Information Technology and Quality Performance 263
Factor
TABLE 5 Customer and Manager Means
Customer Manager Mean Mean
Univariate Significance
Appropriateness 3.9 4.2 0.02 Continuity 3.9 4.2 0.0001 Efficiency 3.7 4.1 0.0001 Timeliness 3.4 4.2 0.0001 Respect and caring 3.7 4.2 0.0001 Safety 4.1 4.3 0.002 Effectiveness 3.8 4.4 0.0001 Availability 3.9 4.1 0.12 Efficacy 4.1 4.3 0.009 Facility tangibles 4.0 3.7 0.002 Total quality performance 3.8 4.2 0.0001
disadvantages of attempts to improve quality performance driven by management of infor- mation focused on only one of these three elements are legion (Cohen, 1991; Sanazaro & Mills, 1991). For example, reviews of medical records can have a false-positive rate as high as 95% if they are based on generic screening criteria (Sanazaro & Mills, 1991). In addition, their usefulness as a primary source of data for quality performance assessment and improvement has been questioned (Donabedian, 1988). Even checklist self-reporting by health care providers can be unsatisfactory if the reporting is inconsistent (Cohen, 1991). Furthermore, completing the checklist may be considered a low priority because it is not related to patient care.
DISCUSSION AND CONCLUSION
The private sector has, and continues to, revolutionize health care. Health maintenance organizations (HMOs), insurance companies, physicians, pharmaceutical companies, and hospitals are in a furious struggle to determine which health care customer interests take precedence. Managed care has grown rapidly during this period and has led to dramatic restructuring in the delivery of health care services.
Early HMOs focused on cost containment via preventative care, standardized medical practices, and elimination of unnecessary procedures and tests. More recently, it has become increasingly difficult for HMOs to focus closely on quality while managing costs. Because of these changes in health care, it will be the informed patient who receives the most benefit from a physician consultation. Improved management of information and information technology, such as videos, the Internet, and television, can also be used to empower and inform patients by providing them with the education needed to take charge of their own health.
Health care, demographics, and information technology changes are occurring simulta- neously. As the baby boomers begin to enter their 50s they are placing increased demands on the health care system. These consumers have an insatiable need for information, which may become the impetus for a partnership of informed physicians and patients. Information technology and the management of information will be instrumental in find- ing the right mix of physician autonomy and patient rights.

264 JOURNAL OF APPLIED QUALITY MANAGEMENT Vol. ~/NO. 2/l 999
This research adapted Sharma et al.‘s (1981) typology to the information technology literature. In addition, this is a unique integration of the framework with management of information, IT infrastructure, and quality performance. The utilization of this methodol- ogy has several implications for practitioners. First, it provides health care managers involved in measuring quality performance with a broad view of activities for a wide vari- ety of health care facilities of varying sizes. However, no matter what the size of the orga- nization, it is clear that quality is an enterprise-wide venture. Despite changes in performance measurement systems, the successful competitor initiates and institutes infor- mation systems and management of information which coordinates actions across health care departments and deploys resources across the organization.
Gone are the days when all information needed by a health care facility is kept in one computer. Information today is spread throughout the hospital in many health care facility departments. Often this information is encapsulated in incompatible systems and often with uncoordinated definitions of formats and terms. Distributed computer systems have become the lifeblood of modem health care facilities, small, medium, or large. It is essen- tial that the different parts of the organization, which have different data systems find ways to work together in order to improve quality performance.
Second, this research provides some guidelines for health care managers for facilitating infusion of quality performance measures. Embracing the principles of quality into the health care facility is a broad aim. It is one which needs to be broken into manageable pieces in order to be implemented. The change in behavior and structure needed for improving quality performance is enhanced and enabled by a number of systems in the infrastructure. However, as this research suggests, the information infrastructure itself is not a moderator between management of information and quality, and the systems them- selves do not confer quality.
Third, the study provides descriptive data on the nature of improving quality perfor- mance in the context of information management and IT infrastructure. For example, com- munication and information are the ubiquitous technical elements which are transforming health care into the next quality revolution. They are central, fundamental, and critical to improving quality in health care departments. This information is not only computer text, but also multimedia pictures and voice data as well. In fact, the information technology in health care facilities is so advanced that the technical ability exists to provide a database of photographs of customers, employees, and products by simply clicking a mouse to get the information needed.
Finally, this research sheds light on three fundamental questions about quality perfor- mance measurement and methodology; whether it is reliable in accurately and completely identifying quality indicators; whether it is valid in identifying quality problems which merit further review; and in whether it measures what it is supposed to measure.
Reliability infers stability and the ability of the measure to have good test/retest reli- ability. In other words, the findings must be the same with different raters or data collec- tors. Quality indicators are valid if they identify better or worse outcomes in identical patients. Content validity of quality refers to the extent to which the quality indicator reflects the issue of concern. Criterion validity is composed of two subsets; predictive validity or the strength with which the clinical indicator forecasts future performance and concurrent validity or the strength of the relationship between the quality indicator and another measure of the same event.

Management of information Technology and Quality Performance 265
Practically, one of the biggest reasons for studying quality in hospital departments is to learn how to improve health care through outcomes management. This movement is based on Deming’s theoretical work relating to “total quality management” (Deming, 1986). This process is based on identifying a clinical area which needs potential improvement. Because this decision may be based on recommendations from governmental agencies, health care providers, physicians, society, and other stakeholders, its capacity for practical implications are limitless. Quality does not exist in a vacuum. The vision of quality gives context and perspective to continuous quality improvement. Quality improvement cannot be seen as a one-time effort in which some new stable state is achieved. Rather, quality needs to be perceived as a continuous, never ending improvement which initiates change in the structure of the organization and change in the realignment of its people. Continu- ous quality improvement is the responsibility of everyone in the organization.
This research addresses the issues of quality, management of information, and informa- tion technology. A significant relationship was found between overall management of information and increased quality performance at the departmental level of health care facilities. This relationship suggests that problem reporting on the structure, process, or outcome of health care provides a safety net of information, that helps to ensure that important quality performance problems are not overlooked.
At the aggregate level, it was again evident that managers scored higher means than customers. (This may be due to some social desirability effects in which the managers are fearful of retaliation if the results of the survey are not kept anonymous.) A notable excep- tion was observed regarding facility tangibles, in which the means were higher for the cus- tomers than the managers. Only the availability factor showed a nonsignificant relationship (p = 0.12) at the 0.05 significance level. Finally, total quality performance showed the managers with a higher mean (4.17) than customers (3.8). A significant differ- ence was exhibited in means (p = 0.0001).
On the other hand, the factor loading of all 30 manager items suggest four factors that may be described as patient concerns, departmental operations, departmental safety, and facility tangibles. Obviously, this is a window of opportunity for future research. In a sim- ilar manner, using the original 10 variables, the rotated factor matrix for customers also loaded on two factors. Appropriateness, continuity, efficiency, timeliness, respect and car- ing, safety, effectiveness, availability, and efficacy all loaded on one factor. Only the facil- ity tangibles variable loaded on factor two (0.77). Facility tangibles also loaded on the first factor (0.43). Loading all 30 customer items produced six factors, which could be described as patient concerns, departmental operations, departmental timeliness, facility appearance, departmental coordination, and departmental dependability. Another window of opportunity exists for exploring these theory-building factors. More importantly, factor analysis has been used in this study to illustrate the difference in perceptions between cus- tomers and managers regarding quality performance. Clearly, there is a difference in per- ceptions between managers and customers, as illustrated in the difference in factor loadings between these two groups.
In this research, we are laying the foundations for theory. Building and testing theory may not necessarily be a sequential process. Rather it is iterative with no hard and fast rules. For example, overlaps exist between IT infrastructure, MOHCI, and quality perfor- mance. Only through an iterative process can theory be tested and built on the relation- ships between these constructs.
266 JOURNAL OF APPLIED QUALITY MANAGEMENT Vol. ~/NO. 2/1999
ACKNOWLEDGMENT The authors thank the Central Research Development Fund, Small Grants Program, of the University of Pittsburgh for generously funding this research. We also thank the authors and publishers listed in the references to this article for permission to quote from their works, as well as the anonymous reviewers for International Journal of Applied Quality Management who provided valuable com- ments on an earlier version of this article.
APPENDIX Manager Unidimensionality Factor Loadings
Items Factor Eigen- Percent of
Loading value Variation Variable
9.
10.
11.
12.
13.
14.
15.
16.
The department has updated technology. Departmental physical facilities are visually appealing. Departmental employees are well dressed and neat in appearance. The appearance of the physical facilities of the department is in keeping with the kind of services provided. When the department promises to do something by a certain time, it does it. The department provides its services at the times it promises to do so. Departmental employees give prompt services to users. When a customer has a problem, the department shows a sincere interest in solving it. Departmental employees are consistently courteous with others. Departmental employees are never too busy to respond to customers’ requests. Departmental employees are always willing to help others. The behavior of departmental employees instills confidence in customers. The department gives customers individual attention. The department’s employees give customers personal attention. The department has the user’s best interests at heart. The department’s employees understand the specific needs of its customers.
0.63
0.89
0.29 2.07 51.6 Facility tangibles
0.89 i
0.83
0.86 69.9 Timeliness
0.82 A -
0.66
0.81
0.67
0.75
0.79
0.85
0.82
0.75
0.67 -
5.14 57.1 Respect and caring
(continued)

Management of Information Technology and Quality Performance 267
APPENDIX (continued)
Items Factor Eigen- Percent of
Loading value Variation Variable
17. 18.
19.
20.
21.
22.
23.
24.
25.
26.
27.
28.
29.
30.
The department is dependable. The department insists on error-free records. The department tells customers exactly when services will be performed. The department has operating hours convenient to all its customers. Customers feel safe in their transactions with departmental employees. The department provides a safe environment for its customers. Departmental employees have the knowledge to do their job well. The department utilizes the correct technology and procedures given the current state of knowledge. The department provides appropriate and relevant services to its customers. Customers are satisfied with the range of services available in the department. The department coordinates its services with other departments. The department coordinates its services over time with respect to each customer. The tasks/procedures used by the department leads to the desired/ projected outcomes. The department obtains maximum benefit for its customers with the least expenditures of resources.
0.85 1.44
0.85
0.80 1.27
0.80
I
0.81 I 1.33
0.81
0.82
1.36
0.82 1
0.83
1.37
0.83 I
0.84 I
1.42
0.84 -
0.85 1.45
0.85 J
2.2 Effectiveness
63.3 Availability
66.3 Safety
67.8 Efficacy
68.4 Appropriateness
70.9 Continuity
72.2 Efficiency
REFERENCES
Anderson, J. G., Aydin, C. E., & Jay, S. J. (1994). Evaluating health care information systems: Meth- ods and applications. Beverly Hills, CA: Sage.
Berry, L., & Parasuraman, A. (1991). Marketing services: Competing through quality. New York: The Free Press.
Berry, L., & Parasuraman, A. (1993). Building a new academic field: The case of services marketing. The Journal of Retailing, I, 13-60,69.
Berry, L., Parasuraman, A., & Zeithaml, V. A. (1994). Improving service quality in America: Lessons learned. The Academy of Management Executive, 2(8), 32-52.
Cohen, J. (1991). Quality assurance initiatives. Problems in Anathesia, 5,277-293. Collins, L. W. (1994). TQM information systems: An elusive goal. Journal on Quality Improvement,
11(20), 607-613.

268 JOURNAL OF APPLIED QUALITY MANAGEMENT Vol. ~/NO. 2/l 999
Davenport, T. H. (1994). Saving IT’s soul: Human-centered information management, Harvard Business Review, March-April 2:(72), 119-13 1.
Dean, J. W., & Bowen, D. E. (I 994). Management theory and total quality: Improving research and practice through theory development. Academy @“Management Review, 3( 19), 392-418.
Dean, J. W., & Evans, J. R. (1994). Total quality: Management, organization, and strategy (p. 181). New York: West Publishing Company.
Deming, W. (1986). Out of crisis. Cambridge, MA: MIT Press. Deming Prize Criteria. (1994). Japanese Union ofScientists and Engineers. Japan. DesHamais, S., Marshall, B., & Dulski, J. (1994). Information management in the age of managed
competition. Journal on Quality Improvement, 11(20), 63 l-638. Donabedian, A. (1988). The quality of care. How can IT be accessed? JAMA, 260, 1743-1748. Duncan, W. J., Ginter, P M., & Swayne, L. E. (1995). Strategic management of health care organi-
zations. Cambridge, MA: Blackwell. European Quality Award. (1995). European Foundation for Quality Management. Eindhoven:
Netherlands. Flynn, B. B., Schroeder, R. G., & Sakakibara, S. S. (1994). A framework for quality measurement
research and an associated measurement instrument. Journal of Operations Management, 11, 339-366.
Gabor, A. (1990). The man who discovered quality New York: Times Books, Random House. Garvin, D. (1987). How the Baldrige Award really works. Harvard Business Review. 80-95. Gaucher, E., & Coffey, R. (1993). Total quality in health care: From theory to practice. San Fran-
cisco, CA: Jossey-Bass. George, S. (1992). The Baldrige quality system: The do-it-yourself way to transform your business.
New York: John Wiley and Sons. Glasser, J. 1994. Developing a clinical information system: The role of the chief information officer.
Journal on Quality Improvement, I I(20), 6 14-622. Goverman, I. L. (1994). Orienting health care information systems toward quality: How group health
cooperative of Puget Sound did it. Journal on Quality Improvement, 11(20), 595-606. Haavind R. et al. (1992). The road to the Baldrige Award: Quest for total quality. Boston, MA:
Butterworth-Heinemann. Hart, C. W. L., & Bogan, C. E. (1992). The Baldrige: What it is, how it’s won, how to use it to
improve quality in your company, New York: McGraw-Hill. Ishikawa, K. (1985). What is total quality control? The Japanese way. Englewood Cliffs, NJ:
Prentice-Hall. Joint Commission on Accreditation of Hospital Organizations. (1995). Accreditation manual for
hospitals. Juran, J. (1988). Juran’s quality control handbook. 4th ed. New York: McGraw-Hill. Juran, J. (1989). Juran on planning for quality. New York: The Free Press. Kano, N., Seraku, N., Takahashi, F., & Tsuji, S. (1984). Attractive quality and must be quality. Qual-
ity, 2( 14), 39-48. Keen, P. (1991). Shaping the future: Business design through information technology. Cambridge,
MA: Harvard Business School Press. Kervin, J. (1992). Methods for business research. New York: Harper-Collins. Luttman, R. J., Siren, P B., & Laffel, G. L. (1994). Assessing organizational performance. Quality
Management in Health Care, 2(4), 44-53. Malcolm Baldrige National Quality Award. (1995). Award criteria. Gaithersburg, MD: National
Institute of Standards and Technology. Nolan, R. L., & Crosan, D. C. (1995). Creative destruction: A six-stage process for transforming the
organization. Boston, MA: Harvard Business School Press.
Management of information Technology and Quality Performance 269
O’Leary, D. (1994). The measurement mandate: On the road to pe$ormance improvement in health care. Oakbrook Terrace, IL: Joint Commission on Accreditation of Healthcare Organizations.
Parasuraman, A., Zeithaml, V. A., & Leonard, L. B. (1985). A conceptual model of service quality and its Implications for future research. Journal ofMarketing. 41-50.
Parasuraman, A., Zeithaml, V. A., & Leonard, L. B. (1988). SERVQUAL: A multiple-item scale for measuring consumer perceptions of service quality. Journal of Retailing, I, 12-41,64.
Parker, C., & Case, T. (1993). Management information systems: Strategy and action. Watsonville, CA: McGraw-Hill.
Pegels, C. C. (1995). Total quality management: A survey of its important aspects. Danvers, MA: Boyd and Fraser.
Pitt, L., Watson, R., & Kavan, C. (1995). Service quality: A measure of information systems effec- tiveness. MIS Quarterly, 2(19), 173-187.
Rodger, J., Pendharkar, I?, & Paper, D. (1995). End-user perceptions of information technology in health care. Journal of High Technology Management Research (Fall): 134-136.
Sahney, Vinod K. (1993). Evolution of hospital industrial engineering: From scientific management to total quality management. Journal for the Society for Health Systems, 1-17.
Sanazaro, P., & Mills, D. (1991). A critique of the use of generic screening in quality assessment. JAMA, 265, 1977-1981.
Saraph, J. V., Benson, P. G., & Schroeder, R. G. (1989). An instrument for measuring the critical fac- tors of quality management. Decision Sciences, 20, 810-829.
Schyve, P. M., & Kamowski, D. B. (1994). Information management and quality improvement: The Joint Commission’s perspective. Quality Management in Health Care, 2(4), 54-62.
Scott-Morton, M. (1991). The corporation of the 1990s: Information technology and organizational transformation. New York: Oxford Press.
Sharma, S., Durancl, R. M., & Oded, G. (1981). Identification and analysis of moderator variables. Journal of Marketing Research, l&291-300.
Shingo Prize for Excellence in Manufacturing. (1995). Application Guidelines. Logan, Utah. Sprague, R. H., & McNurlin, B. C. (1993). Information systems management in practice. Englewood
Cliffs, NJ: Prentice Hall. Stair, R. M. (1992). Principles of information systems: A managerial approach. Boston, MA: Boyd
and Frasier. Westphal, J. D., Gulati, R., & Shortell, S. M. (1997). Customization or conformity? An institutional
and network perspective on the content and consequences of TQM adoption. Administrative Science Quarterly, 366-390.
Zeithaml, V., Parasuraman, A., & Berry, L. (1990). Delivering quality service: Balancing customer perceptions and expectations. New York: The Free Press.
Zeithaml, V., Parasuraman, A., & Berry, L. (1993). The nature and determinants of customer expec- tations of service. Journal of the Academy of Marketing Science, l-12,21.