management information system (mis) of indian government’s ... · management information systems...
TRANSCRIPT

Institute of Applied Manpower ResearchPlanning Commission, Government of India
IAMR Occasional Paper No. 5/2012
Santosh Mehrotra, D. Indrakumar and Vijay Saxena
Management Information System (MIS) ofIndian Government’s Flagship Programmes:
Are they an adequate monitoring tool?

© Institute of Applied Manpower Research, 2013 First Edition published in 2013
ISBN: 978-93-83133-04-8
All right reserved. No part of this publication may be reproduced, stored in a retrieval system, or transmitted, in any form or by any means, without the prior permission in writing of IAMR.
City Office: 53, Lodhi Estate, New Delhi-110 003, India Campus: Sector A-7 Narela Institutional Area, Delhi-110 040, India

Management Information Systems (MIS) of
Indian Government’s Flagship Programmes: Are they an adequate monitoring tool?
Santosh Mehrotra, D. Indrakumar and Vijay Saxena
Institute of Applied Manpower Research Planning Commission, Government of India

About the Authors
Santosh Mehrotra is Director-General, Institute of Applied Manpower Research, the only autonomous research institute of the Planning Commission, with the rank of Permanent Secretary to the Government of India. He was earlier Head of the Rural Development Division and Economic Adviser for the social sectors, Planning Commission (2006-08) and a lead author of India’s 11th Five Year Plan (2007-12). He also led the team that wrote India’s Human Development Report 2011, only the second national HDR.
He is a human development economist, and his research, and his research interests have spanned industry and trade issues, the impact of macro-economic policy on health and education, the informal sector, and the economics of health and education.
He was Regional Economic Advisor for Poverty, Regional Centre for Asia, United Nations Development Programme (UNDP), Bangkok (2005-06), and chief economist of the global Human Development Report, UNDP, New York (2002-2005). He also led Unicef’s research programme on developing countries at the Innocenti Research Centre, Florence (1999-2002). After an MA in Economics from the New School for Social Research, New York, and Phd from Cambridge University(1985), Santosh was Associate Professor of Economics, Jawaharlal Nehru University, New Delhi (1988-1991). Since then he has been 15 years with the UN, as a policy advisor to developing country governments. He is currently Parkin Visiting Professor at Centre for International Development, University of Bath, UK (2010-2013).
His books include: India and the Soviet Union: Trade and Technology Transfer (Cambridge University Press, 1990); Development with a Human Face: Experiences in Social Achievement and Economic Growth (Oxford University Press, 1997); Le Developpement a Visage Humain (Economica, Paris, 2001); Universalizing Elementary Education in India: Uncaging the Tiger Economy (Oxford University Press, 2005); The Economics of Elementary Education in India (Sage, 2006). Two co-authored books were published in 2007: Asian Informal Workers: Global Risks, Local Protection (Routledge, London), and Eliminating Human Poverty: Macro-economic and Social Policies for Equitable Growth (Zed, London). Four more books are forthcoming in 2013: India’s Skill Challenge: Reforming the Vocational Training System to realise the Demographic Dividend (Oxford University Press); Land Policies for Agricultural Growth into Equity: Transforming Agrarian Structures in Uttar Pradesh (Sage); Human Development and Extremism: Striking a Balance between Staff Security and Justice for Citizens (ed.) (Sage); and Policies to Achieve Inclusive Growth in India (Cambridge University Press).
D. Indrakumar is Assistant Director, Institute of Applied Manpower Research (IAMR) since 2005. He has an M.A. and M.Phil in Economics from Madurai Kamaraj University and Gandhigram Rural University respectively. Earlier he was Lecturer in Sethupathy Government Arts College (an affiliated college of Alagappa University, Karaikudi). He has research experience on health, marketing and human resource development. Vijay K. Saxena is a faculty member of the Institute of Applied Manpower Research (IAMR) since 1996 working as Assistant Director. He has an M.A. in Economics and Sociology from Meerut University, Uttar Pradesh. Before this, he was worked as Senior Research Associate in various NGOs. He has contributed to research projects on educational development, evaluation of the schemes, labour productivity development, manpower assessment, skill development, rural development and human resource requirements for the rehabilitation of persons with disability. For over five years he has led IAMR’s flagship publication, Manpower Profile India Year Book.

Acknowledgements
Dr. I.C. Awasthi contributed to prepare a very early draft of the paper and held discussions with two ministries on the subject, and his contribution is gratefully acknowledged All the fieldwork and interviewing of staff from the 12 ministries operating the flagship programmes were assiduously carried out by D. Indrakumar and Vijay Saxena. The latter two faculty members also examined the online websites of each programme, before conducting interviews with Ministry officials.
Thanks are due to Ankita Gandhi for an excellent peer review of the paper. Her
inputs and suggestions were extensively used in improving its analytical content and structure. We are extremely grateful to staff from the Union Ministries of: Rural Development (Department of Rural Development), Urban Development, Women and Child Development, Health and Family Welfare, School Education, Drinking Water and Sanitation Department (Ministry of Rural Development), Ministry of Water Resources, Department of Telecommunication, Ministry of Power and Planning Commission for generously giving their time. The usual disclaimers apply. This paper is a draft for discussion, and we would welcome comments and suggestions from the relevant Ministries as well as from State Government officials implementing these programmes.

Contents
Abstract
I Introduction
1
II Criteria for Evaluating MIS 4
III An Assessment of Flagship Programme’s MIS 9
Administrative level of data collection and presentations
10
Log frame use
12
Periodic data authentication and validation
13
Periodicity of data reporting: Is the information up-to-date?
13
Accessibility of data: Is the website user friendly? Utilisation of data
14 14
Connecting output/outcome and survey data
15
Online Monitoring
16
IV Concluding remarks
16
Appendix: Scheme wise analysis of MIS 19
1) The Rural Road Programme: Pradhan Mantri Gram Sadak
Yojana (PMGSY)
19
2) The Mahatma Gandhi Rural Employment Guarantee Act
(MGNREGA)
22
3) National Rural Health Mission (NRHM)
26
4) National Rural Drinking Water Programme (NRDWP)
29
5) Total Sanitation Campaign (TSC)
32
6) Rural Electrification Programme: Rajiv Gandhi Grameen
Vidhyutikaran Yojana (RGGVY)
34
7) Low Cost Housing to Rural Poor: Indira Awaas Yojana
(IAY)
36

8) Universalisation of Elementary Education (UEE): Sarva
Shiksha Abhiyan (SSA)
38
9) Jawaharlal Nehru National Urban Renewal Mission
(JNNURM)
40
10) Integrated Child Development Services (ICDS)
42
11) Mid-Day Meal Scheme (MDMS)
46
12) Rural Telephony
49
13) Irrigation
50
References 53

List of Tables
Table No. Page No.
1 Budgetary Allocation for Flagship Programmes of the Central Government, 2011-12
3
2 Agencies that developed MIS/web portal of the Scheme 7
3 The MIS of the Ministry and the Information with the PMO 8
4 Ranking of schemes by criteria to assess flagship programmes’ MIS 9
5 Details of the MIS data of the flagship programmes 11
A1 Rural Roads Programme (PMGSY): Information available on the Web Portal
20
A2 The Rural Employment Guarantee Programme (MNREGA): Information available on the Portal
23
A3 National Rural Health Mission: Information Available on the Portal 27
A4 Rural Drinking Water Programme (NRDWP): Information available on the portal
30
A5 Total Sanitation Campaign (TSC): Information available on the portal
33
A6 Rural electrification Programme (RGGVY): Information available on the Portal
35
A7 Housing for the rural poor (IAY): Information available on the Portal
37
A8 The Universalisation of elementary education programme (SSA): Information available on the Portal
38
A9 Jawaharlal Nehru National Urban Renewable Mission: Information Available on the Portal
41
A10 Integrated Child Development Services: Information Available on the Portal
43
A11 The School Mid-Day Meal Programme: Information available on the portal
47

Abbreviations
ASHA Accredited Social Health Activist
BPL Below Poverty Line
BRC Block Resource Centres
BRGF Backward Regions Grant Fund
CBOs Community Base Organisations
CCA Controller of Communication Accounts
CDAC Centre for Development of Advanced Computing
CEGC Central Employment Guarantee Council
CWC Central Water Commission
DISE District Information System for Education
DLHS District Level Household Survey
DMU Delivering Monitoring Unit
DPC District Programme Coordinator
Ed.CIL Education Consultant India Limited
EMIS Education Management Information System
GDP Gross Domestic Product
GIS Geographical Information System
GoI Government of India
GP Gram Panchayat
HMIS Health Management Information System
IAY Indira Awaas Yojana
ICDS Integrated Child Development Service
ICT Information Communication Technology
IIS Integrated Information System
IMIS Integrated Management Information System
IVRS Interactive Voice Response System
JNNURM Jawaharlal Nehru National Urban Renewable Mission
JRM Joint Review Mission
M & E Monitoring & Evaluation

MDI Management Devolution Index
MDMS Mid Day Meal Scheme
MGNREGS Mahatma Gandhi National Rural Employment Guarantee Scheme
MHRD Ministry of Human Resource Development
MIS Management Information System
MoC &IT Ministry of Communication & Information Technology
MoRD Ministry of Rural Development
MPR Monthly Progress Report
NFHS National Family Health Survey
NGOs Non Governmental Organisations
NIC National Informatics Centre
NIRD National Institute of Rural Development
NQM National Quality Monitors
NRDWP National Rural Drinking Water Programme
NRHM National Rural Health Mission
NRRDA National Rural Roads Development Agency
NWRIS National Water Resource Information System
OMMAS Online Management, Monitoring & Accounting System
PEC Performance Evaluation Committee
PEO Programme Evaluation Organisation
PHC Primary Health Centre
PIU Programme Implementation Unit
PMES Programme Management and Evaluation Service
PMGSY Pradhan Mantri Gram Sadak Yojana
PMO Prime Minister’s Office
QPR Quarterly Progress Report
RBC Rural Building Centres
RCH Reproductive and Child Health
REC Rural Electrification Corporation
RFD Results Framework Document
RGGVY Rajiv Gandhi Grameen Vidhyutikaran Yojana

RGNDWM Rajiv Gandhi National Drinking Water Mission
SEGC State Employment Guarantee Council
SHGs Self Help Groups
SNP Supplement Nutrition Programme
SRS Sample Registration System
SSA Sarva Shiksha Abhiyan
TSC Total Sanitation Campaign
UEE Universalisation of Elementary Education
UID Unique Identification
UIG Urban Infrastructure Governance
ULB Urban Local Bodies
UNDP United Nations Development Programme
UNICEF United Nations Children's Fund
USOF Universal Service Obligation Fund
UTs Union Territories
VMCs Vigilance and Monitoring Committees
VPTs Village Public Telephones
VWSCs Village Water and Sanitation Committees
WHO World Health Organisation

List of Flagship Programmes assessed in the paper
I. Bharatnirman Schemes for Building Rural Infrastructures
a) National Rural Drinking Water Programme
b) Housing to Rural Poor – Indira Awaas Yojana
c) Rural Telephony
d) Rural Roads – Pradhan Mantri Gram Sadak Yojana
e) Rural Electrification
f) Irrigation
II. Other Programmes
a) Mahatma Gandhi National Rural Employment Guarantee Scheme
b) Universalisation of Elementary Education: Sarva Shiksha Abhiyan
c) Mid Day Meal Scheme
d) Integrated Child Development Services
e) National Rural Health Mission
f) Jawaharlal Nehru National Urban Renewable Mission
g) Total Sanitation Campaign

Management Information Systems (MIS) of Indian Government’s Flagship Programmes:
Are they an adequate monitoring tool?
Santosh Mehrotra, D. Indrakumar and Vijay Saxena•
Abstract
MIS is a means to monitor progress and assess and revise targets, i.e., a tool for evidence-based programme management. The present paper examines the MIS in thirteen flagship programmes of the Central Government involving significant public expenditure using Plan funds. Despite the fact that some of these schemes and programmes have been in operation for over decades, their MIS are not yet at par with the needs of effective monitoring. This paper evaluates the MIS (and any other mechanism thereof for programme management) of the 13 flagship schemes on the basis of the basic principles required for an efficient MIS. The paper begins by outlining of criteria for assessing an MIS. It then goes on to each of the 13 programmes against those criteria. The analysis in this paper is based on investigation of the official websites of each flagship programme coupled with discussions with government officials as well as professionals responsible for managing the MIS. Based on our assessment of these flagship programmes, we conclude that there is a long way to go for the Central Government schemes to be effectively monitored using their MIS.
I. Introduction
A management information system (MIS) produces information that supports the management functions of an organisation and facilitates the decision-making process. The MIS is thus an organised approach of collecting, processing, storing and disseminating data to carry out management functions. To transform data into information, processing is needed and it must be done while considering the context of a decision (Davis, 1974; Lucas, 1990). Good information must have the characteristics of relevance, timeliness, accuracy, cost-effectiveness, reliability, usability, and exhaustiveness.
The MIS can play a critical role in the implementation of a programme in terms of monitoring periodic progress. A well designed MIS facilitates the flow of information among various levels and enables setting up of a feedback mechanism for planning and management of a programme, project or a policy. The MIS must be simple and easy to comprehend by different stakeholders of the programme at national, sub-national and community levels, and it should provide reliable information. The information should be specific, accurate and verifiable; it should facilitate timely management decision in terms of frequency and flow of information (i.e. a two-way feedback system in a decentralised framework). The information generated by the system should be easy to access, process and use; thereby enabling a wider dissemination. Also, it should be amenable to computer software.
Santosh Mehrotra ([email protected]), D. Indrakumar ([email protected]) and Vijay K. Saxena ([email protected]) are with the Institute of Applied Manpower Research, Planning Commission, New Delhi.

2
The MIS is used for regular updating of both the progress and output indicators in order to comprehend the relation between outputs and objectives. In other words, the generic MIS communicates the involved relationship between budgets, activities, and outputs; and enables monitoring of the process of programme implementation.
However, literature on information systems in India in the context of national level planning and decision-making process is scarce (Gupta, 1996).
Conventionally, governance structures have been characterised by rule based approaches that
primarily focused on process regulation, in compliance with centrally prescribed standards and rules. Thus, performance has been judged not by the results or outcomes but in terms of compliance with processes and inputs. This has severely undermined the performance of development projects or programmes. However, in a changed economic milieu, the performance should be evaluated by the results or outcomes and not by the outputs. The fallacy of mere outputs has been seriously questioned in evaluation literature (Kusek and Rist, 2004; Morra and Rist, 2009). However, MIS cannot be expected to evaluate outcomes. This should nevertheless report on outputs, and enable inputs and outputs to be linked.
Impacts or outcomes, as opposed to outputs, require evaluations – including impact evaluations for
which different methodologies are used. (Banerji and Duflo, 2011; Gertler et al., 2011) An MIS is an essential prerequisite for monitoring the relationship between inputs, processes and outputs. The objective of this paper is to examine the MIS of the 13 flagship programmes of the Government of India.
Building an effective MIS for each flagship programme has become necessary, as the size of
public expenditure has grown from 14.6 percent of GDP (Gross Domestic Product) in 2002-03 to 26.4 percent of GDP in 2008-09. This period has seen an increase in the Gross Budget Support from 1,94,672 crores in 2007-08, the first year of the 11th Five Year Plan, to 3,74,000 crores in 2011-12, the terminal year. Nearly 79.4 percent of the total funds allocated by the Planning Commission to the centrally sponsored schemes (CSS) have been absorbed by the 13 flagship programmes.
With the increasing burden of the fiscal deficit of the Central and State Governments (combined at
10 percent of the GDP in 2010-11), there is a greater need than ever before to ensure that inputs are converted to outputs. The sponsoring ministries/departments and the implementing agency or organizations are under constant pressure to show better results and achievements of the scheme. Active participation of the community, especially of the elected representatives, increasing role of the Non-Governmental Organisations (NGOs), media and civil society groups are compelling the implementing agency or organizations to perform better in order to improve the achievements of the scheme.
The Government has realised the need for output and outcome monitoring of the plan schemes (Economic Survey, 2007-08). The Eleventh Five Year Plan also underscored the deficiencies in the existing accounting system of the plan schemes and its inability to support informed planning, budgeting and effective monitoring of these schemes (Planning Commission, 2008). There exists a hierarchical chain of implementing agencies through which Central Government funds flow to the grassroots level where

3
bulk of the actual expenditure is carried out at the block/panchayat level in most of the schemes (Nigam and Sengupta, 2009).
Table 1: Budgetary Allocation for Flagship Programmes of the Central Government, 2011-12
Sl. No Name of the Scheme Allocation (Rs. Crores)
A Bharat Nirman 58,0001 Rural Roads: Pradhan Mantri Gram Sadak Yojana (PMGSY) 20,0002 Low Cost Housing: Indira Awaas Yojana (IAY) 10,0003 Water Supply: National Rural Drinking Water Programme (NRDWP) 9,3504 Irrigation 10,550 5 Rural Telephony 2,1006 Rural Electrification: Rajiv Gandhi Grameem Vidyut Yojana
(RGGVY) 6,000
B Other Schemes 1,13,5827 Mahatma Gandhi National Rural Employment Guarantee Scheme
(MGNREGS) 40,000
8 Sarva Shikhsa Abhiyan (SSA) 21,0009 Mid Day Meal Scheme (MDMS) 10,380
10 Integrated Child Development Scheme (ICDS) 10,33011 National Rural Health Mission (NRHM) 18,17212 Jawaharlal Nehru National Urban Renewable Mission (JNNURM) 13,70013 Total Sanitation Campaign (TSC) 1, 650
Grand Total (A+B) 1,71,582Source: Eleventh Five Year Plan (2007-12) Documents, Planning Commission
The computerised MIS for various Ministries/departments is developed by the National Informatics Centre (NIC) in order to support decision making. It also provides information services to the state governments and district administration throughout the country through NICNET. Primarily, MIS is aimed at meeting information needs of the different development departments and Planning Commission for tracking/monitoring of the progress and identifying the shortfalls at disaggregated levels. This should ideally provide signals in the event the desired objectives are not achieved (Gupta, 1996). However, evidence abounds of a number of lacunae that are well documented (Gupta, 1996; Bhatnagar and Patel, 1988; Kurian and Gupta, 1989). These shortcomings principally relate to ineffectiveness in identifying delays in system, tendency of irregular reporting, little analysis, inadequate information on interlinked activities, incorrect information, absence of data banks, and emphasis on reporting rather than action (Gupta, 1996).
During the last decade there have been a number of institutional-level developments within the
Government to monitor the relationship between inputs and outputs/results. First, in chronological order, came the Finance Ministry’s decision in the Government of India’s budget of 2005-06, to introduce Outcome-based Budgeting. Second, the Government of India decided to create a Delivery Monitoring Unit (DMU) in the Prime Minister’s Office. The DMU section collects the Quarterly Progress Report (QPR) from all the departments/ministries in order to know the progress and achievements for
4
over-sighting. Third, the Government of India created a Programme Management and Evaluation Services (PMES) Unit in the Cabinet Secretariat headed by an officer with the rank of Secretary, Government of India to monitor results of all ministries at one point. As we discuss later, none of the three new offices/processes can substitute for an effective online MIS at the level of each flagship programme.
This paper examines the efficacy of the management information system in flagship programmes.
Although there has been an enormous improvement in MIS in the recent years, the paper argues that MIS is still in its infancy in most flagship programmes, and yet to become an evidence-based tool for management. The second section gives a note on the criteria that should be included in the design of MIS of the programmes in order to make the MIS as an effective evidence-based management tool. The third section reviews the MIS in India’s flagship programmes based on the criteria elaborated in the previous section. The last section recapitulates some of the issues from a policy perspective. The annexure contains a detailed description of the MIS of each of the 13 flagship programmes.
II. Criteria for evaluating MIS
In the design of MIS, seven basic sequential stages are to be followed. These are: (1) identification of the information need, (2) collection of information, (3) classification of the information collected, (4) storage of information, (5) retrieval of data, (6) analysis of data and (7) use of data for decision making. Such information helps aid the management in taking operational, tactical and strategic decisions.
Some of the basic principles of MIS are indicated as under:
(i) Use of Log frame while designing MIS
(ii) Periodical authentication and validation of data
(iii) Periodicity of data reporting under MIS
(iv) Data should be easily accessible to public/community.
(v) Utilisation of data
(vi) Connecting output, outcome and survey data
(vii) User-friendly MIS website
These are discussed below in turn. i) The MIS should be derived from a log frame
An implementation framework involves inputs, activities and outputs, and outcomes/impacts. In other words, monitoring gives information relative to inputs, activities, targets and outputs, while evaluation gives evidence as to why targets and outputs are or not being achieved. It focuses on outcomes and impacts. At each level in the log frame, there is a need to identify the indicators that should be monitored to assess progress and eventually be compared with the programme objectives.
The MIS has to be derived from the log frame of the programme as a whole. In a log frame, inputs
are used to implement activities; activities produce specific outputs; the outputs contribute to the project

5
objective, and the project objective eventually contributes to the programme objective. It also implies that the full structure of MIS cannot be developed until the final log frame matrices and related work-plans with detailed activity plans and budgets are finalised. The initial log frame may undergo change as a result of discussions with the primary stakeholders that subsequently results in agreements on the indicators to be used.
In most of the flagship programmes no explicit log frame matrix is used for the programme design.
In the recent past, the Government has approved the outlines for Performance Monitoring and Evaluation System (PMES) for Government departments, and each department is required to prepare results-framework document (RFD). The RFD seeks to address three basic questions: (a) What are the department’s main objectives for the year? (b) What actions are proposed to achieve these objectives?, and (c) what are the relevant success indicators and their targets?.
The RFD has to define the vision, mission, objectives and functions; inter se priorities among key
objectives, success indicators and targets; trend values of the success indicators; description and definition of success indicators and proposed measurement methodology and specific performance requirements from other departments that are critical for delivering agreed results (GoI, 2010). The RFD is akin to result-based monitoring which moves beyond the emphasis on inputs and outputs to a greater focus on outcomes and impacts.
With the introduction of a results-framework, it is expected that flagship programmes will be assessed
in the log frame hierarchy which is indispensable in order to judge the efficacy of MIS as a tool for providing right signal to programme administrators. Also, it can be hoped that the Ministries and departments would assiduously align the expenditure framework with that of policy outcomes of a particular project or programme or a policy.
(ii) Periodic authentication and validation of administratively collected data is needed
The data collected must be thoroughly checked, verified, and be made consistent with a view to generating practical information. The data collected need to be scrutinised carefully and should undergo validation checks in order to generate valuable information.
Validation of the data in most of the flagship programmes is not robust, as in most cases it is done by the staff of the implementing agency or organizations at the lower level. Some of the flagship programmes have the system of sample based cross-checking of the data to verify its reliability. However, there is no centralised mechanism to validate the data provided by the implementing agency. Similarly, there is no provision for an independent validation process based on the principles of data integrity and validation.
(iii) Periodicity of data reporting under MIS
The MIS must provide timely information about the project or the programme indicating how well and to what extent it has performed or not performed as envisaged in the implementation framework. The MIS must clearly indicate the demonstrated performance at the output and objectives levels. Activities
6
are generally reported on a recurrent basis, yet it can be reported as per programme strategy (quarterly or annual basis) depending on the nature of the programme. Efforts are needed to bring out analytical reports quickly (say, quarterly) in the form of facts-sheet that ought to give signals for policy purposes.
(iv) Accessibility of data for public
Free flow of information between the government and the public is essential for a vibrant democracy. Improved public access to data and information strengthens the democratic institutions, thereby making development more inclusive.
Information should not only flow to the national monitors but also be made available to the community. There ought to be public feedback devices in the MIS which is often critical for operational performance of the system.
(v) Utilisation of data
Accessibility of data helps in using the data for analysis and further research, which eventually helps improve the implementation framework. The data can be utilised by variety of stakeholders – mainly researchers, academics, application developers, programme managers, donors, and the implementing agency. User communities help in providing direct and indirect feedback for the improvement of the data management. (vi) Connecting the MIS data and survey data
It is often observed that there is a weak connection or linkage between implementation framework
and outcome framework within the perspective of theory of change. This arises due to lack of clarity on the indicators and assumptions of the log frame. It is also noticed that there is a divergence between the project or programme data and that of large survey data, which often makes it difficult to aid policy. It is, therefore necessary to have a common design and data collection framework in order to have comparability between the different sets of data sources. The survey data can serve as base line in order to establish initial conditions against which the effects of a completed project or programme can be compared. (vii) User-friendly website
While developing a website, the users’ needs should be taken into account. The website must have a user-focused design that provides quality and accurate information. The design and development process must create a site that satisfies the visitors with customer-focused contents. The website should have an in-built feedback device. Feedback is an essential component of the evaluation process that provides the link between the past and future activities. In order to ensure that the results of evaluations are utilised in future policy and programme, it is necessary to establish feedback mechanisms involving all the stakeholders (OECD, 1991). As we will discuss, most of the flagship programmes have dedicated websites but in some cases the websites do not have feedback devise of the programme and lack user-focused design.
7
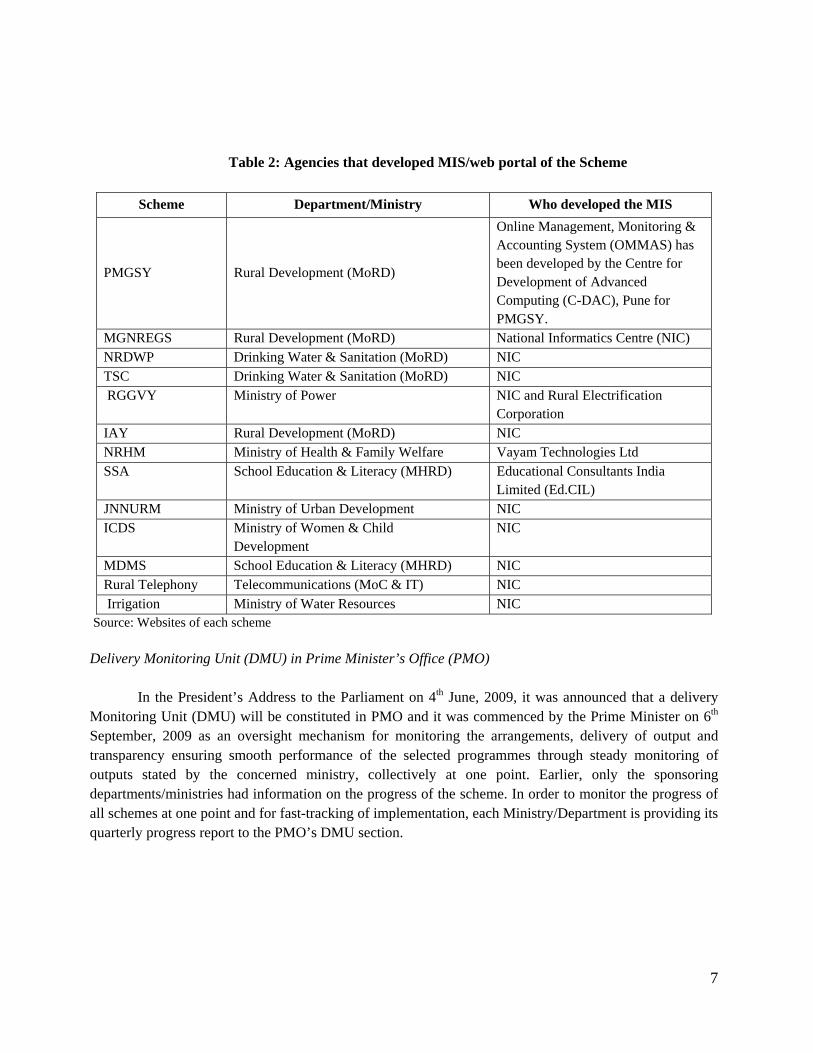
Table 2: Agencies that developed MIS/web portal of the Scheme Scheme Department/Ministry Who developed the MIS
PMGSY Rural Development (MoRD)
Online Management, Monitoring & Accounting System (OMMAS) has been developed by the Centre for Development of Advanced Computing (C-DAC), Pune for PMGSY.
MGNREGS Rural Development (MoRD) National Informatics Centre (NIC) NRDWP Drinking Water & Sanitation (MoRD) NIC TSC Drinking Water & Sanitation (MoRD) NIC RGGVY Ministry of Power NIC and Rural Electrification
Corporation IAY Rural Development (MoRD) NIC NRHM Ministry of Health & Family Welfare Vayam Technologies Ltd SSA School Education & Literacy (MHRD) Educational Consultants India
Limited (Ed.CIL) JNNURM Ministry of Urban Development NIC ICDS Ministry of Women & Child
Development NIC
MDMS School Education & Literacy (MHRD) NIC Rural Telephony Telecommunications (MoC & IT) NIC Irrigation Ministry of Water Resources NIC
Source: Websites of each scheme Delivery Monitoring Unit (DMU) in Prime Minister’s Office (PMO) In the President’s Address to the Parliament on 4th June, 2009, it was announced that a delivery Monitoring Unit (DMU) will be constituted in PMO and it was commenced by the Prime Minister on 6th September, 2009 as an oversight mechanism for monitoring the arrangements, delivery of output and transparency ensuring smooth performance of the selected programmes through steady monitoring of outputs stated by the concerned ministry, collectively at one point. Earlier, only the sponsoring departments/ministries had information on the progress of the scheme. In order to monitor the progress of all schemes at one point and for fast-tracking of implementation, each Ministry/Department is providing its quarterly progress report to the PMO’s DMU section.

8
The information in respect of each programme is summarized in the following table.
Table 3: The MIS of the Ministry and the Information with the PMO
Flagship Programmes Information given Observations
1) Rural Roads – PMGSY
Physical, financial, and cost analysis by state, district and village-wise
PMOs’ DMU section is directly linked with the schemes’ DMU section. No variations
2) MGNREGS
Physical (employment and assets ) and financial details for the year 2008-09 and 2009-10 month-wise
However, in the portal of the scheme, only the current information is available. Information starting from 2009-10 to 2012-13 is given at the DMU section in the website of the scheme. There is divergence in reporting.
3) Drinking water – NRDWP Targets and achievements are given.
PMOs’ DMU section is directly linked with the schemes’ DMU section. No variations
4) Sanitation –TSC The scheme is not a part of the PMO’s DMU section.
No inputs or data are available for the scheme with DMU section.
5) Rural electrification – RGGVY Information available on un-electrified villages and on BPL households’ electrification status.
PMOs’ DMU section is directly linked with the schemes’ DMU section. No variations
6) Housing –IAY Physical and Financial progress for the year 2012-13 is given state-wise .
PMOs’ DMU section is directly linked with the schemes’ DMU section. No variations
7) Health – NRHM
Information regarding the progress up to the quarter ending 31st December, 2012 is given on various health indicators.
PMOs’ DMU section is directly linked with the schemes’ DMU section. No variations
8) Elementary Education – SSA Information available on access, enrolment, quality and infrastructure state-wise
PMOs’ DMU section is directly linked with the schemes’ DMU section. No variations
9) JNNURM 10-page information on fund allocation, release and utilization as on 31st December, 2012 is provided.
PMOs’ DMU section is directly linked with the schemes’ DMU section. No variations
10) Child Development – ICDS The scheme is not a part of PMO’s DMU section.
No inputs or data are available for the scheme with DMU section.
11) Mid Day Meal Scheme The scheme is not a part of PMO’s DMU section.
On the scheme’s web portal, bi-monthly review report (one-page letter-type information on release of grants) for April, June and August, 2011 is given.
12) Rural telephony
Two tables are showing the progress and achievements of the scheme on rural teledensity and broadband coverage.
PMOs’ DMU section is directly linked with the schemes’ DMU section. No variations
13) Irrigation Targets and achievements in cumulative form are given for 2009-10, 2010-11 and 2011-12.
PMOs’ DMU section is directly linked with the schemes’ DMU section. No variations
Source: PMO website and web portal of the concerned schemes.
9
III. An assessment of Flagship Programmes’ MIS according to criteria
There are certain criteria to be followed when an MIS is framed. Majority of the flagship programmes lack an MIS design which connects the inputs with outputs. In the previous section we identified seven criteria for assessing the MIS flagship programmes: whether or not the MIS uses a log frame; whether it conducts data validation/authentication or only does a consistency check; runs online data collection system; provides up-to-date information; has a report for the DMU of the PMO; has a feedback mechanism for the citizens; and actually utilizes data collected for decision making.
In this section, we assess the flagship programmes according to criteria discussed in the previous section. The schemes are ranked by criteria. We have ranked the MIS of the 13 flagship programmes on a binary basis: either the programme meets or does not meet the criteria. If a criterion is not met by the MIS, the programme’s MIS receives a Y (Yes), otherwise an N (No). The total score determines the ranking of the programme’s MIS. The answer ‘yes’ implying the MIS receives Y does not mean that the programme’s MIS has a quality that is very good on that criterion, but is just adequate to receive a Y. All the schemes receive an N on one or the other criterion in their MIS design. Some schemes show some improvement in recent times.
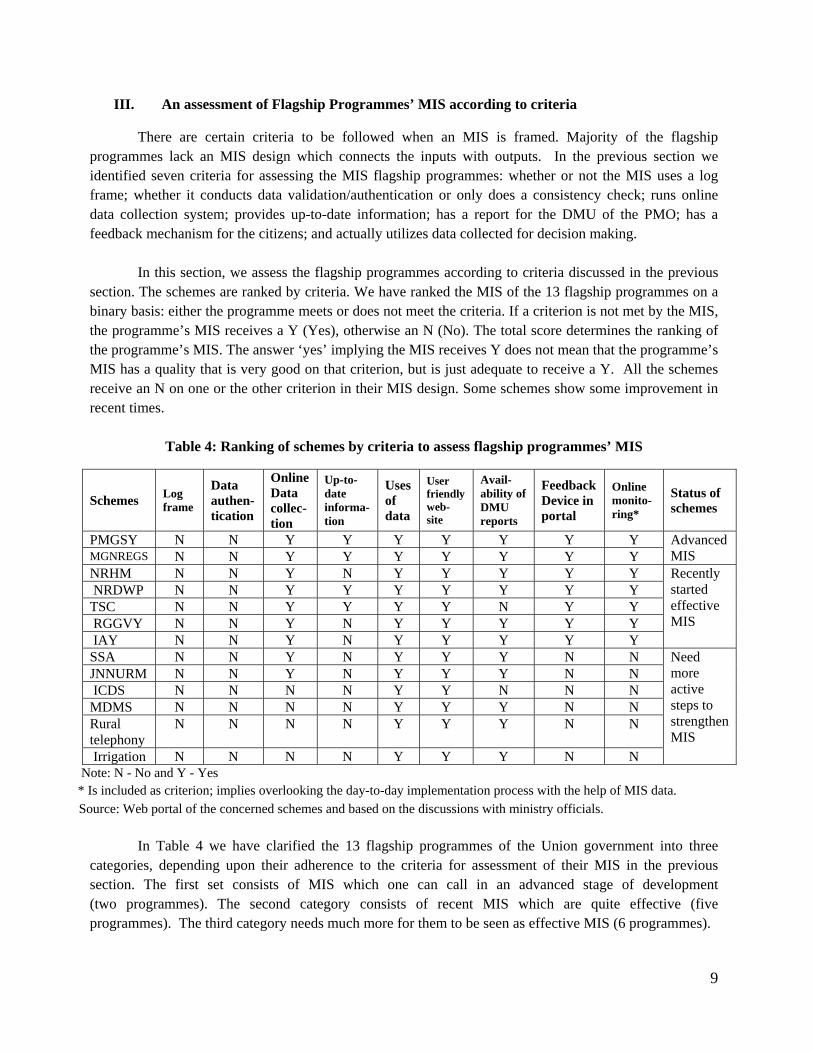
Table 4: Ranking of schemes by criteria to assess flagship programmes’ MIS
Note: N - No and Y - Yes * Is included as criterion; implies overlooking the day-to-day implementation process with the help of MIS data.
In Table 4 we have clarified the 13 flagship programmes of the Union government into three categories, depending upon their adherence to the criteria for assessment of their MIS in the previous section. The first set consists of MIS which one can call in an advanced stage of development (two programmes). The second category consists of recent MIS which are quite effective (five programmes). The third category needs much more for them to be seen as effective MIS (6 programmes).
Schemes Log frame
Data authen- tication
Online Data collec- tion
Up-to-date informa- tion
Uses of data
User friendly web-site
Avail- ability of DMU reports
Feedback Device in portal
Online monito- ring*
Status of schemes
PMGSY N N Y Y Y Y Y Y Y Advanced MIS MGNREGS N N Y Y Y Y Y Y Y
NRHM N N Y N Y Y Y Y Y Recently started effective MIS
NRDWP N N Y Y Y Y Y Y Y TSC N N Y Y Y Y N Y Y RGGVY N N Y N Y Y Y Y Y IAY N N Y N Y Y Y Y Y SSA N N Y N Y Y Y N N Need
more active steps to strengthen MIS
JNNURM N N Y N Y Y Y N N ICDS N N N N Y Y N N N MDMS N N N N Y Y Y N N Rural telephony
N N N N Y Y Y N N
Irrigation N N N N Y Y Y N N
Source: Web portal of the concerned schemes and based on the discussions with ministry officials.

10
Among the flagship programmes, the rural roads scheme stands the best at the top in its MIS through OMMAS.1 The scheme is a pioneer in the implementation of online processing. Through effective implementation of online process in many activities PMGSY provides more data. Information about the private contractor building the road is done by the use of OMMAS software which has the facility of automatic checking of information flowing from the contractors to government managers of PMGSY. This is a means of constant monitoring for quality control of the implementation process. The scheme has reached an advanced level of online monitoring by converting the majority of transaction into e-format.
MGNREGS ranked in the top bracket along with PMGSY. More awareness among the beneficiaries and active participation of community, social activists and media has forced the scheme to introduce more transparent and accountable methods in its functioning. These factors have resulted in better designing of MIS for these schemes.
Rural health mission (NRHM) is in the beginning stage to provide an effective MIS, but belongs in
the second category. The scheme has so far followed majority of criteria in order to provide more qualitative information on health indicators. According to the ministry officials, 381 districts are providing indicator-wise details for Health MIS (HMIS). Remaining districts are consolidating their information district-wise. Both the schemes have not explained on how MIS has helped in assessing the impacts. Health being a sensitive issue, the HMIS is taking utmost care in providing reliability and quality in its information.
Rural electrification (RGGVY), Drinking Water Programme (NRDWP) and rural housing (IAY) receive a middle ranking with the initial stage of adopting recent technological means. These schemes meet most criteria in their MIS. The RGGVY uses MIS information for stage-wise monitoring of implementation, but does not have up-to-date information. The NRDWP and IAY provide huge data on the physical and financial aspects of the schemes.
The MIS of Sarva Shiksha Abhiyan meets only a few criteria and belongs in the third category. The MIS section of the scheme does not allow the general public to access and it is meant only for data entry purpose. JNNURM, ICDS, MDMS, rural telephony, and Irrigation are ranked at lower level as these schemes have to do more for being an effective MIS. All these schemes have not followed many criteria while framing their MIS. Among these schemes, JNNURM and MDMS are in progress for providing a better MIS. The ICT facilities have to be used to strengthen the MIS of these schemes. Very little information and data are provided under the MIS of these schemes which have to be improved by adopting more criteria of MIS. On the basis of the criteria of MIS, each scheme was analysed. Full details of MIS by scheme-wise are presented in the Appendix section. Administrative level of data collection and presentations
The following table is a continuation of the previous table. How the data are presented and reports made available are presented in Table 5. It is descriptive and does not rank the schemes.
1 OMMAS is software meant for online management, monitoring and accounting system of the PMGSY scheme. This is a unique online system of the PMGSY scheme, and other flagship programmes lack this facility.

11
Data should be collected at lowest level where the scheme is being implemented. All the schemes are following this criterion whereas there is difference in the level of presentation of these data under MIS.
Table 5: Details of the MIS data of the flagship programmes
Schemes Data Collected at
Data Compiled at
Data Consistency checked
Data Processing/ Entry done at
The level of
Data available
Reports available
1. PMGSY Project/ Habitation District District District Project
/Village
Project, Habitation, district and state
2.MGNREGS Households Gram Panchayat
Block Block District Beneficiary/ Gram Panchayat
Gram Panchayat, block, district, and state
3. NRDWP Village/Gram Panchayat District District District Village
Village, district and state
4. TSC Village/Gram Panchayat District District District Gram
Panchayat
Village, Gram panchayat, district and state
5. RGGVY Households/ Villages State State State District/state District/State
6. IAY Households District District District Block District/State 7. NRHM Beneficiary Block/District Block/District Block/District District District/State 8. SSA District District District District District District/State 9. JNNURM City State State State City City/State 10. ICDS Anganwadi District Circle* District District District/State 11. MDMS District District District State State State 12. Rural telephony State State State State State State
13. Irrigation State State State State State State Note: All levels meant data is available from individual project/scheme wise, habitation/village wise, block, district, state wise.
*Circle is consisting of 5-6 gram panchayats.
Compilation and pooling of the unit level data at one point is another criterion for producing better data. It should be done at the district level for checking accuracy and consistency of the data. All the schemes are following this pattern except RGGVY, JNNURM, Irrigation, and rural telephony, which are performing this task at state level. The unit level data of these schemes are small in size at the district level. The MGNREGS is the only scheme which is compiling data at block level.
One very important component in the data processing is validation and authentication of data. All data and information should be properly checked for reliability, and validity. Reliability of the data should be done at the district level to rectify the mistakes. The MGNREGS and ICDS are doing a

12
consistency check at one level below the district, that is, block and circle (below block) level. Majority of the schemes (PMGSY, NRDWP, TSC, IAY, NRHM, SSA and MDMS) are doing the consistency check at the district level while compiling their unit level data. The schemes like RGGVY, JNNURM, Rural telephony and irrigation are doing this at the state level. According to the Ministry officials, all data are checked for their reliability before placing those on the portal. There are officials in-charge at every level to check the reliability of the data before placing those on the portal. All data should be certified and verified by the concerned programme officials at all levels.
Unit level data are to be processed and then presented. Majority of the flagship programmes (PMGSY, MGNREGS, NRDWP, TSC, IAY, NRHM, SSA and MDMS) are doing the data processing and entry work at the district level. Again the RGGVY, JNNURM, Rural telephony and irrigation are doing this processing and entry at state level.
Finally, Table 5 shows the administrative level at which data are presented and the report is available (see final column). All the programmes except MDMS, Rural telephony and irrigation, are providing MIS data for the district. MDMS, rural telephony and irrigation are giving state-wise data. Schemes like MGNREGS, PMGSY, NRDWP, and TSC are providing the data for all levels. Some of the flagship programmes are providing even individual unit-wise information of each project. For instance, PMGSY provides information on each constructed road and MGNREGS gives the details of individual beneficiary, gram panchayat-wise up to a national level details.
We now turn to the assessment of the MIS of the flagship programmes based on the criteria
identified in the previous section and Table 4.
Log frame use
Management Information System should be designed in a manner in which it uses a log-frame. Log-frame hierarchy must identify the inputs, activities, outputs, programme objectives and outcome with links explicit. At each level in the log frame, there is a need to identify the indicators that should be monitored to assess progress and eventually be compared with the programme objectives. Flagship started their MIS with the intention of pooling the data at one point to assess states’ implementation progress. It was not conceptually designed in a manner to link inputs, process and outcomes. A few schemes appear to have used a log frame, even though not explicitly. Schemes like PMGSY have a well designed online control and monitoring system, connecting the entire network of stakeholders, involving e-tender and e-payment. The schemes such as MGNREGS, TSC and NRHM are following the logical framework, and have started linking process with MIS data.
The remaining schemes have not used the log frame when they designed the data gathering system. However, one can add that after the introduction of Results-Framework Document (RFD), under performance monitoring and evaluation system (PMES), now there is a defined objective and methodology and a system is in place in all departments/ministries.
• Schemes like, PMGSY, MGNREGS, NRDWP, IAY, and RGGVY have a system to avoid wrong
entry in the software

13
• PMGSY and RGGVY have some control over the implementation strategy with the help of MIS data
• PMGSY and RGGVY are checking the quality of the work and progress through online system of MIS
Periodic data authentication and validation
Data authentication and validation link the provided information and data with the notified outcome or impact of the scheme. Data authentication and validation is a criterion that is not followed in many schemes. Each scheme is giving more importance to the consistency of the data rather than whether for each indicator data are correct, by authenticating the information. The online data collection mechanism can control and discover only the invalid data; it is not a real mechanism to validate or authenticate the information which is being entered. Schemes like PMGSY, MGNREGS, TSC and NRHM are better in consistency check of the data through well designed mechanism via online and sample based cross-checking of the data. They send staff to the field to cross-check data, and cross-checking is done on a sample basis, but it has to focus on linking the inputs with outputs and outcome for authenticating the data. Other schemes are checking consistency and accuracy of the data; however, they lack in authenticating and validating data. Under the guidance of the RFD, each department/ministry is taking greater care in collecting the information from the field since those data are to be submitted and reviewed by the Cabinet Secretary and Prime Minister’s Office periodically.
It is suggested that the data source and level at which it was approved before being placed on the portal may also be mentioned online for better understanding of the validity of data. Who approved and authenticated the information before it is entered into the portal can give more validity to the information for users. Periodicity of data reporting: Is the information up-to-date?
The use of ICT in the process of implementing some schemes has helped to improve timeliness in data reporting. Data ending in the quarter was considered as the up-to-date information. Information is collected for different periods, some schemes are collecting monthly reports and majority of the schemes are following quarterly progress reports. The PMGSY, MGNREGS, NRDWP, and TSC are providing up-to-date information. Remaining schemes are however providing quarterly and annual information. Data reporting periodicity is very poor in schemes like Irrigation, Rural telephony, MDMS, and ICDS – all these schemes provide information only till the last financial year. Still, more than half of the schemes (Rural Telephony, Irrigation, SSA, MDMS, ICDS, and NRHM) do not have online data collection mechanism which can cause delay in data reporting.
• PMGSY, MGNREGS, NRDWP and TSC provide as-on-date information.
• RGGVY, NRHM, IAY, SSA and JNNURM provide data up to the first quarter (December, 2012)
of the current fiscal year. However, ICDS shows the release of grants (financial) details up to March, 2013 for ICDS.
• MDMS gives the progress data for 2011-12 up to the second quarter ending at September, 2011.

14
• Rural telephony gives the details up to February and March, 2011.
• Irrigation scheme provides the data in cumulative format for 2011-12.
Majority of the MIS data shows physical and financial progress of the scheme.
• MGNREGS, PMGSY, NRDWP, TSC, IAY and NRHM give some more data and reports in addition to the physical and financial details.
• RGGVY, SSA, JNNURM, ICDS, Irrigation, Rural Telephony, and MDMS present physical and financial progress data only.
Accessibility of data: Is the website user friendly?
One unique feature of MIS in the flagship programmes is the accessibility of data. All reports and data on the portal of the scheme are easily accessible to the general public. All information is downloadable from the website. However, no raw data are shared with the general public at grassroots levels where the scheme is under implementation. Sometimes the data sheet and reports cannot be opened (for instance, reports and quarterly data tables under PMGSY, www.pmgsyonline site). The website must have a user-focused design that provides quality and accurate information. The website should have an in-built feedback device. Feedback is an essential component of the evaluation process that provides the link between past and future activities. Schemes like Irrigation, Rural telephony, SSA, and ICDS, need more information and data in their MIS on their website. As far as feedback mechanism is concerned six schemes (SSA, ICDS, Irrigation, Rural Telephony, MDMS and JNNNURM) have not yet placed it on their portals. Utilisation of data
Lack of utilisation of data is the main weakness of the MIS of flagship programmes. Each scheme is simply using the data or information for their own purposes of approval and sanctioning next year’s budget and action plans. Some schemes are collecting huge information from the implementing agency – how this information is used, how the information is helpful in revising the guidelines or implementing system, what kind of check is needed, where and when or what are the changes made in the scheme so far – none of this is clear.
Predominant user of data is the sponsoring ministry of the schemes. Project appraisal, approval of annual plan of action, financial allocation and sanction of funds are when these data are used. Some schemes are using the information for their own concurrent evaluation and monitoring purposes. After the introduction of performance management at the cabinet secretariat in 2010, each ministry/departments has to submit their quarterly results framework documents for a periodical review of the performance of all the schemes, hence it is used for that purpose. Data are also shared with PMO, inter-ministerial councils, Planning Commission, and with the international organizations like, UNICEF, WHO, World Bank which partnered with sponsoring ministry for financial and technical assistance. There is no detail on how these data are utilised for making changes/modification in the implementation strategy for greater effectiveness

15
of the scheme. Also, there is no evidence on the portal on how the collected information/data about the scheme are used.
Schemes like MGNREGS, PMGSY, NRDWP, TSC, and NRHM are using the information for
their third party evaluation purposes on sample basis. International organizations like, UNICEF, WHO, World Bank are the other outside users of the data.
Connecting output/outcome and survey data
Within the perspective of a theory of change, there is a weak connection or linkage between the implementation framework and outcome framework. This is applicable for majority of flagship schemes, except PMGSY and MGNREGS. It is also noticed that there is a divergence between project programme data and that of large survey data that often makes it difficult to aid policy. For instance, Integrated Child Development Scheme and National Family Health Survey are quite inconsistent in respect of data on level of malnutrition for each state and hence at national level.
National Family Health Survey - III data for 2005-06 indicates that child malnutrition is a serious problem, but ICDS’s own website in 2011 would not give any such indication. According to NFHS III, 16 percent of the 46 percent of Indian children who were malnourished were severely malnourished (i.e.16 percent were underweight by more than 3 standard deviations in comparison to the reference population). In contrast, the ICDS website, based on data provided by the state governments found 0.6 percent of all malnourished children to be severely malnourished. Similarly, the ICDS website shows that over 50 percent of the malnourished children were mildly malnourished (less than 2 standard deviation below the reference WHO population), while NFHS III had found that 56 percent of them were moderately underweight (between 2-3 standard deviation below the reference population). In other words, state government-reported malnutrition rates among children in ICDS centres seemed uniformly to be better than malnutrition rates according to sample survey data, although the latter survey was done by a very credible organization. Outcomes data presented on administrative ministry MIS sites are often questionable, which underlines two points we have made in this paper: one, authenticate and validate MIS data, and two crosscheck any output/outcome data with sample survey data from other credible sources.
It is necessary to have comparability between the different sets of data sources. The survey data can serve as a baseline in order to establish initial conditions against which the effects of a completed project or programme can be compared.
It is not just that survey data need to be matched with any output/outcome data that a MIS of a programme puts out. Inputs and outputs should also be matched. Thus, in the Total Sanitation Campaign, toilets might be built, but the question that is always asked is: are toilets being used as toilets? Or are Nirmal Gram Puraskar villages still free of open defecation six months after the award to the village of that title by the President of India?
Similarly, RGGVY is supposed to electrify the households of below poverty line households. The output data on RGGVY’s MIS online should be reporting whether any of those households actually get electricity in their home. Or, if so many thousand electric poles or electric lines in kilometers have been installed, how many of those have since been simply gone missing? The flagship programmes collect MIS
16
information for the purpose of compiling and pooling the information to learn about the progress. How each state is doing in the implementation strategy, how the resources are to be allocated for the next term, and how much central allocation is needed for the states – these are some of the other purposes of the MIS data. No scheme has explained or shown any reports how these MIS data and information are utilized to make some intervention or changes in the implementation strategy.
Online Monitoring
Monitoring through online system is an advanced stage of the MIS. Schemes like PMGSY and RGGVY are doing better in this activity. Because of its e-processing of majority of activities (e-tender, e-transfer of money, online appraisal of project and approval etc.), PMGSY is performing better in on-line monitoring. Similarly, RGGVY have introduced a good monitoring process. It is a process which divides each project into four quarters (duration). By using the MIS data, the nodal agency for implementation of the scheme (Rural Electrification Corporation – REC) is monitoring the implementation process on-line. Schemes like MGNREGS, NRDWP, TSC, NRHM and IAY also are using the MIS information for monitoring the implementation process for allocation of resources. IV. Concluding remarks
There are many differences among flagship programmes’ information systems. Each flagship programme was assessed based on criteria for evaluating the MIS outlined in Section II. Some schemes’ MIS have a wide scope like PMGSY, MGNREGS, TSC, NRDWP and NRHM. They are providing more comprehensive information. Schemes like Rural Telephony and Irrigation, on the other hand, have a limited coverage. Similarly, some schemes like MGNREGS have active participation of the beneficiaries and society. Some schemes (like MGNREGS, PMGSY) involve more financial dealings/activities on a daily basis with beneficiaries and implementing agencies/contractors. Therefore, there is a compulsion to monitor and maintain more records.
The MIS suffer from many weaknesses. They do not use a log frame. The data are checked for internal consistency, but there is no effort to conduct an independent external verification or authentication of the data presented. So, there are plenty of schemes where the MIS data on outputs or outcomes do not correspond at all with the sample survey data carried out by independent organisations. Moreover, more than half the schemes do not have an on-line data collection system, which can cause delays in data reporting. Besides, the utilization of data collected remains limited to use when approval of annual plan of action is undertaken.
The most advanced MIS exists for rural roads (PMGSY) and public works (MNREGA). The schemes that need most improvements are: elementary education (SSA), urban development (JNNURM), child development for 0-6 year olds (ICDS), the mid-day meals given in elementary schools (MDMS), rural telephony and irrigation. The schemes that have recently improved their MIS are: rural health (NRHM), rural drinking water (NRDWP), sanitation (TSC), rural electrification (RGGVY) and rural housing (IAY).

17
Initiatives to overcome: Recent Developments
What is most critical is that MIS at present are often not serving the purpose of monitoring targets. For instance, in case of Total Sanitation Campaign, the existence of MIS is proving to be of no use since no follow-up with targets is actually undertaken despite very detailed information being shared in terms of project objective and performance in terms of number of toilets built. Only in a few schemes, for example, in case of PMGSY and RGGVY, the information is given as Target and Achievement by year, which not only facilitates monitoring but also appropriate revision of targets and better implementation.
Moreover, as highlighted earlier, there is no consistent format according to which data are disseminated across various schemes. Sometimes the data as provided in DMU reports of the Prime Minister’s Office do not match with the data provided in the data bank or MIS reports on the website – that may be due to difference in definitions or time period – but that is not clarified. This was particularly witnessed in the case of MGNREGA. The fact that a Delivery Monitoring Unit had to be created in the Prime Minister’s Office suggests that the MIS of the 13 flagship programmes was not quite meeting the requirements of assessing progress in their implementation very effectively.
Clearly, the MIS of the Central government flagship programmes have a long way to go before meeting the criteria we identified at the beginning of the paper to assess their effectiveness. The state governments’ own programmes in turn are not expected to meet these criteria at all. Each state government should therefore consider undertaking an assessment of the value of their MIS. New opportunities are about to open up to make monitoring of the government programmes easier. Proposed initiatives in 12th Five Year Plan
Documents of the 12th five year plan are proposing various activities for centrally sponsored progammes’ effective management and implementation. In the scheme-wise appraisals, plan documents are proposing scheme activities and general steps to improve the management information system of the schemes. The following components emerged from the 12th plan specific document for strengthening MIS.
i) Use of real-time technologies (Computers, Internet and Mobiles) ii) UID (Aadhaar) iii) Transaction based MIS iv) Outcome sustainability v) Single-window system to track the progress
Use of real time technologies
Twelfth Plan is proposing the use of real-time technologies for the effective implementation of the scheme. Use of computers, internet and mobile phone is proposed in many schemes for a better data collection and presentation. Schemes like MGNREGS, PMGSY, NRDWP, RGGVY and TSC are emphasizing more effective use of computers and internet facilities for more comprehensive MIS. These schemes already have better MIS presently. Integrated and end-to-end online-transaction and file tracking systems are given more priority by these schemes. MGNREGS is planning to implement the Andhra Pradesh model of end-to-end online transaction of MIS in its NREGSsoft-2.0. Similarly, JNNURM and Irrigation scheme also proposed to use ICT facilities in their MIS.

18
Mid Day Meal scheme, SSA and ICDS are proposing for effective use of mobile and SMS services for a more effective MIS. The MDM scheme is already using the mobile based SMS services on sample basis (under use in Uttar Pradesh). The success of Uttar Pradesh has led to plans to introduce it to all states along with other technologies.
Unique Identification Numbers (UID)
Monitoring that beneficiaries actually receive benefits intended for them will become much easier once a unique-identity number is given to individuals, along with the means of bio-metric identification of the individual through a card which has the identity number encrypted in it (or Aadhar). The MIS of several flagship programmes discussed in this paper will link up with these unique identity cards, and thus enable the more effective monitoring of benefits to individuals. The effort by the Unique Identity Authority of India to enrol 220 mn. citizens of India that began in 2010 has already achieved remarkable coverage. By 2014, a total of 600 million citizens of India will have this unique identity number. The MIS of many government programmes, whether run by the Central, State or local government, will have then a common platform on which they can develop. The managers of these programmes will then have a major new task on their hand, to ensure that their programme beneficiaries have an interface with this platform of bio-metric identification. MGNREGS and SSA are proposing the use of Aadhar Card for a better implementation strategy.
Transaction based MIS
MGNREGS, PMGSY, TSC, and NRDWP are planning to shift the present MIS to a more specific and transaction based system. From the beginning of approval of a project to its completion, each stage is to be on-lined in the proposed steps of the 12th plan. Especially, the MGNREGS scheme is planning to implement the transaction based MIS for effective monitoring of cash payments to the beneficiaries. Outcome sustainability
One of the main weaknesses in the present MIS of the flagship programmes is the outcome. No scheme has given any information on how the MIS is used to achieve the desired outcomes or if the implementation strategy has been modified with the help of MIS data. The 12th plan is giving importance to outcome sustainability. MGNREGS, PMGSY and TSC have notified the implementation of outcome sustainability in their MIS. Single-window file tracking system
The Twelfth Plan is also proposing a single-window file tracking system for the schemes. At present, there is a wide range of sources for each category of information. It is very difficult to authenticate the data or information as it comes from a variety of sources – largely from state governments. The single-window file tracking system is proposed by MGNREGS, PMGSY, RGGVY, SSA and NRDWP.

19
Appendix: Scheme-wise Analysis of MIS
The MIS of Flagship Programmes
Every project and programme has some monitoring process in place in order to track the progress. For major schemes MIS have been developed by the different Ministries for tracking progress, both in terms of physical and financial parameters (PEO, 2009). There are as many as thirteen flagship programmes being implemented primarily with a view to constructing of rural infrastructure; education for all; improving health and sanitation; providing opportunities for improved living conditions as well as livelihoods; and augment the economic and social infrastructure of cities etc. with huge investments.
This section examines the MIS in the flagship programmes. It is by no means an exhaustive appraisal but indicative one that might raise research questions for further work in this area. As many as four flagship programmes have no MIS worth the name and also in many cases one is not permitted to visit MIS online without a valid authorisation. The programmes which have no MIS are: Irrigation programme of the Ministry of Water Resources, Rural Telephony of Department of Telecommunications of Ministry of Communications & Information Technology, Mid-Day Meal (MDM) Scheme of Department of School Education and Literacy of Ministry of Human Resource Development, and Jawaharlal Nehru Urban Renewal Mission (JNNURM) of the Ministry of Urban Development.
Some preliminary observations have been made from further discussions with the MIS managers of the
flagship programmes in which MIS exists. Other schemes have placed their information and data on management information details in web portals in other headings/folders like Quality Monitoring, Monitoring, and Reports etc.
1) The Rural Road Programme: Pradhan Mantri Gram Sadak Yojana (PMGSY)
a) The Scheme
The programme was launched in December, 2000 by the Ministry of Rural Development, Government of India. The primary focus of the programme is to provide rural road connectivity that involves construction of new roads and up-gradation of the existing roads so as to achieve connectivity through good all-weather roads. The key objective of this programme is improving the access to economic and social services and thereby generating increased agricultural incomes and productive employment, and ensuring sustainable poverty reduction.
In the first phase (up to 2005), habitations (hamlets) of population of 1000 (500 in the case of hill states, tribal and desert areas) and above were covered. In the second phase (from 2006 onwards) habitations of population of 500 (250 in the case of hill states, tribal and desert areas) were covered. About 368,000 km of new road construction and 370,000 km of upgradation/renewal is expected to be done at a cost of about $26 billion. According to the latest figures (As on 31st March, 2012) made available by the State Governments under a survey to identify Core Network as part of the PMGSY programme, about 1.67 lakh unconnected habitations are eligible for coverage under the programme. This involves construction of about 3.71 lakh km of roads for new connectivity and 3.68 lakh km which are to be up-graded.
National Rural Roads Development Agency is the Organisation responsible for implementation and compilation of the information of the scheme for the Ministry of Rural Development. The achievements of the scheme so far (as on 31st March, 2012) are as follows:
• Number of Road Works Cleared - 104485 • New Connectivity - 71715 • Upgradation - 32769 • Completed Road Works - 80817

20
• Road Works in Progress - 23332 • Total Length - 414605.62 KM
b) Information available on the Portal
Apart from a huge variety of general information on the scheme, the implementing agency, the guidelines, the PMGSY portal gives purely information relating to monitoring of the scheme. Quality Monitoring is one of the headings where details are presented relating to guidelines (on Inspection Reports, Quality Assurance and Control Mechanism), details of the National and State Quality Monitors, Inspection Reports, Action taken on the report of the National Quality Monitors and the user manual for the independent quality monitors under the scheme and the latest DMU reports.
All the MIS related information is placed under pmgsyonline (Online Management, Monitoring and Accounting system - OMMAS). All the fields which are related to Management Information System (MIS) are placed in the Report. Under this folder National, State and District Reports’ complete records have been given. The details of information provided under each folder are given below.
Table A1: Rural Roads Programme (PMGSY): Information available on the Web Portal
Sl. No. Nature of reports Information covered 1 National reports Coverage of habitations under the scheme over the years and progress of
sanctioned projects and financial details are mainly presented in this folder on national reports. State- wise achievement and new initiatives were also prescribed in this folder.
2 State reports District-wise details of the accounting and monitoring procedures, contractors’ information and cost analysis are the main components placed under this heading.
3 District reports District profile, district-wise roads details, physical and financial progress of the scheme by district is given.
4 Analysis Component-wise cost analysis, analysis of proposals, correlation analysis between the populations and annual average traffic on the constructed roads are the significant components placed in the folder. Another unique item is, by entering the habitation or village name, one can get the complete details of respective villages.
c) The MIS of PMGSY
A modern management and monitoring system has been set up for PMGSY (www.pmgsy.nic.in). The entire database is placed in the citizens’ domain. Online management, monitoring and accounting system (OMMAS) has been developed by the Centre for Development of Advanced Computing (CDAC), Pune with different modules in order to effectively monitor the entire programme. Monitoring modules include Connectivity Status, Procurement Status, Physical and Financial Progress, Account and Quality Monitoring. However, data-entry formats can be viewed only by the registered users who are responsible for entering, confirming and checking the data online in the portal.
Detailed guidelines for monitoring of quality of the road works have been prepared and it is envisaged that this shall be done by the national quality monitor (NQM). The assessment includes inspection of works. An assessment sheet has been designed for each item of work. It has been mandated that NQM shall record observations and assign a grade on different item of works. A review of reports of NQMs shall be carried out by the members of Performance Evaluation Committee (PEC) constituted by the National Rural Roads Development Agency (NRRDA). Villages/habitations to village’s road details, traffic on the road, population benefited from each road, whether SC/ST population covered under each road construction etc. is given. Mostly physical and financial

21
progresses are placed under ‘reports’ heading and all other varieties of information are placed in the online portal that is pmgsyOnline.
Discussion with the Ministry Officials responsible for the MIS suggested that the officials felt that checking progress is possible at every stage of the implementation anywhere in the country because data are available online as on date. Ex-post analysis is also on sample basis for some projects. The viability of each project is properly checked by the committee before it gets approved. Each district is submitting their requirements for approval based on the progress, which can be checked with the help of MIS only.
The World Bank is an important user of the MIS data outside the sponsoring ministry. Mostly, the
sponsoring ministry and State governments are routine users of the data of the scheme. Apart from this, the general public is a major user of the information. The feedback received from the general public is taken into consideration periodically in implementing the scheme. The website information is available in five languages. Apart from English and Hindi, the information can also be assessed in other regional languages (like Gujarati, Oriya, and Tamil). Presenting the data in more regional languages is under consideration. Only registered and qualified persons can enter data in the portal. Periodic security audit on software is done for avoiding any mishandling. The data is checked before placing/entering on the portal. The State Technical Agency is the top level body at the state level responsible for checking and authenticating the data for all districts.
The analysis of the MIS we undertook, brought out some of the following observations:
• Work information of the on-going and completed works has been designed for the programme implementation unit (PIU), and also reporting of on-going and completed works has been structured for NQM.
• The guidelines deal primarily with the inspection procedure of the works rather than monitoring and evaluation. It focuses on a three-tier quality control and quality monitoring mechanism. The procedure discusses the inputs, activities and outputs.
• Some of the information regarding the ongoing and completed works is of a qualitative nature (comments and observations) which are often hard to measure directly. There is, therefore, a need for evolving proxy or indirect indicators to measure the progress.
• Quality monitoring indicators are not expressed in terms of quantifiable entities. For instance, it is very difficult to assess the progress by reporting the total number of inspections carried out or number of roads completed or in progress. Also, it is difficult to assess the progress on the basis of judgments such as ‘satisfactory’ or ‘unsatisfactory’.
• National, state and district reports are also being prepared in terms of physical and financial targets and achievements, but it is not clear how this information is being used to track the progress.
• The DMU reports (2011-12) provide quarterly progress reports (QPRs), both for physical and financial parameters in terms of target and achievements for major states but in certain cases there is a wide gap between the target for current quarter and the achievement during the current quarter for which no reasons are provided. d) 12th Plan Approach for Emphasizing the MIS
The programme has also developed a web-based Online Monitoring Management and Accounting System (OMMAS) which is accessible to the public. The availability of relevant data depends primarily on the efforts of States. Currently, the database on road transport is restricted to number of registered motor vehicles category-wise as required by the Motor Vehicle (MV) Act, 1988. There are serious gaps in Road Transport data such as decentralized generation of data, multiplicity of agencies, time lag, no data on movement of people, goods and vehicles, passenger and freight flows measured in a variety of ways and so on. These issues can be resolved by a national consensus on

22
data generation using IT extensively. A group will be set up during the Plan to resolve the above issues and improve the national database. 2) The Mahatma Gandhi Rural Employment Guarantee Act (MGNREGA)
a) The Scheme
The MGNREGA, 2005 aims at enhancing the livelihood security of the people in rural areas, by guaranteeing 100 days of wage employment in a financial year to a rural household whose adult members volunteer to do unskilled manual work. This is one of the major programmes of the Ministry of Rural Development. The scheme was started in February 2006, initially in 200 districts, and later extended to all districts w.e.f. April 1, 2008 (www.nrega.nic.in). There is provision in the Act that Gram Sabha (village councils) will monitor all the works at the village level as well as the employment provided. A local Vigilance and Monitoring Committee (VMC) has also been constituted comprising of the members of the locality or the village where the work is undertaken to monitor the progress and quality of the work. As regards evaluation of the programme, the State Employment Guarantee Council (SEGC) would be responsible for conducting and commissioning the evaluation studies. The SEGC should also seek the association of research institutions for conducting evaluations.
Most evaluation studies of MGNREGA have been conducted by research institutions and independent research scholars. Some of the findings of the evaluation studies have brought out glaring lacunae that led to mid-course corrections (CAG, 2007; Ambasta et al., 2008; Shah, 2008, Drèze and Oldiges, 2007, Drèze 2008).
Huge data have been generated by the Ministry of Rural Development state-wise on different aspects of the programme, but then, how this data are being utilised for analytical and policy purposes remains somewhat unclear.
b) The MIS of MGNREGA
Massive information is being collected right from registration of workers to implementation stage from about 0.25 million Gram Panchayats (village committees), 6,465 Blocks, 625 Districts and 34 States & UTs through computerised information system. The MIS portal provides single-point access to all stakeholders of MGNREGA. The aim is to provide data, transparent and available in public domain, to be equally accessed by all. The portal places complete transaction level data in public domain for job cards, demand for work and muster rolls which is attendance cum payment sheet for a worker.
The MIS of MGNREGA Soft have various modules that include worker management module (registration, demand for work, work allocation and muster rolls, and provision of payment of wages through bank/post office, unemployment allowance and number of days of employment of a family, etc.), fund management module (transfer and flow of funds and expenditure), works management module (works undertaken at various levels e.g. gram panchayat, block panchayat and zilla panchayats/parishad), grievance redressal system, staffing position module, cost estimation module etc. Proper checks have been introduced to validate the data entered and to stop the wrong entries in MGNREGASoft. Recently, biometric database of the MGNREGA, linking Unique Identification Authority of India, has been introduced which is expected to bring about more transparency, curb irregularities and reduce corruption.
A web-enabled MIS www.nrega.nic.in has been developed in 2006. The village level household database has internal checks for ensuring consistency and conformity to normative processes. Logical and systematic

23
framework was adapted when MIS was designed for the scheme. Every stage of the process was designed in a way to derive certain outputs in the form of reports.
Table A2: The Rural Employment Guarantee Programme (MNREGA): Information available on the Portal
Sl. No. Nature of reports Information covered 1 NREG Act, 2005 Explains objectives, methodology and the implementation strategy
of the scheme 2 Guidelines A complete record of the implementation process is briefed in the
folder. 3 Districts The state-wise list of districts which has been selected for the
implementation of the scheme by different phases of the scheme is given (Phase I – 200, Phase II – 130 and Phase III – 295 Districts).
4 Circulars Circulars from headquarter for 18 categories of items are placed. 5 Delivery monitoring Unit
(DMU) DMU is the vital section where all the progresses of the scheme over the years are presented.
6 Central Employment Guarantee Council (CEGC)
The CEGS is the highest body which approves plan of action of the scheme. Its details are given in this heading.
7 Reference Centre Information on various fields such as Social Audit, Drought Management Strategy 2009 (Draft), Quality Audit of Works Request for proposal, BPL Census 2002, MIS Reports Demo, Muster roll Verification Guidelines, etc.are given under this heading.
8 Contact Details Full list of contact details of the Officials at the Ministry and at District Level for the entire district by state-wise is given.
9 Citizen The Citizen folder enables the beneficiaries and general public to know the individual details of the beneficiaries of the scheme by entering the job card number.
10 Panchayats State-wise list of Gram Panchayats, Panchayat Samitis/Mandals and Zilla Panchayats is placed.
11 Professional Institutions Network
Institutions with which the scheme is in collaboration for technical and consultancy services such as IIMs, IITs, Administrative Staff College of India, National Institute of Rural Development (NIRD) etc. are placed here.
12 ICT Innovations New developments in the ICT infrastructure of the scheme have been highlighted.
13 MGNREGASoft News relating to this software is placed in this folder. Data sent and upload status of the states by district-wise, user manual of the MIS, computer based tutorial for handling the software etc. are also in place.
14 Public Grievance Redressal To lodge grievances and complaints and to know about the status of complaints, a well structured feedback mechanism in the portal is placed.
15 Monitoring Alerts Financial Reports for the year, 2007-08 to 2011-12, Audit Report Flow, National Level Monitors, Reports and report of the field visit and review is placed in this folder.
The data are entered on a daily basis by the implementation agency at the district level. All the Panchayat level information and data are checked and compiled at the Block level and the block level data are then forwarded to district headquarters (District Programme Coordinator). Then, the data are forwarded to the state level offices and entered in the online mechanism of the scheme. The data are available till November, 2011 for all major components of the scheme (Physical – Employment Generation, Assets Created and Financial Progress). So many ex-post analyses were made by reputed institutions in the country on the achievements of the scheme.

24
In the headquarters of the Ministry all data are periodically checked and reviewed. On the basis of feedback received from non-governmental organizations, national quality monitors, professional institutions, and legislators many changes/modification were introduced in the implementation process of the scheme.
Daily 0.2 million reports/records of the scheme are viewed through the portal. Cumulatively, total visitor to the portal so far is 93.68 million since it started functioning. This is the best example of community participation in the scheme.
The scheme is unique in that the implementing agency and decision making authority is the Gram Panchayat. Therefore, most records are made available to the general public at every stage. Majority of these records are in local languages only.
District level officials are responsible for entering the data through online by using the MGNERGASoft. All these officials were given prior training to operate the software. At the Central level the data for every state and district are reviewed periodically (biannually and annually). It was reported by the officials in the ministry we contacted that, apart from this, at the time of uploading information and generating reports from the data entered by the district, the consistency of data is checked.
From this kind of information, it is possible to understand the impact or outcomes of the scheme.
c) Observations on MIS
Some of the preliminary observations on the MIS are as follows:
• The DMU treats employment generation, assets and finances as ‘outcomes’ which in fact are outputs and not outcomes. Outputs and outcomes are being conceptually misconstrued.
• One of the divergences indentified is the presentation of data in DMU Reports in the scheme’s portal
and that of the PMO website. If PMO’s DMU section is opened, it automatically directs to the
concerned scheme’s web portal’s DMU reports part. In the case of MGNREGS, there is divergence or
lack of update in PMO’s DMU section of the scheme. Data are available for the periods 2008-09 and
2009-10 only in PMO’s DMU, but in the DMU Report section for the scheme the information is
available for November, 2011, that is, here data are available for four years: 2008-09, 2009-10, 2010-11
and 2011-12.
• The time taken for sending the data and their uploading ranges between 1 to 7 days.
• There appears to be a time-lag in the ICT network interconnecting all the gram panchayats, blocks, districts, states and the union ministry; particularly, in certain small states/UTs. The lack of dedicated broadband connectivity at the block level hampers the flow of information upwards.
• Despite the fact that MGNREGA has the most comprehensive MIS system, yet it has not been able to raise an alert on delays in wage payments. The principal reason is attributed to an undue delay in updating, hence undermining the very basis of monitoring (Ambasta, 2009).
• The assets have been reported in the form of number of assets taken up and completed, but there is no information regarding their durability and sustainability. In other words, there is no measure or indicator to assure quality of the assets created.

25
• The overall work status of the completed works as percent of total projects turns out to be less than half
(49 per cent for the first year (2009-10) with huge differences across states.
• It would have been useful if time taken for transfer of funds (flow chart) from different sources (centre, state, district planning committee, programme officer to the gram panchayat level) were also presented to track the financial progress.
• Enormous data at disaggregated level are being collected, but no analytical reports are being generated,
which could have been an effective instrument of monitoring the progress and taking corrective
measures.
d) 12th Plan Approach for Emphasizing the MIS
States must effectively track delays in payment so that effective remedial action can be expeditiously taken when delays are spotted. For this, States must develop a customised MIS that enables better tracking of delays. The best example before us is the transaction-based MIS along the lines implemented in Andhra Pradesh. The tightly integrated, end-to-end computer network in Andhra Pradesh identifies delay in execution of any work registered online and takes corrective action immediately. The measurement sheets and muster rolls of the week’s work are compiled on the sixth day of that week and transmitted to the Mandal (sub-block) computer centre. The next day, the muster data is fed into the computer and on the eighth day pay-orders generated and cheques prepared. By the tenth day, cheques are deposited into post office accounts of workers. By the thirteenth day, workers are able to access wages from their accounts. Free availability of payment information facilitates public scrutiny and transparency.
Use of such real-time technologies to enable online updating of critical data at each stage of the MGNREGA workflow is now being facilitated by the Centre for each State. States need to urgently identify the connectivity and hardware bottlenecks so that these can be removed. State Governments should undertake business process re-engineering of all activities starting from capturing attendance to the end-point payment of wages in order to improve efficiency of implementation of MGNREGA. States should do away with redundant processes/records which contribute to delay in payments. States should closely monitor all the critical activities: closure of muster roll, capturing measurements, generating pay-order, issuance of cheque and pay-order to paying agency, transfer of cash to sub-agency (Branch Post Office/ Business correspondent) and wage disbursement to workers. Timelines for each activity should be clearly laid out against the concerned MGNREGA staff/agency responsible for meeting the timelines. Non-adherence to stipulated timelines should be penalised and the states should levy penalties on MGNREGA staff or agency responsible for any delay in wage payments. An accountability matrix will be used to track the inefficiencies in delay in wage payments and disciplinary/punitive actions shall be initiated accordingly
Fund allocation hence becomes an arduous task in implementation of MGNREGA. To tackle this problem, MGNREGA 2.0 proposes an integrated fund management system called e-FMS (Electronic Fund Management System) which ensures that the MGNREGA fund is not excess or deficient at any level. Under e-FMS, the MGNREGA fund is a centrally pooled fund managed at state level. The users, that is, GP at village level or Programme Officer at Block level or DPC at district level, all across the State, are the users of this centralised fund and will have access to this pooled fund (with certain restrictions). The users can now undertake only electronic transactions through the centralised fund, for the purpose of wage/material/administrative payments as per the actuals (with certain ceilings). All electronic transfers are realised in a span of 24 hours. Based on this principle of centralised fund and decentralised utility, the e-FMS ensures timely availability of funds at all levels and transparent usage of MGNREGA funds. This improves efficiency of the programme on the whole and also has a multiplier effect on timely delivery of wage payments (Planning Commission, 2012).

26
3) National Rural Health Mission (NRHM)
a) The Scheme
The NRHM was launched in 2005 by the Ministry of Health & Family Welfare with the objective to improve the availability of and access to quality healthcare by people, especially for those residing in rural areas, the poor, women and children. The mission (2005-12) seeks to provide effective healthcare to rural population throughout the country with special focus on 18 states, which have weak public health indicators and/or weak infrastructure. The health MIS was launched in October, 2008 and for capturing data, it has generated formats on a web-based system at the district level so that the primary data can easily be aggregated and the information/reports flow quickly to the State Headquarters and the Ministry. The system also enables information to be entered for each facility for MIS reporting. It also compiles periodic reports from HMIS portals (www.mohfw.nic.in).
The Plan of Action includes increasing public expenditure on health, reducing regional imbalance in health
infrastructure, pooling resources, integration of organizational structures, optimization of health manpower, decentralization and district management of health programmes, community participation and ownership of assets, induction of management and financial personnel into district health system, and operationalising community health centers into functional hospitals meeting Indian Public Health Standards in each Block of the country. All these should be reflected in the MIS.
b) Health Management Information System (HMIS) – Information given
Even though the scheme started its MIS in October 2008, the process of collecting data online on the progress of the scheme from the implementing agency started only in April, 2011. But, still the information and reports are not placed for the use of general public on the portal. In order to achieve full accuracy and consistency of the data provided by the states, the online reports are still under-trial mode.
All the states have not completely implemented the online system. Availability of infrastructure, manpower, states’ participation etc. is affecting these processes in the adoption of the software.
The web portal of the scheme gives information on various vertical programmes of the health and its infrastructure. There is information on Reproductive Child Health (RCH), Vector Bone Disease Control, Tuberculosis Control Programme, Leprosy Eradication Programme, Iodine Deficiency Disorders, Disease Surveillance Project, and Health Manpower Information system (HMIS) of the scheme.
The unique feature of the scheme is that, the information is presented indicator-wise. There are around 120
indicators such as pre-natal, post-natal, maternal health, immunization, infant mortality, maternal mortality, institutional delivery, Accredited Social Health Activist (ASHA), Rural Health Statistics, etc. If we click any one of the indicators, it gives data for the National, States, Districts and block-levels; and also the data on unit level (panchayat, village and individual beneficiary-wise). The section does not provide any feedback mechanism online for the general public in the HMIS section/portal of the scheme. The website of the scheme is also having enormous data and information on variety of fields but there is no feedback device in the portal in order to gather opinions of the general public.
There is also information on Mission Steering Group, Empower Programme Committee, Community
Action. ASHA, Task Group reports, and the list of state nodal officers. There is a report on ‘Five Years of NRHM 2005-2010’, reports of Common Review Commission and Joint Review Commission. The web portal of the scheme gives more details about the scheme. The resolution on NRHM, Implementation Framework, Composition of the

27
State Health Mission and District Health Mission, the role of major stakeholders, the progress of the scheme so far and Rural Health Statistics, 2010 are placed in the main page of the portal.
Table A3: National Rural Health Mission: Information Available on the Portal
Sl. No. Nature of reports Information covered 1. Periodic Reports There is also a folder on Periodic Reports under the HMIS. This section on
periodic reports brought about the following reports. A. Compiled Reports from HMIS Portal – State Performance through HMIS 2008-09, RCH Reports Provisional and Report from Data uploaded by states.
B. Demographic and Vital Indicators – Sample Registration System (SRS) Bulletin for the year, 2006, 2007, 2008, 2009 and 2010. Time Series Data on Crude Birth Rate, Crude Death Rate, Infant Mortality Rate and Total Fertility Rate, Demographic Indicators, Maternal Mortality Ratio Estimates and the population projections; No latest information is placed in the HMIS section
2. Publication The publication folder in the HMIS section gives the information and reports on the followings:
A. Survey Reports: National Family Health Survey (HFHS) Reports, District Level Household Survey (DLHS), Coverage Evaluation Survey for 2009, Annual Health Survey, 2010-11
B. Statistical Reports: Bulletin on Rural Health Statistics for the year, 2007, 2008, 2009, 2010 and the Family Welfare Statistics for 2006, 2009 and 2011.
C. Other Publications: The proceeding of the Central Council of Health & Family Welfare for the year 1998-2009 and some studies undertaken by the World Bank are given in this folder.
D. M & E Activities: The Statistics (Monitoring & Evaluation) Division
in the Ministry of Health & Family Welfare is responsible for monitoring and evaluation of the National Family Welfare Programmes in the country. The information flows from the primary levels and is consolidated at the State level on a monthly basis before the information is sent to the Ministry for the national level consolidation. The system for capturing information on family welfare programmes has evolved over the years based on the changing needs of the Ministry.
E. Concurrent Evaluation: The M&E Division is undertaking a scheme for concurrent evaluation of the National Rural Health Mission (NRHM) by independent agencies for evaluating the impact of the Mission in its various dimensions across States. The relevant documents in the context of this evaluation and some of the evaluation fact-sheets are placed in this folder.
3. Progress of the Programme The progress of the programme folder gives the details on three aspects: i) All India Summary of NRHM as on 30-06-2011 ii) State-wise Progress on 30-06-2011 iii) Blank Data Format for States

28
The scheme is collecting four points of data from the field – monthly, quarterly, yearly and financial year-wise. Monthly reports should reach the headquarters within 15 days of the completion of each month.
The main purpose of the HMIS is to bring out the achievements and improvements in the health sector through this mission. The HMIS is used for both monitoring & evaluation and ex-post analysis of the scheme. The HMIS is ensuing to provide more accurate and qualitative information about the health indicators. Eleven states are completely providing the indicator wise information. Through the monthly system of reporting, the services provided on each component of the scheme can be seen which help to improve the services by plugging the loopholes at the state level or district level. Therefore, these reports are helpful for better implementation and success of the scheme.
There is a well designed system to use the data and information of the scheme on routine basis. At every stage and for each period, the scheme’s progress is being reviewed and necessary amendments are incorporated in the implementation guidelines. The Sponsoring Ministry (Ministry of Health and Family Welfare), collaborative agencies such as World Health Orgsanisation, World Bank, United Nations Organisation, some of the European nations and United States of America are using the scheme’s data for making policies and changing the existing policy as per their requirements. Thus, through periodic updating of the health related policies, the scheme’s MIS/web portal is helping the policy makers and planners.
In general, the local level health related documents or data are not being used by anybody or any agency/organisation. However, all the records and registers are maintained in local languages only. Any agency and organisation can see and verify the records with the approval of the competent authority at the local level. Systematically, all the records and entries are maintained in the records. Periodic checking, monitoring and cross-verification of the entered data on sample basis are also done, as claimed by the ministry officials.
c) Observations on MIS
We were told by the Ministry of Health Officials that, at every stage there are some mechanisms or other in place to check the reliability and consistency of the data which are as follows: (i) software control – the software itself controls some of the wrong entries; (ii) all data on health indicators are checked by the competent authority at the district level, then all the district level information is checked by the state level officials; (iii) there are 18 Population Research Centres spread over the country – they also cross-check all the data provided by each district and the state; and (iv) there are two missions (Common Review Mission and Joint Review Mission) that are responsible for the review of the HMIS on monthly basis. At present, the headquarters is not responsible for the accuracy of the data and reports, rather each state and district is asked to rectify the errors in data/reports in order to get complete and reliable information from the implementing agency.
The followings are the observations on the MIS.
• International Agencies like WHO, World Bank, UNICEF and other Ministries and Departments are frequently using the data of HMIS. Therefore, HMIS should build an accurate reporting system to ensure an accurate data base.
• More focus is needed on generating analytical reports which should help measuring the real outcomes and impacts.
• The HMIS has a strong mechanism to control inconsistency and wrong entries and it ensures reliable
information and reporting.

29
• Community-based monitoring of health services is a key strategy of the scheme and there is provision for monitoring and planning committees at primary health centre (PHC), Block, District and State levels.
• The MIS does not report any information on maternal deaths and estimates of maternal mortality ratio on a
regular basis.
• For monitoring and evaluation of the programme, health MIS should be developed up to community health centre level. Sub-centers, primary health centre and community health centers would be reporting on their performance regularly to the people’s bodies like Panchayats, Rogi Kalyan Samitis and District Health Mission (Bajpai et al., 2009).
• The HMIS in India should be completely computerised at every stage (Bodavala, 2000). Still the HMIS is
not completely computerised at the data source in rural areas where anganwadi is the major data source on health indicators. At present, 381 districts in the country are using the computerised data entry at block level even some districts are entering the data at Primary Health Centre (PHCs).
• HMIS reporting system should be more flexible in a way to entertain feedbacks/suggestions from its stakeholders at all levels.
The HMIS is collecting and collating the data on 120 Health Indicators, which would be made available to general public:
National State District Block Family Level
The system is already in place and in trial mode for the last one year. At present, it permits only the restricted users to access this information, with the login process.
d) 12th Plan Approach for Emphasizing the MIS
During the Eleventh Plan, a web based Health Management Information System (HMIS) application software has been developed and made operational for online data capture at district and sub-district levels on RCH service delivery indicators. The data captured is scanty, restricted to public facilities and is not always used for programme planning or monitoring.
4) National Rural Drinking Water Programme (NRDWP) a) The Scheme
The NRDWP is one of the six components of Building Rural Infrastructure under Bharat Nirman. During the Bharat Nirman Phase I period (2005-06 to 2008-09), 55,067 uncovered and about 0.33 million slipped-back habitations (already covered habitations to be covered again) were to be covered with provisions of drinking water facilities and 0.217 million quality-affected habitations were to be addressed for water quality problem. The Phase II of the scheme is being implemented from 2009-10 to 2011-12. The Department of Drinking Water Supply, Ministry of Rural Development, is responsible for meeting this goal in partnership with the State Governments (www.bharatnirman.gov.in).
The Ministry has been assisting the States and Union Territories to accelerate the pace of coverage of drinking
water supply. The entire programme was given a mission approach in order to improve the performance and,

30
cost-effectiveness to ensure adequate supply of safe drinking water. The Technology Mission on drinking water and related water management was launched in 1986. It was also called the National Drinking Water Mission (NDWM), which was renamed as Rajiv Gandhi National Drinking Water mission (RGNDWM) in 1991(www.ddws.nic.in). From 2005 onwards it is called NRDWP and it is the only flagship programme to provide safe drinking water to every habitation/village. The scheme is implemented on 50:50 cost-sharing basis between the Central and State governments. The State government is fully implementing the scheme because water resource is a state subject. Since 2010 the Integrated Management Information System (IMIS) has been functioning (including for TSC) (www.indiawater.gov.in).
It is also planned to introduce the automatic SMS service from the next financial year for getting monthly progress report and other related information. Also, there is a plan to introduce social auditing by including the village communities and to utilise Block Resource Centre – block level to be made nodal centre of the scheme (every block will have a technical person-in-charge for the scheme). Then the data entry level would come down one level below from district to block.
The software for Integrated Management Information System (IMIS) was developed for collecting the information from the local point where the scheme is implementing in a systematic manner to pool the data at one point for generating the reports.
b) Information available on the Portal A variety of information starting from Gram Panchayat, Block, District, State and National level on water
connections/quality, testing by habitations is placed on the portal. The unique feature is that, one can check habitation/village details on one’s own, which means habitation level data are available in the portal. Apart from these, Geographic Information System (GIS) is another unique feature of the MIS of the scheme, which gives mapping of the states/regions by targets and achievements. Without looking at the complete details one can easily identify the achievements during the year by social category.
Table A4: Rural Drinking Water Programme (NRDWP): Information available on the portal
Sl. No. Nature of reports Information covered 1. About the scheme Guidelines, background note and case studies 2. Basic Information Complete details about the Census, details about the scheme
which includes: habitation information, Left Wing Extremist Districts, Desert Development Programme Areas, Minority Districts/Blocks, SC/ST dominated habitations, and water sources in habitations.
3. Financial Progress Budget information and the MIS financial reports are placed in this folder. State-wise allocation & sanction, head-wise allocation and sanction, and components-wise expenditures by state-wise are some of the items given.
4. Alerts Latest information about the implementation process of the scheme
5. Physical Progress Reports: Target habitations & achievements and progress reports, coverage status by state are placed in this folder.
6. Water Quality and Surveillance Water sample testing, financial year-wise sample testing details, Gram Panchayat-wise tested sources, district water quality profile, and laboratory information, are the major components placed on this heading.

31
Every day the data are being updated. At midnight all the entered data are automatically getting updated in the portal and the data are placed on the portal. At three points the data entry is taking place: District, State and Central (Ministry). A proper checking is done at every level for the consistency of the data before these are entered into the portal. The web-based software for entering the data is user-friendly software. At the time of introduction of the online software for data entry there were queries and constraints for the officials at lower level. All such problems were solved after induction through periodic training to those officials.
At present, after the introduction of Result Framework Document (RFD), the progress and achievements
made by each state is being reviewed periodically especially for next year’s budgeting and approval of the plan of action.
Generally, the data are used by the Ministry for their own purposes in order to know the progress of the
scheme and also for their concurrent evaluation. Planning Commission is the regular user of the data of the scheme. International agencies like; World Health Organsation (WHO), United Nations Development Programme (UNDP) and other National level Voluntary Organisations use the data frequently. Apart from these, every State government uses this information for its planning and budgeting purposes. No raw data are to be shared with general public. At every stage a proper checking and approval is done before these data are entered in the portal.
c) Observation on MIS
Some of the observations on the scheme are described as under: • The data are cumulative from 2005-06 to 2011-12 making it difficult to carry out the analysis annually. It is
also not clear whether the data relate to monthly or quarterly progress.
• The DMU report is quarterly but the information is given on annual basis. It would have been better had the information been collected and presented quarterly basis in order to monitor the effectiveness of implementation.
• It is not clear whether the information provided is used for the preparation of analytical reports in order to measure progress.
• As regards the accuracy of data, the Ministry depends completely upon the state governments. The data are
placed in the portal by the district officials dealing with the programme (Jal Board/PWD etc). No validation mechanism exists in this process.
• Monitoring is done by the concerned state government department and not by the Ministry. However, if
wrong or inconsistent data are noticed, then concerned person in the Ministry points it out and the same is rectified by the concerned officials from the state government.
• Some sort of feedback mechanism flows to the Ministry from the local MPs/legislators/audit performance report/general public about the progress and the problems in the programme. It is not clear how and to what extent this feedback is incorporated in the programme.
• Huge data are generated in the scheme but it is hardly used for analysis purposes and there is a vast scope for statistical analysis of the data, in particular, interlinking of health indicator with safe drinking water which is extremely important. It is also unclear how huge data collected would help in generating analysis for policy purposes, since no analytical framework appears to exist.

32
d) 12th Plan Approach for Emphasizing the MIS
Appropriate use of IMIS and GIS maps in the planning process is being promoted to prevent social exclusion. Provision of drinking water in minority concentrated districts is one of the activities monitored under the Prime Minister’s New 15-Point Programme. Implementation of rural water supply schemes is being closely monitored in the 90 minority concentrated districts. The Ministry of Drinking Water Supply and Sanitation has devised a Management Devolution Index (MDI) to track and incentivise more substantive devolution of functions, funds and functionaries to the Gram Panchayats. While allocating resources across States, 10 per cent weight is given to the population of GPs to whom drinking water supply schemes have been devolved weighted by the MDI for the State.
5) Total Sanitation Campaign (TSC)
a) The Scheme
The TSC was launched by the Department of Drinking Water and Sanitation, Ministry of Rural Development. It is a comprehensive programme to ensure sanitation facilities in rural areas with broader goal to eradicate the practice of open defecation. The TSC was initiated in 1999 when Central Rural Sanitation Programme was restructured making it demand driven and people centered. The main goal of the TSC is to eradicate the practice of open defecation by 2017 (www.ddws.nic.in). We are now in 2012 and according to NSS 2009, 51 percent of households in India do not even have a toilet, and many of those that do have toilets do not use them.
The Scheme follows a principle to provide subsidy in the form of incentive to rural poor households for construction of toilets. The TSC gives strong emphasis on information, education and communication (IEC); capacity building and hygiene education for effective behaviour change with involvement of Panchayat Raj Institutions (PRIs), Community Base Organisations (CBOs), and Non-Governmental Organisations (NGOs) etc. The key intervention areas are individual household latrines, school sanitation and hygiene education, community sanitary complex, anganwadi toilets supported by rural sanitary marts and protection centers. The main goal of the Government of India (GoI) is to eradicate the practice of open defecation by 2017. To give a fillip to this endeavour, GOI has launched Nirmal Gram Purashkar to recognize the efforts in terms of cash awards for fully covered PRIs and those individuals and institutions who have contributed significantly in ensuring full sanitation coverage in their area of operation. The project is being implemented in rural areas taking district as a unit of implementation (www.ddws.nic.in).
For TSC, an online progress monitoring system is in place and a data-entry system (district-wise) has been devised. The state has designed a district, block and panchayat level data collection form and a base-line survey for reporting monthly progress. The TSC is probably the first scheme that introduced the online MIS among all the Government of India’s programmes in 2002 and other programmes followed the MIS pattern of TSC, as claimed by the Ministry officials.
Under the online monitoring system, the household sanitation details for villages/habitations are entered at district level on daily basis. The scheme is being implemented in 609 districts in the country of which almost 80-90 percent of the districts send their monthly reports on time (for instance, monthly report for December 2011 is forwarded by 403 districts as on January, 2012).
The District level officials who are in charge of the scheme are responsible for editing and accuracy of the data given in the portal. For validation and cross-checking of the data, other national and international organisations (UNICEF) are also independently doing field studies. Nirmal Gram Purashkar (NGP) is awarded to the panchayats which have the 100 percent sanitation in their areas. Those panchayats which are applying for the award are also engaged in cross-checking of the habitation data.

33
The Panchayati Raj Department is planning to give the Information and Communication Technology (ICT) facilities to every panchayat. Once it is implemented, the data would be available straightaway from panchayats thereby ensuring more transparency, and faster and timely availability of data.
b) Information available on the Portal
The software was developed for collecting the information from the point where the scheme is being implemented. The main purpose of MIS is to collect data to know the progress of physical and financial aspect of the scheme. A variety of information for Gram Panchayat, Block, District, State and National level is placed on the portal. The Geographical Information System (GIS) uses maps to show the States’ progress and achievements and is also placed in the portal.
At present, after the introduction of the Result Framework Document (RFD), the progress and achievements made by each state is being reviewed periodically, especially for using these data for the next year’s budgeting and approval of the plan of action.
Generally, the data are used by the Ministry for their own purposes in order to know the progress of the
scheme and also for their concurrent evaluation. Once the data are available online, it is downloadable from the website of the scheme by anyone. Apart from the sponsoring Ministry, Planning Commission is a regular user of the data of the scheme. International agencies such as UNICEF, UNDP and other National level Voluntary Organisations using the data frequently. No information is made available to the public at the local level.
The data entry takes place at three points: District State and Centre (Ministry). The data are placed into the portal through online software. A proper check is done at every level for the consistency of the data before these are entered into the portal. Once the data are approved by the Programme Officer at the entry level (District), then these are placed in the portal. There is hierarchy at every stage to check and verify data starting from Block Officer, District Programme Officer and the State in Charge/State Chief Secretary who is responsible for the data of each district. The ministry officials claimed that, at every stage a proper checking and approval of data is done before these data are entered in the portal.
Table A5: Total Sanitation Campaign (TSC): Information available on the portal
Sl. No. Nature of reports Information covered
1 Physical progress reports State-wise physical progress, State-wise physical progress in percentage, SC/ST category-wise achievement, comparative physical report, year-wise physical achievements etc.
2 Financial progress reports State-wise financial progress and expenditures details 3 Other reports Basic performance report, State-wise basic information, annual
implementation plan, State-wise details of the project sanctioned, progress report for naxal affected districts, progress report for minority concentrated districts, progress report for ST dominated districts, progress report for Backward Regions Grant Fund (BRGF) districts and contact details of the officials are given.
4 Report card The report card shows the status report for State note, District note, Block status and Panchayat status
5 Data entry Considerable amount of data are placed in this section on progress of the scheme.

34
c) Observations on MIS
In spite of relatively better performance of the scheme, there are certain issues that need attention:
• The goal of TSC is to eradicate the practice of open defecation by 2017 seems distant objective, as the scheme is nowhere near the goal. Evidently, lack of monitoring of actual use of toilets built and the poor quality of toilets appears to be the reason for poor progress.
• There are no reports based on the MIS data.
d) 12th Plan Approach for Emphasizing the MIS
Effective hand-holding with adequate IEC must continue for a period of time even after construction to ensure sustainability of outcomes. Comprehensive region-specific communication and information strategy will be deployed for demand generation and sustainability. Office bearers and members of GPs, VWSCs, BRCs, SHGs, Swachhata doots, women and youth groups, school committees, and so on will be involved in dissemination of information and effective communication. NGOs and CBOs of repute may be engaged for maximum results for individual contact, motivation and implementation. Key Resource Centres must also be identified within State/district for training of State/district level functionaries in IEC.
6) Rural Electrification Programme: Rajiv Gandhi Grameen Vidhyutikaran Yojana (RGGVY)
a) The Scheme
The Ministry of Power has a rural electrification programme, which is one of the flagship programmes launched in March 2005 with an objective to electrify over 0.1 million un-electrified villages and to provide free electricity connections to 23.4 million rural BPL households. The MIS of the RGGVY is detailed in terms of projects approved for implementation, achievements and compliance (www.rggvy.gov.in).
Under the programme 90 percent grant is provided by the Government of India and 10 percent as loan by Rural Electrification Corporation (REC) to the State Governments. The REC is the nodal agency for implementation of the programme. The scheme aims at: electrifying all villages and habitations as per new definition, providing access to electricity to all rural households, and providing electricity connection to BPL families free of charge. The basic Infrastructure under RGGVY scheme is: Rural Electricity Distribution Backbone (REDB) with 33/11 KV (or 66/11 KV) sub-station of adequate capacity in blocks where these do not exist; Village Electrification Infrastructure (VEI) with provision of distribution transformer of appropriate capacity in villages/habitations; and Decentralized Distributed Generation (DDG) Systems based on conventional & non-conventional energy sources where grid supply is not feasible or cost-effective.
b) Information available on the Portal
A huge variety of information is placed on the portal of the scheme: 2001 Census-based habitations list for the country, un-electrified villages/habitations, BPL list, SC/ST habitations list, information relating to physical and financial aspects etc. Starting from village/habitation details to national reports on the progress and achievements of the scheme are given on the portal. But under the Bharat Nirman, the information placed in the portal of the scheme is limited. Un-electrified households by state-wise and BPL households electrification status by states are given in the DMU section of the portal. Under the head of MIS, one-page details on the number of projects in progress and the financial aspects for the country as a whole are given alone.

35
The web portal (http://rggvy.gov.in) of the scheme was launched in 29th May, 2009. At present, the information in the portal is available in two languages, Hindi and English. The schemes’ progress and achievements during the 10th and 11th Plan has been given separately on the portal. What kind of initiatives and changes and improvements taken place during both the plans were also given in this folder.
Table A6: Rural electrification Programme (RGGVY): Information available on the Portal
Sl. No. Nature of reports Information covered 1. Milestone and Monitoring This folder explains that milestone-based monitoring system has
been designed to monitor certain predetermined milestones in the project implementation.
2. Villages Covered List of villages/habitations covered under the scheme is given state-wise.
3. Electrification Status of Villages By entering the state, district, block and village names, the complete details of the electrification status of the villages are given in this check point.
4. Progress Reports The project statuses of all states are placed in this folder by different category.
5. DMU Report Two category of information are placed in this DMU section on Un-electrified Villages and Status of BPL households’ electrification.
Public Forum In the Public Forum section, very useful items such as frequently asked questions (FAQ) and their answers are given, which are very useful for the general public to know the procedures and strategy of the scheme.
Implementing Agency Rural Electrification Corporation (REC), list of Central Public Sector Undertakings (CPUs), State government departments that are involved in the process of implementation of the scheme, and the list of Distribution Companies (DISCOM), are placed in this section.
6. Quality Monitoring The list of agencies under the scheme for quality monitoring, Quality Monitors’ list, Inspection Report/details of Third Party Inspection Agency (TPIA), REC Quality Monitors, State-wise inspection details, Quality Manual, Field Inspection by REC Quality Monitors are included in this section.
7. Download There are 14 items are in place in this folder which include: scheme’s brochure, national franchisee programme, procurement guidelines, and the quality control manual for works etc.
c) Unique Feature
More than 60 percent of the users of the web portal who access of the data of the scheme are from outside the country (especially developed and European nations). This is a unique character of the MIS of the RGGVY. In order to know the volume of work/action plans/ targets the data are assessed by the foreigners (outside the country for their business opportunities). The main aim of the scheme is to provide electricity to un-electrified villages and habitations. At present, renewable sources of generating electricity is more significant for some areas where electricity cannot be provided through the normal system. For selling and business collaboration with the implementing agencies, foreigners are accessing the data of the scheme as these nations are dominant in manufacturing of equipments for producing green energy.
The role of foreign players is unavoidable in this field as they are leading in manufacturing the equipments for solar, wind and other green energy equipments. The data of the scheme on villages/habitations proposed for electrification is attracting foreign companies to tie up with the implementing agencies of the scheme. International

36
agencies (like UN) in the country are also using the data of the scheme. All the information is downloadable from the website and is available to the general public.
Once the data are authenticated by the officer who is responsible for particular projects or districts or regions, these are entered into the portal.
d) Observations on MIS
Some preliminary observations of the above MIS are presented as under: • The MIS is very brief (one page) and has little or no usability for analytical purposes for evaluating the
scheme. • While the RGGVY claims that a village or a BPL rural household has been electrified, there is no
information whether any electricity ever flows through the lines that are running into the village or households. When urban areas suffer from heavy load-shedding, it is unlikely that rural BPL households receive power.
e) 12th Plan Approach for Emphasizing the MIS
Research &Development initiatives are also required for enhancing material strength and durability and for standardisation on their specifications. A key initiative for R&D in the Twelfth Plan may include setting up of a technical cell in CEA, which will focus on best practices, R&D in data collection and specific projects and technical support to States for consultancy and implementation. 7) Low Cost Housing to Rural Poor: Indira Awaas Yojana (IAY)
a) The Scheme
The IAY, low-cost housing for the rural poor, was launched during 1985-86 as a sub-scheme of Rural Landless Employment Guarantee Programme and continued as a sub-scheme of the Jawahar Rozgar Yojana since its launch from April, 1989. It was delinked from the JRY and made an independent scheme with effect from January 1, 1996. The objective of the IAY is primarily to help construction/up-gradation of dwelling units of the members of socially disadvantaged groups and other minorities in the below poverty line (BPL) category living in rural areas (www.bharatnirman.gov.in).
There is an online data entry provision in the portal by field staff. Guidelines and the prescribed procedure have been neatly structured and also envisioned that officers dealing with IAY shall ascertain through field visits whether the programme is being implemented satisfactorily and whether construction of houses is in accordance with the prescribed procedure. The state governments shall conduct periodic evaluation studies through reputed institutions and organisations on issues thrown up by the concurrent evaluation. The software was designed and developed for collecting information from the location where the scheme is being implemented. Main purpose of MIS is to collect data to know the progress of physical and financial aspect of the scheme.
b) Information available on the Portal
The portal contains a variety of information: Gram Panchayat, Block, District, State and National level information on BPL, APL (above the poverty Line) families’ requirements of houses, Women-headed houses; Disabled persons’ housing requirement details etc. Discussion with the Ministry revealed that every day the data are being updated by some states; some states updated their information 15-20 days ago or even before one month. Therefore, date of updating the data is not mentioned in the data-sheets in the portal. In general, 60 percent of the information is updated regularly between 0-7 days. The timeline depends upon the State’s IT infrastructure.

37
Thus, some states are very much advanced in ICT infrastructure such as Gujarat, Himachal Pradesh, Andhra Pradesh, Tamil Nadu, Karnataka and Kerala; where ICT infrastructure is well developed at gram panchayat level. Some States like the North Eastern Region are completely lacking the services and the remaining states are managing with their available resources. In the web portal (http://iay.nic.in) of the scheme the following information were placed in different fields.
Table A7: Housing for the rural poor (IAY): Information available on the Portal
Sl. No. Nature of reports Information covered
1. Rural housing About the scheme and its profile 2. Selection of beneficiaries Guidelines about the method of selection of beneficiaries for the
scheme. 3. Fund management The entire process of financial dealing of the scheme is widely
explained under this heading. 4. Innovations What kind of new mechanism was added in order to maintain the
quality of the houses is briefed in this folder. 5. Number of Institutes working The list of institutions involved in the process of implementation
of the scheme all over the country is given. 6. Success Stories Success stories of three states: Kerala, Maharashtra, and Tamil
Nadu were given in the form of PPT presentations with photographs of the constructed houses along with the beneficiaries.
7. Components under IAY New Construction, Up-gradation, Credit-cum-Subsidy Scheme, Contingency Fund under IAY, Homestead Scheme and Special Packages
8. What is New Vision Plan for Rural Housing, State to Prepare Action Plan, Comments invited on Draft National Rural Housing and Habitat Policy Latest training particular on software is also given.
9. Communication Information relating to Database of IAY Beneficiaries and Introduction of IAY MIS
10.
AWAASSoft 2
The IAY monthly progress report, by district and state-wise financial progress, physical progress, and convergence details are mainly placed under this folder. Apart from this, latest development and changes in the software are also in place.
11. Public grievance redressal system
Another very important aspect of the scheme that is placed on the portal is a well structured Public Grievance Redressal System. General public can register their grievances to the Ministry at a central point, for clarification and action.
Through the IAY registration number given to each beneficiary, the individuals’ details are also available in the portal. In the reference centre, the complete details of 2001 Census and 2002 BPL Census is given. Annual Reports for the year 2006-07, 2007-08, 2008-09, and 2009-10 are given in two languages, English and Hindi. The Citizen part of the portal was not functioning at the time of visit to portal.
2. The AWAASSoft is an e-Governance solution developed by National Informatics Centre (NIC) in collaboration
with the Ministry of Rural Development. The software would help all the stakeholders of Indira Awaas Yojana (IAY) to take stock of the progress of rural housing schemes in their areas from their own locations, which in turn makes the whole system quite transparent. It is a local language enabled workflow based transactional level management information system to facilitate e-Governance in the system. The system is designed for all the stakeholders of IAY including the beneficiaries of the scheme.

38
Discussion in the ministry showed that the MIS software is user-friendly. Anyone can handle this software for data entry purposes, as training was given to the concerned officials. The unique feature of this software is that it can be operated in both online and offline mode (Modem in headquarters is used to save the data automatically.)
Generally, the data are used by the Ministry for their own purposes in order to know the progress of the
scheme and also for their concurrent evaluation. Once the data are available online, it is downloadable from the website of the scheme by anyone. Once the data are approved by the Programme Officer at the entry level (District) these are placed on the portal. Utmost care is taken to enter the accurate information in the portal. There is hierarchy at every stage to check and verify the data – Block Officer is responsible for the data of each Gram Panchayat, District Programme Officer is responsible for the data of each block, and similarly State-in-charge is responsible for the data of each district. At headquarters, the data are analysed during the review meeting organized at the regional level or State level or national level. c) Observation on MIS
An examination of the MIS reveals some of the issues as follows:
• State-wise and district-wise monthly progress report is presented in terms of physical and financial parameters, but it is not clear how the information is being utlised to measure the outcomes.
• Monthly progress report (MPR) (physical, financial) state/district-wise is given, but it is not mentioned for which month the data relate to.
• Surprisingly, there is a column which gives difference between MPR and MIS. It is not clear why this difference in data occurs, when the timeline for the data given in these two heads is same?
d) 12th Plan Approach for Emphasizing the MIS
Rural Building Centres (RBCs) at the district level could play an important role as a single window solution for guidance on quality construction, supply of alternative materials, skill building of artisans and development and dissemination of innovative, location-appropriate technologies that minimise the use of high-energy construction materials. They could also carry out special skill upgradation programmes intended to impart both skills and organisational abilities, effective monitoring of housing construction, knowledge building and awareness creation on quality and safety features The RBCs would provide a platform for developing comprehensive knowledge and experience of application of common alternative technologies for various geo-climatic zones of India needs to be developed. A network of RBCs would serve to link research institutions with rural habitat practitioners for dissemination of technical know-how. It would also facilitate further development of knowledge on alternate materials and technologies for different geo-climatic zones.
8) Universalisation of Elementary Education (UEE): Sarva Shiksha Abhiyan (SSA)
a) The Scheme
The SSA is Government of India's flagship programme for achievement of universalisation of elementary education in a time-bound manner, as mandated by 86th amendment of the Constitution of India – making free and compulsory education to the children of 6-14 years age group a fundamental right. The scheme of SSA was launched by the Department of School Education and Literacy, Ministry of Human Resource Development in 2001 and is

39
being implemented in partnership with all the state governments to address the needs of 192 million children in 1.1 million habitations (www.ssa.nic.in).
As part of the Educational Management Information System (EMIS) framework, SSA covers primarily the District Information System for Education (DISE). The aim of DISE is to analyse data collected from all the primary and upper primary schools of all the districts of the country.
The DISE is one of the most important sub-systems of the EMIS that covers the elementary education sub-sector of the school education system. It covers the primary and upper primary school/section-wise data on enrolment, physical infrastructure and teachers, using structured data capture format (DCF). Such data are computerised mostly at the district level (in some states, it is done even at the sub-district levels), and collated at the state/UT level. On the basis of DISE data, National University of Educational Planning and Administration (NUEPA) has developed school report card system for more than 1.29 million primary and upper primary schools (www.schoolreportcards.in) and is bringing out analytical reports, flash statistics and district report cards of the programme regularly (www.dise.in). Key performance indicators of data (pupil-teacher ratio, student-classroom ratio, gross and net enrolment ratios, dropout rates, repetition and completion rates, transition rates) are generated at all the desired levels (national, state, district, block, cluster, village and school) for usage in the preparation of annual work plans and budget. Besides, need-based and issue-specific information are also generated from the main DISE database from time to time.
The MIS has direct linkage with evaluation reports of the programme. The programme gets reviewed by the bi-annual Joint Review Mission (JRM) every year. The JRM has 10 members from the development partners and 10 members nominated by Government of India (GoI) that includes one mission leader. The JRM takes most of the information from the programme MIS only to evaluate the progress made by the programme.
b) Information available on the Portal
One of the main features of the MIS of the scheme is, it is meant only for data entry purposes by the different level of stakeholders (Ministry, State and district). There are no reports in the MIS folder of the scheme. Hence, a huge amount of other information is available in the portal of the scheme. Majority of such information provides only administrative details rather than any impact or outcome or analysis reports.
Table A8: The Universalisation of elementary education programme (SSA): Information available on the Portal
Sl. No. Nature of reports Information covered 1 Girls’ education Special schemes for promoting girls’ education and its details and
guidelines are mainly presented under this heading. 2 Quality education Shri Anil Bordia Committee Report on Right to Education, monitoring
quality dimensions of elementary education and the right of children to free and compulsory education act 2009 are some of the items presented in this section.
3 Alternative schooling Minutes and sanction of grants & aid are mostly presented in this folder.
4 Inclusive education Specials provisions were made for giving importance to the children with special needs (CWSN) to achieve UEE. All the particulars of these provisions are given this section. In fact, inclusion of CWSN is extremely crucial for UEE.
5 Research studies Study reports on school drop-outs, achievements in enrolments and literacy, students’ attendance, teachers’ absence, evaluation and monitoring reports on civil works of the scheme etc. are placed in this folder.

40
6 Pedagogy unit This folder provides maximum details and reports on quality improvements in elementary education.
7 Planning This folder provides detailed information on planning and appraisal board’s meetings and minutes.
8 Monitoring This folder contains information on DMU report on the progress of the scheme, review missions’ minutes, monitoring institutions’ list and the progress monitoring reports.
9 MIS This folder has no reports. Only minutes of the meetings and workshops’ details are given.
10 Publication This folder provides the details of some of the reports on out of school children, quality of education etc.), and newsletters.
11 Urban planning This folder provides the details on the overview of urban planning under SSA.
12 Financial management Statement of releases of funds and expenditure under SSA are presented in this folder.
13 DMU The DMU section gives the progress up to December, 2012 for the financial year 2012-13.
c) 12th Plan Approach for Emphasizing the MIS
To encourage innovation and sharing of best practices, the Plan will provide a certain amount of untied ‘flexi’ funds to the States and also provide additional amounts of ‘results-based’ financing. States in turn will be encouraged to invest in district-level leadership and provide autonomy and resources to districts and encourage capacity building at the district level to monitor and improve education outcomes. A key challenge for e-monitoring is the absence of high-quality data that is updated on a frequent and reliable basis. Infrastructure such as the Unique Identification (UID) could be deployed to keep track of student enrolment, attendance, and dropouts, and biometric authentication could also be deployed to improve teacher attendance. Modern cell phone-based technologies may prove to be a promising way of empowering communities to report real-time data on school performance metrics such as teacher attendance, student attendance, and availability of midday meals and so on.
9) Jawaharlal Nehru National Urban Renewal Mission (JNNURM)
a) The Scheme
The JNNURM was launched by the Ministry of Urban Development in 2005 with the objectives to create economically productive, efficient, equitable and responsive cities; to improve and augment the economic and social infrastructure of cities and to ensure basic services to the urban poor including security of tenure at affordable prices, etc. The JNNURM has two sub-missions – one on urban infrastructure and governance, and another on basic services to urban poor. Urban infrastructure and governance has elaborate programme monitoring system that has user manual based data entry formats for city development plan. Monitoring formats have been devised for quarterly reporting. City development plan and detailed project report user manuals have been prepared as tools for programme monitoring (www.jnnurm.nic.in). Elaborate guidelines have been structured and expected outcomes outlined, but how these outcomes will be achieved is not defined.
The mission documents along with the guidelines and general details are dominantly placed on the portal of the scheme. The budget documents provide details of budget estimates and revised estimates, and funds released by the State. Also, information is provided on fund disbursements, fund approved but not released as on date, fund requested but not approved as on date, funds requirement, commitment projected for the year, capital investment (GoI share) projected as per City Development Programmes (CDPs), fund requests projected for detailed project reports (DPRs) under appraisal for the year, state building and state budget vs actual comparative report provided by State, city and project-wise. The data portion deals very little information.
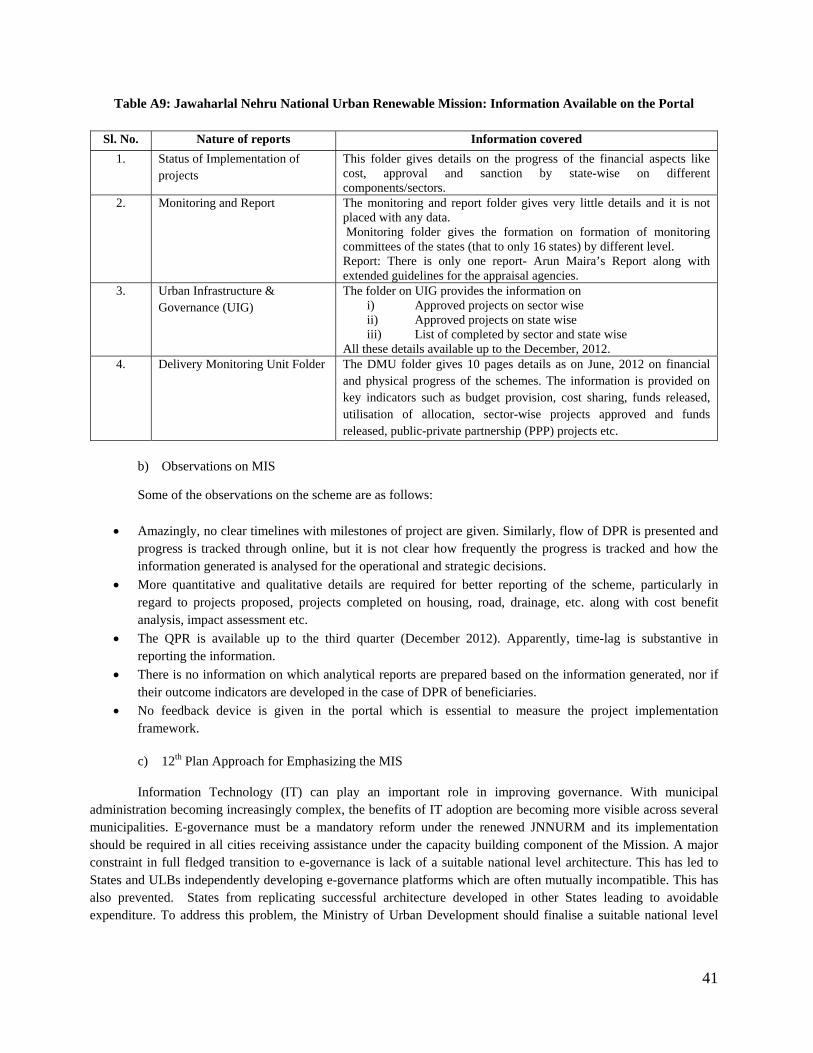
41
Table A9: Jawaharlal Nehru National Urban Renewable Mission: Information Available on the Portal
Sl. No. Nature of reports Information covered 1. Status of Implementation of
projects This folder gives details on the progress of the financial aspects like cost, approval and sanction by state-wise on different components/sectors.
2. Monitoring and Report The monitoring and report folder gives very little details and it is not placed with any data. Monitoring folder gives the formation on formation of monitoring committees of the states (that to only 16 states) by different level. Report: There is only one report- Arun Maira’s Report along with extended guidelines for the appraisal agencies.
3. Urban Infrastructure & Governance (UIG)
The folder on UIG provides the information on i) Approved projects on sector wise ii) Approved projects on state wise iii) List of completed by sector and state wise
All these details available up to the December, 2012. 4. Delivery Monitoring Unit Folder The DMU folder gives 10 pages details as on June, 2012 on financial
and physical progress of the schemes. The information is provided on key indicators such as budget provision, cost sharing, funds released, utilisation of allocation, sector-wise projects approved and funds released, public-private partnership (PPP) projects etc.
b) Observations on MIS
Some of the observations on the scheme are as follows:
• Amazingly, no clear timelines with milestones of project are given. Similarly, flow of DPR is presented and progress is tracked through online, but it is not clear how frequently the progress is tracked and how the information generated is analysed for the operational and strategic decisions.
• More quantitative and qualitative details are required for better reporting of the scheme, particularly in regard to projects proposed, projects completed on housing, road, drainage, etc. along with cost benefit analysis, impact assessment etc.
• The QPR is available up to the third quarter (December 2012). Apparently, time-lag is substantive in reporting the information.
• There is no information on which analytical reports are prepared based on the information generated, nor if their outcome indicators are developed in the case of DPR of beneficiaries.
• No feedback device is given in the portal which is essential to measure the project implementation framework. c) 12th Plan Approach for Emphasizing the MIS
Information Technology (IT) can play an important role in improving governance. With municipal administration becoming increasingly complex, the benefits of IT adoption are becoming more visible across several municipalities. E-governance must be a mandatory reform under the renewed JNNURM and its implementation should be required in all cities receiving assistance under the capacity building component of the Mission. A major constraint in full fledged transition to e-governance is lack of a suitable national level architecture. This has led to States and ULBs independently developing e-governance platforms which are often mutually incompatible. This has also prevented. States from replicating successful architecture developed in other States leading to avoidable expenditure. To address this problem, the Ministry of Urban Development should finalise a suitable national level

42
architecture with sufficient flexibility for customization at the State and ULB level within the first year of the Twelfth Plan. 10) Integrated Child Development Services (ICDS)
a) The Scheme
The ICDS promotes early childhood development, and was launched on 2nd October, 1975 by the Ministry of Women and Child Development, Government of India. Its objectives are to improve the nutritional and health status of the children in the age-group 0-6 years and of pregnant and lactating mothers. The Anganwadi Centres have expanded rapidly after 2007, from 6 lakh in 2007 to nearly 14 lakh in 2011 with the aim to cover all the children in the age group of 0-6 years.
The limitations of the ICDS programme are that, it has an inadequate reach among vulnerable groups, particularly poor tribal households. The other limitation relates to insufficient attention to the nutritional outcomes and health of children in the critical cohort of the age 0-3.
The MIS is in place since its inception, but it is inadequate as an effective tool for improving programme implementation (Adhikari and Bredenkamp, 2009). The MIS formats have been designed with a view to reporting the progress of different functionaries (re-designed in September, 2008). As yet, there is no online computerised MIS developed for the ICDS and Anganwadi Centre is the focal point of delivery of services under the scheme. Therefore, all the data pertaining to the services (six types of records and registers prescribed) and the beneficiaries are captured at this level. The data are collected and maintained by the anganwadi worker (courtyard shelter worker) in different registers from which in turn information is generated in the form of reports. Similarly, at the block, district and state levels, the information is collected, collated and synthesised. At the national level, central project monitoring unit is the repository of the entire data pertaining to ICDS. It consolidates the data received from the states/UTs, analyses it and sends a feedback to all the States/UTs. The data are also analysed to generate information for decision making and guidance to the states.
Monitoring is done through quarterly progress reports (physical and financial), in standardised formats and reviews and monitoring are done at central, state, block and village levels. There is a central level ICDS monitoring unit in the Ministry which is responsible for collection and analysis of the periodic work reports received from the States in the prescribed formats for the following services, namely, supplementary nutrition, pre-school education, immunisation, health check-up and referral services; and nutrition and health education.
Some of the evaluation studies have been conducted by the Programme Evaluation Organisation (PEO), National Council of Applied Economic Research (NCAER) and National Institute of Public Cooperation and Child Development (NIPCCD) in the past. But there is no mechanism in place for result-based monitoring of the ICDS on regular basis. There is a need for preparing analytical progress reports based on the analysis of the key performance-monitoring indicators. Also, there is a need for training to officials at the district and below levels in data analysis, interpretation and its use in programme implementation (Adhikari and Bredenkamp, 2009).
b) Information available on the Portal
The scheme has not yet a computerized system in place to collect the data/information from the local point (Anganwadi Centres). Apart from the physical and financial statements, the locations of the Anganwadi Centres (13 Lakh Anganwadi Centres) in the country are shown. Introduction about the Scheme, Guidelines, A Model Anganwadi Centre, etc. are some other details available in this folder.

43
Table A10: Integrated Child Development Services: Information Available on the Portal
Sl. No. Nature of reports Information covered 1. Data Tables Data Tables folder gives the information on the following:
i) State wise number of inhabited villages in the country as per Census 2001 data
ii) Role and responsibilities of Anganwadi Workers/Helpers. iii) Details of additional honorarium being paid by the
States/UTs over and above that paid by the GOI
2012-2013 i) Release under ICDS(SNP) IInd Installment ii) Release under ICDS(SNP) for 2012-13 iii) Released under ICDS(G)&SNP (1st Installment) During
2012-2013 2011-2012
i) State wise details of Projects, AWC Beneficiaries, vacancy Position and nutrition Status of Children as on 31.03.2012
ii) Released under SNP during 2011-12 iii) Released under ICDS(Gen) during 2011-12 iv) ICDS : Release of Grants-in-Aid to the States during 2011-
2012 towards GOI's share on supplementary nutrition - 1st Instalment regarding as on date : 12.05.2011
Similar type of information is available for the year up to 2005-06. 2. Location of Anganwadi Centres The folder gives complete details about the location of the Anganwadi
Centres in the country by state wise except for States, Chhattisgarh, Jammu & Kashmir, Jharkhand and Sikkim, Chandigarh and Dadra & Nagar Haveli.
3. MIS Folder The MIS for ICDS gives only the Guidelines and related information and there is no statistical input in this folder on MIS. Apart from the basic Census data, 2001 and the guidelines, the data tables section provides the data and sanction related information for the years 2005-06 to 2012-13. Majority of data is on the release of funds and Supplement Nutrition Programme (SNP)
There is sub-folder on Revised MIS which gives more guidelines and general information rather than the reports and data.
1. Pilot Testing of Revised MIS (July - Dec 2010) 2. Translation Workshops (Sep 2011) 3. Introduction and Roll out of the Revised Management
Information System (MIS) in ICDS Programme – Guidelines(28 March 2012)
4. AWC Register Formats (English) 5. Report Formats (English) 6. Print Specification for AWC Registers 7. Index of the revised AWC Register Formats and Tools for
AWWs 8. Letter to States - Release of State Specific Formats 9. Letter to States regarding guidelines for Induction Training on
Revised MIS (28 Aug 2012) 10. Guidelines for Induction Training on Revised MIS
4. Monitoring and Supervision This folder on Monitoring and Supervision is missing the monitoring reports. It gives the Guidelines to visit the Anganwadi Centres, Composition of Monitoring Committees at National. State, District, Block and Anganwadi Centre Levels.

44
The scheme has not yet a computerized system in place to collect the data/information from the local point (Anganwadi Centres). Apart from the physical and financial statements, the locations of the Anganwadi Centres (13 Lakh Anganwadi Centres) in the country are shown. Introduction about the Scheme, Guidelines, A Model Anganwadi Centre, etc. are some other details available in this folder.
No online system is in place for data collection for the scheme. The Ministry has finalized all the components and variables for online data collection and the software programmes are developed by NIC. The software is under checking for a systematic implementation. After the verification of the software on its applicability to collect the required information, it will be introduced.
The ministry is the predominant user of the data for own review and sanctioning of release of grants purposes. The data are also shared with the international sponsors of the scheme (World Bank and UNICEF). Planning Commission asks for some of the details of the scheme for planning purposes. Non-governmental organization and other voluntary agencies are also frequently using the data. As the implementing agency is Anganwadi Centre, all the records and registers are prepared in the local/regional languages only. But, general public can collect the information from the website only.
There is supervising/monitoring mechanism at all levels. In every Circle (the lowest level below the Block) consisting of few Gram Panchayats, there is one supervisor to monitor the implementation process of the scheme. These officials are responsible for the information provided by the Anganwadi Centres under his/her control.
The Block Level Officer is responsible for the entire block level data and the district coordinator is responsible for the district data as a whole. At state level, the whole data for the state are supposed to be checked, and then, these are forwarded to the headquarters. We were told in our discussion with the Ministry officials that, at every stage the data are checked for consistency and reliability.
The MIS for ICDS gives only the Guidelines and related information and there is no statistical input in this folder on MIS. Apart from the basic Census data, 2001 and the guidelines, the data tables section provides the data and sanction related information for the years 2005-06 to 2011-12 (up to May, 2011). Majority of data is on the release of funds and Supplement Nutrition Programme (SNP).
No online system is in place for data collection for the scheme. The Ministry has finalized all the components and variables for online data collection and the software programmes are developed by NIC. The software is under checking for systematic implementation. After the verification of the software on its applicability to collect the required information, it will be introduced.
The ministry is the predominant user of the data for own review and sanctioning of release of grants purposes. The data are also shared with the international sponsors of the scheme (World Bank and UNICEF). Planning Commission asks for some of the details of the scheme for planning purposes. Non-governmental organization and other voluntary agencies are also frequently using the data. As the implementing agency is Anganwadi Centre, all the records and registers are prepared in the local/regional languages only. But, general public can collect the information from the website only.
There is supervising/monitoring mechanism at all levels. In every Circle (the lowest level below the Block) consisting of few Gram Panchayats, there is one supervisor to monitor the implementation process of the scheme. These officials are responsible for the information provided by the Anganwadi Centres under his/her control. The Block Level Officer is responsible for the entire block level data and the district coordinator is responsible for the district data as a whole. At state level, the whole data for the state are supposed to be checked, and then, these are

45
forwarded to the headquarters. We were told in our discussion with the Ministry officials that, at every stage the data are checked for consistency and reliability.
c) Observations on MIS
Some of the observations on the MIS structure for the scheme are presented below: • The information about the scheme, especially on physical targets and achievements and release of funds are
given in the portal. Data formats do not help in checking the consistency as the data were presented separately for quarterly and annually. One-point data are given in a particular year or report that makes it difficult to report the progress over time.
• No uniform pattern is followed for the presentation of data under the scheme.
• The given information is not available by social groups. Only the overall state-wise information is available in the portal.
• The information provided does not help much to track the progress of the scheme.
• No institutional mechanism is in place in order to know the links between the progress made and the
financial allocation. • There is neither any feedback device available in the portal, nor is any evaluation report placed in order to
know the effectiveness of the scheme or the results. • No data are available for PMO’s DMU section.
• The MIS programme mainly tracks inputs, some of the intermediary processes and limited outputs, rather
than nutrition outcomes such as indicators of appropriate infant care and feeding behaviours. (Adhikari and Bredenkamp, 2009). The divergence in ICDS and NFHS findings poses something of a puzzle that needs to be looked at and a mechanism should be evolved for data authentication and validation. d) 12th Plan Approach for Emphasizing the MIS
The MIS of ICDS would be revamped to focus on real-time data for assessment, analysis and action, closest to the level at which data is generated, using Information Communication Technology (ICT) and the reach of mobile telephones. The use of Mother and Child Protection Cards for the monitoring and promotion of young child growth and development is critical, with transparent community validation at Village Health and Nutrition Days and community owned accreditation processes, with the active involvement of VHSNCs and women’s/community groups. It needs to be reiterated that the perceived. It needs to be reiterated that the perceived increase in the reported percentage of severely undernourished children in programme data reflects the change in the standards/classifications used rather than deterioration in the situation of children. The change to WHO child growth standards from the NCHS standards used by earlier NFHS/other surveys and from the Harvard Standards (IAP Classification) used by ICDS earlier has also enabled both harmonization and updating standards used across different systems. The refrain that ICDS figures do not match NFHS data needs to be understood in the perspective of the different growth standards/classifications used before this updating and harmonisation process.
46
11) Mid-Day Meal Scheme (MDMS)
a) The Scheme
The MDMS, world’s largest school-children feeding programme, was launched by the Ministry of Human Resource Development (Department of School Education and Literacy) in 1995, which is aimed at boosting universalisation of primary education and is expected to attract enrolment, attendance, retention and reduction of the drop-out rates, simultaneously improving the nutritional levels among children. The scheme is spread over 1.2 million schools covering over 120 million children in the country and collecting information on time. The Ministry based in its reports says that, as a result of MDMS there has been a remarkable improvement in the attendance and retention of the children in schools.
No MIS has been developed for the scheme separately, but it is under trial for implementation. However, the mechanism for monitoring and supervision of MDMS has been in place which includes local level monitoring, display of information under Right to Information Act and inspection by the state government officials, periodic returns etc. (www.education.nic.in). Despite the fact that the scheme is 17-year old, there is still no MIS nation-wide, although a very innovative MIS is in place in Uttar Pradesh, the only state that started MIS during the 11th plan.
There are two review committees at the national and state level and over a dozen social science research institutions that are monitoring the scheme. These institutions bring out monitoring reports based on 5 per cent sample basis. But there is no online monitoring mechanism. The scheme largely relies on inspection as a principal monitoring instrument which primarily focuses on inputs and activities rather than deliverables.
b) Information available on the Portal
The National Programme of Nutritional Support to Primary Education was launched as a centrally sponsored scheme on 15th August, 1995. However, data are presented only for last two years (2008-9 and 2009-10). Information for the first quarter, 2009-10 (April-January) is available only for 14 states. Even quarterly information for the last quarter (January-March) for the year 2008-09 is not available for all the states. Nevertheless, the scheme has followed innovative method of collecting daily data from schools using interactive voice response system (IVRS) in Uttar Pradesh State. This method is gaining popularity and being replicated in other states as well. Information is also planned to be collected through block resource persons with a view to having disaggregated information.
It is planned to have the Mid Day Meals Index (MDMI) for the states/schools in the lines of human
development index (HDI). At present, the scheme has wide coverage – 12 crore children, 12.65 lakh schools, 24 lakh staff (cook cum helpers) and 5.77 lakh kitchen cum store-rooms. At present, a system is in place to gather all the important data in a systematic manner. Apart from the physical and monitoring information, there are a few other details in the new portal of the scheme. Details of the review missions of the scheme and its objectives, reports, constitution of the sub-group for the scheme, and minutes of the meetings are given.
In general, the MIS is a management tool. Ministry is the predominant user of the data for own review and
sanctioning of release of grants. Sometimes the data are used by other ministries also.

47
Table A11: The School Mid-Day Meal Programme: Information available on the portal
c) Status of Information System under MDMS
This scheme is unique in that, there is involvement of multiple stakeholders who work on daily basis for successful implementation of the scheme. Obviously, this requires planning, logistics and controls; so that there are streamlined processes of information collection. Most of the information flow involved in the planning for MDMS is done on paper manually. This involves the requisition and allocation of food grains. The nature of daily reporting also is mostly manual and involves paperwork and compilation of data from various sources. The daily reporting on the implementation of the scheme is also done manually.
The challenges in the currently used systems are as follows: • The collection of information pertaining to planning and procurement manually is prone to inconsistency
such as repetition of data entry, reconciliation and delay in the processing of the documents. • There is a significant time-lag in getting the data of a school at the state level leaving a scope for data
manipulation/distortion at a later time. • Reports are not available for parameters like number of schools where no meals were provided with reasons
thereof, number of schools where only a small percentage of enrolled students are getting mid day meals, etc.
• Physical Inspections are being done on a random basis. The objective of inspections could be served better through timely submission of reports with information thereon.
Sl. No. Nature of reports Information covered 1. Guidelines Provides information on various components of the scheme 2. Physical Progress The Section gives information on release of non-recurring central
assistance and some of the latest sanctioned orders and the provisions to Sates. It does not bring any all India report on the progress of the scheme.
3. Community Participation This section illustrates some of the invention of the programme managers to empower mothers of the children covered under the programme to supervise the preparation and serving of the meal and to exercise an effective vigil
4. School Health Programme Guideline, Information about School health programs, and the No. of Students covered under SHP were given in this folder
5. Nutritional Support This section deals with the goals and objectives of the scheme on Universalisation of Elementary Education, details on Cooked mid-day meals and nutritional contents are placed on this folder..
6. Field Visit/Inspections A detail of field visits done by the officials from MHRD is placed in this section.
7. Monitoring Institutions (MI) Reports
List of Monitoring Institutions and its reports are placed in this folder.
8. Research Studies Administrative details research studies and details of the programme evaluation organization (PEO) of the planning commission and their study report is placed in this folder.
9. Innovative Practice An innovative practice introduced by some of the states in the strategy of the implementation of the scheme is in the folder.
10. Delivery Monitoring Unit (DMU)
The DMU section gives Review Report for three periods of the year; as on 30-4-2011, 30-06-2011 and 30-08-2011.

48
• Obviously, a programme of this size, magnitude and complexity that touches the lives of millions across the country needs an efficient ICT based intervention for better monitoring and implementation.
Reporting the consumption of foodgrains and delivery of MDM scheme is a daily exercise which involves more than 12.63 lakhs schools. The challenge is compounded by the fact that the computerization in the schools is inadequate. The key steps which are currently taken are as follows:
• MDM attendance register has been kept at the School Level. The Head Master/Authorized Teacher would fill up the number of students getting the Mid Day Meal everyday in the register.
• The data provided by the schools are compiled at Block level and further at District level. • The district office submits the district-wise data to the state level MDM Directorate of respective state. • In some of the states, Nodal Agencies for Mid Day Meal Programme have deployed monitoring system in
different ways using wide range of technologies which is not available in a unique format for the central government.
Finally, an MIS is being planned for the mid day meal scheme. The MIS will be part of a National Portal on MDMS with open access for all. The MIS aims at building a web-based application for the automation of MDMS to plan for allocation of grains to the schools and to keep track of the fund allocation, fund utilization, monitoring of regularity in meal serving and utilization, quality of meals served, foodgrains delivery and utilization, cooking-cost utilization and infrastructure like kitchen shade etc.
Mobile SMS & IVRS are planned to be used for collection of data. Given the low level of computerization
in the schools covered under this Scheme, it is proposed to use the latest mobile technology available in capturing the data at various levels for monitoring the MDM Scheme. Some States have already implemented data capturing through mobile SMS for collecting very basic information i.e. foodgrains lifting details and send alert through email or SMS on different points of time during the monitoring of critical indicators.
In order to implement this at national level, a cloud telephony based IVRS linked Integrated Information
System (IIS) for MDMS can be created to capture the information across 12 lakh schools (approximately) in India within a span of 3 hours on daily basis and publish the analysis reports on internet and on fax in real time basis at all the State/Districts/Block level offices. This information can be shared through SMS as well as social media interfaces.
d) Observation on MIS
Some of the pointers for assessment bring about the following observations:
• No MIS has been developed for the scheme even after the existence of this scheme for quite a long time. Without a comprehensive MIS, monitoring of the scheme becomes somewhat difficult.
• The information is available for fewer states for the year 2011-12 and majority of the states have not yet
submitted their last quarter reports for the year 2010-11. No information is available beyond the state levels and even no consolidated all-India report is available.
• Normally, monthly statement should be submitted by the district level officials to the states and states in turn are required to compile it and forward it to the Central Ministry.
• The information also does not provide disaggregation by gender and social groups. • Some linkages between provision of mid-day meals and enrolments and dropouts may also be included in
report format in order to determine whether the programme is performing according to plan and budgets.

49
• There is no feedback devise under the scheme which is essential to improve the design for effective implementation of any scheme/programme.
• Enrolments data are presented for one point of time and it would be worthwhile to add for more years in order to make the comparison over time.
e) 12th Plan Approach for Emphasizing the MIS There are several concerns in implementation of the MDMS, namely, wide variations in enrolment, attendance and actual coverage of children, mismatch of foodgrains and cash fund utilisation, lack of controls over the quantity and quality of meals, irregular and uncertain supply of meals, and poor quality of grains in certain States. In order to address these concerns, the monitoring system under MDMS would be made more effective during the Twelfth Plan. An MIS portal for monitoring of the scheme has already been launched. All the States/UTs are now feeding data into the portal and annual data for 2.7 lakh schools have already been fed into the portal. The MIS would be integrated with Interactive Voice Response System to capture the information on daily basis and monitor the Scheme on real time basis. The MIS would enable the States/UTs and Central Government to plan the visits to the poorly performing area of the respective States. It will also be used as a mechanism for social audit as the data fed into the system through the IVRS would also be sent back to SMC members for verification. This will enhance transparency and accountability in the implementation of the MDMS and enhance the overall effectiveness of the Scheme. Such independent evaluations would be strengthened during the Twelfth Plan. 12) Rural Telephony
a) The Scheme
Telecommunication connectivity constitutes an important part of the effort to upgrade the rural infrastructure and it is important to improve the tele-density in rural areas. It aims at achieving 40 per cent rural tele-densities by 2014 and ensures broadband connectivity to all panchayats by setting up India Building Service Centre, Bharat Nirman Seva Kendras at Panchayat levels by 2012. The Department of Telecommunication in the Ministry of Communications and Information Technology has the responsibility of providing telephone connectivity to the villages that remain to be covered (www.bharatnirman.gov.in). The Central Government provides village public telephones in the uncovered villages through subsidy support provided by universal service obligation fund (USOF).
The target of the scheme is that, under the Bharat Nirman Programme, rural tele-density of at least 40% by 2014, and Broadband coverage of all 2,50,000 village panchayats & Setting up of Bharat Nirman Common Service Centers at Panchayat level, by 2012, will be achieved.
b) Information available on the Portal Annexure I and Annexure II contain only two tables which provide data on rural tele-density and coverage
of Broadband. The data presented in Annexure I for the scheme are almost one-year old which gives information on Rural Tele-density for all states for two point of data, that is, Tele-density as on 31st March , 2011 and Rural Tele-density as on 28th February, 2011. Annexure II gives information on coverage of village panchayats under Bharatnirman II for providing broadband coverage. The data are available for the years, 2009-10, 2010-11 and 2011-12 by target and achievements (www.dot.gov.in).
c) Observation on MIS
There is no online data collection mechanism for the scheme. Whatever information is collected from the field is mainly used by the sponsoring Ministry. Sometimes the data are shared with some other departments

50
(especially with Ministry of Panchayati Raj and Ministry of Rural Development). Information is collected on two aspects only, therefore, there is less chance for inconsistency or miscoding in the data. Each state was assigned some target for each year; this target is fixed in the plan of action prior to the beginning of the financial year.
Some preliminary observations are reported as under:
• There is no MIS for the programme even though the programme was initiated in 2005, and without MIS it becomes extremely difficult to monitor the programme effectively.
• Very little data are available on the website (2 tables under DMU report). That too is highly aggregated and not beyond state/circle levels.
• There is no provision for online data submission and data are provided by service provider. State-owned Bharat Sanchar Nigam Limited (BSNL) is the largest service provider for telephones and broad-band connectivity. The BSNL is the only provider of data.
• Data forwarding authority (at state level) have to self-certify the validity of data. Controller of Communication Accounts (CCA) also cross-checks the service on sample basis and conducts monthly or quarterly review of the progress of the work performance etc.
• Latest information on rural tele-density is provided till February 2011. But the information is insufficient to make any kind of analysis. Disaggregated information on a number of revenue villages are provided with village public telephone (VPT), remotely located villages provided with VPTs through digital satellite phone terminals. Broadband coverage would have been useful to make any definitive analysis across districts and states.
• Similarly, targets and achievements should have been presented at disaggregated levels.
• The DMU report gives only broadband coverage (up to March, 2011) and not VPTs year-wise.
• A comprehensive MIS detailing activity and outputs is warranted 13) Irrigation
a) The Scheme
The scheme is being implemented by the Ministry of Water Resources in collaboration with State Governments for creation of additional irrigation capacity. There is a huge gap between irrigation potential created and the potential utilised. There are considerable areas in the country with un-utilised groundwater resources. As part of the scheme, 4.2 million hectare is planned to be created by expeditiously completing such on-going major and medium projects; one million hectare through implementation of extension, renovation and modernisation of schemes along with command area development and water management practices; 2.8 million hectare through groundwater development; one million hectare by way of minor irrigation schemes using surface flow; and one million hectare is also planned by way of repair, renovation and restoration of water-bodies and extension, renovation and modernisation of minor irrigation schemes (www.bharatnirman.gov.in). The Management Information is placed in the web portal http://mowr.gov.in.
b) Information available on the Portal
The scheme does not have an MIS or online data-entry mechanism so far. Only physical target and achievements alone are given on the portal. Very few details on the physical progress and achievements and monitoring information are being gathered from the implementing agency through hard copy in a prescribed format.

51
Information is placed for 5 different components in the portal, of which, two components are on Major & Medium Irrigation and Minor Irrigation; while for the remaining three components the folder gives only partial data/information. In the Targets folder, the overall targets and state-wise targets from 2005-06 in cumulative form are given. The scheme on Accelerated Irrigation Benefit Programme and its details are explained in the Schemes folder. In Achievements folder DMU-PMO report, Cumulative Achievements from the year 2005-2009 and achievement for the same period by year-wise are provided. Every state is supposed to submit their QPR either in soft or hard copy to the Ministry within 15 days of the quarter ending in a given format. As far as states’ response in this regards is concerned, very few are submitting QPR on time.
c) Observation on MIS
No online system is in place for data collection. Only the ministry is the predominant user of the data for own review and sanctioning and release of grants. Every state’s approval of annual plans is done by the sponsoring ministry at the headquarters. Therefore, the ministry knows the range of data one state can show as their progress or achievements. On that basis, a check is done at headquarters. Through the monitoring of data the inconsistency is checked and if any visible inconsistency is found, then concerned states are asked to rectify the data. During the review meeting organized at headquarters, each state’s information are put to double-check before approval/sanctioning of funds.
Some of the initial observations on the above programme are as follows:
• No MIS has been developed for the Irrigation component of Bharat Nirman. However, information on achievement is given till 2011-12. Even that information is not complete for all the states and in some cases either the information is not reported or partially reported. There is divergence in the presentation of data and updating of data. The web portal gives DMU data for the year 2009-10, 2010-11 and 2012-13 as cumulative The DMU format suggests that a quarterly report must be submitted, but surprisingly, achievements by the ministry are given for 2009-10 and 2010-11, that is for the entire year.
• The information regarding achievement is given as reported by the state governments, but it is not clear whether or not the information is validated at the level of Ministry.
• No formats for data collection are provided either on-line or otherwise without which it becomes extremely difficult to make any observation and track the monitoring.
• No feedback mechanism exists from the major stakeholders’ point of view.
d) 12th Plan Approach for Emphasizing the MIS
Collection of data is fragmented between different agencies. The agencies responsible for collection of the ‘physical data’ (to use precipitation and stream gauging as examples) are administered by differing Ministries, while the user data come under such diverse classifications as public health and sanitation, irrigation and urban planning. There is a consequential absence of a coherent and internally consistent conceptual framework and protocols for data collection and validation. The fact that ‘water’ is a ‘State’ subject leaves the Central Government agencies that are responsible for the national data with little choice but to rely on the State agencies for such data. Agencies of the Central Government – India Meteorological Department (IMD), Central Water Commission (CWC), (CGWB), Central Pollution Control Board (CPCB)—do collect a considerable amount of data, but most of the information at the regional and project levels is
52
collected by the State agencies. As a result, much of the data are not readily accessible even within and between Government agencies concerned with water resources development, leave aside in the public domain.
Data improvement is a national effort of the Central and the State government agencies that requires active involvement of specialised government agencies and scholars in universities, research institutions and non-governmental organisations in a way that fragmentation of focus and effort is minimised. This calls for a common agreed framework of concepts. It is, therefore, suggested by the Working Group that the Central Government take the lead in creating appropriate institutional arrangements to ensure independent and professional conduct of the surveys, providing financial and technical support to the States and ensuring that all agencies follow prescribed protocols and transmit the data to the central pool. For this purpose, the Working Group suggests the constitution of a Steering Committee chaired by Member (Water Resources), Planning Commission, with knowledgeable and reputed experts on water related issues from relevant disciplines within and outside government to work out: the strategy, modalities and funding for building a comprehensive, technical and scientific database on potential and utilisable water from different sources; details of the scope, content, methodology and mechanisms of the surveys to assess performance and impact of programmes through sample surveys of users and specific projects; and the design of an integrated and digitised National Water Resources Information System (NWRIS) by suitably expanding, reorganising and equipping the existing WRIS in the CWC.

53
References Adhikari, Saroj K. and Caryn Bredenkamp (2009), Moving Towards an Outcomes-Oriented Approach to Nutrition Program Monitoring: The India ICDS Program, Discussion Paper, Health, Nutrition and Population, The World Bank. Ambasta, Pramathesh (2009), Programming NREGS to Succeed, The Hindu, October, 30. Bajpai, Nirupam, Jeffrey D. Sachs and Ravindra H. Dholakia (2009), Mid-term Evaluation of the National Rural Health Mission, CGSD Working Paper No. 37, Center on Globalization and Sustainable Development, The Earth Institute at Columbia University. Banerjee, Abhijit and Esther Duflo (2011), ‘Poor Economics: A Radical Rethinking of the Way to Fight Global Poverty’, publicaffairs, Jackson, TN. Bhatnagar, S. C. and N. R. Patel (1988), Decentralized Computing for Rural Development, OMEGA, 16 (2), pp. 165-170. Bodavala, Ranganayakulu and Takemi (2000) ‘Evaluation of Health Management Information System in India’, Working Paper RP 176, Harvard School of Public Health, Boston, USA. Comptroller and Auditor General (2007), Draft Performance Audit of Implementation of NREGA, Office of the Principal Director of Audit, Economic and Service Ministries, New Delhi. Davis. G. (1974), Management Information Systems: Conceptual Foundations, Structure and Development, New York, Mc Graw-hill Inc. Drèze, Jean and Christian Oldiges (2007), How is NREGA Doing?, Employment Guarantee Act: Key Documents, November. Drèze, Jean (2008), Employment Guarantee: Beyond Propaganda, The Hindu, January 11. Gertler, P. et al. (2011), Impact Evaluation in Practice’, The World Bank Gragnolati, M., M. Shekar, M. Das Gupta, C. Bredenkamp and Y. Lee (2006), India’s Undernourished Children: A Call for Reform and Action, HNP Discussion Paper, Washington DC: World Bank. GoI (2008), Ecomonic Survey 2007-08, Ministry of Finance, Government of India. GoI (2010), ‘Results Framework Document’ Performance Management, Cabinet Secretariat’, New Delhi. GoI (2011), ‘Report of the Sub-group on Mid Meals Scheme for the 12th Five Year Plan, Ministry of Human Resource Development, New Delhi. Gupta, M.P. (1996), ‘Management Information System at National Level in India: Analysis of Problems and Issues’, Vikalpa, Vol. 21, No. 3 pp 3-15 Kurian, S. N. J. and S. D. Gupta (1989), Computerized Rural Development Network at the District Level in India, in Applications of IT for Decentralized Development, February 25 to March 4, Islamabad. Kusek, Jody Zall and C. Rist Ray (2004), Ten Steps to a Result-based Monitoring and Evaluation System, The World Bank, DC. Lucas, H. C., Jr. (1990), Information systems concepts for management, New York: McGraw-Hill.

54
Morra Imas G., Linda and Ray C. Rist (2009), The Road to Results: Designing and Conducting Effective Development Evaluations, The World Bank. Nigam, Archana and Dipankar Sengupta (2009), Development of a Management Information & Decision Support System for Plan Schemes, quoted from Second Administrative Reforms Commission, Fourteenth Report on Strengthening Financial Management Systems. Organisation for Economic Co-operation and Development (OECD, 1991), DAC Principles for Evaluation of Development Assistance, Paris. Planning Commission, Government of India (2008), Eleventh Five Year Plan (2007-12), Vol. I, Chapter 3. Planning Commission, Government of India (2010), Midterm Appraisal of the Eleventh Five Year Plan (2007-12). Planning Commission, Government of India (2012), Twelfth Five Year Plan (2012–2017) Documents, Programme Evaluation Organisation (PEO), Planning Commission (2009), Monitoring Information System (MIS) of Major Schemes, September. Planning Commission, Government of India (2011), Report of the Committee on Restructuring of Centrally Sponsored Schemes (CSS). Shah, Mihir (2008), Governance Reform Key to NREGA Success, The Hindu, March14. Websites: www.bharatnirman.gov.in; accessed during October, 2011 www.dise.in; accessed during November, 2011 www.ddws.nic.in; accessed during November, 2011 www.education.nic.in; accessed during December, 2011 www.indiawater.gov.in; accessed during November, 2011 www.jnnurm.nic.in; accessed during January, 2012 www.mohfw.nic.in; accessed during December, 2012 www.nrega.nic.in; accessed during September, 2011 www.pmgsy.nic.in; accessed during October, 2011 www.rggvy.gov.in; accessed during December, 2011

INSTITUTE OF APPLIED MANPOWER RESEARCHCity Office: 53, Lodhi Estate, New Delhi-110 003
Phone: +91 (0) 11 24697081; 24697082Fax: +91 (0) 11 2778 3467
Web: http://iamrindia.gov.in E-mail: [email protected]
Phone: + 91 (0) 11 27787215/6/7Fax: +91(0) 11 27783467
Web: http://iamrindia.gov.in E-mail: [email protected]
Campus: Sector A-7, Narela Institutional Area, Delhi-110 040