management by measurement. 2009 business by the numbers series monthly webinars geared toward...
TRANSCRIPT

Management by MeasurementManagement by Measurement

2009 BUSINESS BY THE NUMBERS SERIES
Monthly Webinars geared toward helping businesses succeed in the new economy
COST: ~Bassett clients FREE ~Monthly subscription @ $29/month or
$275/year
JOIN OUR Online MEETUP GROUP for announcements and instructions

Today’s AgendaToday’s Agenda Financial Statements Using Your Accounting Software
as a Management Tool Financial Ratios Key Performance Indicators
(KPIs) Your “Smart Number”

Financial StatementsFinancial Statements
Balance Sheet Income Statement (P&L) Cash Flow Statement

Understanding Financials Gross Revenue Gross Profit NET Profit
WHAT ARE YOUR REAL COST OF GOOD SOLD? (COGS)
Service Businesses - PRIME COSTS
PRIME COST TRACKER
EXAMPLES: Before & After

Balance SheetBalance Sheet Snapshot of what you own and
what you owe.
Assets = Liabilities + Net Worth

CURRENT ASSETSCash 191,617$ Accounts Receivable 385,349 Inventory 297,000 Prepaid Taxes 43,474 Total Current Assets 917,440
FIXED ASSETS, NET 117,190
OTHER ASSETS, NET 139,992
TOTAL ASSETS 1,174,622$
CURRENT LIABILITIESAccounts Payable 210,239$ Accrued Expenses 8,909 Total Current Liabilities 219,148
LONG-TERM LIABILITIESShareholder Loan 273,940 Total Long-term Liabilities 273,940
Total Liabilities 493,088
STOCKHOLDER'S EQUITYCommon Stock 20,000 Retained Earnings 661,534 Total Stockholder's Equity 681,534
Total Liabilities & Stockholder's Equity 1,174,622$
FOR THE YEAR ENDED DECEMBER 31, 2007
LIABILITIES AND STOCKHOLDER'S EQUITY
ASSETS
BANNER CORPORATIONBALANCE SHEET

Income StatementIncome Statement Shows revenues (sales) and
expenses over a period of time.
Important to focus on Gross Profit and Margins (not just net income).

SALES 2,632,499$
COST OF SALESMaterials 1,397,634 Direct Labor 195,096 Other 126,524
TOTAL COST OF SALES 1,719,254
GROSS PROFIT 913,245
EXPENSESAdvertising 39,726 Amortization 17,797 Auto and truck expense 9,745 Depreciation 99,503 Dues and subscriptions 1,491 Insurance 23,568 Interest 79,953 Miscellaneous 11,332 Office Expense 23,919 Professional fees 7,653 Property Taxes and Licenses 5,077 Rent 108,000 Repairs and maintenance 52,772 Salaries, Benefits & Payroll Taxes 340,762 Telephone 6,666 Travel and entertainment 19,296
OPERATING EXPENSES 847,260
OTHER INCOME 38 INCOME BEFORE INCOME TAXES 66,023
INCOME TAXESFederal 17,460 State 7,008 NET INCOME 41,555$
BANNER CORPORATION
FOR THE YEAR ENDED DECEMBER 31, 2007INCOME STATEMENT

Income StatementIncome Statement Cost of Goods Sold (COGS) = all
direct costs of providing a product or service.
Gross Profit = Sales – COGS Gross Profit % = Gross Profit /
Sales Breakeven = Fixed Costs / GP%

Cash Flow StatementCash Flow Statement Most important financial statement
because cash is king!
Measures cash flow from 3 activities Operations Financing Investing

CASH FLOWS FROM OPERATING ACTIVITIES
Net Income 41,555$ Adjustments to reconcile net income to net cash provided by operating activities:
Depreciation 99,503
Amortization 17,797
Increase in accounts receivable (57,247)
Increase in inventory (56,000)
Increase in prepaid taxes (43,475)
Increase in payables 23,492
NET CASH PROVIDED BY OPERATING ACTIVITIES 25,625
CASH FLOWS FROM INVESTING ACTIVITIES
Purchase of fixed assets (19,624)
CASH USED BY INVESTING ACTIVITIES (19,624)
CASH FLOWS FROM FINANCING ACTIVITIES
Borrowing - Shareholder Loan 77,955
CASH PROVIDED BY FINANCING ACTIVITIES 77,955
NET INCREASE IN CASH 83,956
CASH, JANUARY 1, 2007 107,661
CASH, DECEMBER 31, 2007 191,617$
STATEMENT OF CASH FLOWS (INDIRECT METHOD)BANNER CORPORATION
FOR THE YEAR ENDED DECEMBER 31, 2007

CASH FLOWS FROM OPERATING ACTIVITIES
Cash collected from customers 2,506,378$
Interest and dividends received 38
Other operating cash receipts, if any 4,261
Cash paid to employees and other suppliers of goods and services (2,391,672)
Interest paid -
Income taxes paid (91,380)
Other operating cash payments, if any (2,000)
NET CASH PROVIDED BY OPERATING ACTIVITIES 25,625
CASH FLOWS FROM INVESTING ACTIVITIES
Purchase of fixed assets (19,624)
CASH USED BY INVESTING ACTIVITIES (19,624)
CASH FLOWS FROM FINANCING ACTIVITIES
Borrowing - Shareholder Loan 77,955
CASH PROVIDED BY FINANCING ACTIVITIES 77,955
NET INCREASE IN CASH 83,956
CASH, JANUARY 1, 2007 107,661
CASH, DECEMBER 31, 2007 191,617$
STATEMENT OF CASH FLOWS (DIRECT METHOD)BANNER CORPORATION
FOR THE YEAR ENDED DECEMBER 31, 2007

Bad Income and Expense StatementBad Income and Expense Statement
Jan - Dec 07Income
Sales 325,486.71Total Income 325,486.71Cost of Goods Sold
Purchase Discounts 35.63Cost of Goods Sold
Retail Items 1,141.62Folders 1,513.89Supplies
Office Supplies 169.24Printing & Binding 9,238.55Adhesives 827.37Glue 243.81Supplies - Other 47,518.23
Total Supplies 57,997.20
Hazardous Removal Cost 14,724.59Specialists
Fax 32.00Copywriter 5,043.00Specialists - Other 1,121.00
Total Specialists 6,196.00
Editor 15,024.72Total Cost of Goods Sold 96,598.02
Total COGS 96,633.65Gross Profit 228,853.06
ExpenseVehicle Expense 98.62Credit Card Fees 6,679.45Professional Fees 12,760.00Salaries & Wages
Subcontract Labor 3,675.00Salary-Staff Hourly 82,215.38Salary-Officer 15,432.16Salaries-Contract workers 7,684.42Salaries & Wages - Other 2,587.00
Total Salaries & Wages 111,593.96Misc -264.00Major Equipment 20,000.00Contribution 150.00Licenses and Fees 153.47Legal Fees 125.00Loan Payments 5,000.00Accounting and Payroll Services 4,678.14Advertising and promotion
Internet 21.73Classified Ads 174.21Magazine 150.00
ABC Services, LLC
Statement of Income and ExpensesJanuary through December 2007

Bad Income and Expense Statement (cont.)
Bad Income and Expense Statement (cont.)
Brochures/Flyers/Postcards 715.99Other forms of Advertising 51.34Local Advertising 480.00Internet Listing 495.00Phone Book 889.87Advertising and promotion - Other 647.81
Total Advertising and promotion 3,625.95
Amortization Expense 5,212.58Bank Charges 67.54Business Gifts 49.99Computer Support 126.57Depreciation 1,410.10Dues and Subscriptions 312.68Employer Payroll taxes 15,706.00Insurance
Liability Insurance 110.00Business Owners Insurance 75.00Workers Compensation 862.33Insurance - Other 8,217.16
Total Insurance 9,264.49Interest Expense 12,898.77Meals and entertainment 456.21Minor equipment 75.00Office expense
Computer Repair/Maintenance 857.92Toiletries 8.20Ink for Printers/Fax 295.95Paper 81.24Misc. Supplies 136.36Cleaning Supplies 233.96Office expense - Other 4,587.41
Total Office expense 6,201.04Payroll Suspense -13,084.93Postage 563.47Rent 23,621.78Repairs and maintenance 2,110.08Security System 78.15Staff events 141.45Taxes and licenses 591.11Telephone - Phone/Internet/Ads 14,962.87Travel 435.80Uniforms 66.23Utilities
Phone/Internet 514.02Electric 1,075.42
Total Utilities 1,589.44Wages
Contract Workers 0.00Total Wages 0.00
Total Expense 247,457.01Net Income -18,603.95
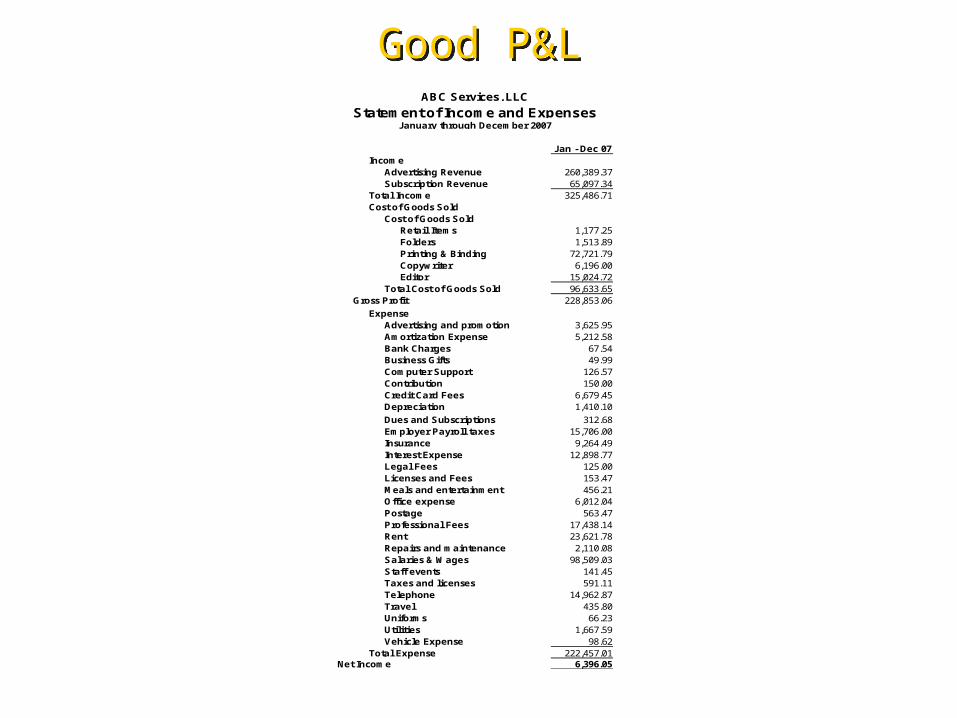
Good P&LGood P&L
Jan - Dec 07Income
Advertising Revenue 260,389.37Subscription Revenue 65,097.34
Total Income 325,486.71Cost of Goods Sold
Cost of Goods SoldRetail Items 1,177.25Folders 1,513.89Printing & Binding 72,721.79Copywriter 6,196.00Editor 15,024.72
Total Cost of Goods Sold 96,633.65Gross Profit 228,853.06
ExpenseAdvertising and promotion 3,625.95Amortization Expense 5,212.58Bank Charges 67.54Business Gifts 49.99Computer Support 126.57Contribution 150.00Credit Card Fees 6,679.45Depreciation 1,410.10
Dues and Subscriptions 312.68Employer Payroll taxes 15,706.00Insurance 9,264.49Interest Expense 12,898.77Legal Fees 125.00Licenses and Fees 153.47Meals and entertainment 456.21Office expense 6,012.04Postage 563.47Professional Fees 17,438.14Rent 23,621.78Repairs and maintenance 2,110.08Salaries & Wages 98,509.03Staff events 141.45Taxes and licenses 591.11Telephone 14,962.87Travel 435.80Uniforms 66.23Utilities 1,667.59Vehicle Expense 98.62
Total Expense 222,457.01Net Income 6,396.05
ABC Services, LLC
Statement of Income and ExpensesJanuary through December 2007

P&L - Current Year Versus Prior YearP&L - Current Year Versus Prior Year
Jan - Mar 07 Jan - Mar 06 $ Change % Change
Ordinary Income/ExpenseIncome 193,205.00 96,700.00 96,505.00 99.8%
Cost of Goods Sold 80,728.02 100,032.86 -19,304.84 -19.3%
Gross Profit 112,476.98 -3,332.86 115,809.84 -3,474.79%
Expense2400 · General and Administrative 40,098.16 34,824.62 5,273.54 15.1%
Total Expense 40,098.16 34,824.62 5,273.54 15.1%
Net Ordinary Income 72,378.82 -38,157.48 110,536.30 289.7%
Net Income 72,378.82 -38,157.48 110,536.30 289.7%
Quality-Built Construction
Profit & Loss Prev Year ComparisonJanuary through March 2007

Important Financial Ratios
1. Gross Profit % (EBIDA) 2. Break Even Analysis –
B/E=FC/GP% IMPORTANT TOWARD GOAL
SETTING Example – BOTTOM UP PLANNING “Paying for Growth”
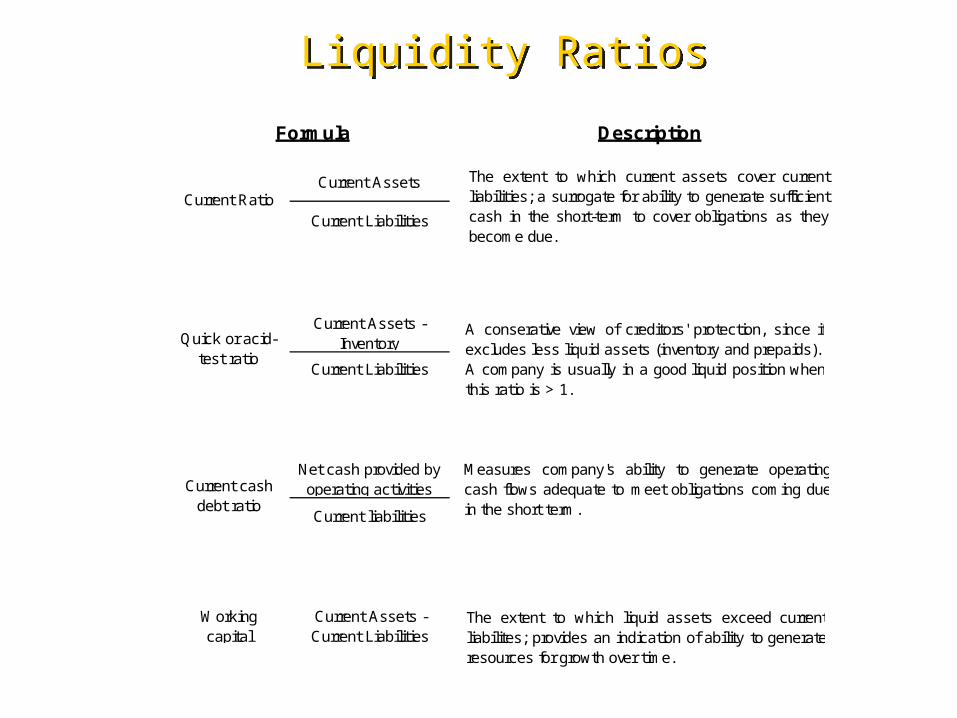
Liquidity RatiosLiquidity Ratios
Current Assets
Current Liabilities
Current Assets - Inventory
Current Liabilities
Net cash provided by operating activities
Current liabilities
Working capital
Current Assets - Current Liabilities
Quick or acid-test ratio
Current cash debt ratio
Formula Description
Current Ratio
The extent to which current assets cover currentliabilities; a surrogate for ability to generate sufficientcash in the short-term to cover obligations as theybecome due.
A conserative view of creditors' protection, since itexcludes less liquid assets (inventory and prepaids).A company is usually in a good liquid position whenthis ratio is > 1.
The extent to which liquid assets exceed currentliabilites; provides an indication of ability to generateresources for growth over time.
Measures company's ability to generate operatingcash flows adequate to meet obligations coming duein the short term.

Profitability RatiosProfitability Ratios
Gross Profit
Net Revenues
Net income
Net sales
Net Income
Average total assets
Net income
Average stockholders' equity
Net income - preferred dividends
Weighted shares outstanding
Cash Dividends
Net income
Gross Profit Ratio
Formula Description
Rate of return on equity
Earnings per share
Payout ratio
Profit Margin on Sales
Rate of return on assets
Measures "the bottom line" as a percentage ofrevenues. Other Income Statement subtotals maybe used as the numberator, such as operatingincome or income before taxes.
Earning performance relative to all resources of thebusiness.
Earnings gernerated per share of stock held byinvestors.
Earning performance relative to resources contributedby stockholders. When use of leverage is effective,this rate exceeds the return on assets.
An indication of control over cost of sales and pricingpolicies.

Solvency RatiosSolvency Ratios
Total Liabilities
Stockholders' Equity
Current Liabilities
Equity
Income before Interest and Taxes
Interest
Current Debt to Equity
Times Interest Earned
DescriptionFormula
Debt to EquityAn indication of the relationship betweenthe owners' and creditors' positions.
Compares current debt maturities toequity. A high ratio may indicate theneed to restructure short-term debt.
An indication of how well the companyis able to cover interest throughearnings.

Efficiency RatiosEfficiency Ratios
Net sales
Average trade receivables (net)
365 Days
Account Receivable Turnover
365 Days
Account Receivable Turnover
Cost of goods sold
Average inventory
365 Days
Inventory Turnover
Cost of Goods Sold
Average Accounts Payable
365 Days
Accounts Payable Turnover
Net sales
Average total assetsAsset turnover
Days' Sales in accounts receivable
Receivables turnover
Accounts payable days outstanding
Accounts Payable Turnover
Days' Sales in Inventory
Days' Sales in accounts receivable
Formula Description
Inventory turnover
The number of times receivable turn into cash peryear.
The number of times the businiess liquidated itsinventory during the period. Can Pinpoin whether toolittle or too much inventory is carried.
Measures the effectiveness of generating sales fromassets.
The average length of time from a sale to cashcollection.
Nubmer of days to pay off A/P on average.
The number of times the company paid off tradepayables during the period.
The average length of time from a sale to cashcollection.
The number of days it takes to sell the inventory.Used in conjunction with the accounts receivablecollection period to determine the operating cycle.

III - PREDICTORS, CRITICAL NUMBERS AND SMART NUMBERS
Historical Financial statements
Predicting cash flow• CRITICAL #s defined• SMART #s defined
•(Rockefeller)

CASH FLOW – LESS STRESS Paying for Growth EXIT Price

PREDICTORS, CRITICAL NUMBERS AND SMART NUMBERS
SMART NUMBERS Non accounting smart numbers

SMART NUMBERS• LEADS/SALES • UTILIZATION• REV/HR• REV/FTE• BACKLOG
EXAMPLES AND WHY

IV. SMART NUMBERS
• Dashboards• Scoreboards• KPI’s• CFO Reports

Why Morale 1. Cash Flow – Less Stress 2. Paying for Growth 3. Exit Price

Game of “Work” Don’t regurgitate P&L
GAME OF WORK WHO IS ACCOUNTABLE?

Reason for Dashboard Reports
STOP managing by assumptions, subjective opinions, emotions and egos.
Allows you to take the pulse of your business consistently & accurately
Provides enough info to take effective action steps
(TRACTION)

MEASURABLES
“What get measured gets done” Accountable people appreciate
numbers Numbers create competition Numbers produce results Numbers create teamwork “My accountant has that
information” is not an excuse (The Knack)

Magic Numbers Keep track of monthly sales & gross margins by hand Everyone assumes “not enough sales” 4 ways to deal with “lack of sales” Raise prices Reduce cost Turn down low margin jobs Find products/services with higher margins
Alexander Sec Story
High gross margins translate into high gross profit ~ main source of cash
(The Knack)

Levers of Control
New Boxes Key numbers ~ Backlog Alexander Powell “If you track sales, you can
get into serious trouble SALES DON’T MAKE A COMPANY SUCCESSFUL PROFITS AND CASH FLOW DO
(The Knack)

PAYING FOR GROWTH Growth doesn’t mean cash flow How to plan for growth BOTTOM LINE POINTS Track monthly

V. Using it Living it Alignment Track progress

Resources Recommended Reading: 4 books Bassett and Associates, PA website
and our new “Insiders” Business by the Numbers” Meetup group
Redline website