malta south wastewater treatment infrastructure …
TRANSCRIPT

Ex post evaluation of major projects supported by the
European Regional Development Fund (ERDF) and Cohesion
Fund between 2000 and 2013
MALTA SOUTH
WASTEWATER TREATMENT
INFRASTRUCTURE
Malta
7 March 2019
2
This report is part of a study carried out by a Team selected by the Evaluation Unit, DG
Regional and Urban Policy, European Commission, through a call for tenders by open
procedure No 2016CE16BAT077.
The consortium selected comprises CSIL – Centre for Industrial Studies (lead partner,
Italy) and Ramboll Management Consulting A/S (Denmark).
The Core Team comprises:
• Scientific Director: Massimo Florio (CSIL and University of Milan);
• Project Manager: Silvia Vignetti (CSIL);
• Scientific Committee: Henrik Andersson, Phoebe Koundouri, Per-Olov Johansson;
• Task managers: Jakob Louis Pedersen (Ramboll), Thomas Neumann (Ramboll),
Chiara Pancotti (CSIL), Xavier Le Den (Ramboll), Silvia Vignetti (CSIL);
• Thematic Experts: Mario Genco (CSIL), Lara Alvarez Rodriguez (Ramboll), Alexander
Greßmann (Ramboll), Trine Stausgaard Munk (Ramboll).
A network of National Correspondents provides the geographical coverage for the field
analysis.
The authors of this report are Matteo Pedralli, Chiara Pancotti and Mario Genco. The
authors are grateful to all the project managers, stakeholders and beneficiaries who
provided data, information and opinions during the field work.
The authors are grateful for the very helpful insights from the EC staff and particularly
to Malgorzata Kicia and Daria Gismondi and other members of the Steering Group. They
also express their gratitude to all stakeholders who agreed to respond to the team’s
questions and contributed to the realisation of the case study. The authors are
responsible for any remaining errors or omissions.
Quotation is authorised as long as the source is acknowledged.
Cover picture source: Managing Authority.
3
TABLE OF CONTENTS
EXECUTIVE SUMMARY .................................................................................... 5
OVERALL APPROACH AND METHODOLOGY .................................................................... 5
MAIN PROJECT FEATURES ...................................................................................... 6
PROJECT PERFORMANCE ....................................................................................... 7
MECHANISMS AND DETERMINANTS ........................................................................... 9
CONCLUSIONS .................................................................................................. 10
1. PROJECT DESCRIPTION .......................................................................... 11
1.1. CONTEXT ............................................................................................... 12
1.2. PROJECT OBJECTIVES................................................................................. 19
1.3. STRUCTURAL FEATURES .............................................................................. 22
2. ORIGIN AND HISTORY ............................................................................ 26
2.1. BACKGROUND ......................................................................................... 26
2.2. FINANCING DECISION AND PROJECT IMPLEMENTATION ........................................... 28
2.3. CURRENT PERFORMANCE AND OTHER INVESTMENT NEEDS ....................................... 28
3. DESCRIPTION OF LONG-TERM EFFECTS .................................................. 35
3.1. KEY FINDINGS ......................................................................................... 35
3.2. EFFECTS RELATED TO ECONOMIC GROWTH ........................................................ 38
3.3. EFFECTS ON QUALITY OF LIFE AND WELL-BEING .................................................. 41
3.4. EFFECTS ON THE ENVIRONMENTAL SUSTAINABILITY .............................................. 43
3.5. EFFECTS RELATED TO DISTRIBUTIONAL ISSUES ................................................... 44
3.6. TIME SCALE AND NATURE OF THE EFFECTS ........................................................ 45
4. MECHANISMS AND DETERMINANTS OF THE OBSERVED PERFORMANCE . 47
4.1. RELATION WITH THE CONTEXT ...................................................................... 47
4.2. SELECTION PROCESS ................................................................................. 48
4.3. PROJECT DESIGN ...................................................................................... 51
4.4. FORECASTING CAPACITY ............................................................................. 52
4.5. PROJECT GOVERNANCE ............................................................................... 53
4.6. MANAGERIAL CAPACITY .............................................................................. 55
4.7. PROJECT BEHAVIOURAL PATTERN ................................................................... 56
5. FINAL ASSESSMENT ............................................................................... 59
5.1. PROJECT RELEVANCE AND COHERENCE ............................................................. 59
5.2. PROJECT EFFECTIVENESS ............................................................................ 59
5.3. PROJECT EFFICIENCY ................................................................................. 60
5.4. EU ADDED VALUE ..................................................................................... 63
5.5. FINAL ASSESSMENT ................................................................................... 64
6. CONCLUSIONS AND LESSONS LEARNED ................................................. 68
ANNEX I. METHODOLOGY OF EVALUATION ................................................... 70
ANNEX II. EX-POST COST-BENEFIT ANALYSIS REPORT ................................ 88
ANNEX III. LIST OF INTERVIEWEES ........................................................... 115
REFERENCES ............................................................................................... 117

4
LIST OF ABBREVIATIONS
BAU Business as usual
BOD₅ Biochemical oxygen demand
CBA Cost-benefit analysis
CF Cohesion Fund
COD Chemical oxygen demand
DG REGIO Directorate-General for Regional and Urban Policy
EC European Commission
EIB European Investment Bank
ERDF European Regional Development Fund
ESIF European Structural and Investment Funds
EU European Union
EUR Euro
GAB Government Agency for Bioresources
GDP Gross Domestic Product
GHG Greenhouse gases
IMF International Monetary Fund
ISPA Instrument for structural policy for pre-accession
NUTS2 Nomenclature of Territorial Units for Statistics
PE Population equivalent
R&D Research and development
ToRs Terms of References
UWWTD Urban Wastewater Treatment Directive (91/271/EC)
WSC Water Services Corporation
WTP Willingness to pay

5
EXECUTIVE SUMMARY
This case study illustrates the story of the Malta South sewage treatment plant,
a major project co-financed by the European Union (EU) during the programming period
2007-2013. More specifically, this is an ex-post evaluation assessing the long-term
effects produced by the investment and aimed at disentangling the mechanisms and
determinants likely to have contributed to produce these effects. The analysis draws on
an ex-post cost-benefit analysis (CBA)1 and an extensive set of qualitative evidence,
both secondary (official reports and press articles, books and research papers) and
primary (site visits and interviews with key stakeholders and experts have been carried
out in November and December 20182).
OVERALL APPROACH AND METHODOLOGY
The Conceptual Framework delivered in the First Intermediate Report has been
developed to answer the evaluation questions included in the ToR, and further specified
and organised in accordance with the study team’s understanding. In particular, there
are three relevant dimensions of the analysis:
• The ‘WHAT’: this relates to the typologies of long-term contributions that can
be observed. The Team classified all the possible effects generated by
environment projects (including management and distribution of water; water
treatment; management of household and industrial waste; measure to preserve
the environment and prevent risks) under the four following categories:
‘Economic growth’; ‘Quality of life and well-being’ (i.e. factors that affect the
social development, the level of social satisfaction, the perceptions of users and
the whole population); ‘Effects related to environmental sustainability’ and
‘Distributional impacts’.
• The ‘WHEN’: this dimension relates to the point in the project’s lifetime at which
the effects materialise for the first time (short-term dimension) and stabilise
(long-term dimension). The proper timing of an evaluation and the role it can
have in relation to the project’s implementation is also discussed here.
• The ‘HOW’: this dimension entails reasoning on the elements, both external and
internal to the project, which have determined the observed causal chain of
effects to take place and influenced the observed project performance. To do this
the Team identified six stylised determinants of projects’ outcomes (relation with
the context; selection process; project design; forecasting capacity; project
governance; managerial capacity). The interplay of such determinants and their
influence on the project’s effects is crucial to understand the project’s final
performance.
1 Data, hypotheses and results are discussed in Annex II. 2 See Annex III for a detailed list of interviewees.

6
The methodology developed to answer the evaluation questions consists of ex-
post Cost Benefit Analysis complemented by qualitative techniques (interviews,
surveys, searches of government and newspaper archives, etc.), combined in such a
way as to produce a project history. CBA is an appropriate analytical approach for
the ex-post evaluation because it can provide quantification and monetisation of some
of the long-term effects produced by the project (at least those also considered in the
ex-ante CBA). However, the most important contribution of the CBA exercise is to
provide a framework of analysis to identify the most crucial aspects of the projects’ ex-
post performance and final outcome. It is worth noting that the purpose of this
evaluation is not to compare ex-ante and ex post CBAs and that the results of these
assessments are not easily comparable, because even if they rely on the same principles
and draw from the established CBA methodology, there are often important differences
between how the ex-ante and ex-post assessments were scoped and what data were
taken into account. Qualitative analysis on the other hand is more focussed on
understanding the determinants and causal chains of the delivery process as well as to
assess effects that may be difficult to translate in monetary terms.
MAIN PROJECT FEATURES
The project is located on the south-eastern coast of Malta. It covered building
a new sewage treatment plant in the village of Xghajra, and connecting it to
the existing sewage system. For this last purpose, works on complementary
infrastructures (pumping stations and a transmission gallery) took place as part of the
project in Xghajra and in the nearby municipalities of Zabbar and Kalkara, together with
the realisation of a new submarine pipeline for the discharge of the treated wastewater
into the sea.
Figure 1. Aerial view of the Malta South sewage treatment infrastructure in Xghajra
Source: Google Maps

7
During the last decade the south of Malta, like the whole country, has been experiencing
a strong demographic growth, combined with a significant economic development.
Numerous infrastructural projects implemented both before and after accession to the
EU in 2004 represent today the structural backbone enabling economic growth. Before
the project implementation the largest part of wastewater produced on the Maltese
islands was discharged untreated to the Mediterranean Sea. In particular, in
2009 76% of total sewage generated in the whole Country was discharged raw through
a submarine outfall to the sea in Wied Ghammieq, near Xghajra. Moreover, this outfall
periodically experienced operational failures due to various reasons, among which wilful
damage. This situation caused high levels of contamination in marine waters
downstream of the Wied Ghammieq outfall, which damaged the coastal
ecosystems and hampered the use of coastal seawater for bathing and other
recreational purposes.
The core of the project under assessment consisted of the new sewage treatment plant
built in the proximity of the site of the old outfall. The project’s primary goal was to
treat wastewater before discharging it into the sea, thereby increasing the
level of sea-coastal water quality, restoring bathing water quality and, in this
way, achieving compliance with EU directives.
The project involved a total initial investment of EUR 68 million in nominal prices (VAT
excluded), which was co-financed by national funds (15%) and by a contribution from
the Cohesion Fund (85%), allocated through Malta’s Operational Programme I –
Investing in Competitiveness for a Better Quality of Life 2007-2013. First project ideas
are dated 1992 and were included in the Sewerage Masterplan for the Maltese Islands
drafted for the Ministry of Development and Infrastructure. After feasibility studies, an
accurate option analysis and project design, construction works lasted from 2008 to
2010. The operational phase started in 2011.
It is worth noting that the construction of the Malta South sewage treatment
plant was the last and the largest part of a wider investment plan, which included
two other new and smaller treatment plants, one in Gozo and one in the north of Malta.
Together, these three infrastructures embodied the idea of a new long-term vision for
sustainable wastewater treatment in Malta.
PROJECT PERFORMANCE
Based on the findings of the analysis, the final assessment of the project performance
is presented hereafter, along a set of evaluation criteria.
Project relevance and coherence:
The project was highly relevant in the context where it was implemented and
matched a real and urgent need. Faced with the challenge of raw wastewater being
discharged into the sea in the south of Malta, the new plant provided a long-term
solution. The project was in line with EU directives in the water sector and directly
addressed priorities established at national and EU level. In particular, the plant was
expected to bring Malta in line with the Urban Wastewater Treatment Directive
91/271/EEC (UWWTD) and the Bathing Water Directive 2006/7/EC (replacing Directive
76/160/EEC). The project also fell under the purpose of the Water Framework Directive
2000/60/EC, particularly in relation to the protection of coastal waters.

8
In terms of internal coherence, the project components were consistent with the
stated objectives. Moreover, the project was in line with the environmental aspects of
the EU Coastal and Marine Strategy, particularly thanks to the introduction of due
sewage treatment and the restoration of seawater quality off Xghajra.
In terms of external coherence, as said, the project was part of a broader strategy
of the national government to provide a sustainable solution to the long-lasting issue
of lacking sewage treatment. Further, it represented the first step to enable the reuse
of the treated sewage effluent in order to solve issues pertaining to the exploitation of
aquifers.
Project effectiveness
The project achieved its main objective of treating all collected wastewater
before discharging it into the sea. However, the effluent is not yet in line with
all the requirements of the above-mentioned EU directives. More specifically, the
effluent is compliant with the Bathing Water Directive (since 2014 all bathing waters
were of excellent quality) but compliance with the requirements of the UWWTD has not
been achieved yet. As acknowledged by the 9th Technical assessment on UWWTD
implementation issued by the EC in 2017, this failed compliance is mainly due to
excessive discharges of farm manure into the treatment systems, and secondarily to
the presence of salt in sewage.
Accordingly, the main benefits produced by the project consist in improved seawater
quality (especially, in terms of pathogens reduction) and a general improvement of
wellbeing for inhabitants living nearby the old Wied Ghammieq outfall. A side effect of
the project has been represented by the production of negative externalities in terms of
emissions from energy use and sludge transport, and by the slight decrease in real
estate value in the immediate proximity to the plant. However, the monetised value of
the benefits outnumbers the negative externalities.
After many years since the start of the new plant’s operational phase, the long-run
contribution of the project translates into a significantly enhanced service of wastewater
treatment. However, some difficulties remain concerning the disposal of generated
sludge and the ongoing, though largely reduced, illegal discharge of farm waste into the
sewers (which constitutes a law enforcement problem, whose solution was beyond the
powers of managers of the project). Moreover, due to the fact that population growth
turned out to be stronger than foreseen by official statistics in 2008, a considerable
challenge will be represented in the future by the appropriateness of the plant’s capacity
to cope with new, increasing demand.
Project efficiency
Against a total initial investment cost of EUR 78 million (in 2018 prices, VAT excluded)
and approximate EUR 6.6 million3 for annual operation and maintenance until the
assumed last year of the project time horizon (2037), the project produces a net
socio-economic contribution to society, measured by the economic net present
value, of EUR 122.7 million.4
3 Present real values at 2018 terms, excluding VAT. 4 The internal rate of return is equal to 12.89% against a benchmark discount rate of 5.64% for the past and
6.80% for the future.

9
Construction works and project costs were in line with the ex-ante forecasts
reported in the project application. However, it should be noted that this comparison
is not very telling, because the project application with updated forecasts were
submitted to the European Commission at a time when construction works were already
at a very advanced stage, i.e. costs were almost certain.
However, construction works were carried out fully in line with the foreseen schedule,
starting in December 2008 and ending in the month of October 2010 as planned. Works
did not encounter major difficulties, nor did they entail changes to the designed project.
Final total costs amounted to EUR 68 million (in nominal terms), with a decrease of EUR
2 million compared to the costs planned ex-ante.
Today, the plant is managed by Water Services Corporation (WSC), which is the
organisation in charge of managing the whole water and wastewater cycle in Malta. As
such, WSC is responsible for guaranteeing the project’s financial sustainability, which is
ensured partially through tariff collection and partially through government subventions,
which are to be phased out within 2032.
EU added value
The most important added value of the EU contribution to the project consisted
in the financial grant covering 85% of the total costs. Without the CF contribution,
the project would not have been possible at the time.
Beyond the financial contribution, technical support provided by Jaspers proved to
be an extremely valuable asset for the project, with particular reference to the
assistance on the ex-ante CBA methodology and the overall presentation of the major
project application.
Finally, the project represented an important step towards the achievement of
EU wide objectives regarding the preservation of the environment and the good status
of bathing waters. As a matter of fact, the plant considerably contributed to Malta’s
compliance with relevant EU directives and today wastewater treatment does not
represent a priority for the country anymore.
MECHANISMS AND DETERMINANTS
The long-run performance of the plant described in the previous sections can be
explained along a series of mechanisms and determinants.
The relation with the context had a positive impact on the project’s
effectiveness. The need for the infrastructure was clear and urgent and no opposition
was publicly expressed against the project’s implementation.
A fully-fledged selection process was carried out, basing on a broad strategic
approach identified by the 1992 Masterplan, on clear selection criteria, and on detailed
technical analysis conducted by specialists.
Project design was positively influenced by a thorough technical analysis of
alternatives and, thanks to the choice of a specific technology allowing flexibility in the
operating phase, in turn impacted in a highly positive way on the plant’s eventual
effectiveness.

10
Project governance proved to be a positive determinant thanks to the
centralised role of WSC in the water sector and its integrated vision. However,
the institutional landscape of public authorities monitoring and regulating the water
sector in Malta is complex and points to the existence of a fragmentation of
competences.
No unexpected technical issues emerged during the project’s operational phase since
2011 and the plant is today providing the service as initially planned. Managerial
capacity is shown by far-sighted choices related to the use of decommissioned
infrastructures, and by investments in research and development. However, the
ongoing exogenous problems of farm waste discharge and sludge landfilling represent
significant challenges to managerial capacity, together with concerns over the long-term
appropriateness of the plant’s treatment capacity.
CONCLUSIONS
Thanks to its high relevance, socio-economic desirability and consistency with needs
and objectives stated at national and EU level, this major project represents a good
example of a project characterised by no major controversies. Project implementation
proceeded overall smoothly and proved to be efficient in the use of public resources.
However, while the project achieved the objective of treating the collected
wastewater before discharging it into the sea, it is featured by a slight under-
performance with respect to expectations. Actually, full compliance with the UWWTD
has not been achieved yet and there are concerns related to the plant capacity.
Contextual aspects, such as the discharge of farm waste into the sewers and the lack of
alternatives to the landfilling of sludge, heavily impacted on the project’s performance.
Further, continuing demographic growth constitutes a variable that may affect the long-
term fitness of the project to its environment.
The story of the Malta South sewage treatment plant illustrates that a project
implemented in response to a well-defined and urgent need can eventually lead to
underperformance with respect to expectations if insufficient measures were taken to
address contextual elements, such as illegal farm waste discharge. Moreover, the
appropriateness of infrastructures in the long run can be influenced by exogenous
elements, such as demographic growth. In this regard, appropriate institutional and
administrative mechanisms to identify long-term challenges and suggest viable
solutions in time should be developed.

11
1. PROJECT DESCRIPTION
The major project “Malta South Wastewater Treatment Infrastructure” (CCI
number: 2007MT161PR001) involved building a new sewage treatment plant in
the south-eastern part of Malta, in the village of Xghajra. In order to connect the
plant to the existing sewage system, the project included also complementary
infrastructures, i.e. pumping stations and a transmission gallery. In addition, a new
submarine pipeline for the discharge of the treated wastewater into the sea was part of
the project as well.
The project was implemented after the construction of two smaller plants on the Maltese
islands, in Gozo and in Malta North, which treated only a little share of the total
wastewater produced. The three plants have allowed Malta to strongly reduce the
discharge of untreated wastewater into the Mediterranean Sea. Among the three, the
Malta South plant treats the largest part (75.6%5) of wastewater produced in the
country.
Figure 2. Location of the three new sewage treatment plants in Malta
Source: CSIL elaboration on Google Maps
Before the new plant was built, raw sewage from Malta South had been discharged into
the sea near Xghajra, causing a visible patch. Wastewater discharge caused
microbiological pollution in the marine environment, leading to bathing bans due to risks
to human health.
The project’s primary objective was to treat all wastewater in Malta South
before discharging it into the sea, thereby allowing Malta to comply with the Urban
Wastewater Directive, the Bathing Water Directive, and the Water Framework Directive.
On a different note, relevant secondary objectives were to enhance the tourism potential
in the area thanks to cleaner seawater and thus to trigger economic development.
A precondition to wastewater treatment before discharge into the sea is the existence
and functioning of a sewerage network connected to all households in the catchment
area. In Malta, only a minor share of households was still not connected to the main
5 In 2017. Data by Managing Authority and Water Services Corporation (WSC).

12
network in 20066, and since then various investments have been implemented to
upgrade the network and serve unconnected households.
The major project was co-funded by the Cohesion Fund in the 2007-2013
programming period, with resources allocated to the Operational Programme I –
Investing in Competitiveness for a Better Quality of Life. The Cohesion Fund contribution
represented 85% of the final total investment cost, which amounts to EUR 68 million in
nominal prices (VAT excluded). After a construction period lasting from 2008 to 2010,
the project has been operational since 2011.
The Planning and Priorities Coordination Division from the Office of the Prime
Minister7 acted in the capacity of Managing Authority, while Water Services
Corporation (WSC), a company entirely owned by the Maltese government and in
charge of supplying water and collecting and treating wastewater, was both the
beneficiary and the implementing body.
This first section of the case study report contains a brief description of the project. The
socio-economic context, the target population, key structural features of the
infrastructure and the service delivered are outlined in the following sections. They
provide an overview of the project background and of its objectives.
1.1. CONTEXT
The project is located in the south-eastern part of Malta. In particular, the new
sewage treatment plant and a submarine pipeline for the discharge of the
treated wastewater into the sea were built in the area of Ta’ Barkat, in the
village of Xghajra. In addition, works on complementary infrastructures (pumping
stations and a transmission gallery to convey sewage to the plant) took place as part of
the project in the municipalities of Zabbar, Kalkara, and Xghajra itself.
6 FAO, 2006. Malta water resources review, p. 44. 7 In March 2013 the Division was moved to the Ministry for Implementation of the Electoral Manifesto, and
today it belongs to the Ministry for European Affairs and Equality.

13
Figure 3. Country subdivision in statistical districts and location of the project
Source: CSIL elaboration on National Statistics Office
As a country, Malta8 has been experiencing a significant growth in both its
population size and its main economic indicators during the last decade. The
Southern part of the country shares this positive general trend.
Resident population in the country boomed from 405,616 in 2007 to an estimate of
475,701 in 20189, with an increase of 17% (see Figure 4), largely due to an influx of
immigrants. Forecasts by the International Monetary Fund (IMF) indicate that population
growth is not likely to reverse during the next years at least until 2023 (the last year
with forecasts available), when it could reach 482,000.
8 The whole country represents a single NUTS 2 territorial unit. 9 Source: Eurostat.
TA’ BARKAT
Gozo and Comino
Northern
Western
South Eastern
Northern Harbour
Southern Harbour
Districts

14
Figure 4. Resident population in Malta (2007-2018)
Source: CSIL elaboration on data by Eurostat
The Gross Domestic Product (GDP) of the country increased from EUR 6 billion in 2005
to EUR 10.1 billion in 2018 (at constant prices). During this timespan, GDP growth
suffered a negative growth only in 2009 (-2.4%), a year of general recession for
European countries, and showed rates as high as 8.2% and 9.5% in 2014 and 2015
respectively. Even though growth is expected to slightly slow down in the next years,
forecasts remain positive until 2023, when they still show +3.2%10 (see Figure 5).
Figure 5. Left: Gross domestic product at 2010 constant prices, 2005-2023 (EUR
billion); right: Gross domestic product at 2010 constant prices, 2005-2023 (percent
change).
Source: CSIL elaboration on data by IMF. Estimates after 2017 (light blue shaded area)
The flourishing economic situation in Malta is witnessed by additional macroeconomic
indicators as well. GDP per capita figures, for instance, show a very positive trend,
increasing from EUR 14,831 in 2005 to EUR 21,616 in 2018 (+46%), with a 2023
forecast of EUR 25,107 (at constant prices), and the unemployment rate has been in
constant decline since 2013, reaching 4.1% in 2018.11
10 Source: IMF. 11 Source: IMF.
360,000
380,000
400,000
420,000
440,000
460,000
480,000
500,000
2007 2008 2009 2010 2011 2012 2013 2014 2015 2016 2017 2018
4
5
6
7
8
9
10
11
12
13
14
-4
-2
0
2
4
6
8
10
12

15
In terms of economic sectors, services accounted for 89% of the GDP composition in
2016, while industry and agriculture covered 10% and 1% respectively.12 Tourism,
electronics and ship building represent the three economic activities with the largest
value of annual output.
The direct contribution of the travel and tourism sector, in particular, corresponded to
14% of the total GDP in 2017, and is forecasted to rise to 17% in 2028.13 Data on
incoming tourists to the island of Malta only (i.e. excluding the smaller islands of Gozo
and Comino), show that in only 12 years, between 2006 and 2017, flows have doubled
(see Figure 6).
Figure 6. Incoming tourists to the island of Malta
Source: CSIL elaboration on data by Malta Tourism Authority
Among the different reasons that can be identified in order to explain the current Maltese
economic boom, one lies in the large-scale investments implemented in the country
during the last decades, which now represent the backbone making growth possible.
In line with the general economic development of the country, the south of Malta
featured large-scale investment projects during the last two decades: the
historic centre of Valletta, for instance, was the target of wide-ranging urban
regeneration works, and a new settlement for economic and industrial activities, called
Smart City, was built on the coast between Rinella and Xghajra, in proximity of the
Rinella film studios (which have attracted several international productions in the past,
such as the movie “Troy”). Furthermore, the area of Sliema and St Julian’s has been
home to noteworthy economic and residential developments.
Part of the funding for crucial investments in the country came from the EU level, first
through pre-accession aid available to Malta for the period 2000-2004, and then through
structural funds following the country’s accession to the EU in May 2004. Acceding the
EU, however, beyond the co-funding of several projects, put Malta on a path towards
the compliance with the body of EU law. In the field of wastewater, three Directives
12 Source: CIA Factbook. 13 Source: World Travel and Tourism Council.
0
500,000
1,000,000
1,500,000
2,000,000
2,500,000
2006 2007 2008 2009 2010 2011 2012 2013 2014 2015 2016 2017

16
were specifically relevant: the Water Framework Directive, the Urban Wastewater
Treatment Directive, and the Bathing Water Directive.
In this framework, wastewater management has been the target of extensive
investments, and the South sewage treatment plant has played a key part in the effort
towards compliance with EU norms.
Box 1 - Relevant EU directives
The Water Framework Directive (2000/60/EC) sets a framework for water resource
management and provides rules to monitor and ensure the quality of water bodies in
the EU member states. The directive includes a discipline on restoration of ecosystems
in and around bodies of water, reduction of pollution, and sustainability of water usage
by individuals and businesses. Under the directive, member states identify all river
basins within their territory and release management plans for each of them, featuring
an economic assessment of water usage. In Malta, the River Basin Management Plan
has been renamed Water Catchment Management Plan and specifically deals with
groundwater, coastal waters and protected inland surface water management issues.
The country’s second and most recent Water Catchment Management Plan was
published in 2015, covering the period until 2021.
The Urban Wastewater Treatment Directive (91/271/EEC) concerns the collection,
treatment and discharge of urban wastewater, and the treatment and discharge of
wastewater from some industrial sectors. In particular, the directive requires EU
member states to ensure that generated wastewater is duly collected and treated. Its
aim is to protect the environment from adverse effects of untreated water. As a matter
of fact, untreated wastewater can be contaminated with harmful bacteria and viruses,
thus representing a risk to public health. If discharged to the sea, untreated sewage can
damage the marine environment due to the nutrients it contains, such as nitrogen and
phosphorous, leading to an excessive growth of algae that hamper other forms of life,
a process known as eutrophication.
The Bathing Water Directive (2006/7/EC, replacing Directive 76/160/EEC) requires
member states to achieve mandatory water quality standards for the protection of
bathers. Water quality specifically refers to microbiological characteristics, whereby two
parameters are measured: Escherichia coli and Intestinal enterococci. The directive has
been transposed into Maltese national law through the Management of Bathing Water
Quality Regulations in 2008. In accordance with it, water quality in coastal bathing areas
around the Maltese islands is regularly monitored and classified following the
requirements of the directive.
Source: Second Water Catchment Management Plan for the Malta Water Catchment District 2015 - 2021
A well-functioning collection, treatment and discharge of wastewater, as a matter of
fact, is crucial for numerous economic activities in Malta, such as agriculture14, tourism,
industries, fishing and aquaculture, and it has multifaceted implications on economic
development, environmental conditions, civil life and human health. Before the three
new plants were put into operation, raw sewage had been discharged to the
sea. The existing network collected wastewater and conveyed it to discharge sites on
14 The farming industry in Malta, and particularly in the south, is characterized by mixed-crop farmers. Farms
are rarely specialized and they produce a wide range of crops, among which strawberries, peaches, oranges, potatoes, onions, tomatoes, marrows and fodder.

17
the coast. In 2004, for instance, only 6.4% of total sewage generated in the country
was treated before discharge. On the southeast coast of Malta, in 2006 raw wastewater
was discharged at an estimated average rate of 33,000 m³/day (about 12 million
m³/year)15. In the areas nearby Xghajra, in particular, the discharge of untreated
wastewater in the sea through a submarine outfall periodically hampered the
possibility to use their coasts for bathing purposes and severely limited their
touristic and economic development.
In order to address these longstanding problems, a Sewerage Masterplan for the
Maltese Islands was drafted already in 1992. This Masterplan, which identified the
need for three new wastewater treatment plants in the country (one in Gozo, one in
Malta North, and one in Malta South), provided the country with a strategic framework
for all investments in the sector.
In line with its recommendations, the Gozo and the Malta North plants were built, and
then inaugurated in 2007 and 2008 respectively. Experiences gathered through these
two projects later represented the stepping stones for the preparation phase of the
largest sewage treatment infrastructure in the country, the one in the south of Malta.
Box 2 - The other two new sewage treatment plants on the Maltese islands
The Gozo sewage treatment plant is located in Ta’ Mgarr ix-Xini, in the vicinity of
Ras Il-Hobz, the site of the main outfall used in the past to discharge raw sewage in
Gozo. Following the 1992 Sewerage Masterplan, studies on alternative options were
carried out in 1994 and 1998. The project was later financed by the EU Pre-Accession
fund under the National Pre-Accession Programme 2003 and it became operational in
November 2007. Its total costs amounted to EUR 7.2 million, of which EUR 3.7 million
provided by the EU grant and EUR 3.5 by the national contribution. Today, the plant has
a capacity of 6,000 m³ of wastewater per day.
Compared to the Gozo plant, the Malta North sewage treatment plant at ic-Cumnija
(near Mellieha) was inaugurated later, in October 2008, and it can treat slightly bigger
volumes of wastewater, i.e. 6,700 m³ per day. It was financed by the Fifth Italian-
Maltese Financial Protocol16 and had a total cost of EUR 9 million. Its project included
the replacement of large parts of the sewerage network and the upgrade of two pumping
stations.
Source: Water Services Corporation
The Malta South plant was designed to serve the sewage treatment needs of four
districts in the island of Malta: the Southern and Northern Harbour districts (coinciding
with the wide Valletta metropolitan area), the South Eastern district and the Western
district, corresponding to a resident population of slightly less than 320,000 in 2007. As
such, the plant was meant to cover the sewage treatment needs of the vast
majority of both the Maltese population and of Malta’s geographic extension,
including its most densely populated areas.
15 FAO, 2006. Malta water resources review, p. 43. Since an Olympic-size swimming pool has a capacity of
2,500 m³ (2,500,000 litres), 33,000 m³ (33,000,000 litres) equal more than 13 Olympic-size swimming pools filled with sewage. 16 Starting in 1979, Italy has provided financial assistance to Malta through grants and loans, in order to
restructure its economy and improve its infrastructural endowment.

18
Figure 7. Resident population in the four areas served by the Malta South sewage
treatment plant
Source: CSIL elaboration on data by National Statistics Office
The evolution of the total resident population in the four districts served by the plant
between 2005 and 2017 (see Figure 7) reveals a significant increase in the total amount
(+15%, corresponding to 47,609 inhabitants). However, the four districts show different
patterns of growth. The largest increase is experienced by the Northern Harbour district
(featuring, among others, the towns of Sliema, St. Julian’s and Birkirkara) with a 27%
increase on 2005 (+32,309 inhabitants), followed by the South Eastern district
(featuring Birzebuggia, Marsascala, Marsaxlokk) with 19% (+11,117 inhabitants) and
the Western district (Mdina, Dingli) with 6% (+3,651 inhabitants). Finally, compared to
2005 the Southern Harbour district shows a very little increase of 1% (+532
inhabitants). However, while the other three areas show a positive trend throughout the
whole timespan, this is not the case for this district, which includes Valletta, the capital
city, but also the territory of Rinella and Xghajra. After a gradual decrease from 2005
to 2011, the year of the sewage treatment plant’s inauguration, and a following period
of stability for 2 years, a noteworthy growth has taken place from 2013 onwards.
-
50,000
100,000
150,000
200,000
250,000
300,000
350,000
400,000
2005 2006 2007 2008 2009 2010 2011 2012 2013 2014 2015 2016 2017
Southern Harbour Northern Harbour
South Eastern Western
Total

19
Figure 8. Malta’s Grand Harbour and the location of the project
Source: CSIL elaboration on Google Maps
1.2. PROJECT OBJECTIVES
Before the construction of the new Malta South sewage treatment plant, a percentage
of 76%17 of the sewage flow produced in Malta was discharged untreated at Wied
Ghammieq (between Rinella and Xghajra) away from the coast through a submarine
outfall 716 meters long. This untreated wastewater discharge into the sea, in itself not
in line with the European Directives, was made even more unbearable by the poor
conditions of the aforementioned outfall, which suffered from ageing components,
equipment breakdown, as well as wilful damage18. As a matter of fact, small-scale
fishermen were reported to intentionally damage and bomb the submarine outfall,
driven by the goal of attracting fish through the high-nutrient content of the sewer
water. As a result of these damages, raw wastewater was discharged not in a diffused
way19, but rather as a stream, and it therefore generated plume on Malta’s south-
eastern coast.
The ERS SAR satellite images analysed in Axiak et al. (2000) and acquired over Malta
between 1995 and 1997 can be used to give an idea of the sewage movements when
the Wied Ghammieq submarine outfall was out of order. One of such images concerning
the south-eastern part of Malta, acquired on 5th July 1997, is presented in the figure
below. It clearly shows that the sewage was being discharged very close to the shore
(as the dark stripe in the photo A shows). The tendency of the sewage stream was then
to run parallel to the shore with a southwestern orientation. Beyond the Marsaxlokk bay,
17 2009 basis. Source: Ex-ante Cost-benefit analysis. 18 Axiak V., 2004. National Diagnostic Analysis for Malta - National Action Plan for Malta for the Reduction
and Elimination of Land Based Pollution, p. 21. 19 A properly designed and operated marine outfall effectively dilutes the discharged water which then reduces
the concentration of contaminants in the wastewater.

20
however, the tendency seemed to turn south-eastwards again, indicating secondary
counter-clockwise circulatory currents.
Source: Axiak V. et al., 2000. Re-assessing the Extent of Impact of Malta’s (Central Mediterranean) Major
Sewage Outfall Using ERS SAR, in “Marine Pollution Bulletin”, Volume 40, Issue 9, pages 734-738.
The patch of raw sewage was smelling, clearly visible from the coast and
dangerous for people, due to the high concentration of pathogens in the water.
The Xghajra seacoast was a no-go area for bathing purposes and since the 1970s and
1980s touristic development had shifted towards the north-east. From the point of view
of marine life, a different community of algae was generated in the area as a result of
untreated wastewater, because of its high-nutrient contents. Marine biodiversity was
threatened: in particular, a 1997 benthic survey conducted in the proximity of the Wied
Ghammieq outfall identified a dense population of Dictyopteris polypodioides, a marine
alga which probably displaced other species less adapted to the increased nutrient load.
The project’s primary objective was to treat all wastewater collected by the
sewerage networks in the south of Malta before discharging it into the sea,
thereby achieving compliance with the relevant EU directives, improving the
quality of marine-coastal waters, eliminating disamenities for the population
and restoring bathing water quality on the 5-km coastline between Rinella and
Marsascala. In turn, the treatment of all wastewater was instrumental to the
achievement of a secondary goal consisting in enhancing the touristic potential of
the whole south-eastern coast to ultimately trigger economic development.
On a different note, in the ex-ante phase the major project was additionally expected
to generate three other positive effects. First, in accordance with a strategic approach
to wastewater management, the plant was designed to be the core element of a complex
system, enabling the future implementation of further investments generating benefits
for the society. In particular, the plant was the first necessary step towards the reuse
of water for agricultural purposes (which was to become reality through the installation
of an additional water polishing plant).

21
Second, improved seawater quality was thought to cause benefits for fishing activities.
However, it should be noted that fishing had never stopped in the area, that sewage
attracts fishes due to its high-nutrient content, and that not the quality of all species of
fish changes based on the presence of untreated sewage in seawater. While aquaculture
was not explicitly mentioned in the application dossier instead, in principle the project
would have benefitted fish farms off Marsaxlokk as well, given the geographical
extension of the contamination20.
Third, the plant was expected to have a positive impact on the quality of drinking water.
The effect of the plant in this regard – this was the line of reasoning – was twofold. This
benefit was believed to come about due to the fact that the production of drinking water
occurs in Malta through desalination and groundwater extraction.
On the one hand, stopping the discharge of raw sewage to the sea would prevent it from
reaching the seawaters of Pembroke, north of Sliema, where the nearest reverse
osmosis desalination plant is located, thus avoiding a negative impact on the
desalination plant’s functioning and costs.
On the other hand, the plant was the first step towards the reuse of water and as such,
it was thought to provide an alternative for farmers to the illegal extraction of
groundwater, which can lead to its overexploitation and deteriorate its quality. As a
result, groundwater would thus have been prevented from depauperating and saved for
drinking purposes.
However, it should be noted that the generation of effects on the quality of drinking
water appears to be controversial. The possibility that sea currents effectively moved
sewage from the Xghajra area to Pembroke and another desalination plant in the south
of the island, affecting their functioning, does not seem to be grounded on evidence.
Similarly, it is not ascertained that costs of water purification at desalination plants
depend directly on water contamination levels.
While the reuse of water represents a more solid argument, it needs to be noted that
the provision of polished water to farmers in conformity with the concept of circular
economy was not the direct result of this major project, but rather of subsequent
investments. Nevertheless, as already mentioned, this plant represents a pre-requisite
to implementing the subsequent polishing plant.
On a different note, it can be underlined that the target population of the Malta South
sewage treatment plant coincides with the inhabitants of the four districts served21. The
ex-ante cost-benefit analysis identified a resident population of about 320,000 and the
plant was subsequently sized based on an population equivalent22 of 500,000. As
mentioned above, the resident population in the four districts has strongly increased
during the last years, as did the country as a whole.
20 Axiak V., 2004. National Diagnostic Analysis for Malta - National Action Plan for Malta for the Reduction
and Elimination of Land Based Pollution, p. 22. 21 Based on the assumption that the four districts precisely coincide with the catchment area of the Malta
South sewage treatment plant, which depends on the structure of the sewerage network. 22 In wastewater monitoring and treatment, the term “equivalent population” refers to the amount of oxygen-
demanding substances whose oxygen consumption during biodegradation equals the average oxygen demand of the waste water produced by one person. Source: United Nations, Glossary of Environment Statistics.

22
1.3. STRUCTURAL FEATURES
The major project consisted of five components: 1) the construction of a new
wastewater treatment plant in Ta’ Barkat; 2) the construction of a new wastewater
pumping station in Rinella; 3) the upgrading of an existing wastewater pumping station
in Xghajra; 4) the construction of a new 1.7 km wastewater gallery from Rinella to Ta’
Barkat; 5) the construction of a new 1 km submarine outfall.
Figure 9. Project components
Source: CSIL elaboration on project dossier
The plant (Component 1) represents the core of the major project and it receives
both residential and industrial waste. Its size and capacity were based on an estimated
daily average flow of 60,000 m³ per day, serving an equivalent population of 500,000.
After a first screening and treatment, raw wastewater is conveyed to aeration tanks and
processed with compressed air introduced through banks of diffusers. An extremely high
concentration of bacteria processes the solid matter, which is then extracted in the form
of sludge. The effluent, consisting in clear and odourless water, can then be discharged
into the sea or fed into a near polishing plant operating since September 2018. Sludge
is processed in anaerobic digestors, producing methane that is used by the plant itself
to cover part of its energy needs. After digestion the produced sludge is dewatered
through centrifuges. Residual sludge is disposed of in landfills.
In terms of technology, the plant’s functioning is characterized by a process called
“attached growth”, which had already been widely applied to large scale plants in the
past, and specifically by the operation of a biological aerated filter, which ensures a very
good flexibility of operation during storm water peaks and is well resilient to shock
loading23 (caused for instance by the presence of tourists).
23 Source: Ex-ante cost benefit analysis.
Only components shown redform part of the project.

23
Table 1. Design parameters of the Malta South Sewage Treatment Plant
Item Parameter
Population equivalent 500,000
Daily average flow 60,000 m³/day
Maximum wet weather flow 9,000 m³/hour
Suspended solids 34,400 kg/day
COD24 59,000 kg/day
BOD₅25 29,500 kg/day
Total phosphorus 490 kg/day
Total Kjeldahl nitrogen 5,400 kg/day
Source: project dossier
Table 2. Targeted effluent quality
Item Unit Urban Wastewater Directive
91/271/EC – Annex I Requirements
For discharge to the
sea
BOD₅ mg/l 25 mg/l or 70%-90% reduction of
influent load
<25 mg/l or 90%
removal
COD mg/l 125 mg/l or 70% reduction of influent
load
<125 mg/l or 70%
removal
Suspended
solids mg/l
35 mg/l or 90% reduction of influent
load
<35 mg/l or 90%
removal
Ammonia-
nitrogen mg/l n/a <5
Nitrate-
nitrogen mg/l n/a <23
Intestinal
enterococci
cfu/
100 ml n/a
100 (based on a 95-
percentile evaluation)
Escherichia
coli
cfu/
100 ml n/a
250 (based on a 95-
percentile evaluation)
Source: project dossier
24 Chemical oxygen demand (COD) measures the amount of oxygen required to oxidize organic matter in
water and its value is most commonly expressed in mass of oxygen consumed over volume of solution. COD tests are used to quantify the amount of organic matter in water, and their most common application is the quantification of oxidizable pollutants found in surface water or wastewater. 25 Biochemical oxygen demand (BOD or BOD₅) measures the amount of dissolved oxygen used by
microorganisms in the biological process of metabolizing organic matter in water. It is commonly expressed in milligrams of oxygen consumed per litre of sample. Like COD, it is used to assess water quality.
24
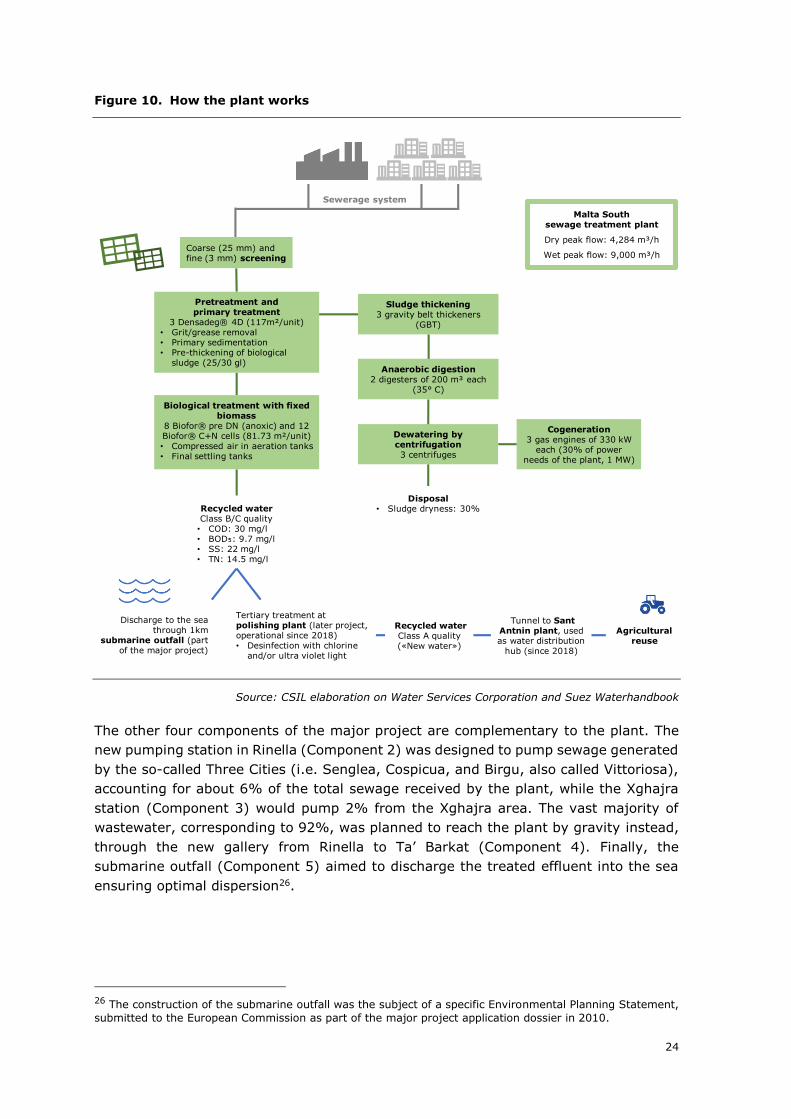
Figure 10. How the plant works
Source: CSIL elaboration on Water Services Corporation and Suez Waterhandbook
The other four components of the major project are complementary to the plant. The
new pumping station in Rinella (Component 2) was designed to pump sewage generated
by the so-called Three Cities (i.e. Senglea, Cospicua, and Birgu, also called Vittoriosa),
accounting for about 6% of the total sewage received by the plant, while the Xghajra
station (Component 3) would pump 2% from the Xghajra area. The vast majority of
wastewater, corresponding to 92%, was planned to reach the plant by gravity instead,
through the new gallery from Rinella to Ta’ Barkat (Component 4). Finally, the
submarine outfall (Component 5) aimed to discharge the treated effluent into the sea
ensuring optimal dispersion26.
26 The construction of the submarine outfall was the subject of a specific Environmental Planning Statement,
submitted to the European Commission as part of the major project application dossier in 2010.
Sewerage system
Coarse (25 mm) and fine (3 mm) screening
Pretreatment and primary treatment
3 Densadeg® 4D (117m²/unit)• Grit/grease removal• Primary sedimentation• Pre-thickening of biological
sludge (25/30 gl)
Biological treatment with fixedbiomass
8 Biofor® pre DN (anoxic) and 12 Biofor® C+N cells (81.73 m²/unit)• Compressed air in aeration tanks• Final settling tanks
Discharge to the seathrough 1km
submarine outfall (part of the major project)
Recycled water Class B/C quality• COD: 30 mg/l• BOD₅: 9.7 mg/l• SS: 22 mg/l• TN: 14.5 mg/l
Sludge thickening3 gravity belt thickeners
(GBT)
Anaerobic digestion2 digesters of 200 m³ each
(35° C)
Dewatering by centrifugation3 centrifuges
Disposal• Sludge dryness: 30%
Cogeneration3 gas engines of 330 kW
each (30% of power needs of the plant, 1 MW)
Tertiary treatment at polishing plant (later project, operational since 2018)• Desinfection with chlorine
and/or ultra violet light
Recycled water Class A quality(«New water»)
Agriculturalreuse
Malta South sewage treatment plant
Dry peak flow: 4,284 m³/h
Wet peak flow: 9,000 m³/h
Tunnel to SantAntnin plant, usedas water distribution
hub (since 2018)

25
Table 3. Design construction costs and machinery costs of the single project
components (in nominal terms)
Project
component
Civil/
landscaping
costs (no VAT)
Mechanical/
electrical costs
(no VAT)
Total %
1. Sewage
treatment
plant
22,141,661 € 34,417,854 € 56,559,515 € 84.73%
2. Rinella
pumping
station
658,320 € 189,927 € 848,247 € 1.27%
3. Xghajra
pumping
station
- € 28,777 € 28,777 € 0.04%
4.
Submarine
outfall
6,998,734 € - € 6,998,734 € 10.48%
5. Gallery
Rinella - Ta'
Barkat
2,318,891 € - € 2,318,891 € 3.47%
Total 32,117,606 € 34,636,558 € 66,754,164 € 100.00%
Source: Ex-ante CBA. In addition to these construction and machinery costs, the total cost foreseen ex-ante
for the whole project (€ 70 million) included: design fees; land purchase; contingency; publicity; project
management.
As Table 3 shows, the plant represented by far the most expensive project component
in terms of construction and machinery costs.
The 1 km long submarine outfall, representing the second-largest cost item, could at
first sight appear to be superfluous, if the discharged effluent undergoes proper
treatment according to the legislative requirements. However, its construction is
strongly defended by different stakeholders and independent observers for various
reasons, among which the avoidance of social tensions and concerns, its adoption as a
precautionary measure in case of plant dysfunctions, and the high-nutrient contents still
present in treated water, which may cause changes to the marine environment.
As regards the location of the plant, it should be noted that the project area, extending
for 41,000 m², previously consisted of agricultural land of low value27. The location near
Xghajra was chosen because of the already existent sewerage networks collecting
wastewater generated from Malta South and taking it to Wied Ghammieq, near Xghajra,
where the previous outfall was located.
27 Environmental Impact Statement, February 2008.

26
2. ORIGIN AND HISTORY
2.1. BACKGROUND
Malta was governed by the Order of Saint John from 1530 to 1798. It was during this
age that the first sewage system was built in the country. Under the Knights of Malta,
a first public drainage system was designed, with a network of pipes carrying sewage
outside the walls of Valletta28. Five centuries ago, this system aimed to avoid sewage
contamination of tanks collecting rainfall.
Today’s sewerage system dates back to the Twentieth century and, recognising
the need for a separation of stormwater from residential and industrial wastewater, it
consists of partially separated sewers. The system consists of 3 sewage treatment
plants, 104 sewage pumping stations and 1,545 km of sewage collection network,
covering most of the Maltese islands. Only about 1,000 households were still not
connected to the main network in 200629. However, WSC has conducted several works
in more recent years and new tenders have been published recently to upgrade the
network and serve unconnected households (specifically in the Western part of Malta).
Water management, as a matter of fact, has always been at the core of Maltese history,
uniquely shaped by the country’s geographic position in the middle of the Mediterranean
Sea. In 1976, Malta signed the Barcelona Convention for the Protection of the
Marine Environment and the Coastal Region of the Mediterranean, which
constitutes the legal framework of the Mediterranean Action Plan developed under the
United Nations Environment Programme (UNEP) Regional Seas Programme and
approved in 1975. As a signatory, Malta was required to establish treatment
facilities for sewage prior to its discharge.
In 1982, the first sewage treatment plant in the country was constructed, called Sant
Antnin and located in the south-east of Malta. Nevertheless, its capacity covered merely
about 10% of total wastewater generated in the country. In the light of an
inadequate wastewater management at the time and of the need for both
sound analysis and policy recommendations, a study was carried out in 1992
for the Maltese Ministry of Development and Infrastructure by the international
consulting group COWI. This document, the “Sewerage Masterplan for Malta and
Gozo”, outlined a strategic approach to wastewater management and
suggested the construction of three new sewage treatment plants. In addition
to this key requirement, the Masterplan recommended the strengthening of collection
and transport networks across the country. Needed improvements specifically identified
by the study concerned mains and galleries, retention basins and pumping stations.
28 Sapiano, M. et al., 2008. The evolution of water culture in Malta: An analysis of the changing perceptions
towards water throughout the ages, in “Options Méditerranéennes”, A n° 83, 2008 - Water Culture and Water Conflict in the Mediterranean Area. 29 FAO, 2006. Malta water resources review, p. 44.
27
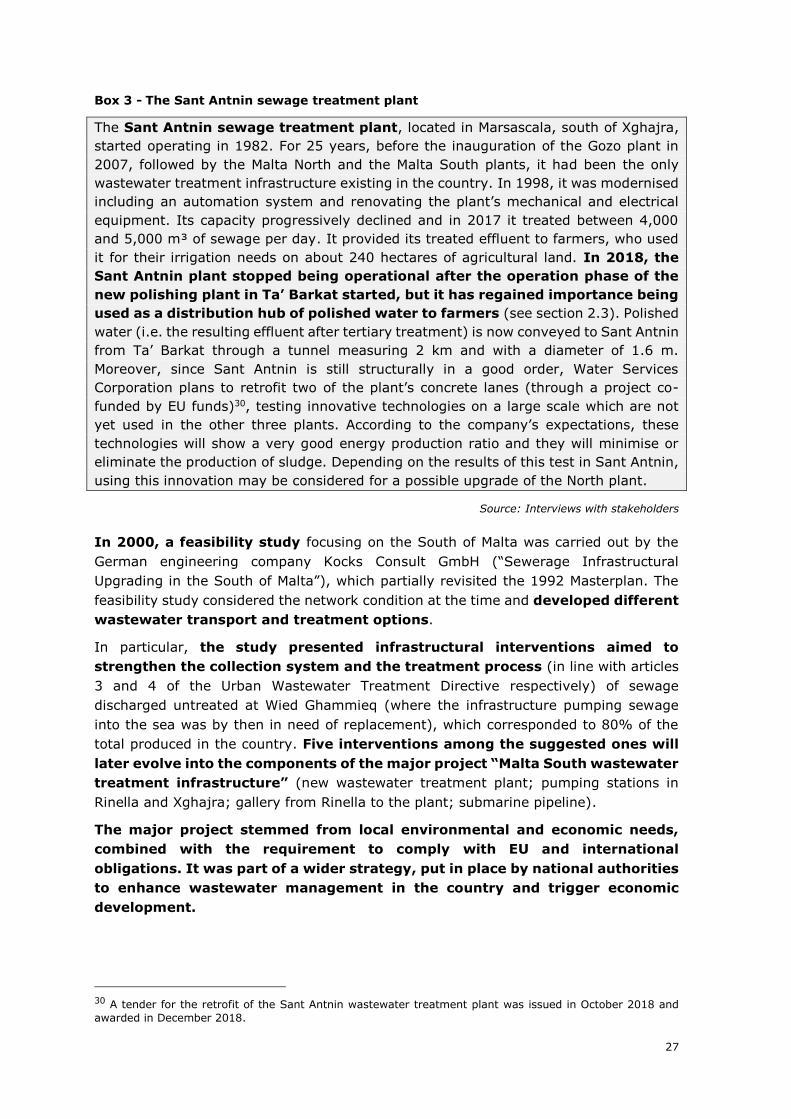
Box 3 - The Sant Antnin sewage treatment plant
The Sant Antnin sewage treatment plant, located in Marsascala, south of Xghajra,
started operating in 1982. For 25 years, before the inauguration of the Gozo plant in
2007, followed by the Malta North and the Malta South plants, it had been the only
wastewater treatment infrastructure existing in the country. In 1998, it was modernised
including an automation system and renovating the plant’s mechanical and electrical
equipment. Its capacity progressively declined and in 2017 it treated between 4,000
and 5,000 m³ of sewage per day. It provided its treated effluent to farmers, who used
it for their irrigation needs on about 240 hectares of agricultural land. In 2018, the
Sant Antnin plant stopped being operational after the operation phase of the
new polishing plant in Ta’ Barkat started, but it has regained importance being
used as a distribution hub of polished water to farmers (see section 2.3). Polished
water (i.e. the resulting effluent after tertiary treatment) is now conveyed to Sant Antnin
from Ta’ Barkat through a tunnel measuring 2 km and with a diameter of 1.6 m.
Moreover, since Sant Antnin is still structurally in a good order, Water Services
Corporation plans to retrofit two of the plant’s concrete lanes (through a project co-
funded by EU funds)30, testing innovative technologies on a large scale which are not
yet used in the other three plants. According to the company’s expectations, these
technologies will show a very good energy production ratio and they will minimise or
eliminate the production of sludge. Depending on the results of this test in Sant Antnin,
using this innovation may be considered for a possible upgrade of the North plant.
Source: Interviews with stakeholders
In 2000, a feasibility study focusing on the South of Malta was carried out by the
German engineering company Kocks Consult GmbH (“Sewerage Infrastructural
Upgrading in the South of Malta”), which partially revisited the 1992 Masterplan. The
feasibility study considered the network condition at the time and developed different
wastewater transport and treatment options.
In particular, the study presented infrastructural interventions aimed to
strengthen the collection system and the treatment process (in line with articles
3 and 4 of the Urban Wastewater Treatment Directive respectively) of sewage
discharged untreated at Wied Ghammieq (where the infrastructure pumping sewage
into the sea was by then in need of replacement), which corresponded to 80% of the
total produced in the country. Five interventions among the suggested ones will
later evolve into the components of the major project “Malta South wastewater
treatment infrastructure” (new wastewater treatment plant; pumping stations in
Rinella and Xghajra; gallery from Rinella to the plant; submarine pipeline).
The major project stemmed from local environmental and economic needs,
combined with the requirement to comply with EU and international
obligations. It was part of a wider strategy, put in place by national authorities
to enhance wastewater management in the country and trigger economic
development.
30 A tender for the retrofit of the Sant Antnin wastewater treatment plant was issued in October 2018 and
awarded in December 2018.

28
2.2. FINANCING DECISION AND PROJECT IMPLEMENTATION
In 2005, first discussions concerning the project took place between the European
Commission and Maltese authorities, after the country had acceded the EU one year
before. From an EU perspective, the plant was in line with sectoral priorities and
strategies and improved compliance of Malta with relevant directives in the field of
wastewater management. Therefore, the preparation of the documents and analyses
required for the application of EU funds started.
The tender for construction was launched in April 2007, and award and contracting took
place in June 2008. In December 2008, the Malta Environment and Planning Authority
(MEPA) granted its permission to start works.
In the ex-ante phase, the total project cost was established at EUR 70 million
(VAT excluded) in nominal terms, of which EUR 59.5 million, corresponding to 85%,
were to be provided by the Cohesion Fund in the 2007-2013 programming period, with
resources allocated on the Operational Programme I – Investing in Competitiveness for
a Better Quality of Life. The residual EUR 10.5 million represented the national
counterpart (15%). This contribution was financed through a loan granted to WSC by
the European Investment Bank (EIB), which featured very favourable conditions. As a
matter of fact, the amount to finance the national contribution for the sewage treatment
plant was part of a bigger loan, covering other projects as well beyond the plant. Its
interest rate was of 4.2% (based on a weighted average of three different tranches of
the loan) and the amortisation period of 20 years.
Starting in 2008, the Managing Authority and WSC were supported by JASPERS for the
preparation of the major project application form and particularly for the ex-ante CBA.
The Commission Decision31 to finance the project was released in November 2010, after
the major project application form had been submitted in June of the same year,
together with the ex-ante CBA.
Project construction, however, had already started in December 2008 and finished in
October 2010, in line with the foreseen schedule. After a testing phase, the plant was
officially inaugurated on 2 June 2011.
Total final costs turned out to be smaller than foreseen ex-ante and amounted to EUR
68 million32. Proportionally, the EU grant and the national contribution decreased as
well, keeping their percentage share unchanged (i.e. 85% and 15% respectively). The
final EU contribution to the project was of EUR 57.8 million, while the national
counterpart EUR 10.2 million (corresponding to the final amount of the EIB loan as well).
2.3. CURRENT PERFORMANCE AND OTHER INVESTMENT NEEDS
Thanks to the contribution by the major project, Malta achieved compliance with the
Bathing Water Directive. In particular, as shown by the following table, bathing water
quality in Xghajra has improved considerably in recent years and since 2013 all its
31 Decision K(2010) 7902 by the European Commission, 18/11/2010. 32 The two items of investment costs showing the largest decrease between ex-ante forecasts and sums
actually disbursed were: i) Contingencies, for which EUR 1.5 million had been planned, none of which were disbursed; ii) Supervision during construction, for which EUR 1 million was forecasted, but less than EUR 800,000 were disbursed.

29
bathing waters were declared of excellent quality by the Environmental Health
Directorate of the Ministry of Health.
Table 4. Bathing water quality in the two monitoring points in Xghajra (2009-
2017)
Year
Monitoring
point in
Xghajra
Escherichia
Coli Intestinal Enterococci
Overall
classification
2009 1 Sufficient Excellent Sufficient
2 Good Excellent Good
2010 1 Sufficient Excellent Sufficient
2 Good Excellent Good
2011 1 Sufficient Excellent Sufficient
2 Good Excellent Good
2012 1 Good Excellent Good
2 Good Excellent Good
2013 1 Excellent Excellent Excellent
2 Excellent Excellent Excellent
2014 1 Excellent Excellent Excellent
2 Excellent Excellent Excellent
2015 1 Excellent Excellent Excellent
2 Excellent Excellent Excellent
2016 1 Excellent Excellent Excellent
2 Excellent Excellent Excellent
2017 1 Excellent Excellent Excellent
2 Excellent Excellent Excellent
Source: CSIL elaboration on Ministry of Health – Environmental Health Directorate. Monitoring point 1 is
located in Dawret ix-Xatt - Tan-Nisa, while Monitoring point 2 is in Dawret ix-Xatt - Wied Glavan.
As regards compliance with the UWWTD, in 2017 the European Commission released
data referred to 2014 which show that wastewater treated at the Ta’ Barkat plant and
discharged into the sea contains a concentration of BOD₅ of 28.01 mg/l, against a
concentration in incoming wastewater of 477.47 mg/l. This corresponds to a reduction
of 94%. The concentration of COD is reduced from 874.21 mg/l to 208.85 mg/l instead,
with a reduction of 76%. Despite these strong rates of reduction, the achieved values
were still not compliant with the requirements of the Directive (less than 25 mg/l of
BOD₅ and less than 125 mg/l of COD). Since then the situation has continued to improve
and full compliance with UWWTD could be reached in the very near future (see further
explanation).
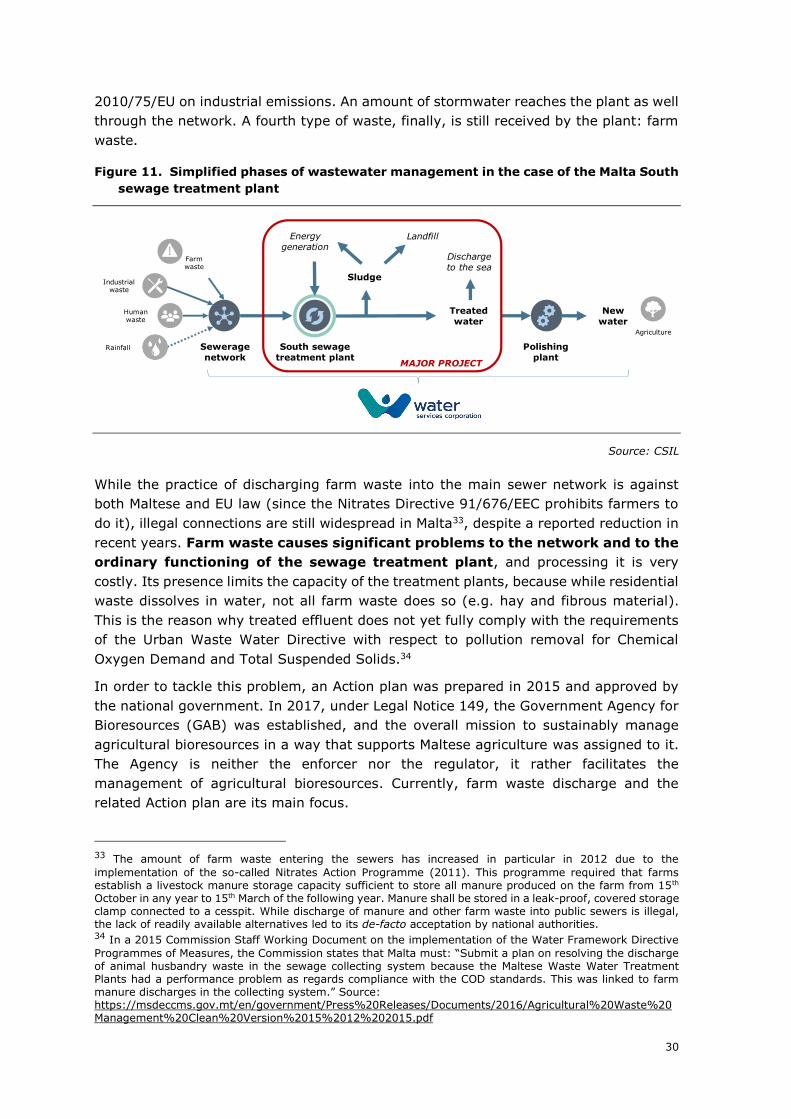
The Malta South sewage treatment plant today receives residential and industrial waste
through the same sewerage network. Industries have to pre-treat their waste in order
for it to be compatible with the network’s characteristics and in line with Directive
30
2010/75/EU on industrial emissions. An amount of stormwater reaches the plant as well
through the network. A fourth type of waste, finally, is still received by the plant: farm
waste.
Figure 11. Simplified phases of wastewater management in the case of the Malta South
sewage treatment plant
Source: CSIL
While the practice of discharging farm waste into the main sewer network is against
both Maltese and EU law (since the Nitrates Directive 91/676/EEC prohibits farmers to
do it), illegal connections are still widespread in Malta33, despite a reported reduction in
recent years. Farm waste causes significant problems to the network and to the
ordinary functioning of the sewage treatment plant, and processing it is very
costly. Its presence limits the capacity of the treatment plants, because while residential
waste dissolves in water, not all farm waste does so (e.g. hay and fibrous material).
This is the reason why treated effluent does not yet fully comply with the requirements
of the Urban Waste Water Directive with respect to pollution removal for Chemical
Oxygen Demand and Total Suspended Solids.34
In order to tackle this problem, an Action plan was prepared in 2015 and approved by
the national government. In 2017, under Legal Notice 149, the Government Agency for
Bioresources (GAB) was established, and the overall mission to sustainably manage
agricultural bioresources in a way that supports Maltese agriculture was assigned to it.
The Agency is neither the enforcer nor the regulator, it rather facilitates the
management of agricultural bioresources. Currently, farm waste discharge and the
related Action plan are its main focus.
33 The amount of farm waste entering the sewers has increased in particular in 2012 due to the
implementation of the so-called Nitrates Action Programme (2011). This programme required that farms establish a livestock manure storage capacity sufficient to store all manure produced on the farm from 15th October in any year to 15th March of the following year. Manure shall be stored in a leak-proof, covered storage clamp connected to a cesspit. While discharge of manure and other farm waste into public sewers is illegal, the lack of readily available alternatives led to its de-facto acceptation by national authorities. 34 In a 2015 Commission Staff Working Document on the implementation of the Water Framework Directive
Programmes of Measures, the Commission states that Malta must: “Submit a plan on resolving the discharge of animal husbandry waste in the sewage collecting system because the Maltese Waste Water Treatment Plants had a performance problem as regards compliance with the COD standards. This was linked to farm manure discharges in the collecting system.” Source: https://msdeccms.gov.mt/en/government/Press%20Releases/Documents/2016/Agricultural%20Waste%20Management%20Clean%20Version%2015%2012%202015.pdf
New water
Dischargeto the sea
Agriculture
Farm waste
Seweragenetwork
South sewagetreatment plant
Sludge
Treatedwater
Polishingplant
LandfillEnergy generation
Human waste
Industrial waste
Rainfall
MAJOR PROJECT

31
The Action plan involved three levels of solutions: immediate, intermediate, and long-
term. The idea for an immediate solution was to export farm waste: two Preliminary
Market Consultations were put forward (asking the general public to provide solutions
in terms of export), but with no success. No offer for the export of slurry was considered
adequate.
As an intermediate, medium-term solution, the government focused on preventing farm
waste discharge in the catchment areas of Gozo and Malta North. Emphasis was
attached to the catchment areas of these two smaller plants because they were more
distressed by the problem of farm waste discharge than the Ta’ Barkat plant. Since their
treatment capacity is smaller, the load on the Gozo and the Malta North plants was in
fact much larger than in Malta South. This can be explained by analysing the distribution
of cattle across the country. In Malta there are roughly 12,000 head of cattle. Over
4,000 of them are in Gozo, and 2,000 in the area served by the Malta North plant.
Therefore, waste generated by a total of 6,000 head of cattle was processed through a
total treatment capacity of about 13,000 m³ per day. On the contrary, in the south of
Malta waste of the residual 6,000 head of cattle was processed by the Ta’ Barkat plant,
having a capacity of 60,000 m³ per day. The burden on this latter plant, therefore, was
lighter than the one borne by the other two, smaller plants.
Anyway, the measures taken in Gozo and Malta North (which have been pretty
successful) have been only temporary ones, pending a long-term solution. Aiming at
this long-term answer to the problem, GAB and the Malta Council for Science and
Technology launched in 2018 the “Scheme for the Provision of Proposals aimed at a
Holistic Approach to the Sustainable Management of Livestock Manure and Slurry within
a Circular Economy Context”. Under this scheme, financial support will be offered to
organisations developing solutions and business proposals for the management of
organic matter generated on farms and proving that their technology is in line with
circular economy concepts and can be tailored to manage bovine, swine and other
livestock manure and slurry. Three projects were accepted, and the related final report
is being assessed as of December 2018, in order to evaluate the results. In any case,
under the long-term solution that will be identified, no more farm waste discharge into
the sewerage network shall take place. While the final report on the possible alternative
technologies is expected to be released at the beginning of 2019, no further forecasts
on the timing of future investments are available yet.
According to WSC, however, the problem has recently been entirely solved in Gozo. The
good functioning of the new polishing plant in Ta’ Barkat, moreover, would prove that
the situation in the south of Malta has improved as well. As a matter of fact, when first
trials were carried out at the polishing plant, the latter could not immediately start
operating due to the presence of particles. Since July 2018, however, the polishing plant
is correctly operating, and it was officially inaugurated in September. The absence of
significant problems in the polishing plant’s operation phase can reportedly be linked to
considerable reductions in the amount of farm waste received.
The polishing plant, providing high-quality water to farmers for irrigation purposes, is
the most important change introduced after the project’s entry into operation and
constitutes a further step in a chain of investments in the field of wastewater
management in Malta. Moreover, it has allowed to stop using Sant Antnin for sewage
treatment: the Sant Antnin plant could not be phased out before because it provided

32
treated effluents to farmers, and no alternative would have been there for them before
the new polishing plant became operational.
Box 4 - The polishing plants and the “new water” project
WSC’s “New water” programme foresees the development of an annual production
capacity of 7 million m³ of high-quality water suitable for crop irrigation, potentially
addressing up to 35% of the total water demand of the Maltese agricultural sector35.
The programme involved the development of three water polishing plants upgrading the
quality of treated water from the Maltese islands’ three new Urban Wastewater
Treatment Plants through the so-called tertiary treatment. The three polishing are
therefore located within the footprint of the sewage treatment plants in Gozo, in the
north of Malta and in Ta’ Barkat in the south of Malta. The one in Ta’ Barkat is the largest
one and it can produce up to 9,600 m³ per day. The two other plants in the north of
Malta and in Gozo have instead a capacity of 6,400 and 3,200 m³ per day respectively.
WSC’s aim is achieving a “net zero-impact” on the natural water cycle, whereby
abstracted groundwater shall be replaced thanks to several measures, among which the
production and delivery of new water to farmers.
While a reverse-osmosis section is not common in similar plants, in the case of Ta’
Barkat it can be linked to existing problems of high water salinity.
Source: http://www.wsc.com.mt/information/new-water/
35 The total irrigated area on the Maltese islands amounted to 3,498 ha in 2010. Of these, 1,992 ha were
located in the four districts served by the Malta South sewage treatment plant, corresponding to 57% of the

33
According to WSC, the supply of polished water has been functioning correctly
in the first months since its introduction in the south of Malta. Similarly, the “new
water” project had already been successfully implemented at the Gozo sewage
treatment plant and sold to farmers who used it to irrigate nearby fields.
While the provision of high-quality “new water” to farmers does not directly result from
the investment in the sewage treatment plant, but rather from the subsequent project
to build the polishing plant and the connection to the Sant Antnin plant, it should be
noted that both the supply of water for irrigation and the change in the use of
Sant Antnin36 would not have been possible without the Malta South sewage
treatment plant, which definitely constitutes the key infrastructure in the
complex system of wastewater management in the south of the island.
“It’s a chain: you cannot reach the final step without the
plant.” (Interview with stakeholders, November 2018)
As a by-product of the treatments that are carried out at the sewage treatment plant,
sludge is generated, which is used to produce energy for the plant itself. The
South sewage treatment plant has an energy recovery system, which is made possible
by anaerobic digestors where sludge is processed, and engines connected to them. After
being dried out by centrifuges, sludge precipitates. Sludge leftovers resulting from this
process are subsequently landfilled.
While the possibility to resort to incineration of these leftovers was the target of specific
studies, it turned out that these have very limited calorific value and that incineration
could not therefore represent a viable solution. Exporting the residual sludge, due to
the costs involved, does not appear to be an option for WSC either. Further studies,
however, envisaged additional uses for the remaining sludge: on one hand, the
composting; on the other hand, its carbonisation and transformation into a material apt
for green roofs and costing about EUR 100/m³, which is the study object of a joint
project carried out with the University of Malta. While finding reuse possibilities for
sludge is thus a medium-term aim of WSC, these R&D projects have not yet offered a
plausible solution to the landfilling of leftovers, which therefore still takes place. Further
investments aimed at avoiding the landfilling of sludge currently constitute the
most necessary action related to sewage treatment, together with
interventions (of a very different nature) to put an end to illegal discharge of farm
waste into the network.
In 2017, the Ta’ Barkat sewage treatment plant treated 19.5 million m³ of wastewater,
corresponding to an average of 53,373 m³ per day. Importantly, while the plant was
expected to reach its maximum capacity (60,000 m³/day) in 2023, according
to WSC this will happen ahead of schedule, mainly because of the impact of
population growth. In this regard, the tender recently launched for the retrofitting of
total irrigated area in the country. In particular, the Western district had 1,014 ha of irrigated area, the South Eastern district 496 ha, the Southern Harbour district 305 ha and the Northern Harbour district 178 ha. Source: National Statistics Office, 2012. Census of Agriculture 2010. 36 After going through the Ta’ Barkat – Sant Antnin tunnel, polished water can be distributed to the farmers
from the Sant Antnin plant, and finally be reused for agriculture, fully in line with the concept of circular economy.

34
the Sant Antnin plant37 could represent an answer to concerns over the effects of strong
population growth on the long-term treatment capacity of the Ta’ Barkat plant.
A further problematic factor is represented by seawater infiltration. As a matter
of fact, since sewers are largely under sea level and in poor shape, seawater infiltrates
them and adds to the inflows treated by the Ta’ Barkat plant. On this point, operational
problems for the plant generated by seawater infiltration concern both the higher
amount of water received, and the salinity itself, as underlined by the European
Commission as well in its 9th Technical assessment on UWWTD implementation issued
in 2017. WSC has implemented projects to replace some critical segments of the
sewerage network, and expects the amount of seawater in the sewers to be reduced in
the future.
37 Contract CT 3187/2018, issued in October 2018 and awarded in December 2018.

35
3. DESCRIPTION OF LONG-TERM EFFECTS
3.1. KEY FINDINGS
The long-term contribution of this project has been considered under the following four
main categories: environmental sustainability, economic growth, quality of life and well-
being, and distributional effects.
The project implementation produced positive and significant effects in terms
of environmental sustainability. The provision of all the municipalities of Malta South
with wastewater treatment drastically reduced the amount of sewage directly
discharged into the sea, which was putting at risk the sustainability of the natural
ecosystem of the Malta south-eastern coast. The reduction of solid and bacterial
contamination load38 and the protection of marine life have been ensured by the
treatment plant. In the ex-post CBA, the monetary value of the pure existence of clean
seawater has been quantitatively measured.
From an environmental standpoint, the sewage treatment plant – being an
infrastructure which requires energy – is associated with the production of emissions as
well. Both the emissions caused by the use of self-generated energy and of energy
absorbed from the grid represent a negative externality of the project which has been
quantitatively measured in the CBA. Energy emissions caused by the transport of sludge
have been likewise included in the analysis.
The project produced positive effects in terms of quality of life and economic
growth as well. On the one hand, cleaner water off Malta’s south-eastern coast
positively affected the residents’ quality of life, notably thanks to improvements to the
landscape and the possibility of enjoying better quality bathing water. On the other
hand, evidence collected on the field shows that higher water bathing quality has
contributed, together with other investments, to an increase in the value of real estate
on the waterfront and to a slight development of tourism, especially in Marsascala and
Marsaxlokk. This effect, however, has not been quantified, thus adopting a prudent
approach, because of the difficulty of disentangling the actual project contribution to
the increase in the total tourism inflow. A slight decrease in the value of real estate in
the immediate proximity to the plant has been quantitively measured instead.
As regards distributional effects, the major project did not produce measurable effects.
Nevertheless, it can be highlighted that, together with investments in other sectors (e.g.
transport), the project contributed to triggering economic development and a positive
change of image in an area previously not seen as a pleasant destination.
Before introducing the results of the ex-post CBA, it is worth underlining that in line with
the ex-ante CBA the counterfactual baseline scenario against which incremental effects
have been compared is a Business-as-usual (BAU) scenario. On this point, it needs to
be underlined that this latter scenario would not enable Malta to achieve compliance
with EU directives. In other words, the BAU would correspond to perpetuating a situation
of infringement of EU and national legislations and failing to tackle a significant
38 This reduction was likely accompanied by a decrease of other polluters discharged (from industrial, farm
and agricultural waste, which contain for instance high quantities of nutrients, such as nitrogen and phosphorus).

36
environmental danger. In principle, when this situation occurs, a technically feasible do-
minimum intervention, at the same time different from the project itself and capable of
achieving the same goals, should be used as a counterfactual. However, as
acknowledged by the EC Guide (2014), the identification of a do-minimum is often not
feasible. Business-as-usual thus represents the only basis for comparing costs and
benefits. Following this line of reasoning, the BAU was considered an acceptable
counterfactual for the ex-post CBA of the Malta WWTP, as the only technically feasible
basis for comparison of costs and benefits. However, penalties for non-compliance with
prevalent legislative requirements have been included in the financial analysis as
suggested by the EC Guide.
The results of CBA as included in the Annex II to this report indicate that the project
adds value to the European society under the social and economic points of view. In the
baseline case, the Socio-Economic Net Present Value (ENPV) equals EUR 122,680,685
million, with the applied discount rates of 5.64% backward and 6.80% forward, whereas
the Economic Internal Rate of Return is at the level of 12.89%. In addition, the risk
analysis indicates that the CBA outputs appear to be pretty robust to future possible
variations in the key variables, and that overall the project has a not negligible risk
level. The distribution of benefits in the CBA is presented in the figure below.
Figure 12. Main socioeconomic effects
Source: Authors
In addition to these measurable impacts, there are also other effects which are however
difficult to be captured in monetary terms, but relevant for the comprehensive
assessment of the project, which are discussed in the following sub-chapters.
The table below summarises the nature and strength of the project’s effects classified
under the above referred four categories (economic growth, quality of life and well-
being, environmental sustainability and distributional issues), as well as the territorial
levels where these are visible, and the time-horizon of their materialisation.
Non-use value of clean
seawaterUse value for bathing and
recreational purposesChange in value of real
estateGHG emissions
Value of the effect €279,085,143.93 €102,450,896.18 €(355,239.34) €(15,328,143.11)
-50,000,000
0
50,000,000
100,000,000
150,000,000
200,000,000
250,000,000
300,000,000

37
Table 5. Summary of nature and strength of effects (the effects highlighted in
green are those included in the ex-post CBA)
CATEGORY EFFECT STRENGTH* LEVEL
Economic
growth
Variation in quantity of water supplied
and wastewater treated +3 Local – regional
Variations in the reliability of water
sources and water supply N.R.
Variations in water quality N.R.
Variation in resource savings (water
preserved for other uses) +1 Local – regional
Variation in operating costs N.R. Local – regional
Wider economic impacts +2
Institutional learning N.R.
Quality of life
and well-being
Variations in the number of users
served by water supply N.R.
Variations in the service quality N.R.
Variations in human health and
hygiene +1
Local – regional
Variations in the living attractiveness
of the area +2
Local – regional
Environmental
sustainability
Variations in GHG emissions -2 Global
Variations in contamination of air,
water, and soil +5 Local – regional
Variations in the protection and
resilience of natural resource systems N.R.
Variations in biodiversity +3 Local – regional
Variations in climate change
resilience N.R.
Distributional
effect
Social cohesion N.R.
Territorial cohesion N.R.
*Note: the strength score reflects the weight that each effect has with respect to the final judgment of the project. In
particular:
-5 = the effect is responsible of the negative performance of the project;
-4 = the effect has provided a negative contribution to the overall performance of the project;
-3 = the effect has contributed in a moderate negative way to the performance;
-2 = the effect has a slightly negative contribution to the project performance;
-1 = the effect is negative but almost negligible within the overall project performance;
0 = the effect has no impact on the project performance;
+1= the effect is positive but almost negligible within the overall project performance;
+2 = the effect has a slightly positive contribution to the project performance;
+3 = the effect has contributed in a moderate positive way to the performance;
+4 = the effect has provided a positive contribution to the overall performance of the project;
+5 = the effect is responsible of the positive performance of the project;
N.R. = The effect is not relevant for the specific project;
No data = The effect is potentially relevant, but no evidence on impacts is available. This shall be used only for relatively low
significant effects whose inclusion would in no case dramatically affect the overall assessment.
The following sub-chapters include some more detailed description of the effects
incorporated in the ex-post CBA and/or supported by available qualitative evidence
either from documental sources or interviews.

38
3.2. EFFECTS RELATED TO ECONOMIC GROWTH
Measurable effects
The effects of this major project related to economic growth cannot be measured but
rather discussed in a critical qualitative analysis. This derives from a difficulty in
disentangling the actual project’s contribution to economic development from the one
of other investments and from the broad macroeconomic trend in Malta.
Non-measurable effects
The project represents the first necessary step in WSC’s strategy to address
problems of chronic over-extraction of groundwater mainly for irrigation
purposes. in line with this strategy, in September 2018 a wastewater polishing plant
which produces 9,600 m³ per day of water of near potable quality intended for irrigation
was inaugurated in Ta’ Barkat. The use of this treated effluent, called new water,
reduces the dependency of farmers on groundwater reserves which, in case of ‘over-
extraction’, can suffer from increased salinity (particularly in proximity of the coast) and
indirectly from nitrates concentration in water (due to agricultural activities).
Moreover, it is worth noting that during the winter rainy season when agricultural
demand for new water is very low, the latter is planned to be treated to an even higher
standard and used for aquifer recharging. The new investment, therefore, aims to
ensure the actual provision of an alternative good quality supply of water to farmers
and reverse decades of damage to the aquifer.
The water polishing plant at Ta’ Barkat represents the third investment of this type. The
first New Water plant in Malta North was inaugurated in May 2017 and has since
provided high-quality water to farmers in the Mellieha, Manikata and Pwales areas. The
second plant was inaugurated in July 2018 in Gozo to supply water to the farming
community in Malta’s sister island. New water is accessible through hydrants which are
activated through electronic cards. The farmers’ demand for new water is high as it
represents security in terms of supply. Furthermore, a more reliable supply allows to
cultivate products which need a constant irrigation, and enables farmers to make
investments based on more certainties and less risk.
“The quality of this water is exceptional and farmers who do
not have the network of this water close to their fields are
very annoyed that this water is not being made available to
them.” (declaration by the head of the Centre for Agriculture,
Aquatics and Animal Sciences)39
While new water is generating benefits for local farmers, it has not been included
in the ex-post CBA because it cannot be directly attributed to the construction of the
sewage treatment plant. On the contrary, it represents a direct effect of the subsequent
water polishing plant opened in 2018. In the framework of a qualitative assessment,
anyway, the fact that the Malta South sewage treatment plant enabled the
39
https://www.maltatoday.com.mt/environment/nature/87632/soaring_demand_for_new_water_by_farmers#.W_PoCpNKg2w

39
implementation of additional fundamental investments must be highlighted and singled
out as a major achievement.
As regards tourism and economic development, the Malta South plant
contributed to triggering a positive dynamic. However, as further investments in
other sectors (notably in public transportation) have been implemented in the same
area as well, the plant cannot be singled out as the only driver of touristic and economic
growth.
According to interviewed stakeholders, the project was helpful in providing an enhanced
environmental context in the area (particularly through the removal of visible sewage
patches in the sea and odours), which benefited for instance both the Rinella film studios
and Smart City in Kalkara, a large new settlement for economic, industrial and
technological activities, whose first offices opened in 2010 and which is still partly under
development.
Moreover, tourism is reported to be slowly coming back to the south-eastern coast of
Malta, partially reversing an exodus of both domestic and international tourism towards
the north, which had started back in the 1970s and 1980s. Increasing flows have been
reported particularly in Vittoriosa (or Birgu, the most popular destination among the so-
called Three cities) and in Marsaxlokk in the south (where for instance the fish market
is becoming very popular). Both in Marsaxlokk and Marsascala, moreover, many
applications for small hotels are reportedly being submitted, and sharing economy
businesses (e.g. Airbnb) are flourishing. Beyond accommodation, however, tourism in
Malta South should be assessed also in terms of visitors, and not only in terms of those
staying in the area overnight. In this regard, a particularly telling development concerns
the “Rolling geeks”, i.e. a tour operator which now brings tourists to the area with
electric vehicles, leaving from the Three cities. This general positive trend is not likely
to be reversed in the future, in the light of the fact that additional projects and
investments are planned, which have a potential to become touristic attractions. In
particular, the Malta Tourism Authority, helping a local foundation, is today contributing
to the restoration of a coastal tower in the area, and the whole stretch of coast between
Xghajra and Marsascala has been designated to be a national park. While reportedly few
resources have been invested in this park so far, this designation has been very
significant because it protects the area from constructions and from a planned road.
Furthermore, Fort Rinella, managed by an NGO called Wirt Artna, is being promoted as
an attraction for visitors. More broadly, in the framework of the EU project ThreeT –
Thematic Trail Trigger (within Interreg Europe) Malta has proposed the creation of a
coastal walk, which could further enhance touristic and economic growth in the south-
east.
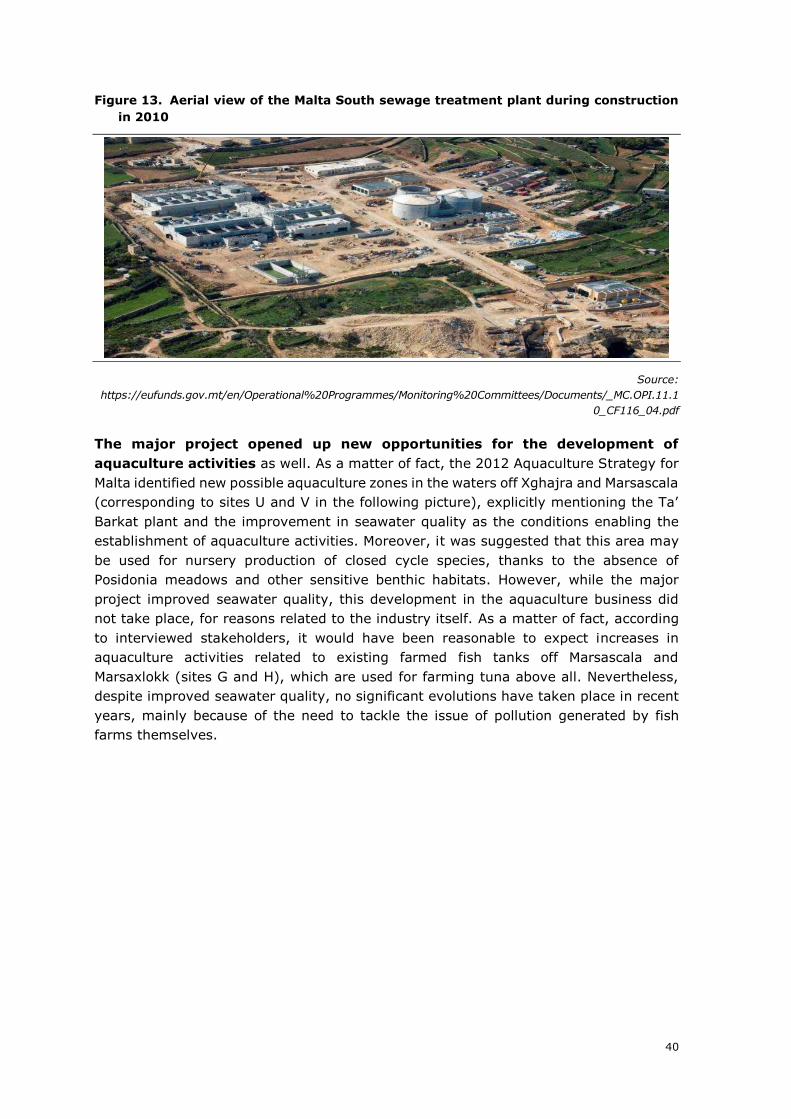
40
Figure 13. Aerial view of the Malta South sewage treatment plant during construction
in 2010
Source:
https://eufunds.gov.mt/en/Operational%20Programmes/Monitoring%20Committees/Documents/_MC.OPI.11.1
0_CF116_04.pdf
The major project opened up new opportunities for the development of
aquaculture activities as well. As a matter of fact, the 2012 Aquaculture Strategy for
Malta identified new possible aquaculture zones in the waters off Xghajra and Marsascala
(corresponding to sites U and V in the following picture), explicitly mentioning the Ta’
Barkat plant and the improvement in seawater quality as the conditions enabling the
establishment of aquaculture activities. Moreover, it was suggested that this area may
be used for nursery production of closed cycle species, thanks to the absence of
Posidonia meadows and other sensitive benthic habitats. However, while the major
project improved seawater quality, this development in the aquaculture business did
not take place, for reasons related to the industry itself. As a matter of fact, according
to interviewed stakeholders, it would have been reasonable to expect increases in
aquaculture activities related to existing farmed fish tanks off Marsascala and
Marsaxlokk (sites G and H), which are used for farming tuna above all. Nevertheless,
despite improved seawater quality, no significant evolutions have taken place in recent
years, mainly because of the need to tackle the issue of pollution generated by fish
farms themselves.

41
Figure 14. Existing (red) and potential new (green) aquaculture sites, according to the
2012 Aquaculture Strategy
Source: 2012 Aquaculture Strategy. Site F corresponds to an offshore aquaculture zone 6 km off the coast,
established in 2006 and used for tuna ranching activities.
3.3. EFFECTS ON QUALITY OF LIFE AND WELL-BEING
According to field interviews, project effects were clearly perceived by the local
population, as the ex-ante situation was particularly dramatic and an improvement of
wastewater management was urgently required. Today, inhabitants benefit from a
general improvement in wellbeing, as a result of the enhancement of the living
environment. More specifically, the possibility of enjoying a clean seawater, the
reduction of bad and persistent odours from the old outfall, and the increase of buildings’
economic value are the main factors which positively affect the beneficiaries’ quality of
life. On the contrary, a negative impact – although a minor one – was generated for real
estate value in the vicinity of the plant.
The benefit generated by the possibility to use clean seawater for recreational purposes
was quantitatively assessed in the ex-post CBA. A quantitative measurement was
carried out as well for the loss in real estate value near the plant. As regards real estate
in the wider area instead, a quantification of the increase in its value has not been
performed due to the impossibility to disentangle the contribution of the major project
from the impact of other investments.

42
Measurable effects
The positive effect of the increased wellbeing for the resident population affected by the
old outfall has been valued by estimating the willingness to pay (WTP) for an
improvement of the seawater quality. In particular, the WTP of residents of the four
districts served by the plant for using good quality seawater for recreational activities
(e.g. for bathing or diving) has been considered in the ex-post CBA. To estimate such
WTP, the value transfer approach has been adopted, by considering a 2011 study for a
wastewater treatment and restoration project in Spain, on the country’s Mediterranean
coast40. The project was selected from the EVRI repository, after considering studies
similar to the Maltese case. The search for the most suitable study for the benefit
transfer greatly benefited not only from the vast EVRI database, but also from a 2009
paper focusing on the valuation of natural marine ecosystems41. This scientific article
specifically reviews valuation studies performed in the Mediterranean and Black Sea
region and addressing: a) the management of marine environments in order to sustain
selected goods and services; b) the economic valuation of relevant recovery/policy
actions. Significantly, the paper highlights the utility of value transfers, for instance in
relation to pressures such as biodiversity loss, eutrophication and water contamination,
common for many maritime regions.
After adjusting the WTP use value identified by the Spanish study to the context of Malta
(for details see Annex II), the willingness to pay (EUR 10.65 in 2010, at 2018 prices)
was multiplied with the resident population of ten abovementioned localities. As a result,
the estimated socio-economic use value for an increase in the quality of seawater
amounts to EUR 102 million over the chosen time horizon (at 2018 prices, discounted).
At the same time, the project caused a variation in the living attractiveness of the area.
On the one hand, a slight decrease in the value of real estate in immediate proximity to
the sewage treatment plant (within 200 meters from it) occurred. This effect, which had
already been considered in the ex-ante CBA, has been measured in the ex-post CBA as
well.42 According to the ex-post CBA, this negative externality amount to less than EUR
360,000 (discounted) over the time horizon of 30 years. On the other hand, the increase
in value of real estate in the wider area including the village of Xghajra and nearby
agglomerations on the coast could not be directly and univocally attributed to the
sewage treatment plant, and therefore has not been included in the ex-post CBA.
Non-measurable effects
Interviewed stakeholders emphasised that the only concerns for Xghajra residents
regarding the South sewage treatment plant are caused by generated odours that
intermittently fall over the locality and the sludge transportation from the plant to the
landfill site43. Beyond this, the local population is reported to be satisfied with the project
40 Perni, A., Martínez-Carrasco, F. and Martínez-Paz J. M., 2011. Economic valuation of coastal lagoon
environmental restoration: Mar Menor (SE Spain), in “Ciencias Marinas”, Volume 37(2), pages 175–190. Available at: https://pdfs.semanticscholar.org/a2c2/3438281cfe4e15e052dfdbca2850c6351d13.pdf. 41 Remoundou, K., Koundouri, P., Kontogianni, A., Langmead, O., Nunes, Paulo A.L.D, Skourtos, M., 2009.
Valuation of Natural Marine Ecosystems: An Economic Perspective. 42 The approach to its monetisation, however, has slightly changed, since only areas already developed into
real estate have been considered, while areas merely developable into real estate have been excluded from the computation. 43 These odours could stem from a partial malfunctioning of the plant (none has been reported), or from
specific incoming flows of sewage.

43
outcomes. Therefore, there is a shared consensus that social happiness generated after
the project’s completion fully offset the inconveniences arising during the construction
phase: bad odours, noise and traffic jams caused by the necessary works.
As a final remark, it is worth noting that although with some delay, in 2016 the
implementation of a landscaping scheme atop of a constructed soil embankment, in an
attempt to mitigate the adverse visual impact created by the existing South Sewage
Treatment Plant at Ta' Barkat, was also performed. Nowadays, the plant is almost
invisible from Xghajra and in the near future, as part of the scheme, over 190 trees will
be planted.
3.4. EFFECTS ON THE ENVIRONMENTAL SUSTAINABILITY
Measurable effects
The project implementation produced positive environmental effects. While sewage was
largely discharged untreated into the sea before the project, in 2014 the concentration
of BOD₅ and COD in wastewater treated by the plant amounted to 28.01 mg/l and
208.85 mg/l respectively, against values in incoming wastewater of 477.47 mg/l and
874.21 mg/l44. The provision of the south of Malta with wastewater treatment drastically
reduced the amount of sewage directly discharged into the sea, which was affecting the
natural ecosystem of the coast on the 5 km coastline between Rinella and Marsascala,
for instance through the generation of a different community of algae.
Moreover, an assessment on the status of biological quality elements (as monitored
under the Water Framework Directive) for the Marsascala Bay, which is situated
downstream of the prevalent currents from the discharge point at the Ta’ Barkat sewage
treatment plant, is provided by the Second Water Catchment Management Plan for the
Malta Water Catchment District 2015-2021, released by the Environment and Resources
Authority. According to it, a first monitoring of biological quality elements within the bay
showed that phytoplankton was of moderate status, but macroalgae and Posidonia
oceanica grasses were of high to good status.
Very recent data from the State of Environment Report 2018 released in November
2018 by the Environment and Resources Authority offers insights on four biological
quality elements defining the ecological status of the coastal waters off Xghajra. Benthic
invertebrates are of high status, macroalgae and Posidonia oceanica are of good status,
while phytoplankton remains at moderate status.
In the ex-post CBA, the value of the pure existence of clean seawater (i.e. the decrease
in seawater contamination) has been monetised. A non-use value has been attached to
the benefit of cleaner seawater, and its computation has been carried out, as in the case
of the use value previously discussed, through the benefit transfer method.
The study focusing on a sea locality on Spain’s Mediterranean coast (already used to
compute the use value) offered a differentiation between a WTP for use value and one
for non-use value. Therefore, and in light of the similarities (in terms of geographic
44 Despite these removal rates of BOD₅ (94%) and COD (76%) in 2014, these values still do not comply with
the UWWTD requirements (25 mg/l for BOD₅ and 125 mg/l for COD).

44
position, project type, environmental conditions) with the Ta’ Barkat project, the WTP
for non-use identified by the Spanish study was adopted as the reference value.
The average yearly amount an individual would be willing to pay for the pure existence
of good seawater (EUR 18.93 in 2010, at 2018 prices) was adjusted to the Maltese
context, and then multiplied with the population equivalent of the sewage treatment
plant, i.e. 500,00045. The choice to attribute the willingness to pay for non-use to the
total population equivalent has been taken in order to capture not only the non-use
benefits generated for households, but also those for the commercial, touristic, artisan
users and others.
As a result, the estimated socio-economic non-use value for an increase in the quality
of seawater amounts to EUR 279 million over the chosen time horizon (at 2018 prices,
discounted).
A different environmental aspect concerns GHG emissions generated by the plant, which
requires energy for operating. The plant is characterised by a system of energy
recovery, which comes about during the treatment of sludge. More precisely, energy is
generated through three gas engines, which allow to provide 30% of the plant’s power
needs, corresponding to 1 MW. However, both emissions produced by energy acquired
from the network and by self-generated energy constitute a negative externality of the
project, which has been quantitatively measured in the ex-post CBA. In addition, GHG
emissions caused by the transport of sludge and screenings have been included in the
analysis as well.
According to the ex-post CBA results, the monetised cost of emissions from the use of
acquired energy amounts to EUR 14.9 million over the 30-year timespan (at 2018 prices,
discounted). Emissions from sludge transport generate a cost of less than EUR 450,000
(at 2018 prices, discounted).
Non-measurable effects
The pre-existing situation, with the discharge of raw sewage into the sea, generated a
different community of algae in the seawaters46. Due to the high-nutrient content of
untreated wastewater, the marine alga called Dictyopteris polypodioides displaced other
species unfit to adapt to such nutrient load47. By decreasing the effluent’s nutrient load,
the major project contributed to safeguarding marine biodiversity.
3.5. EFFECTS RELATED TO DISTRIBUTIONAL ISSUES
The project did not produce measurable effects in terms of either territorial or social
cohesion. However, it can be underlined that the project, together with other
investments in different sectors (e.g. transport), contributed to triggering economic
45 The population equivalent’s evolution throughout the time horizon was linked to demographic growth in
the area served by the sewage treatment plant. 46 Axiak V., 2004. National Diagnostic Analysis for Malta - National Action Plan for Malta for the Reduction
and Elimination of Land Based Pollution, p. 23. 47 According to the study, with increasing distance from the old submarine pipeline, degradation diminished,
and disappeared almost completely about 3 km from the pipeline.

45
development and a positive change of image in an area previously not considered as a
good destination for neither domestic nor foreign visitors.
3.6. TIME SCALE AND NATURE OF THE EFFECTS
The project operation started in June 2011, which means that consolidated quantitative
data and other pieces of evidence are available for seven years since project completion.
Therefore, sufficient information was collected to assess the time-scale of effects
materialisation in the longer run.
The observed effects materialised in the short run and they are expected to be
maintained in the long run. However, their intensity may change to some extent
during the project lifetime, based on the answers which will provided to the issues
of farm waste discharge and sludge landfilling.
With reference to the spatial scale of the effects, it should be noted that all of them are
of predominantly local nature. However, given the country’s limited extension, a broader
national impact cannot be excluded. The only exception is represented by the
environmental sustainability effect resulting from emissions from energy use, which
contributes to a small extent, but in a negative way, to a development at the global
level.
Table 6. Temporal dynamics of the effects
CATEGORIES
OF EFFECTS
SHORT
RUN
(1-5
YEARS)*
LONG
RUN
(6-10
YEARS)*
FUTURE
YEARS* COMMENT
Economic
growth + + ++
The major project contributed to
triggering touristic and economic
development on Malta’s south-eastern
coast. While the project opened up
opportunities for aquaculture, an
increase in this business did not come
about. The project enabled the
implementation of a water polishing
plant, whose effects (high-quality water
provision for agriculture) cannot be
attributed to the sewage treatment
plant.
Quality of life
and well-
being
++ +++ +++
The project created the possibility to use
clean seawater for recreational
purposes. Additionally, it led to a slight
decrease in the value of real estate in
immediate proximity to the plant, and
an increase in real estate value in the
wider area. While today some odours
are intermittently generated by the
plant, the project led to a reduction of
bad odours and unpleasant sights
caused by the old outfall.
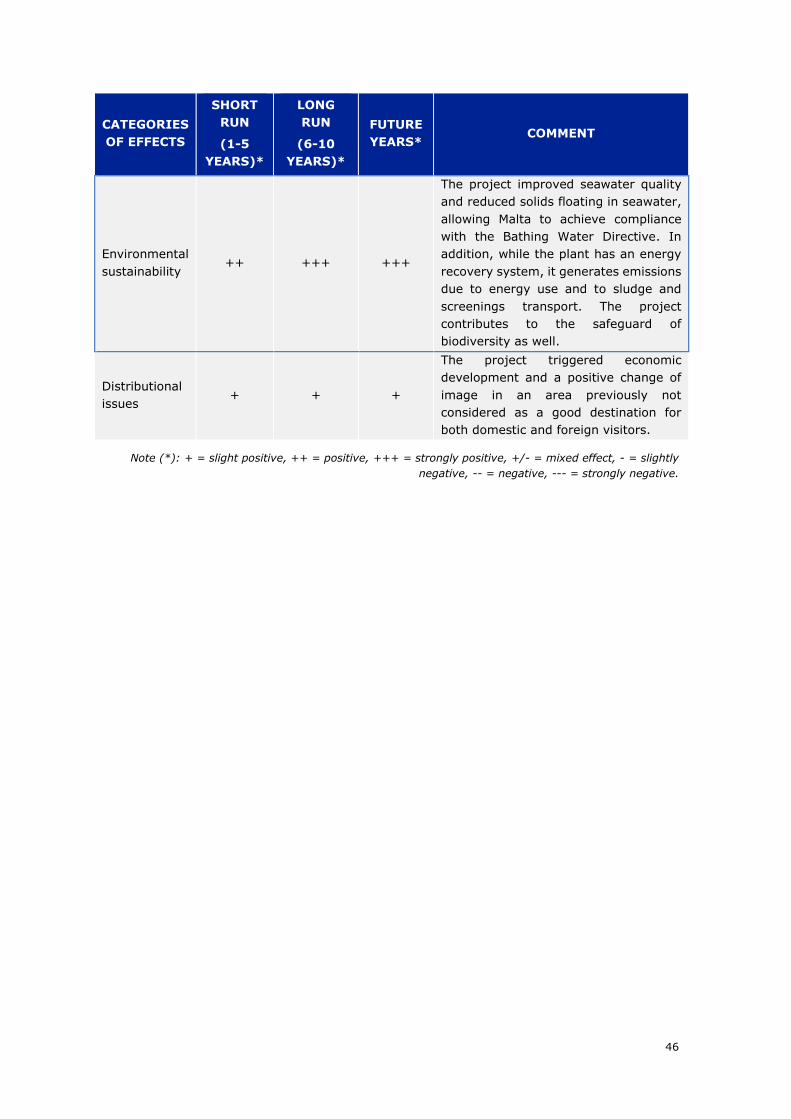
46
CATEGORIES
OF EFFECTS
SHORT
RUN
(1-5
YEARS)*
LONG
RUN
(6-10
YEARS)*
FUTURE
YEARS* COMMENT
Environmental
sustainability ++ +++ +++
The project improved seawater quality
and reduced solids floating in seawater,
allowing Malta to achieve compliance
with the Bathing Water Directive. In
addition, while the plant has an energy
recovery system, it generates emissions
due to energy use and to sludge and
screenings transport. The project
contributes to the safeguard of
biodiversity as well.
Distributional
issues + + +
The project triggered economic
development and a positive change of
image in an area previously not
considered as a good destination for
both domestic and foreign visitors.
Note (*): + = slight positive, ++ = positive, +++ = strongly positive, +/- = mixed effect, - = slightly
negative, -- = negative, --- = strongly negative.

47
4. MECHANISMS AND DETERMINANTS OF THE OBSERVED
PERFORMANCE
In this section the key mechanisms and determinants of the long-term effects discussed
in the previous chapter are illustrated and discussed along the different phases of the
project cycle. Finally, the importance of each determinant for the project’s final
performance and the interplay between them and the observed outcomes is discussed.
Table 7. Determinants of project outcomes
DETERMINANT STRENGTH*
Relation with the context +4
Selection process +5
Project design +4
Forecasting capacity -2
Project governance +3
Managerial capacity +4
Note: * the strength score reflects the weight of the role that each determinant played with respect to the final judgment of
the project. In particular:
-5 = the determinant is responsible of the overall negative performance of the project;
-4 = the determinant provides a negative contribution to the overall performance of the project; -3 = the determinant contributes in a moderate negative way to the overall performance of the project;
-2 = the determinant has a slightly negative contribution to the project overall performance;
-1 = the determinant plays a negative but almost negligible role to explain the overall project performance;
0 = the determinant does not play a role on the project overall performance;
+1= the determinant plays a positive but almost negligible role to explain the overall project performance;
+2 = the determinant has a slightly positive contribution to the project overall performance;
+3 = the determinant contributes in a moderate positive way to the overall performance of the project;
+4 = the determinant provides a positive contribution to the overall performance of the project;
+5 = the determinant is responsible of the overall positive performance of the project.
4.1. RELATION WITH THE CONTEXT
The project’s context was greatly favourable to its planning and
implementation. At the time when the project was conceived, the Maltese wastewater
treatment system was widely considered unsatisfactory and environmentally
unsustainable due to discharge of wastewater without treatment into the sea. Hence,
the urgent need to provide a solution to the wastewater treatment issue, so as to comply
with EU Directives (Urban Wastewater and Bathing Water Directives) as well as the
Coastal and Marine Policy, had strong relevance in the justification and conception of
the project. As a matter of fact, Malta’s failure to comply with these EU Directives would
have resulted in likely infringement fines.
The project thus directly addressed a major pressing problem and its high
appropriateness to the context was confirmed by the lack of opposition from local
associations or the population.
As regards the project’s secondary goals, the need for improving the touristic
attractiveness of the Xghajra area was impelling as well. In order to contrast it with its
current improved image, the Xghajra area was described by interviewed stakeholder as
being in the past “something out of a Western movie”, “a no-go area” for tourists.
Degraded coast kept tourists away from the south-eastern coast, and incoming flows
very largely focused on the northern areas. According to interviewees, both local
businesses and citizens were highly concerned about the situation, particularly in terms

48
of odours, visible patches in the sea, sewage plume on the coast and generic bad
reputation. In particular, the Rinella film studios and aquaculture and fish farms off
Marsascala and Marsaxlokk were reportedly highly affected by the problem. In the case
of the film studios, specifically, the situation limited the attractivity of one of their major
assets for film producers, its two infinity pools, which are reported to be the biggest
ones in the Mediterranean Sea. These pools allow film directors to create storms and
other water effects, while having the real Mediterranean behind them as a background.
Understandably, the film studios frequently faced strong complaints by producers and
directors, because the sea outside the film studios was dirty due to the presence of
sewage, and very unpleasant to see.
The location of the plant, thanks to the pre-existence of sewerage infrastructure already
conveying wastewater to that area of the island, was not controversial either48.
The very positive impact of the relation with the context on the eventual project
performance was partially attenuated by the existence of illegal connections discharging
farm waste into the sewerage network. The seriousness of this problem, that has
hampered the smooth functioning of the plant, strongly increased in 2012 due to the
implementation of the Nitrates Action Programme by the national government. On the
one hand, the problem was already known at the time of project design, and its solution
should have been the target of specific investments. On the other hand, before 2012
the problem concerned mainly waste produced by pigs, which does not clog and does
not hamper the plant’s functioning, as opposed to waste of cattle. In any case, this
problem could not be solved in any way by the major project, but rather by a
comprehensive strategy of investments.
A similar limitation to the highly positive relation with the context concerns sludge
management. The lack of alternatives for sludge disposal other than landfilling
represents a significant and negative contextual element that the major project had to
be confronted with.
Overall, however, the relation with the context represented a decisively positive
determinant for the project performance. The fact that the project offered a
solution to an unsustainable practice, combined with both internal consensus (from the
population and businesses) and external pressure (from international obligations)
offered a wide window of opportunity for the implementation of the plant.
Over the years, the project has remained highly relevant and the need for it (and for all
its components) is likely to persist for all foreseeable future.
4.2. SELECTION PROCESS
The origin of the selection process leading to the public investment decision
dates back to 1992, when the Sewerage Masterplan for Malta and Gozo was drafted.
A number of projects were proposed to strengthen the wastewater collection and
transport network, and the need for three new wastewater treatment plants was in
48 The selection of the precise location of the plant was carried out after an analysis of different options by
WSC during the preparation phase. Source: project dossier.

49
particular identified at the heart of this plan.49 As said, in 2000 a feasibility study
focusing on the South of Malta (Kocks 2000, Sewerage Infrastructural Upgrading in the
South of Malta) was prepared. This feasibility study first identified the interventions that
would later (after some modifications) become the components of the future Malta
South Sewage Treatment Plant major project.
After in 2005 the Maltese government started an informal exchange with the European
Commission on the South sewage treatment plant, in 2006 the option analysis of the
2000 report was updated (Kocks 2006, Report). In 2007, a first version of the project
was then proposed for ERDF funding. Eventually, however, it was swapped with a flood
management project proposed for CF funding.
The option analysis was further updated by WSC in 2007 and revised in 2010 through
a new feasibility study which aimed to reflect changed circumstances, e.g. the need for
a new site for the plant, due to the unavailability of the originally identified site (Wied
Ghammieq, between Rinella and Xghajra) and an updated assessment of the Sant
Antnin plant’s capacity. Three options were singled out as a result of amendments
to the 2000 option analysis. Beyond a set of common interventions50, the three options
mainly differed in the destination of the Sant Antnin plant and in the capacity of the new
sewage treatment plant.
The first option51 included the upgrade of the operating Sant Antnin plant (from a
treatment capacity of 6,000 to 18,000 m³/day, tripling the population equivalent from
50,000 to 150,000) and the construction of a new sewage treatment plant in Ta’ Barkat,
with a treatment capacity of 42,000 m³/day and a population equivalent of 350,000.
The second alternative consisted in the continued usage of the Sant Antnin plant with
6,000 m³ of wastewater treated per day and an assured reduction of the biological load
not above 18,000 PE. Accordingly, the sewage treatment plant in Ta’ Barkat would be
have been sized for 54,000 m³/day and 482,000 PE.
Finally, the third option advanced the idea of phasing out the Sant Antnin plant, as
opposed to upgrading it or maintaining its existing use. No new utilisation for the Sant
Antnin plant was included in this alternative. The Ta’ Barkat plant would treat 60,000
m³/day instead, covering a population equivalent of 500,000 PE.
According to the 2010 study, this last option represented the most convenient choice in
terms of investment costs, yearly operation costs, and reinvestment costs as well.
However, these were not the only considerations favouring this alternative over the
other two.
49 The two smaller sewage treatment plants (in Gozo and Malta North) were built and became operational
before the Malta South plant. Lessons learned during their implementation were reportedly useful for the bigger challenge represented by the Ta’ Barkat infrastructure. 50 Construction of a new pumping station in Rinella; upgrading of the existing Xghajra pumping station;
construction of new 1.7 km gallery from Rinella to Ta’ Barkat; construction of new 1 km submarine outfall. 51 The first option was originally labelled “Option 1A” as a result of the review conducted on the 2000 option
analysis. The second alternative was “Option 1B”. The third alternative was “Option 5” instead, labelled this way because other project alternatives suggested by the 2000 feasibility study had been ruled out.

50
Table 8. Financial aspects of the three options included in the 2010 WSC
feasibility study (in nominal terms, at 2010 prices)
Option Investment costs (EUR
mln)
Yearly operation costs (EUR mln)
Reinvestment costs (EUR
mln)
30-year financial NPV, 5% discount
rate (EUR mln)
1 67.9 4.5 8.2 139.8
2 69.2 4.6 8.8 143.0
3 67.4 4.2 5.0 128.7
Source: project dossier
Both options 1 and 2 were characterised by higher energy consumption and a higher
CO₂ footprint compared to option 3. Moreover, they involved extensive trenching works
in congested residential areas, while option 3 required the least amount of trenching
works (only 3 km), and not in residential areas. Therefore, option 3 was considered
the most advantageous alternative.
In June 2010, the major project application form and the required ex-ante CBA were
submitted to the European Commission in line with this revised option analysis and
benefitting from JASPERS assistance. The Decision by the Commission financing the
major project was released in November 2010.
The European Commission did not have a significant role during the project selection
phase (except for Jaspers’ support) and could hardly have any, since the formal
application for the financing decision was submitted when the project construction was
already under way.52 In fact, the tender for construction had already been launched in
April 2007, project construction was started in December 2008 and concluded in October
2010.
Overall, it can be highlighted that the selection process was initially very well-
structured: a need was first identified and a strategic approach adopted in line with the
original Masterplan, and an option analysis was carried out and subsequently refined.
On this point, it may be argued that the 2010 ex-ante CBA was not a step directly
supporting the selection process, because the actual option analysis had already been
conducted. The ex-ante CBA can rather be seen as compliance-driven, linked to the
purposes of the major project application form, and not much to the decision-making
process.
Beyond the option analysis for the overall project, technical alternatives were analysed
as well during the project preparation phase. The biological aerated filters technology,
which provides operational flexibility and a small footprint of the plant, was selected
among alternative solutions. In order to select this technology, clear criteria for the
selection of the process were first established (among which resilience to shock loads,
reduction of the plant’s life cycle costs, and simplicity of operation and maintenance).
Subsequently, seven treatment processes were considered, and four of them shortlisted
for a closer scrutiny: the conventional activated sludge (belonging to the category of
suspended growth activated sludge processes), the moving bed biofilm reactor and the
52 As a matter of fact, interviewed stakeholders confirmed that Malta has a practice of submitting projects to
the European Commission when they are already at a very advanced stage, after conducting informal exchanges of opinions.

51
biological aerated filter (both belonging to the category of attached growth activated
sludge processes) and the membrane bioreactor (a membrane activated sludge
process). The biological aerated filters technology was chosen for the quality of its
expected results in comparison with those of the other processes. Specific advantages
consisted in a normal level of complexity of operation, a very good flexibility of operation
during storm water peaks, a limited footprint, a reasonable level of capital costs
required, and a solid application history.
On a different note, the fact that the inclusion of a polishing unit within the plant was
not assessed in the option analysis may raise some doubts in hindsight, because this
enhanced solution would have likely yielded higher benefits. However, interviewed
stakeholders reported that, while this option was mentioned during the project
preparation phase, the choice was taken to prefer investing in the sewage treatment
plant first, based on the most urgent needs at the time and the available resources. Due
to the lack of this component, however, an additional project had to be developed after
the sewage treatment plant’s entry into operation, aiming at the construction of a
polishing plant which was finally inaugurated in September 2018. With hindsight, this
choice revealed to be appropriate in the light of problems they encountered with illegal
farm waste which would have hampered the functioning of the polishing plant.
In conclusion, a final assessment of the selection process must recognise its
very positive impact on the general project performance. A well-structured
pattern was followed to select the project idea, and alternatives were duly considered
with the help of specialised technical experts.
4.3. PROJECT DESIGN
A new centralised plant providing wastewater secondary treatment was designed in line
with the most advantageous alternative identified by the option analysis. The design
of the project components proved to be logical and cost-effective, positive
influencing the eventual project performance.
The wastewater treatment plant was designed in its key part by engineering
companies53 formed by academic researchers with relevant international experience.
They were responsible for designing the Advanced Aerobic Biological Filtration and
Oxygenated Reactor (BIOFOR) building within the plant.
Project design stemmed from the abovementioned sound analysis of different technical
alternatives, based on clear selection criteria. As a result, project design positively
influenced the eventual performance of the plant because it ensured
flexibility54, while at the same time limiting the capital costs and the plant’s
footprint.
As part of the major project, a 1 km long sea outfall was included in order to discharge
the treated effluent away from the coast. This component was successful in addressing
concerns of the local population, who were worried about possible negative impacts in
53 Italian companies Corsa Srl and ASDEA - Advanced Structural Design & Analysis Srl. 54 A very good flexibility of operation (e.g. during storm water peaks) was specifically ensured by the choice
of the biological aerated filter technology (thanks to the “attached growth” process).
52
case of technical dysfunctions. As such, the outfall enhanced the overall acceptability of
the project for the neighbouring community55.
Overall, project design enabled the fulfilment of the identified needs. Moreover,
no technical issues reportedly emerged during the construction stage, no significant
modifications were introduced inconsistent with the original design, and the risk of cost
overruns during construction because of inappropriate technical solutions was
successfully avoided.
During the operation phase, operational dysfunctions at the plant were due to farm
waste discharge into the sewerage networks and, to a lesser degree, to the presence of
salt in sewage because of seawater infiltration. Such dysfunctions, however, cannot be
attributed to failures in the project design. In particular, the design could not have
accommodated for the farm waste discharges, since these represent illegal practices
whose solution had to be found through different interventions.
4.4. FORECASTING CAPACITY
Population has grown strongly in Malta during the last years (+17% in the country
between 2007 and 2018). The population equivalent (500,000) on which project design
was based referred to a resident population of about 320,000 in 2017 in the four districts
served by the plant. Already in 2017, however, population in this area has reached
364,000, and forecasts show a persisting growth for the next years. For these reasons,
some interviewees have raised the reasonable doubt whether, should the current growth
rates persist, the plant will be able to cope with an increased demand. On this point, it
is worth noticing that, based on data on the total wastewater treated in Malta provided
by Managing Authority and WSC and assuming that the Malta South plant will treat 80%
of it in the future (as planned), its full capacity (60,000 m³ of wastewater treated per
day) will be exceeded in 2019 and 2020, and constantly from 2024 onwards. In 2035,
its highest value will be reached, with 67.7 million m³ treated per day.
These circumstances cause serious doubts on whether the flexibility granted by the
chosen technology will be sufficient to cope with this increasing demand, and if no
additional investments to increase the plant’s capacity will be needed. In the same line,
similar doubts concern the treatment capacity of generated sludge, which shall increase
accordingly.
In comparison to the forecasts made ex-ante56, reality has shown that there were some
underestimations, but at the time the figures on demographic growth were taken from
official estimates by the National Statistics Office. As a matter of fact, demand increased
more than expected (about 5%, not considering farm waste). Consequently, the plant’s
full capacity is now foreseen to be reached ahead of schedule, i.e. before 2023. In more
55 While the overall location of the pipeline was dictated by the location of the sewage treatment plant and
no alternatives could be considered, the pipeline’s route requiring the least rock trimming interventions was selected, on the basis of a side scan survey. Source: Environmental Planning Statement for the construction of a submarine outfall for treated urban wastewater (part of the project dossier). 56 Forecasts used for the project design were developed by Kocks Consult GmbH for its technical feasibility
study in 2000. Later E-Cubed, the Maltese consulting company in charge of drafting the cost-benefit analysis in 2010, partially developed own forecasts.

53
general terms, population growth will still definitely constitute a challenge in the
midterm for both the sewerage network and the sewage treatment system57.
Enduring difficulties related to the illegal discharge of farm waste into the sewerage
network have been put forward by the interviewees as one reason justifying operational
dysfunctions at the plant. While it is certainly true that farm waste causes significant
problems to its ordinary functioning, unlawful farm waste connections are by no means
an exceptional event, and they were well-known at the time of the major project
application form’s submission58. Despite the existence of an action plan to stop illegal
farm waste discharge, forecasts on these volumes and the related effects on the plant’s
functioning could have been more prudent and accurate.
On a different note, as already mentioned, the major project application process and
the actual construction started almost simultaneously. Therefore, a comparison between
the actual time schedule and budget and those reported in the application form is not
very telling. Nevertheless, the project implementation was smooth and it proceeded in
accordance with the time schedule and budget provided in the application form. No cost
overrun occurred. On the contrary, total final costs were eventually smaller than
foreseen ex-ante and amounted to EUR 68 million, with a decrease of EUR 2 million
compared to the initially planned EUR 70 million59.
Overall, forecasting capacity has contributed in a slightly negative way to the
overall performance of the project. Demand values turned out to be underestimated
and population growth will remain a source of concerns and challenges in the future.
4.5. PROJECT GOVERNANCE
The organisation in charge of implementing the major project was WSC, which
is today responsible for the management of the plant as well. WSC is a company
founded in 1992, under the Water Service Corporation Act No. XXIII of 1991 and 100%
owned by the Maltese State. Its competences cover the complete drinking water and
wastewater cycle in the Maltese islands, consisting in potable water production and
distribution, sewage collection, treatment and discharge. As such, WSC has had a key
role in the integrated strategic approach to investments in wastewater treatment, which
started in the aftermath of the 1992 Masterplan, but it has also promoted and
implemented investments for instance in desalination plants, in water distribution
networks and in the sewerage network. Its activities appear to be led by a logic of
interrelation between the different infrastructures of the water management system,
whose problematics can be fruitfully addressed only in terms of system.
Specifically, in view of the construction of the Malta South sewage treatment plant and
the other project components, WSC assigned four project leaders to handle the project
supported by KOCKS Consult GmbH and other local engineers, collectively forming a
57 As already mentioned, an attempt to address concerns over the long-term treatment capacity is
represented by the recent tender for the retrofit of the Sant Antnin wastewater treatment plant (Contract CT 3187/2018), which was issued in October 2018 and awarded in December 2018. 58 However, it can be acknowledged that the problem drastically increased only in 2012, due to the
implementation of the national Nitrates Action Programme, in line with the Nitrates Directive. 59 The two main items contributing to the overall decrease in the final costs were “Contingencies” (EUR 1.5
million planned, none disbursed) and “Supervision during construction” (EUR 1 million planned, less than EUR 800,000 disbursed).

54
team of civil and electromechanical engineers in charge of drafting the tender
specifications for all components. These experts supervised works on site as well and
an additional support was provided by Incowest, a consultancy entrusted with project
management.
The same organisational stability enjoyed by WSC does not seem to be seen, at first
sight, in the case of the Managing Authority, i.e. the Planning, Priorities and Coordination
Division. This Division has moved in recent years from the Office of the Prime Minister
to the Ministry for Implementation of the Electoral Manifesto and later to the Ministry of
European Affairs and Equality. However, it should be noted that these changes did not
at all consist in substantial transformations and therefore they did not provide
uncertainty to the stakeholders, nor did they negatively affect the implementation of
projects.
While, on the management side, the situation appears to be very clear, with
WSC being the only operator active in this field in Malta, the picture is not as
straightforward when it comes to public authorities regulating and monitoring
the water and wastewater sector. A surprisingly high number of actors characterises
the institutional framework in this policy area.
Figure 15. Public authorities regulating and monitoring the water and wastewater
sector, with their relevant competences
Source: Authors
The Environment and Resources Authority has competences in the field of coastal
water quality, inland surface water quality, and on biodiversity and ecosystems as well.
In addition, it is in charge of releasing regular State of the Environment reports.
The Malta Resources Authority is in charge of accepting and processing applications
for notifications for the closure, sealing and decommissioning of groundwater sources.
Environment and Resources
Authority
Malta Resources Authority
Energy and Water Agency
Regulator for Energy and
Water Services
Department of Agriculture -
Ministry for Environment
Environmental Health Directorate -
Ministry for Health
Department of Fisheries and Aquaculture -
Ministry for Environment
Agency for the Governance of
Agricultural Bioresources
• Competences in the field of
coastal water quality, inland
surface water quality,
biodiversity and ecosystems
• State of the Environment
reports
• Applications for
notifications for the
closure, sealing and
decommissioning of
groundwater sources
• Water framework regulations
for inland waters
• Protection of groundwater
• Regulation and monitoring of water
production and use
• Regulation of tariffs for water supply
• Monitoring the
presence of
nitrates in water
• Monitoring microbiological
parameters of bathing
water
• Rules for fishing and
aquaculture activities
• Gathering and analysing
biological information to
shape decision-making on
the sustainability of fish
• Addressing the problem
of farm waste discharge
into the sewers

55
Water framework regulations (for inland waters) and protection of groundwater are
among the functions of the Energy and Water Agency, which aims to ensure security,
sustainability and affordability of water.
The Regulator for Energy and Water Services, established in 2015, is responsible
for regulating and monitoring the efficient production and use of water, in order to
ensure a safe and sustainable service for consumers. In particular, it regulates the tariffs
applicable for water (and electricity) supply.
The presence of nitrates in water is monitored by the Agriculture Department at the
Ministry for the Environment, while the Environmental Health Directorate at the
Ministry for Health regularly monitors microbiological parameters of bathing water.
On a different note, the Department of Fisheries and Aquaculture at the Ministry
for the Environment, aiming to guarantee the sustainability of fish species, has the
task of establishing rules for fishing and aquaculture activities. In addition, it gathers
and analyses biological information to shape decision-making on the sustainability of
fish.
Finally, the task to address the problem of farm waste being illegally discharged into
the sewers belongs to the Agency for the Governance of Agricultural
Bioresources, which cooperates to this end with the Malta Council for Science and
Technology.
The presented picture seems to suggest the existence of fragmentation, if not of partial
overlaps of competences. In this regard, recent measures taken in 2015 (e.g. the
creation of the Regulator for Energy and Water Services and the demerger of the Malta
Environment and Planning Authority into Environment and Resources Authority and the
Planning Authority) do not seem to have simplified the institutional setup.
This fragmented framework may generate the doubt whether economies of scale could
be achieved if different arrangements were put in place, in terms of both technical
expertise and cost savings. While the presence of such a high number of institutional
actors may entail mutual checks and balances, and raise the overall level of control in
this sector, doubts can be raised on the efficiency of such institutional structure and
whether cooperation takes place based on streamlined processes or rather just
depending on circumstances, or individual actors’ goodwill.
As regards the major project, however, governance can be seen as a positive
determinant leading to the project’s overall success, particularly thanks to the
solidity of WSC’s organisation and its supervision of the water and wastewater
sector. Minor reservations refer to the doubtful effectiveness of governance
mechanisms to stop illegal farm waste discharges so far, which could have maximised
the project’s impact.
4.6. MANAGERIAL CAPACITY
A very good level of managerial capacity by WSC, the organisation in charge of the
project implementation and of the ordinary management of the sewage treatment plant,
is shown by several elements.
56
The chosen project alternative involved the decommissioning of the Sant Antnin sewage
treatment plant. While no new utilisation of its infrastructures had been decided upon
at the time of the major project application form, the dossier explicitly stated that
utilisation of the existing plant for other purposes was to be endeavoured. In this
context, WSC showed managerial capacity in seizing an opportunity offered by the
construction of the polishing plant for tertiary treatment, inaugurated in September
2018. As a matter of fact, a new use for the Sant Antnin plant has been recently found
through its transformation into the hub for distributing “new water” to farmers, thanks
to a new tunnel connecting the Ta’ Barkat polishing plant to Sant Antnin.
Moreover, part of the Sant Antnin plant has been recently used to test on a large-scale
technologies which, depending on their resulting efficiency and effectiveness, might be
used in the future by WSC in other circumstances, e.g. in a potential upgrading of the
North sewage treatment plant. The Sant Antnin plant is now destined to outlive its
original purpose and will serve to boost the WSC sewage handling capacity.60
Importantly, great attention has been paid by WSC to the good relations with all
stakeholders and in particular with the Xghajra Local Council and the resident
population. The creation of an ad-hoc Monitoring Committee, which was wisely not
confined to the project preparation phase, but is still active and regularly meeting once
per month, definitely contributes to the elaboration of solutions to any problem that
may rise. The existence of this institutional arrangement ensures, on the one hand, that
cooperation takes place according to a regular schedule, providing certainty and
reliability. On the other hand, it proves to be an asset for WSC as well, because it allows
to directly collect a regular feedback from stakeholders and address their specific
concerns. The participation of local residents to the Monitoring Committee (usually about
5 every session) is arranged by the Xghajra Local Council Mayor and ensures a good
level of stakeholder engagement and participation, preventing decisions from being
perceived as top-down.
Furthermore, WSC has shown openness to take mitigation measures (see section 3.3)
which have contributed to the fact that nowadays Xghajra residents are reportedly very
satisfied with the plant and the cooperation with WSC, except for intermittent odours
coming from the plant.
From a corporate perspective, WSC is committed to save internal operational costs to
ensure a sound financial management, while keeping high standards in its operations.
At the same time, research is being conducted on potential innovative uses of sludge
leftovers, in line with the overall concept of circular economy, which drives the
company’s activities.
For all these reasons, on the whole the management of the plant appears to be
far-sighted, proactive and accurate, and it contributes to the successful provision of
the service as planned.
4.7. PROJECT BEHAVIOURAL PATTERN
60 A tender for a partial retrofit of the Sant Antnin Wastewater Treatment plant was awarded in December
2018 for the value of €4.25 million.
57
This section puts together the different determinants of project performance presented
in the previous sections and discusses their interlinkages and dynamic impact on the
project life cycle.
Overall, the project provided a viable solution to a severe environmental issue
and it is considered in large part successful. Thanks to the project all urban
wastewater entering collecting systems in the South of Malta is treated before discharge.
Moreover, the project was successful in restoring bathing water quality and allowed
Malta to achieve compliance with the Bathing Water Directive. However, full compliance
with the UWWTD has not been achieved yet.
Furthermore, the major project allowed to start enhancing the touristic potential of the
whole south-eastern coast and trigger economic development, which represented the
project’s secondary goals. Due to the long-term and horizontal nature of these goals, a
more comprehensive assessment on their actual achievement should be made in a more
distant future. Nevertheless, according to interviewees, the image of the area has
positively changed, and crucial investments have been triggered, particularly on the
local waterfront.
The positive outcome of the major project strongly depended on the appropriateness of
the project to the existing needs. A well-structured selection process and a good project
design at the planning stage further contributed to the project’s positive performance.
In addition, the centralised management of the water and wastewater sector by WSC
has allowed to keep an integrated view on the system, and to put in place a set of
consistent actions. The wastewater treatment plant has indeed become the key
infrastructure in a complex network, as clearly exemplified by the later construction of
the nearby polishing plant, which could not have existed without the previous major
project.
The assessment is less straightforward when considering all further effects that were
expected ex-ante, with particular regard to fishing activities and the quality of drinking
water. No factual evidence of these benefits could be found through desk and field
research.
In sum, the analysis of the observed project performance reveals that the
different mechanisms and determinants have largely had a positive impact.
Minor exceptions concern two aspects: i) on the one hand, the negative impact of
contextual elements which were already in place before the project (farm waste
discharges, lack of alternatives to sludge landfilling, seawater infiltrations in the sewers:
see section 2.3); ii) on the other hand, the concerns over the long-term appropriateness
of the plant’s treatment capacity in case of ongoing demographic growth at recent years’
rates.
The forecasting capacity, after seven years since the plant’s entry into operation, does
not appear to have had a beneficial impact on the project performance. The issue of
farm waste discharges was actually not appropriately taken care of ex ante, and in
addition population grew more than expected. However, the flexibility granted by the
chosen technology has prevented major bottlenecks in the plant’s functioning so far.
This assessment is summarised in the following figure, which outlines the “behavioural”
path of Malta South sewage treatment plant over its life time. Following the analytical
methodology detailed in the First Interim Report of this evaluation study, the round

58
boxes in light blue indicate the projects’ determinants, the rectangular boxes in light
grey refer to the observed events, the ‘+’ signs next to the green arrows indicate that
the factor has positively influenced the project performance. In particular, arrows in
dark green indicate factors that had a stronger influence on the project, arrows in light
green instead indicate factors that had a positive but less strong influence. Red arrows
and the ‘-’ sign indicate a negative influence of the determinant factor on the project.
Figure 16. Behavioural pattern of the project
Source: Authors
Several mechanisms and determinants very positively influenced the planning,
design, construction and implementation of this project, which matched an
urgent need. Full achievement of the primary objectives was so far hampered
by exogenous issues that pre-existed and that hampered the smooth functioning of
the project in its first years of operation. Solutions for these problems are currently
being researched or implemented. However, the intervening unexpected demographic
growth raises doubts on the appropriateness of the plant’s treatment capacity in the
long term. For these reasons, the preferred label for this project is “little star”.
VERY SMOOTH
CONSTRUCTION
PROCESS AND
IMPLEMENTATION
PROJECT SUCCESS
DEPENDING ON
INTERVENING
VARIABLES
ADEQUATE
PLANNING
AND DESIGN
Centralisedproject
governance
Very good managerial
capacity
Highly positive relation with the context
Not goodforecasting capacity
Veryappropriate
project design
Positive selection process
OPERATIONAL
PROBLEMS
(UNDER-
PERFORMANCE)
Unexpected
demographic
growth
Illegal farm
connections to
the sewerage
network
Government
plan to solve
farm waste
issue

59
5. FINAL ASSESSMENT
Based on the findings of the project analysis in terms of effects generated and measured
through the CBA or qualitatively discussed, as well as of factors affecting those effects’
generation, the final assessment of the project performance is presented hereafter along
a set of four evaluation criteria: project relevance and coherence, project effectiveness,
project efficiency and EU added value.
5.1. PROJECT RELEVANCE AND COHERENCE
The major project was greatly relevant in the context where it was
implemented, matching an urgent need. It provided a long-term solution to the issue
of lacking wastewater treatment before discharge into the sea. The plant is expected to
remain relevant in the future as well, and its importance as part of a system of
infrastructures has been further increased by the addition of the nearby water polishing
plant inaugurated in 2018, whose establishment could not have taken place without the
previous implementation of the sewage treatment plant.
All components were in line with the overall stated objectives and the project was
consistent with strategic priorities set at the European and the national level.
It represented a fundamental step towards the increase of levels of treated wastewater
in Malta and towards the country’s compliance with the Water Framework Directive
(2000/60/EC), the Urban Wastewater Treatment Directive (91/271/EEC) and the
Bathing Water Directive (2006/7/EC) (See details on the degree of compliance
achievements in section 2.3). At the same time, the project was implemented within
the national guidelines provided by the 1992 Sewerage Masterplan for Malta and Gozo.
The plant represented the capstone of a broader strategy aimed to enhance wastewater
treatment in the country through the construction of three new plants. Additionally, its
implementation has allowed further investments in the sector, with a particular
reference to tertiary treatment provided by a polishing plant.
After seven years since the plant started to operate, thanks to its contribution (alongside
the Gozo and the Malta North sewage treatment plants) wastewater treatment does not
represent a problematic element anymore in the country.
However, complementary investments should be put in place with regard to the
disposal, or better reuse, of sludge generated as a by-product in the plant, aiming to
stop its landfilling and find a long-term sustainable solution.
5.2. PROJECT EFFECTIVENESS
The project achieved its primary objective as formulated in the application for
CF support, i.e. to treat all wastewater collected by the sewerage networks in the south
of Malta before discharging it into the sea.
Also, the project restored bathing water quality and allowed Malta to comply with the
requirements of the Bathing Water Directive. Since 2014, all bathing waters have been
assigned the rank of excellent quality in conformity with the directive.

60
On the contrary, full compliance with the UWWTD has not been achieved yet.
Malta61 shows full legal compliance with the provisions of art. 3 of the UWWTD (on the
mandatory collection of wastewater for all agglomerations above 2,000 population
equivalents) and installations for secondary treatment and more stringent treatment
(N-removal) are in place. Yet, according to data released by the European Commission
in 2017 but referred to 2014, the country still fails to achieve full compliance with the
Directive.
This failed compliance is mainly due, according to the Commission, to excessive
discharges of farm manure into the treatment systems, and secondarily to the presence
of salt in sewage, which can hamper the biological process of the plants.62 Therefore,
this failure does not seem to be linked to the project itself, but rather to exogenous,
pre-existing aspects, i.e. farm waste discharge and seawater infiltration in sewers, which
continue to have a negative impact. Solving these long-standing issues was not among
the project’s objectives. As regards farm waste in particular, a law enforcement failure
can be singled out as hampering the full achievement of the project’s objective.
“Malta has new installations in place, but unfortunately its
treatment plants still have problems with their performance.
This explains the non-compliance for secondary and more
stringent treatment” (European Commission, 2017)
The main socio-economic benefit generated by the project was identified in the
pure existence of cleaner seawater, which has been quantitatively assessed through
a non-use value. More specifically, this benefit was quantified in terms of annual
willingness to pay for clean seawater throughout the time horizon.
Finally, as regards plausible project alternatives, the possibility of adding a polishing
unit within the plant from the beginning could have been explored in more detail. It
should be acknowledged, however, that both objective constraints and the need to
optimise the use of available financial resources represented strong incentives to the
definition of the project as it was eventually designed.
5.3. PROJECT EFFICIENCY
Against a total initial investment cost of EUR 78 million (in 2018 prices, VAT excluded)
and approximate EUR 6.6 million63 for annual operation and maintenance until the
assumed last year of the project time horizon (2037), the project produces a net
socio-economic contribution to society, measured by the economic net present
value, of EUR 122.7 million. The internal rate of return is equal to 12.89% against a
benchmark discount rate of 5.64% for the past and 6.80% for the future.
61 For reference date 31/12/2014, Malta reported 3 agglomerations ≥ 2 000 population equivalent (p.e.) with
a generated load of 513,001 p.e. (Source: http://ec.europa.eu/environment/water/water-urbanwaste/implementation/pdf/Annex%20V.pdf) 62 European Commission, 2017. Ninth Report on the implementation status and the programmes for
implementation (as required by Article 17) of Council Directive 91/271/EEC concerning urban waste water treatment. Available at: https://eur-lex.europa.eu/legal-content/EN/TXT/PDF/?uri=CELEX:52017DC0749&from=en 63 Present real values at 2018 terms, excluding VAT.

61
An assessment on the aspect of project efficiency must underline that both total costs
and project schedule were included in the application form for CF funding at a
time when construction was already at a very advanced stage. Comparing the
eventual performance with the forecasts, therefore, does not offer particular insights on
how efficient project implementation phase has been.
Bearing these circumstances in mind, it can be noted however that construction works
were carried out fully in line with the foreseen schedule, ending in the month of October
2010 as planned (one month before the release of the Commission decision financing
the major project).
Final total costs amounted to EUR 68 million (in current prices), with a decrease of EUR
2 million compared to the costs planned ex-ante. Comparing the ex-ante investment
costs with the sums actually disbursed, it is possible to identify the two main items
causing the overall cost decrease in “Contingencies” (EUR 1.5 million planned, none of
which disbursed) and in “Supervision during construction” (EUR 1 million planned, less
than EUR 800,000 disbursed, thanks to savings on the project management contract).
Further minor savings were achieved on contracting and implementation.
The financial sustainability of the project during the implementation phase was
guaranteed by funds provided by the European Union and by the national government,
which in turn financed itself through a loan issued by the EIB.
WSC is responsible for ensuring the project’s financial sustainability over its operational
phase instead. In this regard, government subventions to WSC are in place64, which
contribute to the project’s sustainability together with the collected tariff. A plan exists,
though, to phase out these subventions by 203265: by then, WSC should achieve full
financial independence from them, and compliance with the principle of full cost
recovery should be achieved.
So far, the water tariff66 in Malta has not enabled full cost recovery of water services
due to affordability issues. According to the ex-ante CBA, since the tariff was already
high before the project implementation (as a percentage of household income), setting
it at the level required for achieving full cost recovery could have generated problems
related to users’ ability to pay.
Three different tariff categories exist: domestic, residential and non-residential.
Domestic rates are applied to one primary residence, one secondary residence and one
small garage used only for private purposes. The reduced residential rates apply when
one or more people are registered on a domestic premises account. Any service not
registered as domestic or residential is charged at the non-residential rate (including all
companies)67. Moreover, both the domestic and the residential tariff have two
consumption bands: if water consumption exceeds 33 m³ per year per person, the tariff
64 Total government subventions to WSC amount to EUR 15.9 million in 2015, 14.6 million in 2016 and 14.9
million in 2017. Sources: WSC Annual report 2016, p. 61 and WSC Annual report 2017, p. 35. These figures
concern all services provided by WSC, and are therefore not entirely due to the Malta South sewage treatment plant. The total turnover of WSC amounted to EUR 87.2 million in 2015, 87.6 million in 2016 and 87.5 million in 2017. 65 Source: interview with stakeholders. 66 In Malta, the water tariff includes both water supply and wastewater treatment. 67 Institute for European Environmental Policy, 2016. Water pricing in Malta, p. 3.

62
increases. Similarly, the non-residential tariff has three consumption bands, with the
goal of inducing incentives to avoid wasting water.
Figure 17. The Malta South sewage treatment plant
Source: Managing Authority.
On a different note, some differences can be identified between the benefits expected
by the original CBA and what can be observed after seven years since the project
entered into operation. In particular, the benefit represented by an increase in fishing
activities has not been generated. According to interviewed stakeholders, this benefit
was correctly included in the ex-ante CBA, and the plant succeeded in bringing about
an improved quality of seawater, which is a necessary element for fishing and
aquaculture activities. However, no significant increase in the fishing and aquaculture
business could be generated because of other intervening factors, external to the
project. More specifically, fish farms themselves are reported to produce waste which in
turn hampers their further development.
As regards the expected improvements in the quality of drinking water, no evidence has
been found of similar effects. On the one hand, seawater currents contributed to
preventing seawaters off Pembroke, where the closest desalination plant is located, from
being significantly polluted with raw sewage discharged into the sea in Wied Ghammieq
in the past. On the other hand, the prevention of groundwater depauperating should be
correctly attributed not to the sewage treatment plant itself, but rather to the
subsequent water polishing plant. Moreover, a tangible effect in terms of enhanced
groundwater quality could be potentially generated only in the long run.
Finally, it can be noted that the overall efficiency of the water and wastewater sector in
Malta seems to suffer from a fragmented governance structure as regards public
authorities regulating and monitoring the sector (see Section 4.5). This fragmentation
is however partly compensated by the fact that, on the management side, WSC is the
only operator on the Maltese islands, covering the complete drinking water and
wastewater cycle.

63
5.4. EU ADDED VALUE
The foremost added value of the EU contribution to the project consisted in the
assignment of the financial grant covering 85% of the total costs. General consensus
could be found among the interviewed stakeholders on the idea that without the CF
contribution, the project would not have been possible at the time. When the project
was being undertaken, Malta had just adopted the Euro as its currency, and the plant’s
construction overlapped with the most acute phase of the financial and economic crisis.
As a result, the country faced limits concerning fiscal manoeuvrability and, despite
satisfactory growth forecasts for the future, was short of liquidity. These circumstances
would have prevented the project from being implemented or led to likely delays, had
there not been the EU financial contribution. If Malta had not accessed EU funds then,
the worrisome pre-existing situation would have carried on for several years, to the
detriment of both the environment and quality of life.
Beyond the financial contribution, technical support provided by Jaspers proved to
be an extremely valuable asset for the project. The support’s main focus was
reportedly on helping to structure the ex-ante CBA for the purposes of the major project
application form, but its contribution was fundamental also in terms of both sector-
specific expertise and holistic vision across European countries. Jaspers’ in-depth
knowledge of problems frequently experienced by similar projects in other EU member
states combined with the expertise of the beneficiary, WSC, and its local economic
consultant in charge of the ex-ante CBA, E-Cubed, and led to a solid assessment of the
project’s validity, ultimately endorsed by the Commission through its financing decision
in November 2010. While no support could be offered concerning the project design due
to the fact that construction had already begun, this does not mean that Jaspers did not
have leverage on this aspect at all: Jaspers’ approval of the plant’s design was in fact
instrumental to allow the Commission to grant the CF contribution.

64
Figure 18. The Malta South sewage treatment plant
Source: Managing Authority.
Looking for EU-wide effects of the Malta South sewage treatment plant, it can be noted
that the latter represented an important step towards the achievement of goals set at
the EU level regarding the preservation of the environment and the good status of
bathing waters. As a matter of fact, the major project considerably contributed to
Malta’s compliance with relevant EU directives. Today wastewater treatment does
not represent a priority for the country anymore. Accordingly, no projects in this sector
are co-financed by ESI funds during the 2014-2020 programming period, and this trend
is expected to continue after 2020, with the focus being more on water supply and
waste.
5.5. FINAL ASSESSMENT
The following table summarises the final assessment of the project along the five
evaluation criteria previously discussed. The Malta South sewage treatment plant
is a paradigmatic example of a project characterised by no controversies,
thanks to its very high relevance, socio-economic desirability and consistency with the
identified needs and the objectives stated at both the national and EU level.
A greatly positive relation with the context considerably favoured the project’s
actual performance. Despite the fact that forecasts underestimated population growth
and, importantly, the impact of farm waste discharge and seawater infiltration, far-
sighted choices regarding the plant’s design and technology ensured an indispensable
65
level of flexibility and ultimately allowed the project to be effective. A thorough
strategic and technical option analysis based on clear criteria has to be singled
out as a good practice. Its systematic use and revision provided the appropriate
incentives for decision-makers to make choices rooted in a rational and evidence-based
line of reasoning.
Together with ongoing problems caused by farm waste discharged into the sewerage
network, the landfilling of sludge and seawater infiltrations in the sewers represent the
most critical aspects characterising the current operation phase. While studies and
interventions are being carried out to find appropriate answers to these issues, putting
in place long-term and sustainable solutions will represent a significant challenge to the
beneficiary’s managerial capacity in the near future.
Project implementation proceeded smoothly and proved to be efficient in the use
of public resources. The project achieved most of its primary goals. In the South
of Malta, thanks to Ta’ Barkat plant, the treatment of all urban wastewater entering the
collecting system before discharge into the sea is provided. The new plant led to the
restoration of bathing water quality and allowed Malta to achieve compliance with the
Bathing Water Directive. However, the goal of fully complying with the UWWTD has not
been achieved yet, because of the negative impact of farm waste discharge and the
infiltration of seawater.
The plant has allowed further investments in the wastewater treatment sector to take
place, notably the water polishing plant nearby. No evidence has been found, on the
contrary, supporting the existence of additional benefits expected ex-ante from the
major project, i.e. an increase in fishing activities and an improvement in drinking water
quality.
Ultimately, the project significantly contributed to the removal of a hurdle for
economic development in the area, i.e. the discharge of untreated sewage in the
sea off Malta’s south-eastern coast, and represented a necessary step towards the
improvement of citizens’ quality of life, in line with the overall goals of EU
cohesion policy.

66
Table 9. Evaluation matrix
CRITERION EQ METHODOLOGY ASSESSMENT SCORE
Relevance
• To what extent the original objectives of the examined major project matched: o the existing development needs, o the priorities established at the
programme, national, and/or EU level.
• Where systems guiding the prioritization of individual investment projects within wider sectoral plans in place? Did the selection of the project follow such systems?
Historical reconstruction
The project was and over the years remained fully in line with the development needs and the priorities established at various levels 5
Coherence
• Are the project components in line with the stated project objectives?
• To what extent the examined the project was consistent with other national and/or EU interventions carried out in the same field and in the same area?
• How the synergies with existing investments were ensured?
Historical reconstruction
Fully consistent 5
Effectiveness
• Has the examined major project achieved the objectives stated in the applications for Cohesion policy support?
• What factors, including the availability and the form of finance, and to what extent did influence the implementation time and the achievement observed?
• What has changed in the long run as a result of the project (for example, is there evidence showing contribution of the project to the private sector investments)?
• Were these changes expected (already planned at the project design stage, e.g., in terms of pre-defined objectives) or unexpected (emerged, for instance, as a result of changes in the socio-economic environment)?
• How have these changes matched the objectives set and addressed the existing development needs, the priorities established at the programme, national and/or EU level?
• Did the selected project turn out to be the best option among all feasible alternatives?
CBA results
Ordinal scores on non-monetary
effects
Investigation of the project causal chain
The project has only partially achieved the expected objectives in line with the foreseen time schedule.
3

67
Efficiency
• Are there any significant differences between the costs and benefits in the original cost-benefit analysis (CBA) and what can be observed once the project has been finalised?
• To what extent have the interventions been cost effective?
• Was the actual implementation in line with the foreseen time schedule?
CBA results
Sustainability analysis
Project causal chains
Negligible positive/negative differences 3
EU added
value
• What is the EU added value resulting from the examined major project (in particular, could any of the major projects examined, due to its risk profile, complexity or scope, have not been carried out if not for the EU support)? In particular, which aspect of the EU added value is more evident?: o Provision of strategic support and
advisory during project design; o Provision of technical and operational
support during project preparation; o Provision of financial support leading to
the financing decision.
• Did the examined major projects achieve EU-wide effects (e.g. for preserving the environment, etc.)?
• To what extent do the issues addressed by the examined interventions continue to require action at EU level?
Project causal chains
High EU added value, i.e. the project achieved positive effects
which would have been hardly achieved without the EU support,
thanks also to the strategic and technical support by the EU
services
4
Source: Authors

68
6. CONCLUSIONS AND LESSONS LEARNED
The ex-post evaluation of the major project relating to the construction of the Malta
South sewage treatment plant supports the conclusion that the project was the right
initiative to implement. For a long time, Malta has been characterised by a lack of
long-term strategic vision concerning wastewater treatment, and this project, together
with the plants in Gozo and Malta North, represented a far-sighted solution to the
existing problem. The results of the ex-post CBA confirm that the project was worth
being implemented from a socio-economic standpoint.
This case study gives the opportunity to draw important lessons of more general
relevance as well.
• A sound option analysis is fundamental to identify the most suitable
project alternative and strongly impacts on the project’s eventual
performance in a positive way. In the case of the Malta South sewage
treatment plant, the selection process represented a best practice: an existing
need was first identified, a strategic approach was adopted based on ad-hoc
studies, and an option analysis was carried out and subsequently updated.
Similarly, technical aspects of project design were based on clear selection
criteria and a thorough technical analysis of available alternatives, carried out by
appointed specialists.
• Choosing a unified management for the whole water sector is helpful for
its overall improvement. This choice ensures that projects can be adapted to
needs foreseen in the operation phase thanks to an integrated vision and allows
the organisation in charge of the water sector to develop and accumulate
technical competences, while seizing economies of scale. From a planning
perspective, a unified management has different advantages: it incentivises the
development of long-term strategies; it directly benefits from the application of
circular economy concepts; it considerably facilitates the coordination of different
investments. No intervention in the water sector, as a matter of fact, should be
conceived in isolation from the infrastructural system in which it is embedded.
In this respect, the major project was particularly successful in enabling a
fundamental additional investment, the water polishing plant, which generated
on its own significant benefits for local agriculture.
• Even when the project’s relation with the context is positive, project
implementation proceeds smoothly and managerial capacity is ensured,
long-term appropriateness of infrastructures can be influenced by
exogenous elements. This is evident in the case of the Malta South sewage
treatment plant, where unexpected population growth causes concerns over the
appropriateness of the plant’s treatment capacity over the long term. In this
regard, appropriate mechanisms to identify long-term challenges and suggest
sustainable solutions should be institutionalised.
• Even when demand forecasts rely on certified data by the national
statistics office, ensuring that the infrastructure can operate with
flexibility is a far-sighted choice. For the Malta South plant, the
implementation of a technology characterised by high flexibility to changes in the
demand has avoided operational bottlenecks to take place so far, and ensured
the provision of a fundamental service. In the project preparation phase, great

69
emphasis should thus be attached to the value of flexibility during operation. In
the selection process, introducing specific criteria on the infrastructure’s ability
to cope with a changing demand should represent a standard practice.

70
ANNEX I. METHODOLOGY OF EVALUATION
This Annex summarises the methodological approach undertaken for carrying out the
project case studies and presented in the First Intermediate Report of this evaluation
study. The main objective is to provide the reader a concise account of the evaluation
framework in order to better understand the value and reach of the results of the
analysis as well as to enable him/her, if interested, to replicate this methodology.
The Annex is divided into four parts, following the four building blocks of the
methodological approach (mapping of effects; measuring the effects; understanding
effects; synthesis and conclusions) laid down in the First Intermediate Report. Three
evaluation questions, included in the ToR, guided the methodological design. They are:
• What kind of long term contribution can be identified for different types of
investment in the environment sector?
• How is this long term contribution generated for different types of
investments, i.e., what is the causal chain between certain short term and log-
term socio-economic returns from investments?
• What is the minimum and average time needed for a given long term
contribution to materialise and stabilise? What are these time spans for different
types of investments in the environment field?
MAPPING THE EFFECTS
The Team developed a classification of long-term effects, with the aim of identifying all
the possible impacts of environmental investments on social welfare. Under four broad
categories, a taxonomy of more specific long-term development effects of investment
projects has been developed. The definition of each type of effect is provided in the
Table below.
Far from being exhaustive, this list is intended to guide the evaluators in identifying, in
a consistent and comparable way, the most relevant effects that are expected to be
identified and included in the analysis. Additional effects could possibly be relevant in
specific cases and, if this is the case, they can be added in the analysis.
In researching all the possible long-term effects of project investments, it is
acknowledged that there could be a risk of duplication. In addition, the allocation of
some effects under different categories is to some extent arbitrary and thus it may
happen that categories overlap. That said, caution will be paid in order to avoid double
counting when performing the ex-post CBA.

71
Table 10. Taxonomy of effects
Water and wastewater
•
EFFE
CT
S O
N E
CO
NO
MIC
GR
OW
TH
MOST SIGNIFICANT
EFFECTS
DESCRIPTION
Variation in quantity of
water supplied and
waste water treated
Increased quantity of annual water supply, improved efficient water usages and
wastewater treatment is linked to growth through increasing the sufficient availability and
improving the efficient usage of water and wastewater treatment for civil consumption,
as well as industrial and agricultural production, and through increasing a regions housing
attractiveness for urban development, employment and attractiveness for industrial
consumers. The impact on growth of the increased quantity of water supplied and treated
will usually first occur over time. (Dinar & Schwabe 2015)
Variations in the
reliability of water
sources and water
supply
Enhanced reliability is linked to growth by eliminating water supply shifts (water supply
becomes more uniform). This comes from improvements in water supply and distribution
that decrease the times of production disruption caused by an interruption in the
production site’s water intake or wastewater outtake (Dinar & Schwabe 2015) or increase
the water pressure. Disruption may be seasonal, especially in regions where demand in
the dry season may be too high compared to the utilities’ capacity or in wet season, where
the wastewater infrastructure capacity is overflood by water from excessive rainfall and
flash floods.
Variations in water
quality
Enhanced water supply quality can reduce the costs for water-intensive industries, which
through regulation clean treat their own waste water outtake. Water quality
improvements may also not be linked directly to savings in health care or related public
cost savings. However, this link is usually weak or non-existent, as people generally drink
bottled water in areas where water is not safe. Water quality is However, they may be
also linked to growth through a regions’ living attractiveness for households and thereby
a regions ability to attract employment. A region with poor water quality which hampers
clean water for domestic purposes and degrades the landscape, limit recreation
opportunities and produce bad odours etc. will usually also experience challenges in
attracting tourism, which also affect growth (UNEP 2015). In the context of agriculture,
waste water projects may include a change in the use of polluted water in irrigation, as

72
waste water includes both harming and useful plant food nutrients which can influence
both positively and negatively on crop yields for farmers (Dinar and Schwabe, 2015;
UNEP, 2016, Drechsel et al., 2015).
Variation in resource
savings (water
preserved for other
uses)
Improving water management efficiency may, for example by reducing the water leaks
of a water distribution network, decrease the volume of water needed to supply the
network. Water is then preserved for other uses, which may generate growth in industries
and agriculture that are reliant on scarce water sources. The same effect arises from
reduced over-exploitation of a water source (e.g. when groundwater is replaced with
water produced from other sources, such as desalination) or wastewater is purified and
reused (more stringent treatment) for irrigation or industrial water supply. (European
Commission 2015)
Variation in operating
costs
Improving the efficiency of water and wastewater management by e.g. separating
rainwater from waste water pipeline reduces the utility’s total cost, which may lower the
price on water and wastewater services. This assumes a market simulating pricing
system, where the price for water services is linked to the utility’s cashflow.
MOST SIGNIFICANT
EFFECTS
DESCRIPTION
Wider economic impacts
It refers to the national impact on income and productivity of the economy caused by the project leads to a higher economic activity through the production of more or better goods and services together than before. There are conflicting academia results on the effects, but studies suggest that especially industries will gain positively (see e.g. Katz (2008)
and OECD (2018)).
Institutional learning It refers to wider spill-over effects that any investment project may bring to the Public
Administration and other institutions at national or regional or local levels in terms of expertise gained by working on large scale projects. Learning may lead to productivity gains by stimulating the improvement of existing technical know-how, improved policy-making, competitive tendering and divert resources towards the most growth enhancing projects.

73
EFFE
CT
S R
ELA
TE
D T
O Q
UA
LIT
Y O
F L
IFE
AN
D
WE
LL-B
EIN
G
MOST SIGNIFICANT
EFFECTS
DESCRIPTION
Variations in the number of consumers served by
water supply and treatment services
It arises when new users are connected to the centralised water supply or sewer
networks.
Variations in the quality of water supply and/or sewer services
It relates to the increase of users satisfaction, experiencing an improvement in the
quality of water supply and wastewater treatment.
Variations in human health and hygiene
It refers to the population’s exposure to pollution in drinking water and to the wastewater treatment. This effect is relevant only if causation can be proved, which may be difficult, as it requires statements or analyses which link the drinking water quality and/or the discharged water to i.e. medical treatment. Impacts on human health
may, in turn, impact on the productivity of the labour force, which underpins economic development (Suri, Boozer, Ranis, et al. 2011).
ADDITIONAL EFFECTS DESCRIPTION
Variations in the living attractiveness of the area
It relates to the current and future increase of population, caused by the improved water and waste water facilities. This includes the effects on buildings’ resilience to climate change through an improved outtake of sewage water (under-capacity of sewers can lead to flooding when there is a cloudburst, the frequency of which is expected to
increase over time due to climate change (Punttila 2014)).

74
EFFE
CT
S O
N T
HE
EN
VIR
ON
ME
NT
MOST SIGNIFICANT
EFFECTS
DESCRIPTION
Variations in GHG emissions This effect relates to the impact wastewater projects may have on GHG emissions; wastewater treatment generates significant amount of greenhouse gases mainly methane and nitrous oxide. For example, a
wastewater project may improve the processing of wastewater in such way that it reduces GHG emissions.
Variations in contamination of air, water, and soil
This is relevant on desalination and waste water treatment plants. It is related to the environmental impact of the desalinizing projects and the avoidance of pollution from waste water. This include contamination of sea water and air pollution emissions, contamination of soils and freshwater (i.e. Removal of nitrogen and phosphorus), spill-over effects of system flooding due to heavy rainfall and flooding (Logar, Brouwer,
Maurer, et al. 2014; Djukic, Jovanoski, Ivanovic, et al. 2016).
Variations in the protection and resilience of natural resource systems (including
surface water bodies and ecosystem services)
This is a long-term effect on the above-mentioned effects. It relates to the projects overall effect on the sustainability of the natural resource systems caused by the reduced contamination and resilience. This include enhancing the housing’s resilience to climate change through an improved outtake of sewage water
(under-capacity of sewers can lead to flooding when there is a cloudburst, the frequency of which is expected to increase over time due to climate change (Punttila 2014)).
ADDITIONAL EFFECTS DESCRIPTION
Variations in biodiversity It relates to the projects’ overall effect on the ecosystem, mainly caused by decreasing the pollution from the wastewater infrastructure. This effect will only be relevant in areas where wastewater is threatening the biodiversity and environmental sustainability. (Dinar and Schwabe (2015) and Punttila (2014) – on reduction on Baltic Sea level)
Variations in climate change resilience
This effect is broader than the contamination issue, as it includes the environmental impact of taking a holistic approach to waste water projects, by including climate change adapting components such as to more heavy rainfall and increased water levels (i.e. see Punttila (2014) – on including natural stormwater management in waste water investments, which provide recreational benefits in urban areas)
DIS
TR
IB
UT
IO
NA
L I
SS
UE
S ADDITIONAL EFFECTS DESCRIPTION
Social cohesion It encompasses the allocation of the main benefits over income and social groups
Territorial cohesion It encompasses the allocation of the main benefits over central (core) and peripheral areas

75
Waste management
EFFE
CT
S O
N E
CO
NO
MIC
GR
OW
TH
MOST SIGNIFICANT EFFECTS DESCRIPTION
Variations in waste to landfills The reduction of the amount of waste finally going to final disposal as a result of the project which
extends the economic life of the landfills or which enhances the recovery of waste will reduce the need for landfill disposals. This opens up for making former waste landfills available for alternative economic production (Jamasb & Nepal 2010).
Variations in recovery of materials Improving resource recovery, including improving the waste sorting facilities or improving the circularity of resources used in the industrial production may reduce the total cost of production. The
lowering of cost will only occur in case the waste treatment is replacing a less cost-efficient waste
collection and treatment process.
Variations in energy recovery Improving energy recovery of waste may lead to lower energy prices for households and industry. (Jamasb & Nepal 2010) The lowering of cost will only occur in case the waste treatment is replacing a
more expensive energy-source.
Variations in the reliability of waste collection
Enhanced reliability is linked to growth by decreasing the times of service disruption caused by lack of an efficient waste collection and/or management facilities. Disruption may be seasonal, especially in regions where demand may be too high to the utilities’ capacity.
Variations in deployment cost for utility services
The utility entity’s direct cost may have an effect on economic growth, depending on the investment profile and tariff policies. Also, the ex-ante treatment technology will influence the level of impact (see i.e. Martines-Sanchez and Astrup (2016))
ADDITIONAL EFFECTS DESCRIPTION
Wider economic impacts It refers to the overall variation in productivity of the economy caused by the project leading to a higher
economic activity. (on landfill reduction – Danthurebandara, Van Passel, Vanderreydt, et al. (2015)). Recent studies indicate that the effects are only traceable when the project leads to overall waste prevention, the most ambitious step on the EU waste hierarchy (see i.e. Martines-Sanchez and Astrup (2016)).
Institutional learning It refers to wider spill-over effects that any investment project may bring to the Public Administration and other institutions at national or regional levels in terms of expertise gained by working on large scale projects. Learning may lead to productivity gains by stimulating the improvement of existing technical know-how, improved policy-making, competitive tendering and divert resources towards the most growth enhancing projects.

76
EFFE
CT
S R
ELA
TE
D T
O Q
UA
LIT
Y O
F L
IFE
AN
D W
ELL-B
EIN
G
MOST SIGNIFICANT EFFECTS DESCRIPTION
Variations in the number of consumers served by waste management services
It arises when new users are connected to an improved waste collection system.
Variation in exposure to disamenities
It relates to the increase of welfare for the households, by lowering the negative externalities stemming from visual disamenities, noise, and odours through improving the waste collection technology, the infrastructure on the treatment sites and/or reducing the landfills.
Variations in household income Reductions in household tariffs due to lower utility cost per unit, leads to higher savings to purchase
other goods and services (Martinez-Sanchez & Astrup 2016).
Variations in human health and
hygiene
It refers to the population’s exposure to pollution through contamination of air, water and soils. While it
is rare to find solid waste project with significant health benefits, because people generally manage to remove waste far enough from their immediate surroundings to prevent exposure to health hazards. The effect can be relevant if illegal landfills are closed, thus preventing the emission of volatile organic compounds and dioxins, the generation of leachate which is emitted to the surrounding soil and water. Impacts on human health may, in turn, impact on the productivity of the labour force, which underpins economic development (Suri, Boozer, Ranis, et al. 2011).
ADDITIONAL EFFECTS DESCRIPTION
Variation in living attractiveness of the area
It relates to the current and future increase of population, caused by the improved waste management facilities.
EFFE
CT
S O
N T
HE
EN
VIR
ON
ME
NT
MOST SIGNIFICANT EFFECTS DESCRIPTION
Variations in GHG emissions This effect relates to projects which impact on GHG emissions from biodegradable waste components, or the energy and material recovery of waste treatment in such way that it substitutes, or is substituted by, fossil fuels. (Jamasb & Nepal 2010)
Variations in the contamination of air, water, and soil
As health effects are treated in Table 6, this relates only to the ecosystem effect of lowering the negative externalities from waste treatment and landfills (see i.e. Damgaard et al, 2011 and Danthurebandara, Van Passel, Vanderreydt, et al. (2015)).
ADDITIONAL EFFECTS DESCRIPTION
Variations in the protection and
resilience of natural resource
systems
It relates to the projects overall effect on the sustainability of the natural resource systems caused by
improved efficiency in energy and material production processes.
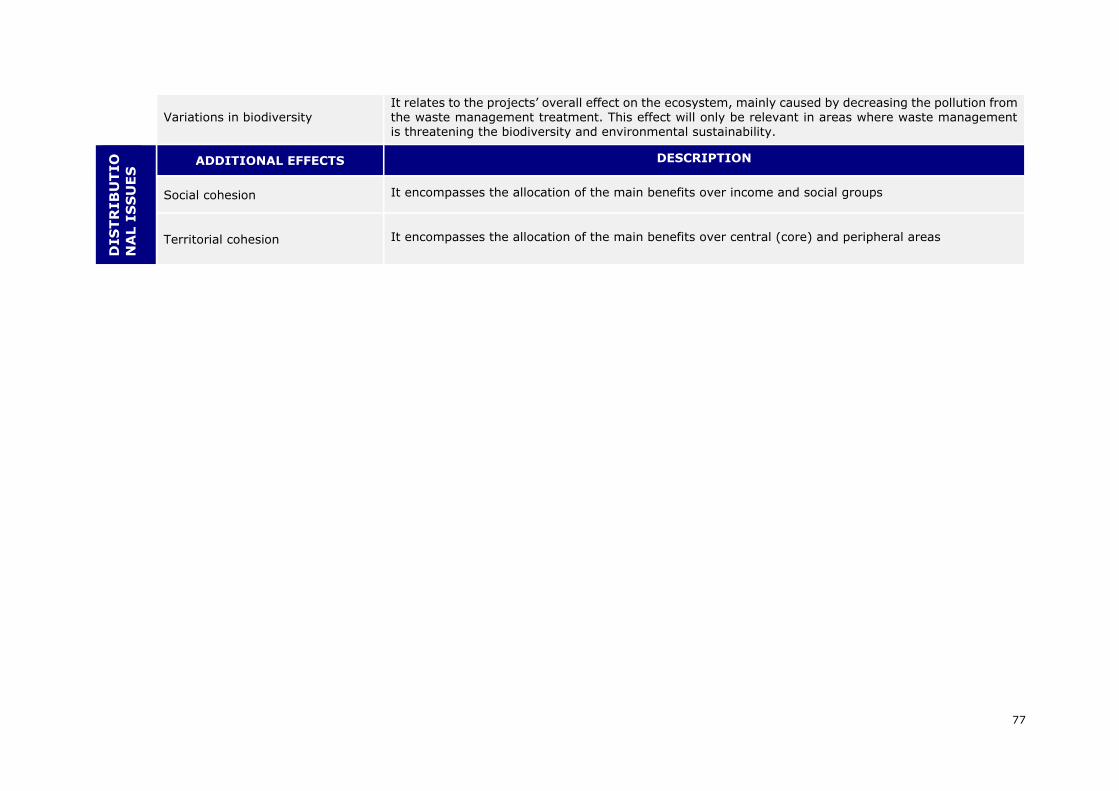
77
Variations in biodiversity It relates to the projects’ overall effect on the ecosystem, mainly caused by decreasing the pollution from the waste management treatment. This effect will only be relevant in areas where waste management is threatening the biodiversity and environmental sustainability.
DIS
TR
IB
UT
IO
NA
L I
SS
UE
S ADDITIONAL EFFECTS DESCRIPTION
Social cohesion It encompasses the allocation of the main benefits over income and social groups
Territorial cohesion It encompasses the allocation of the main benefits over central (core) and peripheral areas

78
Environmental remediation project
EFFE
CT
S O
N E
CO
NO
MIC
GR
OW
TH
MOST SIGNIFICANT EFFECTS DESCRIPTION
Variation in value of properties near
remediated site
Environmental remediation or preservation of a site may increase the market expectations of its
future flow of goods and services. For example, people tend to prefer to live in areas free from pollution. This is reflected it increased property prices. (Söderqvist, Brinkhoff, Norberg, et al. 2015)
Variation in tourism Environmental remediation of a site may improve the aesthetics and biodiversity of the area and thus attract tourism (BenDor, Lester, Livengood, et al. 2014). However, variation which imply complementary changes in tourism elsewhere in the region should not be counted in.
Variation in fishing and hunting yields Environmental remediation of a site may improve the stocks of fish or wildlife inhabiting the area, which can improve the catch or game for fisheries and hunters (BenDor, Lester, Livengood, et al. 2014).
Variation in yields from timber and other raw materials
Environmental remediation of a site may increase the yield of raw materials such as timber (Vicarelli, Kamal & Fernandez 2016).
ADDITIONAL EFFECTS DESCRIPTION
Variation in agricultural yields (indirect ecosystem services)
The remediation of a site may, for example, support agricultural activities by improving the capacity of water systems affecting the arable land (Söderqvist, Brinkhoff, Norberg, et al. 2015), or by providing a habitat to pollinators.
Economies of agglomeration Remediation of a site may increase the attractiveness of an area and promote urban development,
and so concentrate the geographical co-location of firms. This in turn gives rise to economies of agglomeration. (United States Environmental Protection Agency 2011)
Institutional learning
It refers to wider spill-over effects that any investment project may bring to the Public Administration and other institutions at national or regional levels in terms of expertise gained by working on large scale projects. Learning may lead to productivity gains by stimulating the improvement of existing technical know-how, improved policy-making, competitive tendering and divert resources towards the most growth enhancing projects.

79
EFFE
CT
S R
ELA
TE
D T
O
QU
ALIT
Y O
F L
IFE
AN
D
WE
LL-B
EIN
G
MOST SIGNIFICANT EFFECTS DESCRIPTION
Variation in health Remediation of a site may produce positive externalities, including improved health from reduced exposure to pollutants or other hazards (e.g. radioactivity) and improved mental health due to reduced anxiety linked to concerns with pollution (Söderqvist, Brinkhoff, Norberg, et al. 2015). In context of this evaluation, this benefit will only be included as a benefit if causation between the project at hand and health improvements be proved.
Variation in recreational opportunities Remediation or preservation of a site may expand the opportunities for outdoors recreational activities (e.g. trekking, bathing, picknicking) in the area. This may have a positive effect on well-being (Söderqvist, Brinkhoff, Norberg, et al. 2015).
ADDITIONAL EFFECTS DESCRIPTION
None
EFFE
CT
S O
N T
HE
EN
VIR
ON
ME
NT
MOST SIGNIFICANT EFFECTS DESCRIPTION
Preservation of species or ecosystems Preservation of a site may preserve species or ecosystems affects the existence value from which individuals may derive utility without using the resource (i.e. individuals feel good from the knowledge that the ecosystems or biodiversity in question exists) (United States Environmental Protection Agency 2011).
ADDITIONAL EFFECTS DESCRIPTION
Variations in carbon sequestration Remediating an ecosystem may lead to increase in biomass, which will naturally bind more carbon
(carbon sequestration) (Vicarelli, Kamal & Fernandez 2016)
Variation in hazard risks The presence of ecosystems, such as forests, can alleviate damages caused by flooding. (Wang, Chen, Zhang, et al. 2010)

80
Risk reduction
EFFE
CT
S O
N E
CO
NO
MIC
GR
OW
TH
MOST SIGNIFICANT EFFECTS DESCRIPTION
Variation in asset losses Disasters may damage personal/commercial/public assets, which may be costly to replace. Disaster risk
reduction activities may reduce such damages including public cost to disaster management.
Variation in direct interruption of economic activity
Damages to assets may directly interrupt economic activity. For example, if a factory is destroyed, the activities of the owning firm may be impacted. Similarly, if arable land is flooded, farming activities may be disrupted.
Variation in property prices People prefer to avoid living in areas with higher risk for natural disasters. Therefore, if disaster risk
reduction projects reduce the risk faced by a neighborhood, its property prices will likely increase.
ADDITIONAL EFFECTS DESCRIPTION
Variation in risk-taking Risk averse economic agent tend to take less risks in the face of latent disaster risks. At the same time, some degree of risk taking is essential for technology adoption and investment, which are fundamental to economic growth. Therefore, risk reduction activities may stimulate risk taking, and so, economic
growth (Hallegatte, Bangalore & Jouanjean 2016).
Variation in indirect interruption of economic activity
In addition to disrupting the economic activities of asset owners, the economic activities of agents whose assets were not impacted by a disaster may be interrupted. Specifically, a disaster that hits a particular segment of a supply chain may incapacitate other parts of the supply chain. For example,
firms may not be able to trade their products, even if their factories are intact, if the transport services they rely on are heavily impacted by a disaster. Disaster risk reduction may reduce such higher-order
impacts on the economy (Hallegatte, Bangalore & Jouanjean 2016).
Institutional learning It refers to wider spill-over effects that any investment project may bring to the Public Administration and other institutions at national or regional levels in terms of expertise gained by working on large
scale projects. Learning may lead to productivity gains by stimulating the improvement of existing technical know-how, improved policy-making, competitive tendering and divert resources towards the most growth enhancing projects.

81
EFFE
CT
S R
ELA
TE
D
TO
QU
ALIT
Y O
F L
IFE
AN
D W
ELL-B
EIN
G MOST SIGNIFICANT EFFECTS DESCRIPTION
Variations in human mortality and morbidity
A disaster may impact on human health, for example by injuring people caught by the disaster, or by contaminating drinking water. Also, disaster may cause the death of people. Disaster risk reduction may reduce the negative impacts of a disaster on human health as well as on the risk of death.
Variations in damage to cultural sites and structures
Risk reduction measures can lower the damages to historical buildings and objects, or other culturally significant structures, in case of a disaster.
ADDITIONAL EFFECTS DESCRIPTION
Co-benefits/variations of disaster
risk reduction infrastructure
Disaster risk reduction infrastructure can be used for social purposes. For example, a shelter can be
used as a community space during non-disaster times (Vorhies & Wilkinson 2016).
EFFE
CT
S O
N
TH
E
EN
VIR
ON
ME
NT
DIRECT EFFECTS DESCRIPTION
Variations in damage to the environment
Risk reduction measures can lead to lessened damages to the environment, such as wetlands, parks, and wildlife, in case of a disaster.
ADDITIONAL EFFECTS DESCRIPTION
Co-benefits/variation of disaster risk reduction infrastructure to the environment
Risk reduction measures, such as the construction of flood protection structures, can improve irrigation for ecosystems.
Source: Authors

82
MEASURING OF EFFECTS
Because of the variety of effects to be accounted for, a methodological approach
firmly rooted on CBA (complemented by qualitative analysis when necessary) is
adopted in order to grasp the overall long-term contribution of each project.
In terms of their measurement level, the effects can be distinguished into:
A. Effects that by their nature are already in monetary units (e.g. cost
savings from environmental damages). These can therefore be easily included in
a cost-benefit analysis (CBA).
B. Effects that are quantitative, but not in money units, and that can be
converted into money units in a reasonably reliable way (e.g. water
pollution, odour effects)68. These effects can also be included in the CBA.
C. Effects that are quantitative, but not in money units, for which there are
no reasonably reliable conversion factors to money. We propose not to try
to include such effects in the CBA, but to discuss them in a qualitative way
together with the overall outcome of the CBA.
D. Effects that are difficult to measure in quantitative (cardinal) terms, but
do lend themselves for ordinal measurement (a ranking of the impact of
different projects on such a criterion can be provided, such as very good, good,
neutral, bad, very bad). We propose to discuss these effects in qualitative terms.
E. Effects that might occur but that are subject to a high degree of
uncertainty: these will be treated as part of the risks/scenario analysis that will
be included in the CBA.
F. Effects that might occur but that we cannot even express in an ordinal
(ranking) manner: they are residual effects that can be mentioned in
qualitative description in case study report.
In short, all the projects’ effects in A and B are evaluated by doing an ex-post cost-
benefit analysis (CBA)69. Reasonably, these represent the most significant share of long-
term effects. Then the outcome of the CBA (e.g. the net present value or benefit-costs
ratio) is complemented by evidence from C and D, while E and F is used for descriptive
purposes. Moreover, qualitative techniques are used to determine why certain effects
are generated, along what dimensions, and underlying causes and courses of action of
the delivery process (see below).
Section 3 of each case study includes a standardised table in which scores are assigned
to each type of long-term effect. Scores ranging from -5 to +570 are given in order to
intuitively highlight which are the most important effects generated for each case study.
68 Methods to establish such conversion factors include: stated preference surveys (asking respondents about
hypothetical choice alternatives), hedonic pricing or equating the external cost with the cost of repair, avoidance or prevention or with the costs to achieve pre-determined targets. 69 More details on the approach adopted to carry out the ex-post CBA exercise and, in particular, indications
on project identification, time horizon, conversion factors and other features are extensively described in the First Intermediate Report of this evaluation study. 70 The strength score reflects the weight that each effect has with respect to the final judgment of the project.
In particular: -5 = the effect is responsible of the negative performance of the project; -4 = the effect has provided a negative contribution to the overall performance of the project; -3 = the effect has contributed in a moderate negative way to the performance; -2 = the effect has a slightly negative contribution to the project performance; -1 = the effect is negative but almost negligible within the overall project performance; 0 = the

83
UNDERSTANDING THE EFFECTS
Once the project effects have been identified and measured, and the causal chain linking
different categories of short-term and long-term effects has been investigated, the third
building block of the methodological approach entails reasoning on the elements, both
external and internal to the project, which have determined the observed causal chain
of effects to take place and influenced the observed project performance.
Taking inspiration from the literature on the success and failure of projects, and
particularly on costs overruns and demand shortfalls, and on the basis of the empirical
evidence which develops from European Commission (2012) six stylised determinants
of projects’ outcomes and their development over time have been identified (see table
below).
The interplay of such determinants may reinforce or dilute one effect over the other.
Moreover, each determinant may contribute, either positively or negatively to the
generation/speed up/slow-down of certain short-term or long-term effects. For this
reason it is important not only to understand the role that each determinants has on
the observed project outcome, but also their interplay in a dynamic perspective.
In doing this, it is useful to refer to stylised, typical “paths” of project behaviours
outlined in the following table. Such patterns capture common stories and reveal
recurring patterns of performance, as well as typical problems that may arise and
influence the chronicle of events. Case studies test the validity of such archetypes and
are used to specify in better nuances or suggest possible variations or additions.
Section 4 of each case study includes standardised tables in which scores are assigned
to each determinant. Scores ranging from -5 to +5 are given in order to intuitively
highlight which are the most relevant determinants explaining the project outcomes71.
Moreover, section 4 of each case study includes a graph describing the project’s
behavioural pattern, i.e. describing the chain of interlinked causes and effect
determining the project performance over time.
effect has no impact on the project performance; +1= the effect is positive but almost negligible within the overall project performance; +2 = the effect has a slightly positive contribution to the project performance; +3 = the effect has contributed in a moderate positive way to the performance; +4 = the effect has provided a positive contribution to the overall performance of the project; +5 = the effect is responsible of the positive performance of the project; N.R. = The effect is not relevant for the specific project; No data = The effect is potentially relevant, but no evidence on impacts is available. This shall be used only for relatively low significant effects whose inclusion would in no case dramatically affect the overall assessment. 71 The strength score reflects the weight of the role that each determinant played with respect to the final
judgment of the project. In particular: -5 = the determinant is responsible of the overall negative performance of the project; -4 = the determinant provides a negative contribution to the overall performance of the project; -3 = the determinant contributes in a moderate negative way to the overall performance of the project; -2 = the determinant has a slightly negative contribution to the project overall performance; -1 = the determinant plays a negative but almost negligible role to explain the overall project performance; 0 = the determinant does not play a role on the project overall performance; +1= the determinant plays a positive but almost negligible role to explain the overall project performance; +2 = the determinant has a slightly positive contribution to the project overall performance; +3 = the determinant contributes in a moderate positive way to the overall performance of the project; +4 = the determinant provides a positive contribution to the overall performance of the project; +5 = the determinant is responsible of the overall positive performance of the project.

84
Table 11. Stylised determinants of projects’ outcomes
DETERMINANT DESCRIPTION
Relation with the context
It includes the considerations of institutional, cultural, social and economic environment into which the project is inserted, was the project appropriate to this context?; is there a problem that the project can solve?; does the project remain relevant over the years?
Selection process
It refers to the institutional and legislative framework that determines how public investment decisions (and especially those co-financed by ESIF) are taken, i.e. which is the process in place and the tools used to select among alternative projects. The selection
process is influenced by incentive systems that can lead politicians and public institutions to either take transparent decisions or strategically misrepresent costs and/or benefits at the ex-ante stage.
Project design
it refers to the technical capacity (including engineering and financial expertise) to properly design the infrastructure project. Under
a general standpoint, we can distinguish:
• the technical capacity to identify the most appropriate conceptual design, which best suits the need of a specific context. Even
when a region really is in need of the project, it usually requires a well-designed project to solve the observed problems. This, in
turn, involves that different alternatives are considered and the best option in terms of technical features and strategical
considerations is identified;
• the technical capacity to develop the more detailed level of design (preliminary and detailed), thus identifying most effective and
efficient detailed infrastructure solutions and construction techniques, thus avoiding common pitfalls in the construction stage
(such as introducing variants that are not consistent with the original conceptual design) and the risk of cost overruns during the
construction phase by choosing inappropriate technical solutions.
Forecasting capacity
It regards the possibility and capacity to predict future trends and forecast the demand level and estimate the technical challenges,
thus estimating correctly the required resources (e.g. looking at the dangers of over-predicting demand and under-predicting construction costs). In particular, technical forecasting capacity is related to the quality of data used and forecasting/planning techniques adopted. At the same time, forecasting capacity includes the ability of the project promoter and technical experts not to incur in the planning fallacy (the tendency to underestimate the time or cost needed to complete certain tasks) and optimism bias (the systematic tendency to be overly optimistic about the outcomes of actions).
Project governance
It concerns the number and type of stakeholders involved during the project cycle and how responsibilities are attributed and shared. This is influenced by the incentive mechanisms. If bad incentives exist, this can lead different actors involved in the project management to provide benefits for their members, thus diverting the funds away from their optimal use, or forcing them to delegate responsibilities according to a non-transparent procedure.
Managerial capacity
It refers to the:
• professional ability to react to changes in the context/needs as well as to unforeseen events;

85
• professional capability to manage the project ensuring the expected level of service in the operational phase. To ensure a project
success, it is not enough that it is well planned and designed, but also that the organizations in charge of the management and
operations provide a good service to the end users (e.g. ensuring a good maintenance of the infrastructure).
Source: Authors

86
Table 12. Behavioural patterns archetypes
Behavioural patterns are illustrated by use of diagrams linking determinants and project outcomes in a dynamic way
TYPE DESCRIPTION
Bright star
This pattern is typical of projects where the good predictions made ex-ante (both on the cost side and demand side) turn out to be
accurate. Proper incentive systems are in place so that the project actually delivers value for money and success. Even in the event
of exogenous negative events, the managerial capacity ensures that proper corrective actions are taken and a positive situation is
restored.
Rising sun
This pattern is typical of projects which, soon after their implementation, are affected by under capacity issues because of a
combination of low demand forecasting capacity, weak appropriateness to the context, and weak technical capacity to design the
infrastructure. However, due to changed circumstances or thanks to responsible management and good governance the project
turns around to reap new benefits.
Supernova
This pattern is typical of projects for which the good predictions made ex-ante (both on the cost and demand side) turn out to be
accurate. However, due to changed circumstances or because of weak management capacity and/or governance the project
eventually turns out to be unsuccessful.
Shooting star
This pattern is typical of projects starting from an intermediate situation and resulting in a failure. This outcome can be explained
by a low forecasting capacity affected by optimism bias which yields a cost overrun. Then during project implementation, because
of low managerial capacity and/or poor governance (also due to distorted incentives) corrective actions are not implemented, this
leading to project failure. The situation is exacerbated if unexpected negative events materialise during the project implementation.
Black-hole
This pattern is typical of projects that since the beginning of their life fail to deliver net benefits. This is a result of a combination of
ex-ante bad factors (i.e. low technical capacity for demand forecasting, optimism bias, inappropriateness to the local context and
bad incentives affecting both the selection process and the project governance) and careless management during the project
implementation or bad project governance (e.g. unclear division of responsibilities, bad incentive schemes).
Source: Author

Ex post evaluation of major projects supported by the European Regional Development
Fund (ERDF) and Cohesion Fund between 2000 and 2013
87
SYNTHESIS AND CONCLUSIONS
Qualitative and quantitative findings are integrated in a narrative way, in order to
develop ten project ‘histories’ and to isolate and depict the main aspects behind the
project’s long-term performance. A final judgment on each project is then conveyed in
the case studies with an assessment structured along a set of evaluation criteria, as
suggested in the ToRs. Evaluation criteria are the following:
• Relevance (were the project objectives in line with the existing development
needs and the priorities at the programme, national and/or EU level?);
• Coherence (with other national and/or EU interventions in the same sector or
region);
• Effectiveness (were the stated objectives achieved, and in time? Did other effects
materialise? Were other possible options considered?);
• Efficiency (costs and benefits relative to each other and to their ex-ante values);
• EU added value (was EU support necessary, EU-wide effects, further EU action
required?).

Ex post evaluation of major projects supported by the European Regional Development
Fund (ERDF) and Cohesion Fund between 2000 and 2013
88
ANNEX II. EX-POST COST-BENEFIT ANALYSIS REPORT
This Annex illustrates the ex-post CBA of the project under consideration, undertaken
to quantitatively assess the performance of the project. The methodology applied is in
line with the First Interim Report and, more generally, with the EC Guide (European
Commission, 2014). This annex aims to present in more detail the assumptions, results
of the CBA and the scenario analysis for the project under consideration.
METHODOLOGY, ASSUMPTION AND DATA GATHERING
In what follows, the main assumptions and the procedure of data gathering are
described in detail.
Project identification
The unit of analysis of this CBA corresponds to the Malta South sewage treatment
plant and its ancillary infrastructures (pumping stations, wastewater gallery,
submarine outfall) which were part of the major project co-funded by the
Cohesion Fund. In addition, transmission pipes conveying sewage to the plant
have been included in the unit of analysis as well, so as to identify a technically
self-sufficient project72. In line with the approach suggested by the EC Guide
(European Commission, 2014), such a unit of analysis represents a functionally
complete infrastructure, enabling the service of wastewater treatment without
depending on other investments.
The main goal of the major project was to treat wastewater collected by the
sewerage networks in the south of Malta before discharge, thereby restoring
bathing water quality and achieving compliance with EU directives. The first
project idea dates back to 1992. After feasibility studies and an accurate option
analysis were carried out, the project was actually implemented from 2008 to
2011 as detailed below.
Table 13. Synthesis of the interventions
ACTIVITY IMPLEMENTATION PERIOD
Preparatory phase (Project design, approval
and funding decisions) 2008
Construction 2008-2010
Start of operational phase 2011
Source: Authors
Time horizon
72 However, operating costs of the remaining infrastructures are insignificant compared to the plant’s
operating costs and chiefly relating to the energy cost of the Rinella and Xghajra pumping stations. These costs amount to circa EUR 40,000/year as per former projections, amounting to circa 0.6% of the overall operating costs of the infrastructure with 2017 taken as the basis year. The annual operating costs of the ancillary infrastructures is not expected to vary appreciably and it is assumed to remain fixed throughout the period of consideration. Source: Managing Authority and WSC.

Ex post evaluation of major projects supported by the European Regional Development
Fund (ERDF) and Cohesion Fund between 2000 and 2013
89
In line with the First Interim Report, the time horizon for the CBA of the project
is set at 30 years (incl. 3 years of construction). Accordingly, the timeframe for
the project’s evaluation runs from 2008, when the first capital expenditure
occurred, to 2037. A mix of historical data from 2008 to 2018 (covering 11 years)
and forecasts from 2018 to 2037 (covering 19 years) is used.
Constant prices and discount rates
In line with the guidelines of the First Interim Report, the CBA was performed
using constant prices. Historical data have been adjusted and converted into Euro
at 2018 prices by using the yearly average percentage variation of consumer
prices provided by the International Monetary Fund. As for data from 2018
onwards, they have been estimated in real terms (no inflation is considered).
Over the entire period of analysis, inflows and outflows were considered net of
VAT.
Following the choice of using constant prices, financial and social discount rates
have been adopted in real terms. Specifically, inflows and outflows of financial
analysis - for both backward and forward periods of analysis – have been
discounted and capitalised using a 4% real rate, as suggested in the EC Guide.
With regard to the economic analysis, a real backward social discount rate of
5.64% and a real forward social discount rate of 6.80%, specifically calculated
for Malta (see the First Interim Report for the calculation), have been adopted.
Without the project scenario
In accordance with the ex-ante CBA conducted for the purposes of the major
project application form in 2010, the counterfactual baseline scenario against
which incremental costs and benefits are compared is represented by a Business-
as-usual (BAU) solution. In this regard, it needs to be highlighted that this latter
scenario would not enable Malta to achieve compliance with EU directives. In
other words, the chosen counterfactual does not represent a feasible alternative
to the with-the-project scenario, because it would perpetrate an infringement of
EU and national law, and fail to address a relevant environmental risk. Identifying
a technically feasible do-minimum intervention, which is both different from the
project itself and capable of achieving the same objectives, appears to be hardly
possible. The Business-as-usual scenario thus represents the only basis to
compare costs and benefits. However, penalties for non-compliance with
prevalent legislative requirements have been included in the financial analysis,
as foreseen by the EC Guide (2014).
Data sources
The analysis relied on data provided by the Managing Authority (the Planning &
Priorities Coordination Division at the Ministry for European Affairs and Equality)
and by Water Services Corporation (the major project’s beneficiary and
implementing body). These sources were complemented by own desk research.
Technical features
As set out in the project documentation, the major project included five
components: 1) the construction of a new wastewater treatment plant in Ta’
Barkat; 2) the construction of a new wastewater pumping station in Rinella; 3)
the upgrading of an existing wastewater pumping station in Xghajra; 4) the

Ex post evaluation of major projects supported by the European Regional Development
Fund (ERDF) and Cohesion Fund between 2000 and 2013
90
construction of a new 1.7 km wastewater gallery from Rinella to Ta’ Barkat; 5)
the construction of a new 1 km submarine outfall.
FUTURE SCENARIO
Supply
The project supply is represented by the volumes of generated wastewater. While
specific data for Malta South are not available, according to data provided by the
Managing Authority and WSC the total volumes of generated wastewater on the Maltese
islands increase from 26.6 million m³ in 2008 to 30.7 million in 2037.
Figure 19. Total volumes of wastewater generated and treated on the Maltese islands
in cubic meters (2008-2017 historical data and 2018-2037 forecasts)
Source: CSIL elaboration based on data by Managing Authority and WSC
The dynamic of wastewater treated over time may be explained as follows. After the
strong peak recorded in 2011 thanks to the Malta South sewage treatment plant which
started operating, the slight decrease after 2012 can be linked to the issue of farm
waste, which hampered the correct functioning of the sewage treatment plants. As a
matter of fact, the amount of farm waste entering the sewers increased due to the
implementation of the Nitrates Action Programme (see section 2.3). After 2015, the
trend of wastewater treated is positive again, thanks to the effects of measures put in
place to counter illegal farm connections. The decrease in overall wastewater generated
and treated from 2019 to 2022 may be linked to the effects of projects that will be
implemented to counter seawater infiltration into the sewers, and therefore reduce the
flows of sewage received by the plants. Finally, the positive trend from 2022 onwards is
due to expected demographic growth.
-
5,000,000
10,000,000
15,000,000
20,000,000
25,000,000
30,000,000
35,000,000
Wastewater Generated Wastewater treated Estimated wastewater discharged untreated to sea

Ex post evaluation of major projects supported by the European Regional Development
Fund (ERDF) and Cohesion Fund between 2000 and 2013
91
Demand
The project demand is represented by the volumes of treated wastewater. On the
Maltese islands the volumes of wastewater discharged untreated to the sea have
drastically decreased since 2011, and are expected to cease completely in 2019. As a
result, the volumes of generated and treated wastewater are expected to be coincident
from 2019 onwards.
Total volumes treated by the Malta South sewage treatment plant have increased from
12.7 million m³ in 2011 to 19.5 million m³ in 2017. They are expected to reach their
maximum level in 2035, i.e. 24.7 million m³. However, already in 2019 volumes treated
by the Malta South plant are expected to exceed its foreseen daily average flow: as a
matter of fact, the plant was designed to process 60,000 m³ of wastewater per day, but
the total volumes expected in 2019 will correspond to a daily volume of 63,840 m³.
Figure 20. Volumes of treated wastewater by plant in cubic meters (2008-2017
historical data and 2018-2037 forecasts)
Source: CSIL elaboration based on data by Managing Authority and WSC
FINANCIAL ANALYSIS
Investment cost
The table below summarizes the breakdown of the investment according to the main
cost categories.
0
5,000,000
10,000,000
15,000,000
20,000,000
25,000,000
30,000,000
35,000,000
Sant Antnin WWTP Gozo WWTP Malta North WWTP Malta South WWTP Total
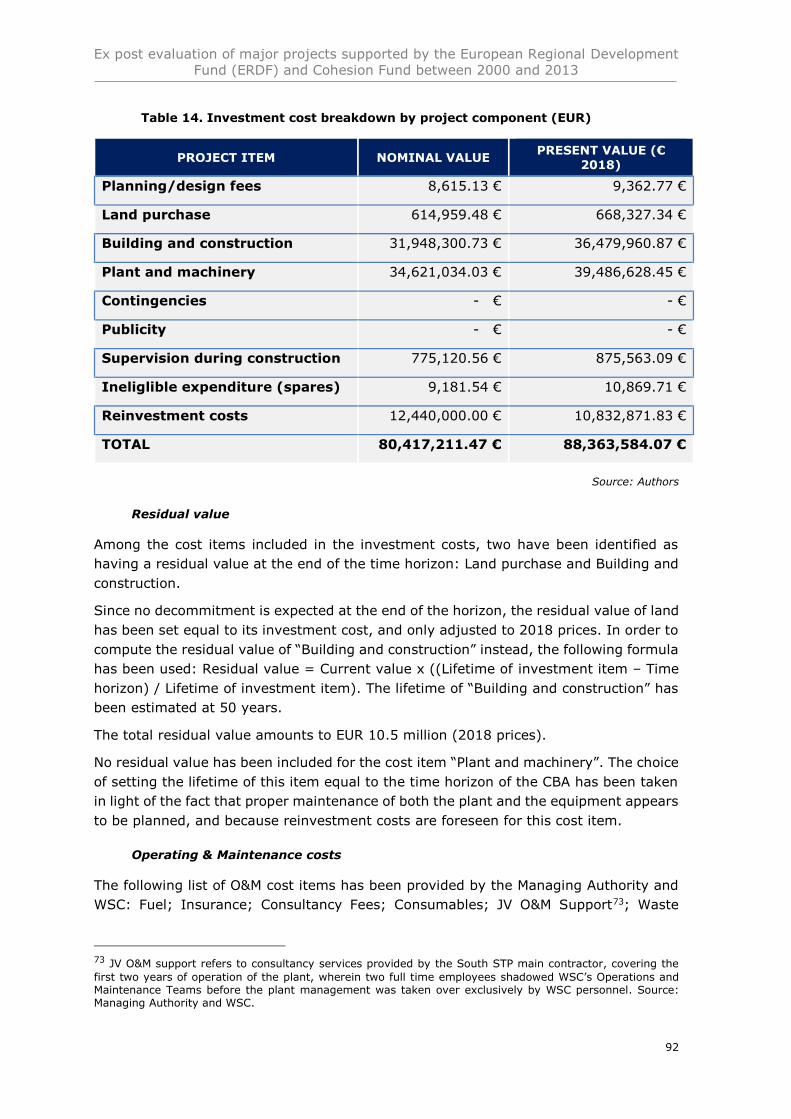
Ex post evaluation of major projects supported by the European Regional Development
Fund (ERDF) and Cohesion Fund between 2000 and 2013
92
Table 14. Investment cost breakdown by project component (EUR)
PROJECT ITEM NOMINAL VALUE PRESENT VALUE (€
2018)
Planning/design fees 8,615.13 € 9,362.77 €
Land purchase 614,959.48 € 668,327.34 €
Building and construction 31,948,300.73 € 36,479,960.87 €
Plant and machinery 34,621,034.03 € 39,486,628.45 €
Contingencies - € - €
Publicity - € - €
Supervision during construction 775,120.56 € 875,563.09 €
Ineliglible expenditure (spares) 9,181.54 € 10,869.71 €
Reinvestment costs 12,440,000.00 € 10,832,871.83 €
TOTAL 80,417,211.47 € 88,363,584.07 €
Source: Authors
Residual value
Among the cost items included in the investment costs, two have been identified as
having a residual value at the end of the time horizon: Land purchase and Building and
construction.
Since no decommitment is expected at the end of the horizon, the residual value of land
has been set equal to its investment cost, and only adjusted to 2018 prices. In order to
compute the residual value of “Building and construction” instead, the following formula
has been used: Residual value = Current value x ((Lifetime of investment item – Time
horizon) / Lifetime of investment item). The lifetime of “Building and construction” has
been estimated at 50 years.
The total residual value amounts to EUR 10.5 million (2018 prices).
No residual value has been included for the cost item “Plant and machinery”. The choice
of setting the lifetime of this item equal to the time horizon of the CBA has been taken
in light of the fact that proper maintenance of both the plant and the equipment appears
to be planned, and because reinvestment costs are foreseen for this cost item.
Operating & Maintenance costs
The following list of O&M cost items has been provided by the Managing Authority and
WSC: Fuel; Insurance; Consultancy Fees; Consumables; JV O&M Support73; Waste
73 JV O&M support refers to consultancy services provided by the South STP main contractor, covering the
first two years of operation of the plant, wherein two full time employees shadowed WSC’s Operations and Maintenance Teams before the plant management was taken over exclusively by WSC personnel. Source: Managing Authority and WSC.
Ex post evaluation of major projects supported by the European Regional Development
Fund (ERDF) and Cohesion Fund between 2000 and 2013
93
Handling; Services; Maintenance; Waste Disposal74; Salaries; Chemicals; Electricity;
Other. All of them have been included in both the financial and the economic analysis.
In accordance with the recommendation included in the CBA guide (European
Commission, 2014), taxes have not been included among the O&M costs.
Future O&M costs for the period 2018-2037 have been set equal to the 2017 data (in
constant prices), which represents the last available figure. As confirmed by the
interviews conducted, no extraordinary maintenance will be needed on the plant in the
future.
O&M costs have been included in the analysis starting from 2011, when the operational
phase of the new sewage treatment plant started. The total amount of O&M costs over
the 30-year time horizon corresponds to EUR 178.4 million (2018 prices, not
discounted). Electricity, salaries and chemicals are the three largest cost items,
amounting respectively to 26%, 22% and 20% of total O&M costs in 2017.
Operating revenues
In the absence of available data on the revenues collected by WSC which can be directly
linked to the service provided by the Malta South plant, such figures have been
computed starting from data on the total revenues of WSC from water tariff collection,
as provided in its annual reports for 2015, 2016 and 2017. This choice has been made
because the water tariff in Malta includes both the provision of water and wastewater
treatment.
Starting with the data from these three years, assumptions have then been made
regarding the growth of these total revenues in the years 2011-2014 and 2018-2037.
In order to take into account only the area of Malta South, and not the whole country,
such values have then been multiplied with 0.8, following the assumption that 80% of
WSC revenues stem from southern Malta. The resulting figures have finally been
multiplied with 0.1, following the assumption that only 10% of WSC revenues collected
in Malta South is attributable to the service provided by the sewage treatment plant.
Project’s Financial Performance
On a financial basis, the profitability of the project is negative. The Financial Net Present
Value (NPV) on investment is equal to -110,296,728 EUR (at a discount rate of 4%,
real), with an internal rate of return of -5.9%. Also, the Financial Net Present Value on
national capital is negative with the level of EUR -15,279,185 and with the internal rate
of return for capital of -1.7%. These negative values confirm that the project was in
need of EU funding since no private investor would have been motivated to implement
it without an appropriate financial incentive. The results of the project financial
performance are presented in Tables overleaf.
74 Waste Handling refers to the transportation cost of waste from the plant to landfill. Waste disposal costs
refer to the landfill waste disposal fees.

Ex post evaluation of major projects supported by the European Regional Development
Fund (ERDF) and Cohesion Fund between 2000 and 2013
94
Table 15. Financial performance indicators of the project
INDICATOR
FNPV/C - EUR 110,296,728
FRR/C - 5.9%
FNPV/K - EUR 15,279,185
FRR/K - 1.7%
Source: authors

Ex post evaluation of major projects supported by the European Regional Development Fund (ERDF) and Cohesion Fund between 2000 and 2013
95
Table 16. Financial return on investment (EUR)
Present value 2008 2009 2010 2011 2012 2013 2014 2015 2016 2017 2018 2019 2020 2021 2022
1 Operational income
126,829,528 0 0 0 2,437,774 4,973,060 5,072,521 5,173,971 5,277,451 5,192,330 4,985,116 5,084,818 5,186,515 5,290,245 5,396,050 5,503,971
2 CAPEX 115,965,713 5,560 26,315,738 44,964,075 4,368,072 2,094,624 73,716 229,385 351,690 122,654 1,063,650 940,000 491,159 481,057 471,163 461,472
2.1 Planning/design fees
11,847 0 0 0 0 9,363 0 0 0 0 0 0 0 0 0 0
2.2 Land purchase 845,647 0 0 0 0 668,327 0 0 0 0 0 0 0 0 0 0
2.3 Building and construction
50,539,051 0 15,076,153 18,437,584 1,870,235 1,095,988 0 0 0 0 0 0 0 0 0 0
2.4 Plant and machinery
54,523,855 0 11,112,944 26,005,107 2,368,577 0 0 0 0 0 0 0 0 0 0 0
2.5 Contingencies 0 0 0 0 0 0 0 0 0 0 0 0 0 0 0 0
2.6 Publicity 0 0 0 0 0 0 0 0 0 0 0 0 0 0 0 0
2.7
Supervision during construction implementation
1,187,411 0 121,330 521,384 129,260 103,589 0 0 0 0 0 0 0 0 0 0
2.8 Ineliglible expenditure (spares)
15,788 5,560 5,310 0 0 0 0 0 0 0 0 0 0 0 0 0
2.9 Reinvestment costs
8,842,114 0 0 0 0 217,357 73,716 229,385 351,690 122,654 1,063,650 940,000 491,159 481,057 471,163 461,472
3 OPEX 148,628,621 0 0 0 5,399,634 7,644,694 6,753,143 6,337,178 6,182,066 6,513,253 6,644,828 6,644,828 6,644,828 6,644,828 6,644,828 6,644,828
3.1 Fuel 640,909 0 0 0 54,877 42,997 12,133 11,408 24,793 26,549 27,924 27,924 27,924 27,924 27,924 27,924
3.2 Insurance 1,450,159 0 0 0 27,825 64,897 65,092 54,801 75,228 67,583 66,981 66,981 66,981 66,981 66,981 66,981
3.3 Consultancy Fees 599,172 0 0 0 405,723 26,930 10,830 3,506 12,023 362 0 0 0 0 0 0
3.4 Other 1,850,292 0 0 0 43,333 64,309 63,474 58,647 68,970 87,583 90,600 90,600 90,600 90,600 90,600 90,600
3.5 Consumables 3,178,413 0 0 0 34,526 101,695 114,149 110,942 97,782 127,562 161,709 161,709 161,709 161,709 161,709 161,709
3.6 JV O&M Support 1,775,171 0 0 0 670,551 577,124 133,584 0 0 0 0 0 0 0 0 0
3.7 Waste Handling 6,763,171 0 0 0 0 0 0 353,664 284,540 369,537 365,952 365,952 365,952 365,952 365,952 365,952
3.8 Services 4,900,874 0 0 0 233,232 393,858 546,875 87,353 211,168 246,556 183,562 183,562 183,562 183,562 183,562 183,562
3.9 Maintenance 13,078,809 0 0 0 411,163 32,973 171,248 361,550 533,231 634,891 687,627 687,627 687,627 687,627 687,627 687,627
3.10 Waste Disposal 13,560,152 0 0 0 0 884,538 673,665 576,216 548,923 639,658 626,504 626,504 626,504 626,504 626,504 626,504
3.11 Salaries 31,865,717 0 0 0 713,864 980,902 1,162,243 1,200,517 1,320,505 1,348,268 1,555,096 1,555,096 1,555,096 1,555,096 1,555,096 1,555,096
3.12 Chemicals 29,945,225 0 0 0 933,105 2,181,968 1,517,657 1,442,483 1,358,568 1,442,040 1,256,827 1,256,827 1,256,827 1,256,827 1,256,827 1,256,827
3.13 Electricity 39,020,557 0 0 0 1,871,435 2,292,502 2,282,193 2,076,091 1,646,335 1,522,661 1,622,046 1,622,046 1,622,046 1,622,046 1,622,046 1,622,046
4 Residual value 4,983,650 0 0 0 0 0 0 0 0 0 0 0 0 0 0 0
5 Benefits from compliance
22,484,427 0 0 0 1,196,467 1,167,285 1,131,090 1,119,891 1,111,003 1,097,829 1,088,037 1,074,074 1,055,083 1,033,382 1,012,127 991,309
6 Total (1-2-3+4) -110,296,728 -5,560 -26,315,738 -44,964,075 -6,133,465 -3,598,973 -623,247 -272,700 -145,302 -345,748 -1,635,325 -1,425,936 -894,390 -802,258 -707,814 -611,019
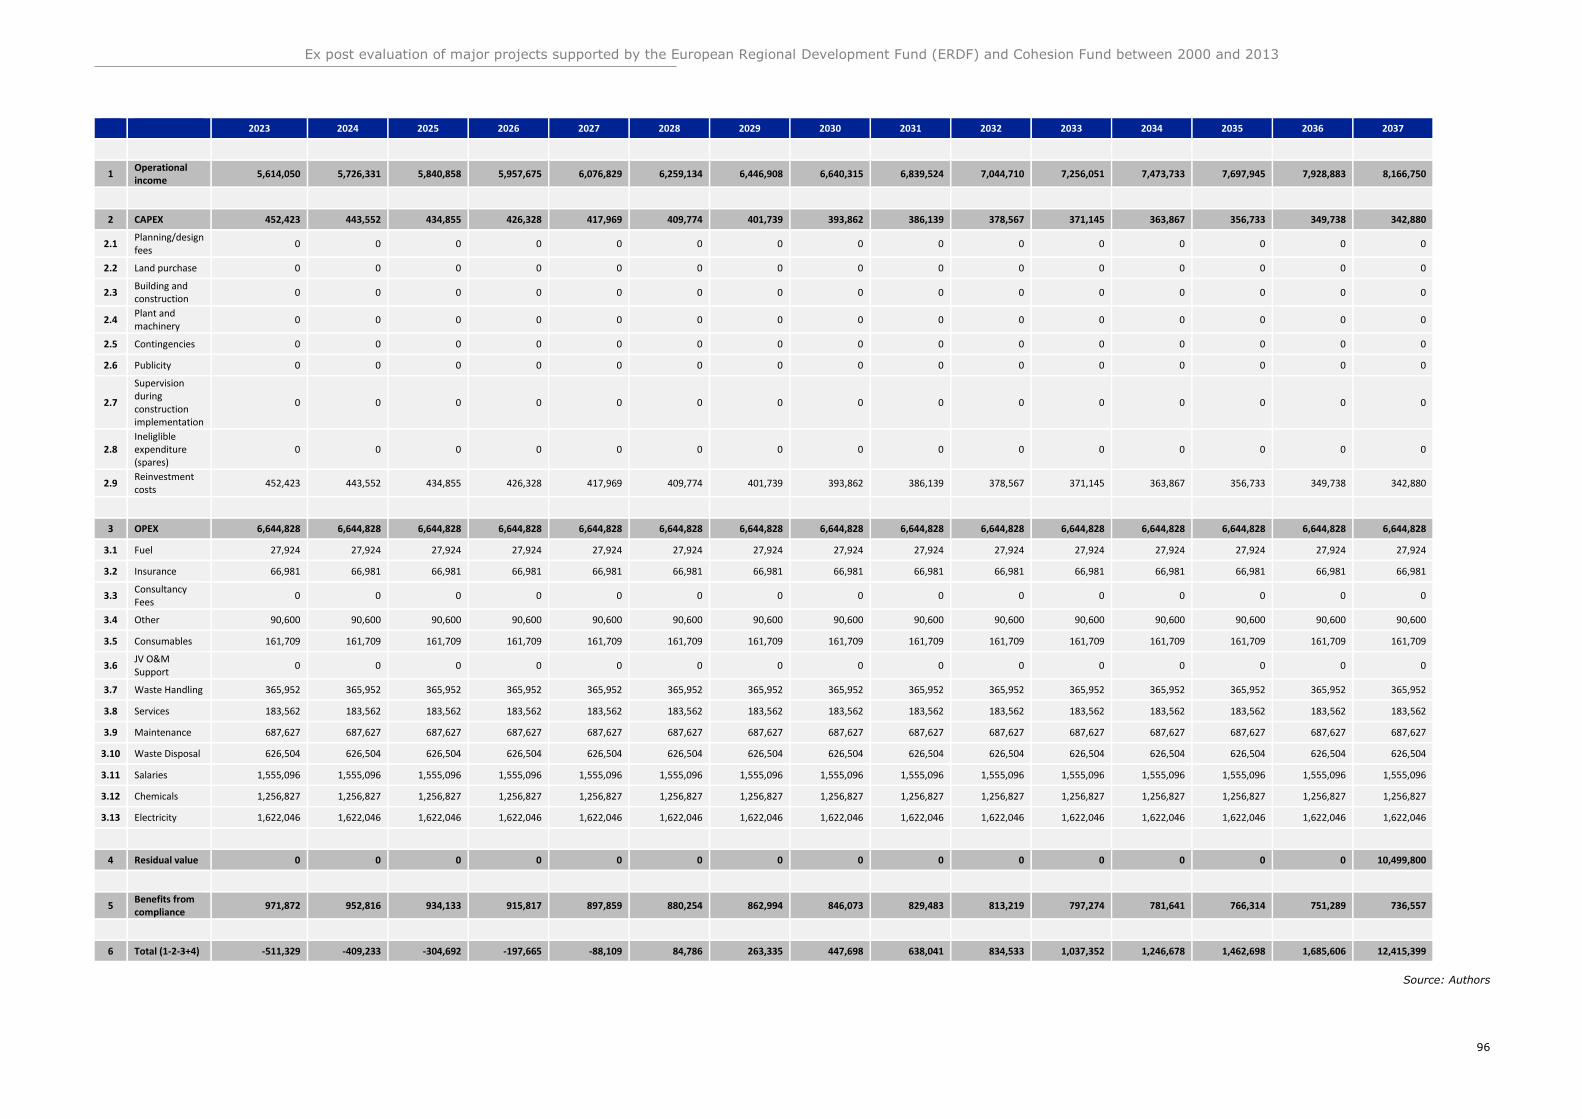
Ex post evaluation of major projects supported by the European Regional Development Fund (ERDF) and Cohesion Fund between 2000 and 2013
96
2023 2024 2025 2026 2027 2028 2029 2030 2031 2032 2033 2034 2035 2036 2037
1 Operational income
5,614,050 5,726,331 5,840,858 5,957,675 6,076,829 6,259,134 6,446,908 6,640,315 6,839,524 7,044,710 7,256,051 7,473,733 7,697,945 7,928,883 8,166,750
2 CAPEX 452,423 443,552 434,855 426,328 417,969 409,774 401,739 393,862 386,139 378,567 371,145 363,867 356,733 349,738 342,880
2.1 Planning/design fees
0 0 0 0 0 0 0 0 0 0 0 0 0 0 0
2.2 Land purchase 0 0 0 0 0 0 0 0 0 0 0 0 0 0 0
2.3 Building and construction
0 0 0 0 0 0 0 0 0 0 0 0 0 0 0
2.4 Plant and machinery
0 0 0 0 0 0 0 0 0 0 0 0 0 0 0
2.5 Contingencies 0 0 0 0 0 0 0 0 0 0 0 0 0 0 0
2.6 Publicity 0 0 0 0 0 0 0 0 0 0 0 0 0 0 0
2.7
Supervision during construction implementation
0 0 0 0 0 0 0 0 0 0 0 0 0 0 0
2.8 Ineliglible expenditure (spares)
0 0 0 0 0 0 0 0 0 0 0 0 0 0 0
2.9 Reinvestment costs
452,423 443,552 434,855 426,328 417,969 409,774 401,739 393,862 386,139 378,567 371,145 363,867 356,733 349,738 342,880
3 OPEX 6,644,828 6,644,828 6,644,828 6,644,828 6,644,828 6,644,828 6,644,828 6,644,828 6,644,828 6,644,828 6,644,828 6,644,828 6,644,828 6,644,828 6,644,828
3.1 Fuel 27,924 27,924 27,924 27,924 27,924 27,924 27,924 27,924 27,924 27,924 27,924 27,924 27,924 27,924 27,924
3.2 Insurance 66,981 66,981 66,981 66,981 66,981 66,981 66,981 66,981 66,981 66,981 66,981 66,981 66,981 66,981 66,981
3.3 Consultancy Fees
0 0 0 0 0 0 0 0 0 0 0 0 0 0 0
3.4 Other 90,600 90,600 90,600 90,600 90,600 90,600 90,600 90,600 90,600 90,600 90,600 90,600 90,600 90,600 90,600
3.5 Consumables 161,709 161,709 161,709 161,709 161,709 161,709 161,709 161,709 161,709 161,709 161,709 161,709 161,709 161,709 161,709
3.6 JV O&M Support
0 0 0 0 0 0 0 0 0 0 0 0 0 0 0
3.7 Waste Handling 365,952 365,952 365,952 365,952 365,952 365,952 365,952 365,952 365,952 365,952 365,952 365,952 365,952 365,952 365,952
3.8 Services 183,562 183,562 183,562 183,562 183,562 183,562 183,562 183,562 183,562 183,562 183,562 183,562 183,562 183,562 183,562
3.9 Maintenance 687,627 687,627 687,627 687,627 687,627 687,627 687,627 687,627 687,627 687,627 687,627 687,627 687,627 687,627 687,627
3.10 Waste Disposal 626,504 626,504 626,504 626,504 626,504 626,504 626,504 626,504 626,504 626,504 626,504 626,504 626,504 626,504 626,504
3.11 Salaries 1,555,096 1,555,096 1,555,096 1,555,096 1,555,096 1,555,096 1,555,096 1,555,096 1,555,096 1,555,096 1,555,096 1,555,096 1,555,096 1,555,096 1,555,096
3.12 Chemicals 1,256,827 1,256,827 1,256,827 1,256,827 1,256,827 1,256,827 1,256,827 1,256,827 1,256,827 1,256,827 1,256,827 1,256,827 1,256,827 1,256,827 1,256,827
3.13 Electricity 1,622,046 1,622,046 1,622,046 1,622,046 1,622,046 1,622,046 1,622,046 1,622,046 1,622,046 1,622,046 1,622,046 1,622,046 1,622,046 1,622,046 1,622,046
4 Residual value 0 0 0 0 0 0 0 0 0 0 0 0 0 0 10,499,800
5 Benefits from compliance
971,872 952,816 934,133 915,817 897,859 880,254 862,994 846,073 829,483 813,219 797,274 781,641 766,314 751,289 736,557
6 Total (1-2-3+4) -511,329 -409,233 -304,692 -197,665 -88,109 84,786 263,335 447,698 638,041 834,533 1,037,352 1,246,678 1,462,698 1,685,606 12,415,399
Source: Authors

Ex post evaluation of major projects supported by the European Regional Development Fund (ERDF) and Cohesion Fund between 2000 and 2013
97
Table 17. Financial return on national capital (EUR)
Present value
2008 2009 2010 2011 2012 2013 2014 2015 2016 2017 2018 2019 2020 2021 2022
1 Inflow 154,297,606 0 0 0 3,634,242 6,140,345 6,203,611 6,293,863 6,388,454 6,290,159 6,073,153 6,158,893 6,241,597 6,323,627 6,408,177 6,495,280
1.1 Revenues from tariffs
126,829,528 0 0 0 2,437,774 4,973,060 5,072,521 5,173,971 5,277,451 5,192,330 4,985,116 5,084,818 5,186,515 5,290,245 5,396,050 5,503,971
1.2 Benefits from compliance
22,484,427 0 0 0 1,196,467 1,167,285 1,131,090 1,119,891 1,111,003 1,097,829 1,088,037 1,074,074 1,055,083 1,033,382 1,012,127 991,309
1.3 Residual value
4,983,650 0 0 0 0 0 0 0 0 0 0 0 0 0 0 0
2 Outflow 168,607,248 5,560 5,310 0 5,399,634 8,459,315 7,437,764 7,171,799 7,136,687 7,247,874 8,309,449 8,199,449 7,759,449 7,759,449 7,759,449 7,759,449
2.1 Fuel 640,909 0 0 0 54,877 42,997 12,133 11,408 24,793 26,549 27,924 27,924 27,924 27,924 27,924 27,924
2.2 Insurance 1,450,159 0 0 0 27,825 64,897 65,092 54,801 75,228 67,583 66,981 66,981 66,981 66,981 66,981 66,981
2.3 Consultancy Fees
599,172 0 0 0 405,723 26,930 10,830 3,506 12,023 362 0 0 0 0 0 0
2.4 Other 1,850,292 0 0 0 43,333 64,309 63,474 58,647 68,970 87,583 90,600 90,600 90,600 90,600 90,600 90,600
2.5 Consumables 3,178,413 0 0 0 34,526 101,695 114,149 110,942 97,782 127,562 161,709 161,709 161,709 161,709 161,709 161,709
2.6 JV O&M Support
1,775,171 0 0 0 670,551 577,124 133,584 0 0 0 0 0 0 0 0 0
2.7 Waste Handling
6,763,171 0 0 0 0 0 0 353,664 284,540 369,537 365,952 365,952 365,952 365,952 365,952 365,952
2.8 Services 4,900,874 0 0 0 233,232 393,858 546,875 87,353 211,168 246,556 183,562 183,562 183,562 183,562 183,562 183,562
2.9 Maintenance 13,078,809 0 0 0 411,163 32,973 171,248 361,550 533,231 634,891 687,627 687,627 687,627 687,627 687,627 687,627
2.10 Waste Disposal
13,560,152 0 0 0 0 884,538 673,665 576,216 548,923 639,658 626,504 626,504 626,504 626,504 626,504 626,504
2.11 Salaries 31,865,717 0 0 0 713,864 980,902 1,162,243 1,200,517 1,320,505 1,348,268 1,555,096 1,555,096 1,555,096 1,555,096 1,555,096 1,555,096
2.12 Chemicals 29,945,225 0 0 0 933,105 2,181,968 1,517,657 1,442,483 1,358,568 1,442,040 1,256,827 1,256,827 1,256,827 1,256,827 1,256,827 1,256,827
2.13 Electricity 39,020,557 0 0 0 1,871,435 2,292,502 2,282,193 2,076,091 1,646,335 1,522,661 1,622,046 1,622,046 1,622,046 1,622,046 1,622,046 1,622,046
2.14 Replacement costs
8,842,114 0 0 0 0 200,000 70,000 220,000 340,000 120,000 1,050,000 940,000 500,000 500,000 500,000 500,000
2.15 Loan repayment
11,120,726 0 0 0 0 614,621 614,621 614,621 614,621 614,621 614,621 614,621 614,621 614,621 614,621 614,621
2.16
National funds for ineligible costs
15,788 5,560 5,310 0 0 0 0 0 0 0 0 0 0 0 0 0
3 TOTAL (1-2) -15,279,185 -8,230 -7,558 0 -2,323,136 -2,934,237 -1,501,535 -1,027,062 -841,661 -1,035,864 -2,325,748 -2,040,557 -1,459,473 -1,327,499 -1,201,276 -1,080,617

Ex post evaluation of major projects supported by the European Regional Development Fund (ERDF) and Cohesion Fund between 2000 and 2013
98
2023 2024 2025 2026 2027 2028 2029 2030 2031 2032 2033 2034 2035 2036 2037
1 Inflow 6,585,922 6,679,147 6,774,991 6,873,492 6,974,688 7,139,388 7,309,902 7,486,388 7,669,008 7,857,929 8,053,325 8,255,374 8,464,259 8,680,172 19,403,107
1.1 Revenues from tariffs
5,614,050 5,726,331 5,840,858 5,957,675 6,076,829 6,259,134 6,446,908 6,640,315 6,839,524 7,044,710 7,256,051 7,473,733 7,697,945 7,928,883 8,166,750
1.2 Benefits from compliance
971,872 952,816 934,133 915,817 897,859 880,254 862,994 846,073 829,483 813,219 797,274 781,641 766,314 751,289 736,557
1.3 Residual value
0 0 0 0 0 0 0 0 0 0 0 0 0 0 10,499,800
2 Outflow 7,759,449 7,759,449 7,759,449 7,759,449 7,759,449 7,759,449 7,759,449 7,759,449 7,759,449 7,144,828 7,144,828 7,144,828 7,144,828 7,144,828 7,144,828
2.1 Fuel 27,924 27,924 27,924 27,924 27,924 27,924 27,924 27,924 27,924 27,924 27,924 27,924 27,924 27,924 27,924
2.2 Insurance 66,981 66,981 66,981 66,981 66,981 66,981 66,981 66,981 66,981 66,981 66,981 66,981 66,981 66,981 66,981
2.3 Consultancy Fees
0 0 0 0 0 0 0 0 0 0 0 0 0 0 0
2.4 Other 90,600 90,600 90,600 90,600 90,600 90,600 90,600 90,600 90,600 90,600 90,600 90,600 90,600 90,600 90,600
2.5 Consumables 161,709 161,709 161,709 161,709 161,709 161,709 161,709 161,709 161,709 161,709 161,709 161,709 161,709 161,709 161,709
2.6 JV O&M Support
0 0 0 0 0 0 0 0 0 0 0 0 0 0 0
2.7 Waste Handling
365,952 365,952 365,952 365,952 365,952 365,952 365,952 365,952 365,952 365,952 365,952 365,952 365,952 365,952 365,952
2.8 Services 183,562 183,562 183,562 183,562 183,562 183,562 183,562 183,562 183,562 183,562 183,562 183,562 183,562 183,562 183,562
2.9 Maintenance 687,627 687,627 687,627 687,627 687,627 687,627 687,627 687,627 687,627 687,627 687,627 687,627 687,627 687,627 687,627
2.10 Waste Disposal
626,504 626,504 626,504 626,504 626,504 626,504 626,504 626,504 626,504 626,504 626,504 626,504 626,504 626,504 626,504
2.11 Salaries 1,555,096 1,555,096 1,555,096 1,555,096 1,555,096 1,555,096 1,555,096 1,555,096 1,555,096 1,555,096 1,555,096 1,555,096 1,555,096 1,555,096 1,555,096
2.12 Chemicals 1,256,827 1,256,827 1,256,827 1,256,827 1,256,827 1,256,827 1,256,827 1,256,827 1,256,827 1,256,827 1,256,827 1,256,827 1,256,827 1,256,827 1,256,827
2.13 Electricity 1,622,046 1,622,046 1,622,046 1,622,046 1,622,046 1,622,046 1,622,046 1,622,046 1,622,046 1,622,046 1,622,046 1,622,046 1,622,046 1,622,046 1,622,046
2.14 Replacement costs
500,000 500,000 500,000 500,000 500,000 500,000 500,000 500,000 500,000 500,000 500,000 500,000 500,000 500,000 500,000
2.15 Loan repayment
614,621 614,621 614,621 614,621 614,621 614,621 614,621 614,621 614,621 0 0 0 0 0 0
2.16
National funds for ineligible costs
0 0 0 0 0 0 0 0 0 0 0 0 0 0 0
3 TOTAL (1-2) -964,554 -1,080,302 -748,107 -647,360 -551,363 -418,891 -292,017 -170,553 -54,317 411,798 504,456 592,929 677,361 757,889 5,818,299
Source: Authors

Ex post evaluation of major projects supported by the European Regional Development
Fund (ERDF) and Cohesion Fund between 2000 and 2013
99
Financial Sustainability
The financial sustainability of the major project during the implementation phase was
ensured by funds provided by the European Union through the Operational Programme
I – Investing in Competitiveness for a Better Quality of Life and by the national 2007-
2013, and by the government, which in turn financed itself through a loan issued by the
EIB.
The project’s financial sustainability over its operational phase falls under the
responsibilities of WSC instead. In this regard, WSC receives government subventions
by the government, which contribute to the project’s sustainability together with the
collected tariff. These subventions, however, are to be phased out by 2032. By then,
WSC should achieve full financial independence from them, and compliance with the
principle of full cost recovery should be achieved.
Setting the tariff at the level required for achieving full cost recovery, according to the
ex-ante CBA, could have raised issues related to users’ willingness-to-pay, in the light
of the fact that the tariff was already high before the project implementation (as a
percentage of household income). Full cost recovery was therefore agreed to be
achieved in a gradual way.

Ex post evaluation of major projects supported by the European Regional Development Fund (ERDF) and Cohesion Fund between 2000
and 2013
100
Table 18. Financial sustainability of the project (EUR)
Total 2008 2009 2010 2011 2012 2013 2014 2015 2016 2017 2018 2019 2020 2021
TOTAL
SOURCE OF
FINANCING
77,529,451 5,560 26,315,738 44,964,075 4,368,072 1,876,006 0 0 0 0 0 0 0 0 0
TOTAL
REVENUES 160,543,518 0 0 0 2,437,774 4,973,060 5,072,521 5,173,971 5,277,451 5,192,330 4,985,116 5,084,818 5,186,515 5,290,245 5,396,050
GOVERNMENT
SUBVENTION 44,490,570 0 0 0 2,961,860 3,504,873 2,368,959 2,007,213 1,870,926 2,058,198 3,337,983 3,114,631 2,564,094 2,450,261 2,334,562
TOTAL
INFLOWS 238,072,969 5,560 26,315,738 44,964,075 9,767,707 10,353,939 7,441,480 7,181,184 7,148,377 7,250,528 8,323,099 8,199,449 7,750,608 7,740,506 7,730,612
CAPEX 88,363,584 5,560 26,315,738 44,964,075 4,368,072 2,094,624 73,716 229,385 351,690 122,654 1,063,650 940,000 491,159 481,057 471,163
OPEX 178,371,360 0 0 0 5,399,634 7,644,694 6,753,143 6,337,178 6,182,066 6,513,253 6,644,828 6,644,828 6,644,828 6,644,828 6,644,828
REPAYMENT
OF LOAN 12,292,422 0 0 0 0 614,621 614,621 614,621 614,621 614,621 614,621 614,621 614,621 614,621 614,621
TOTAL
OUTFLOWS 279,027,366 5,560 26,315,738 44,964,075 9,767,707 10,353,939 7,441,480 7,181,184 7,148,377 7,250,528 8,323,099 8,199,449 7,750,608 7,740,506 7,730,612
NET CASH
FLOWS 3,536,173 0 0 0 0 0 0 0 0 0 0 0 0 0 0
CUMULATED
CASH FLOWS 8,325,256 0 0 0 0 0 0 0 0 0 0 0 0 0 0

Ex post evaluation of major projects supported by the European Regional Development Fund (ERDF) and Cohesion Fund between 2000
and 2013
101
2022 2023 2024 2025 2026 2027 2028 2029 2030 2031 2032 2033 2034 2035 2036 2037
TOTAL SOURCE OF FINANCING
0 0 0 0 0 0 0 0 0 0 0 0 0 0 0 0
TOTAL REVENUES
5,503,971 5,614,050 5,726,331 5,840,858 5,957,675 6,076,829 6,259,134 6,446,908 6,640,315 6,839,524 7,044,710 7,256,051 7,473,733 7,697,945 7,928,883 8,166,750
GOVERNMENT SUBVENTION
2,216,950 2,097,822 1,976,670 1,853,446 1,728,103 1,600,590 1,410,089 1,214,281 1,012,996 806,064 0 0 0 0 0 0
TOTAL INFLOWS
7,720,921 7,711,872 7,703,001 7,694,304 7,685,778 7,677,418 7,669,223 7,661,188 7,653,311 7,645,588 7,044,710 7,256,051 7,473,733 7,697,945 7,928,883 8,166,750
CAPEX 461,472 452,423 443,552 434,855 426,328 417,969 409,774 401,739 393,862 386,139 378,567 371,145 363,867 356,733 349,738 342,880
OPEX 6,644,828 6,644,828 6,644,828 6,644,828 6,644,828 6,644,828 6,644,828 6,644,828 6,644,828 6,644,828 6,644,828 6,644,828 6,644,828 6,644,828 6,644,828 6,644,828
REPAYMENT OF LOAN
614,621 614,621 614,621 614,621 614,621 614,621 614,621 614,621 614,621 614,621 0 0 0 0 0 0
TOTAL OUTFLOWS
7,720,921 7,711,872 7,703,001 7,694,304 7,685,778 7,677,418 7,669,223 7,661,188 7,653,311 7,645,588 7,023,396 7,015,973 7,008,695 7,001,561 6,994,566 6,987,708
NET CASH FLOWS
0 0 0 0 0 0 0 0 0 0 21,314 240,079 465,037 696,384 934,317 1,179,041
CUMULATED CASH FLOWS
0 0 0 0 0 0 0 0 0 0 21,314 261,393 726,430 1,422,814 2,357,131 3,536,173
Source: authors

Ex post evaluation of major projects supported by the European Regional
Development Fund (ERDF) and Cohesion Fund between 2000 and 2013
102
ECONOMIC ANALYSIS
From market to accounting prices
In line with the CBA Guide (European Commission, 2014), the social opportunity cost of
the project’s inputs and outputs has been considered in the economic analysis. For this
purpose, market prices have been converted into accounting prices by using appropriate
conversion factors. As for labour, it is worth noting that the shadow wages provided for
Malta in the First Interim Report to correct past and future values have been adopted
(0.74 and 0.62 respectively). For most other inputs, a conversion factor equal to 1 has
been chosen, thus confirming the approach taken by the Ex-ante CBA. In order to justify
a unitary conversion factor, the Ex-ante CBA mentioned a high degree of trade
dependence in Malta, resulting in significant trade openness, and the fact that Malta is
a price taker on international markets. A critical analysis confirmed that those
circumstances did not change in recent years.
A different choice has been taken with regard to electricity, whose conversion factor,
0.95, has been chosen to correct the existing fiscal distortion (which was found equal
to 5% by a 2016 study75).
In the case of “Building and construction”, moreover, assumptions have been made
regarding its composition in terms of labour (30%), materials (60%) and energy (10%).
Its conversion factor (0.9170) thus resulted from weighing these quotas with the
respective conversion factor (i.e. the backward shadow wage for labour, a conversion
factor of 1 for materials, and 0.95 for electricity).
The Table below summarises the conversion factors applied for each cost item.
Table 19. Conversion factors for input
ITEM CONVERSION FACTOR SOURCE
Backward shadow wage 0.7400 First interim report
Forward shadow wage 0.6200 First interim report
Residual value 0.9203
Weighted conversion
factors of cost items having
residual value (“Land
purchase” and “Building
and construction”)
Planning/design fees 0.7400 Backward shadow wage
Land purchase 1.0000 Assumption (Ex-ante CBA)
Building and construction 0.9170 Assumption: 30% labour
(0.74), 60% materials (1),
10% energy (0.95)
Plant and machinery 1.0000 Assumption (Ex-ante CBA)
Contingencies 1.0000 Assumption (Ex-ante CBA)
75 Eurelectric, 2016. Drivers of Electricity Bills: Supporting graphs, methodology and country notes, available
at: https://www3.eurelectric.org/media/263668/drivers_of_electricity_bills_study-graphs_methodology__countrynotes-2016-030-0113-01-e.pdf.

Ex post evaluation of major projects supported by the European Regional
Development Fund (ERDF) and Cohesion Fund between 2000 and 2013
103
ITEM CONVERSION FACTOR SOURCE
Publicity 1.0000 Assumption (Ex-ante CBA)
Supervision during
construction 0.7400 Backward shadow wage
Ineligible expenditure 1.0000 Assumption (Ex-ante CBA)
Reinvestment costs 1.0000 Assumption (Ex-ante CBA)
Fuel 1.0000 Assumption (Ex-ante CBA)
Insurance 1.0000 Assumption (Ex-ante CBA)
Consultancy Fees 0.7400 / 0.6200
Backward / forward
shadow wage
Other 1.0000 Assumption (Ex-ante CBA)
Consumables 1.0000 Assumption (Ex-ante CBA)
JV O&M Support 0.7400 / 0.6200
Backward / forward
shadow wage
Waste Handling 1.0000 Assumption (Ex-ante CBA)
Services 1.0000 Assumption (Ex-ante CBA)
Maintenance 1.0000 Assumption (Ex-ante CBA)
Waste Disposal 1.0000 Assumption (Ex-ante CBA)
Salaries 0.7400 / 0.6200
Backward / forward
shadow wage
Chemicals 1.0000 Assumption (Ex-ante CBA)
Electricity 0.9500 Assumption
Source: Authors based on cited sources
Project’s effects
The ex-post CBA singled out four socioeconomic effects generated by the Malta South
sewage treatment plant. Among these, two positively contribute to the welfare of
society, while the other two represent welfare losses. Their monetised value, however,
greatly differs.
As graphically shown by the following figure, the decrease in seawater
contamination constitutes by far the largest socioeconomic effect generated
by the major project (EUR 279 million in 2018 prices, discounted). The second-largest
effect quantitatively assessed by the CBA is positive as well, and consists in increased
wellbeing for residents (EUR 102 million). On the side of economic costs, the monetised
values of the two effects are significantly smaller. GHG emissions amount to EUR -15.3
million, and disamenities to EUR -355,000.

Ex post evaluation of major projects supported by the European Regional
Development Fund (ERDF) and Cohesion Fund between 2000 and 2013
104
Figure 22. Quantification of project’s effects considered in the ex-post CBA (Present
Value, EUR)
Source: Authors
No evidence could be found of improved quality in drinking water, which was an effect
included in the ex-ante CBA. No data on better quality, nor information on decreasing
costs for the Pembroke desalination plant producing drinking water could be found. For
this reason, the conservative choice was taken to not include this benefit in the CBA.
Variation in the contamination of seawater
In the ex-post CBA, the variation in seawater contamination has been quantitatively
assessed by attaching a non-use value to it, which has been calculated by estimating
the WTP for the pure existence of good seawater.
To estimate such WTP, the value transfer approach has been adopted, by considering a
2011 study for a wastewater treatment and restoration project in Spain, on the country’s
Mediterranean coast: Economic valuation of coastal lagoon environmental restoration:
Mar Menor (SE Spain) by Perni, Martínez-Carrasco and Martínez-Paz.
The project was selected from the EVRI repository, after considering studies similar to
the Maltese case. The Spanish study was preferred to other studies because, while being
relatively recent, it also showed significant similarities with the Ta’ Barkat project (in
terms of geographic position, project type, and environmental conditions).
The Spanish study identified the annual non-use value individuals would be willing to
pay for a ‘good’ and for a ‘moderate’ scenario of clean seawater (under the Water
Framework Directive). Since in the Maltese case the non-use value included
safeguarding marine ecosystems and biodiversity as well, the WTP for the ‘good’
scenario has been chosen as the more adequate reference value.
After adjusting the non-use WTP identified by the Spanish study to the context of Malta
and to its GDP per capita growth, the average yearly amount an individual would be
willing to pay for the pure existence of good seawater (EUR 18.93 in 2010, at 2018
prices) was multiplied with the population equivalent of the sewage treatment plant, i.e.
500,000. On this point, the choice to attribute the willingness to pay for non-use to the
Non-use valueof cleanseawater
Use value forbathing andrecreationalpurposes
Change in valueof real estate
GHG emissions
Value of the effect €279085143.92996 €102450896.18288 €(355239.33950) €(15328143.10626
-50,000,000
0
50,000,000
100,000,000
150,000,000
200,000,000
250,000,000
300,000,000
Ex post evaluation of major projects supported by the European Regional
Development Fund (ERDF) and Cohesion Fund between 2000 and 2013
105
total population equivalent derived from the need to capture not only benefits generated
for residents, but also those for commercial users and tourists. For its evolution over
time, the population equivalent was linked to the demographic growth in the districts
served by the plant.
According to this quantitative assessment, the socio-economic non-use value for an
increase in the quality of seawater amounts to EUR 279 million over the chosen time
horizon (at 2018 prices, discounted). The non-use value, which had not been considered
in the Ex-ante CBA, thus proves to be the largest positive effect generated by the major
project.
Increased wellbeing for residents
The major project opened up the opportunity to use good quality seawater off the
Maltese south-eastern coast for recreational activities (e.g. for bathing or diving).
The fact that the 2011 paper on the Mar Menor case study had identified, beyond a non-
use value, also a use value, led to the choice of adopting the benefit transfer method
for measuring the effect of increased wellbeing as well. In fact, the clear distinction
between use and non-use value in the same study allows to ensure methodological
rigour by avoiding the problem of double counting.
After adjusting the values identified by the 2011 Spanish study by the per capita GDP
of Malta, the average yearly amounts that individuals would be willing to pay for using
seawater for recreational purposes were adapted so as to follow the trend of GDP growth
in Malta over the time horizon.
Finally, willingness to pay for bathing and recreational purposes was multiplied with the
resident population of the four districts served by the Malta South sewage treatment
plant, following the assumption that this population is the one interested in using
seawater in that area for recreational purposes.
As a result, the estimated value of increased wellbeing for residents generated by the
new plant amounts to EUR 102 million over the chosen time horizon (at 2018 prices,
discounted).
GHG emissions
GHG emissions derived from transport of sludge76 and screenings were calculated
following the same approach and assumptions of the Ex-ante CBA, after critically
assessing them. Their monetisation, however, adopted the conversion factors and the
adders provided by the First Interim Report.
Emissions from energy use have been calculated anew instead, dividing the cost of
electricity (provided as an item of operating costs) with the price of electricity, which
was assumed constant. The resulting amount of kWh (representing the electricity
absorbed from the grid) has been assumed to correspond to 70% of total electricity
used by the plant. This choice has been taken based on the information that self-
76 Beyond GHG emissions, transport generates other air pollutants as well. However, the choice has been
taken not to include this effect in the CBA for two reasons: first, because of its very minor size, which would have made no difference on the CBA’s ultimate results; second, in order to ensure comparability with the effects of other environmental case studies, which do not entail emissions generated through transport.

Ex post evaluation of major projects supported by the European Regional
Development Fund (ERDF) and Cohesion Fund between 2000 and 2013
106
generated energy covers 30% of the total needs of the plant. After that, the total
amount of kWh used by the plant has been multiplied with the same factor adopted in
the ex-ante CBA to transform kWh into kg CO₂ equivalent (0.89), after critically
assessing it by checking that the factor suggested by the Environment Protection Agency
of the United States was comparable (0.74).
The amount of energy used in the counterfactual BAU scenario has been assumed as
nil.
Disamenities
While the project greatly improved the image of the area thanks to the removal of
odours and disamenities caused by the previous outfall, minor effects generated by new,
different disamenities have to be taken into account as well.
In particular, the project generated a loss in the value of real estate in the proximity of
the plant. In order to measure this loss, the same approach of the Ex-ante CBA was
adopted, with the notable difference of considering only the area already developed into
real estate, and not the one developable into real estate as well.
This choice has been made due to the fact that the effect would otherwise have been
wrongly attributed to the major project: as a matter of fact, the decision to develop an
area into real estate depends on many factors, and it cannot be directly attributed to
the plant’s construction. Furthermore, an effort was made to try to expand the area of
interest for the computation of this benefit beyond the distance of 200 meters from the
plant (as in the Ex-ante CBA) to 500 meters, but no data were readily available on the
disaggregation between land developed into real estate and land developable into real
estate. Nevertheless, analysing a satellite map of the area reveals that within that area,
no relevant real estate exists. Therefore, the validity of the approach taken can be
confirmed.
Project’s Economic Performance
Table 20. Economic performance indicators of the project
INDICATOR EUR
ENPV 122,680,685
B/C 1.50
EIRR 12.89%
Source: Authors
On an economic basis, all indicators show that the project causes a positive
welfare change for the society. The Economic Net Present Value (NPV) of the
investment, i.e. the difference between discounted total social benefits and social costs,
valued at shadow prices, is equal to EUR 122,680,685, with an economic internal rate
of return (EIRR) of 12.89%, thus higher than the Social Discount Rate.
In addition, the ratio between discounted economic benefits and costs, valued at shadow
prices, is 1.50, suggesting that society is better off with the project. While the positive
benefit/cost ratio might seem rather little, it should be remembered that considerable
positive effects could only be discussed qualitatively and not be included in the ex-post

Ex post evaluation of major projects supported by the European Regional
Development Fund (ERDF) and Cohesion Fund between 2000 and 2013
107
CBA. Among these, three can be singled out for their crucial importance: first, the major
project enabled the implementation of additional investments, which generated
significant benefits on their own; second, it contributed to an increase in the value of
real estate in the Xghajra wider area; finally, it contributed to a dynamic of touristic and
economic development.
The results of the economic analysis are presented in the table below.

Ex post evaluation of major projects supported by the European Regional Development Fund (ERDF) and Cohesion Fund between 2000 and 2013
108
Table 21. Economic return of the project (EUR)
Present value
2008 2009 2010 2011 2012 2013 2014 2015 2016 2017 2018 2019
1 CAPEX 124,555,700 5,560 25,032,871 43,298,196 4,179,235 1,974,289 73,716 229,385 351,690 122,654 1,063,650 940,000 491,159
1.1 Planning/design fees
9,630 - - - - 6,928 - - - - - - -
1.2 Land purchase 928,880 - - - - 668,327 - - - - - - -
1.3 Building and construction
52,791,442 - 13,824,833 16,907,265 1,715,006 1,005,021 - - - - - - -
1.4 Plant and machinery
62,021,939 - 11,112,944 26,005,107 2,368,577 - - - - - - - -
1.5 Contingencies - - - - - - - - - - - - -
1.6 Publicity - - - - - - - - - - - - -
1.7
Supervision during construction implementation
992,531 - 89,784 385,824 95,652 76,656 - - - - - - -
1.8 Ineliglible expenditure (spares)
18,324 5,560 5,310 - - - - - - - - - -
1.9 Reinvestment costs
7,792,954 - - - - 217,357 73,716 229,385 351,690 122,654 1,063,650 940,000 491,159
2 OPEX 121,384,951 - - - 4,840,627 7,117,980 6,299,302 5,920,328 5,753,292 6,086,476 6,159,401 5,972,789 5,972,789
2.1 Fuel 579,778 - - - 54,877 42,997 12,133 11,408 24,793 26,549 27,924 27,924 27,924
2.2 Insurance 1,289,579 - - - 27,825 64,897 65,092 54,801 75,228 67,583 66,981 66,981 66,981
2.3 Consultancy Fees 493,079 - - - 300,235 19,929 8,014 2,595 8,897 268 - - -
2.4 Other
1,625,525 - - -
43,333
64,309
63,474
58,647
68,970
87,583
90,600
90,600
90,600
2.5 Consumables
2,767,280 - - -
34,526
101,695
114,149
110,942
97,782
127,562
161,709
161,709
161,709
2.6 JV O&M Support
1,452,179 - - -
496,208
427,072
98,852
-
-
-
-
-
-
2.7 Waste Handling
5,780,582 - - -
-
-
-
353,664
284,540
369,537
365,952
365,952
365,952
2.8 Services
4,545,725 - - -
233,232
393,858
546,875
87,353
211,168
246,556
183,562
183,562
183,562
2.9 Maintenance
11,291,189 - - -
411,163
32,973
171,248
361,550
533,231
634,891
687,627
687,627
687,627
2.10 Waste Disposal
12,056,202 - - -
-
884,538
673,665
576,216
548,923
639,658
626,504
626,504
626,504
2.11 Salaries
18,584,075 - - -
528,259
725,867
860,059
888,382
977,174
997,719
1,150,771
964,159
964,159
2.12 Chemicals
27,178,510
- -
-
933,105
2,181,968
1,517,657
1,442,483
1,358,568
1,442,040
1,256,827
1,256,827
1,256,827
2.13 Electricity
33,741,247
- -
-
1,777,864
2,177,877
2,168,084
1,972,286
1,564,019
1,446,528
1,540,944
1,540,944
1,540,944
3 RESIDUAL VALUE
2,768,678
-
-
-
-
-
-
-
-
-
-
-
-

Ex post evaluation of major projects supported by the European Regional Development Fund (ERDF) and Cohesion Fund between 2000 and 2013
109
4 SOCIOECONOMIC EFFECTS
286,494,820 -14,106 - 14,106 -14,106 9,499,094 9,420,865 9,545,737 10,372,216 11,611,013 12,326,111 13,321,696 14,210,692 14,873,759
4.1 Non-use value of clean seawater
279,085,144
-
-
-
9,404,831
9,475,260
9,604,935
10,327,232
11,359,515
12,006,917
12,989,730
13,854,158
14,506,834
4.2 Use for bathing + recreational purposes
20,324,380
-
-
-
699,800
709,323
729,652
791,278
870,452
913,215
983,024
1,027,975
1,058,748
4.3 Negative change in value of real estate
355,239
14,106
14,106
14,106
14,106
14,106
14,106
14,106
14,106
14,106
14,106
14,106
14,106
4.4
Negative externality: Emissions from sludge transport
430,380
-
-
-
15,313
15,920
16,526
17,133
17,739
18,345
18,952
19,558
20,165
4.5
Negative externality: Emissions from energy use
14,897,763
-
-
-
576,118
733,692
758,218
715,055
587,110
561,570
618,000
637,776
657,551
5 TOTAL (4+3-1-2) 40,554,169 - 34,040 - 41,040,331 - 67,179,753 703,631 456,701 4,174,203 5,258,763 6,491,182 6,826,435 6,442,609 7,297,903 7,874,355

Ex post evaluation of major projects supported by the European Regional Development Fund (ERDF) and Cohesion Fund between 2000 and 2013
110
2020 2021 2022 2023 2024 2025 2026 2027 2028 2029 2030 2031 2032 2033 2034 2035 2036 2037
1 CAPEX
481,057
471,163
461,472
452,423
443,552
434,855
426,328
417,969
409,774
401,739
393,862
386,139
378,567
371,145
363,867
356,733
349,738
342,880
1.1 Planning/design fees
-
-
-
-
-
-
-
-
-
-
-
-
-
-
-
-
-
-
1.2 Land purchase
-
-
-
-
-
-
-
-
-
-
-
-
-
-
-
-
-
-
1.3 Building and construction
-
-
-
-
-
-
-
-
-
-
-
-
-
-
-
-
-
-
1.4 Plant and machinery
-
-
-
-
-
-
-
-
-
-
-
-
-
-
-
-
-
-
1.5 Contingencies
-
-
-
-
-
-
-
-
-
-
-
-
-
-
-
-
-
-
1.6 Publicity
-
-
-
-
-
-
-
-
-
-
-
-
-
-
-
-
-
-
1.7
Supervision during construction implementation
-
-
-
-
-
-
-
-
-
-
-
-
-
-
-
-
-
-
1.8 Ineliglible expenditure (spares)
-
-
-
-
-
-
-
-
-
-
-
-
-
-
-
-
-
-
1.9 Reinvestment costs
481,057
471,163
461,472
452,423
443,552
434,855
426,328
417,969
409,774
401,739
393,862
386,139
378,567
371,145
363,867
356,733
349,738
342,880
2 OPEX
5,972,789
5,972,789
5,972,789
5,972,789
5,972,789
5,972,789
5,972,789
5,972,789
5,972,789
5,972,789
5,972,789
5,972,789
5,972,789
5,972,789
5,972,789
5,972,789
5,972,789
5,972,789
2.1 Fuel
27,924
27,924
27,924
27,924
27,924
27,924
27,924
27,924
27,924
27,924
27,924
27,924
27,924
27,924
27,924
27,924
27,924
27,924
2.2 Insurance
66,981
66,981
66,981
66,981
66,981
66,981
66,981
66,981
66,981
66,981
66,981
66,981
66,981
66,981
66,981
66,981
66,981
66,981
2.3 Consultancy Fees
-
-
-
-
-
-
-
-
-
-
-
-
-
-
-
-
-
-
2.4 Other
90,600
90,600
90,600
90,600
90,600
90,600
90,600
90,600
90,600
90,600
90,600
90,600
90,600
90,600
90,600
90,600
90,600
90,600
2.5 Consumables
161,709
161,709
161,709
161,709
161,709
161,709
161,709
161,709
161,709
161,709
161,709
161,709
161,709
161,709
161,709
161,709
161,709
161,709
2.6 JV O&M Support
-
-
-
-
-
-
-
-
-
-
-
-
-
-
-
-
-
-
2.7 Waste Handling
365,952
365,952
365,952
365,952
365,952
365,952
365,952
365,952
365,952
365,952
365,952
365,952
365,952
365,952
365,952
365,952
365,952
365,952
2.8 Services
183,562
183,562
183,562
183,562
183,562
183,562
183,562
183,562
183,562
183,562
183,562
183,562
183,562
183,562
183,562
183,562
183,562
183,562
2.9 Maintenance
687,627
687,627
687,627
687,627
687,627
687,627
687,627
687,627
687,627
687,627
687,627
687,627
687,627
687,627
687,627
687,627
687,627
687,627
2.10 Waste Disposal
626,504
626,504
626,504
626,504
626,504
626,504
626,504
626,504
626,504
626,504
626,504
626,504
626,504
626,504
626,504
626,504
626,504
626,504
2.11 Salaries
964,159
964,159
964,159
964,159
964,159
964,159
964,159
964,159
964,159
964,159
964,159
964,159
964,159
964,159
964,159
964,159
964,159
964,159
2.12 Chemicals
1,256,827
1,256,827
1,256,827
1,256,827
1,256,827
1,256,827
1,256,827
1,256,827
1,256,827
1,256,827
1,256,827
1,256,827
1,256,827
1,256,827
1,256,827
1,256,827
1,256,827
1,256,827
2.13 Electricity
1,540,944
1,540,944
1,540,944
1,540,944
1,540,944
1,540,944
1,540,944
1,540,944
1,540,944
1,540,944
1,540,944
1,540,944
1,540,944
1,540,944
1,540,944
1,540,944
1,540,944
1,540,944

Ex post evaluation of major projects supported by the European Regional Development Fund (ERDF) and Cohesion Fund between 2000 and 2013
111
3 RESIDUAL VALUE
-
-
-
-
-
-
-
-
-
-
-
-
-
-
-
-
-
9,663,319
4 SOCIOECONOMIC EFFECTS
15,596,107
15,839,554
16,042,359
16,257,759
16,446,201
16,637,206
16,830,805
17,002,041
17,175,356
17,350,773
17,528,315
17,689,320
17,852,497
18,017,869
18,185,459
18,355,292
18,527,392
28,365,102
4.1 Non-use value of clean seawater
15,226,864
15,473,198
15,681,585
15,901,732
16,097,776
16,296,236
16,497,143
16,675,539
16,855,863
17,038,138
17,222,384
17,408,622
17,596,874
17,787,162
17,979,507
18,173,933
18,370,460
18,569,114
4.2 Use for bathing + recreational purposes
1,081,448
1,098,943
1,113,743
1,129,379
1,142,161
1,155,088
1,168,162
1,181,384
1,194,757
1,208,282
1,221,960
1,235,794
1,249,785
1,263,936
1,278,247
1,292,721
1,307,359
1,322,164
4.3 Negative change in value of real estate
14,106
14,106
14,106
14,106
14,106
14,106
14,106
14,106
14,106
14,106
14,106
14,106
14,106
14,106
14,106
14,106
14,106
14,106
4.4
Negative externality: Emissions from sludge transport
20,771
21,378
21,984
22,591
23,197
23,804
24,410
25,017
25,623
26,229
26,836
27,998
29,161
30,323
31,485
32,648
33,810
34,973
4.5
Negative externality: Emissions from energy use
677,327
697,103
716,879
736,655
756,431
776,207
795,983
815,759
835,535
855,311
875,087
912,991
950,895
988,799
1,026,703
1,064,607
1,102,511
1,140,415
5 TOTAL (4+3-1-2)
8,015,140
7,712,778
7,385,032
7,076,357
6,758,765
6,454,436
6,162,892
5,869,844
5,590,122
5,323,166
5,068,435
4,817,466
4,578,712
4,351,595
4,135,561
3,930,082
3,734,654
6,317,476
Source: Authors

Ex post evaluation of major projects supported by the European Regional Development Fund
(ERDF) and Cohesion Fund between 2000 and 2013
112
SENSITIVITY ANALYSIS
A sensitivity analysis has been carried out on the key variables in order to determine whether they
are critical or not. The procedure requires to make them vary one at a time by a +/-1%, and then
to assess the corresponding change in the Economic NVP and IRR. A variable is referred to as
“critical” if the corresponding variation in the economic output is greater than 1% in absolute value.
The Authors tested the sensitivity of the following variables: WTP for non-use; WTP for use; CO2eq
of emissions from future energy use; future electricity cost; future salaries; future costs for
chemicals; Population growth; future GDP growth; reinvestment costs. As a result of the sensitivity
test (see table below), the following three critical variables have been identified: WTP for non-use
2008-2037; Population growth rate; GDP growth 2024-2037.
Table 22. Results of the sensitivity analysis
INDEPENDENT VARIABLE VARIATION (in %) of the economic NPV
due to a ± 1% variation
CRITICALITY
JUDGEMENT *
WTP for non-use 2008-2037 2.27% Critical
WTP for use 2008-2037 0.84% Not critical
CO2eq of emissions from energy use
2019- 2037
-0.07% Not critical
Electricity cost 2018-2037 -0.22% Not critical
Salaries 2018-2037 -0.09% Not critical
Chemicals 2018-2037 -0.12% Not critical
Population growth rate 8.52% Very critical
GDP growth 2024-2037 8.08% Very critical
Reinvestment costs 2019-2037 -0.04% Not critical
*Very critical: ΔNPV > +5%; Critical: ΔNPV > +1%; Not critical: ΔNPV < +1%.
Moreover, the sensitivity analysis tested the replacement of the WTP for the ‘good’ scenario (under
the Water Framework Directive, as explained in the 2011 study used for the value transfer) with
the WTP for the ‘moderate’ scenario. Based on the results, which showed very large variations in
the NPV, the WTP for use 2008-2037 was included among the critical variables as well.
RISK ASSESSMENT
The risk assessment has been conducted on the critical variables as a result of the sensitivity
analysis: WTP for non-use; WTP for use; Population growth rate; future GDP growth.
For the sake of simplicity, it was assumed that the probability distribution of each of these variables
is triangular, with the value with the highest probability being the reference one – that is, the “base
value” adopted for carrying out the CBA – and the lower and upper bounds being the “pessimistic”
and “optimistic” values defined in the scenario analysis.

Ex post evaluation of major projects supported by the European Regional Development Fund
(ERDF) and Cohesion Fund between 2000 and 2013
113
Table 23. Ranges used for each independent variable in the risk analysis
INDEPENDENT VARIABLE MINIMUM VALUE MAXIMUM VALUE
WTP for non-use 0.65 1.35
WTP for use 0.39 1.61
Population growth rate -0.01 0.01
GDP growth 2024-2037 -0.01 0.02
The analyses have been elaborated using the Monte Carlo simulation technique with 10,000 random
repetitions. In brief, at each iteration it is randomly extracted a value from the distribution of each
of the independent variables. The extracted values are then adopted for computing the ENVP and
IRR. Finally, the 10,000 estimated values of ENPV and IRR are used to approximate the probability
distribution of the two indicators.
The risk assessment shows that the expected value of the ENPV is equal to EUR 126,047,245 (higher
than the reference case), and that the expected value of the ERR is 12.90%% (against a reference
case of 12.89%).
The probability that the ENPV will become negative and that the ERR will be lower that the SDR
adopted in the analysis is almost nil (0.2% and 0.5% respectively). However, there is a 48%
probability that the two indicators assume a lower value than in the reference case.
Hence, the CBA outputs appear to be pretty robust to future possible variations in the key variables,
and overall the risk analysis shows that the project does not have a high risk level.
Figure 23. Results of the risk analysis for ENPV (left-hand side) and ERR (right-hand side)
Source: Authors
CBA Reference value
122,680,685
Estimated parameters of the distribution
Mean 126,047,245
Median 125,988,072
Standard deviation 48,196,136
Minimum -22,774,165
Maximum 282,244,154
Estimated probabilities
Pr. ENPV ≤ base value 0.475
Pr. ENPV ≤ 0 0.002
CBA Reference value
12.8897%
Estimated parameters of the distribution
Mean 12.8964%
Median 12.9771%
Standard deviation 2.33%
Minimum 4.735%
Maximum 19.484%
Estimated probabilities
Pr. ERR ≤ base value 0.487
Pr. ERR ≤ Social discount rate 0.005

Ex post evaluation of major projects supported by the European Regional Development Fund
(ERDF) and Cohesion Fund between 2000 and 2013
114
Figure 24. Probabilistic distribution of the Economic Net Present Value (EUR)
Source: Authors
Figure 25. Probabilistic distribution of the Economic Internal Rate of Return
Source: Authors
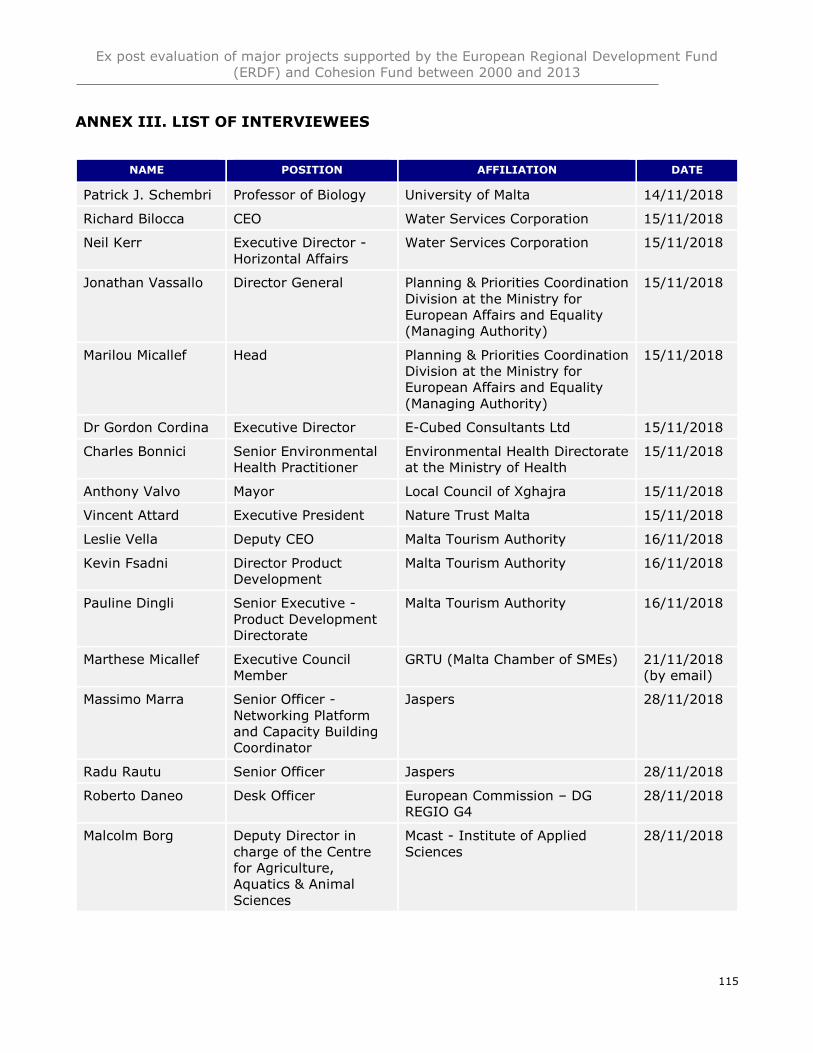
Ex post evaluation of major projects supported by the European Regional Development Fund
(ERDF) and Cohesion Fund between 2000 and 2013
115
ANNEX III. LIST OF INTERVIEWEES
NAME POSITION AFFILIATION DATE
Patrick J. Schembri Professor of Biology University of Malta 14/11/2018
Richard Bilocca CEO Water Services Corporation 15/11/2018
Neil Kerr Executive Director -
Horizontal Affairs
Water Services Corporation 15/11/2018
Jonathan Vassallo Director General Planning & Priorities Coordination
Division at the Ministry for
European Affairs and Equality
(Managing Authority)
15/11/2018
Marilou Micallef Head Planning & Priorities Coordination
Division at the Ministry for
European Affairs and Equality
(Managing Authority)
15/11/2018
Dr Gordon Cordina Executive Director E-Cubed Consultants Ltd 15/11/2018
Charles Bonnici Senior Environmental
Health Practitioner
Environmental Health Directorate
at the Ministry of Health
15/11/2018
Anthony Valvo Mayor Local Council of Xghajra 15/11/2018
Vincent Attard Executive President Nature Trust Malta 15/11/2018
Leslie Vella Deputy CEO Malta Tourism Authority 16/11/2018
Kevin Fsadni Director Product
Development
Malta Tourism Authority 16/11/2018
Pauline Dingli Senior Executive -
Product Development
Directorate
Malta Tourism Authority 16/11/2018
Marthese Micallef Executive Council
Member
GRTU (Malta Chamber of SMEs) 21/11/2018
(by email)
Massimo Marra Senior Officer -
Networking Platform
and Capacity Building
Coordinator
Jaspers 28/11/2018
Radu Rautu Senior Officer Jaspers 28/11/2018
Roberto Daneo Desk Officer European Commission – DG
REGIO G4
28/11/2018
Malcolm Borg Deputy Director in
charge of the Centre
for Agriculture,
Aquatics & Animal
Sciences
Mcast - Institute of Applied
Sciences
28/11/2018

Ex post evaluation of major projects supported by the European Regional Development Fund
(ERDF) and Cohesion Fund between 2000 and 2013
116
NAME POSITION AFFILIATION DATE
Dr Robert Vassallo-
Agius
Officer in Scale 5 -
Department of
Fisheries and
Aquaculture -
Aquaculture
Directorate
Ministry for the Environment,
Sustainable Development and
Climate Change
05/12/2018
(by email)
Lawrence
Baldacchino
Representative Zabbar Farmers Co-op. Soc. 07/12/2018
(by email)
George Attard CEO Agency for the Governance of
Agriculture Bioresources
10/12/2018

Ex post evaluation of major projects supported by the European Regional Development Fund
(ERDF) and Cohesion Fund between 2000 and 2013
117
REFERENCES
Axiak V., 2004. National Diagnostic Analysis for Malta - National Action Plan for Malta for the
Reduction and Elimination of Land Based Pollution. Available at:
https://era.org.mt/en/Documents/National_Diagnostic_Analysis.pdf.
Axiak V. et al., 2000. Re-assessing the Extent of Impact of Malta’s (Central Mediterranean) Major
Sewage Outfall Using ERS SAR, in “Marine Pollution Bulletin”, Volume 40, Issue 9, pages 734-738.
Environment and Resources Authority, 2015. The Second Water Catchment Management Plan for
the Malta Water Catchment District 2015-2021.
Environment and Resources Authority, 2018. State of the Environment Report 2018.
Eurelectric, 2016. Drivers of Electricity Bills: Supporting graphs, methodology and country notes.
Available at: https://www3.eurelectric.org/media/263668/drivers_of_electricity_bills_study-
graphs_methodology__countrynotes-2016-030-0113-01-e.pdf.
European Commission, 2015. Ex post evaluation of Cohesion Policy programmes 2007-2013,
focusing on the European Regional Development Fund (ERDF) and the Cohesion Fund (CF) –
Environment. Report on eight case studies - Work Package 6.
European Commission, 2017. Ninth Report on the implementation status and the programmes for
implementation (as required by Article 17) of Council Directive 91/271/EEC concerning urban waste
water treatment.
Food and Agriculture Organization of the United Nations, 2006. Malta water resources review.
Institute for European Environmental Policy, 2016. Water pricing in Malta. Available at:
https://ieep.eu/uploads/articles/attachments/90b19944-0222-4198-b1f4-
d89cc070e2f3/MT%20Water%20Pricing%20conference%20draft.pdf?v=63673818840.
Jaspers, 2010. Action Completion Note – Malta South Sewage Treatment Infrastructure.
National Statistics Office, 2012. Census of Agriculture 2010.
Perni, A., Martínez-Carrasco, F. and Martínez-Paz J. M., 2011. Economic valuation of coastal lagoon
environmental restoration: Mar Menor (SE Spain), in “Ciencias Marinas”, Volume 37(2), pages 175–
190. Available at:
https://pdfs.semanticscholar.org/a2c2/3438281cfe4e15e052dfdbca2850c6351d13.pdf.
Remoundou, K., Koundouri, P., Kontogianni, A., Langmead, O., Nunes, Paulo A.L.D, Skourtos, M.,
2009. Valuation of Natural Marine Ecosystems: An Economic Perspective, in “Environmental Science
and Policy”, Volume 12(7), pp. 1040-1051.
Sapiano, M. et al., 2008. The evolution of water culture in Malta: An analysis of the changing
perceptions towards water throughout the ages, in “Options Méditerranéennes”, A n° 83, 2008 -
Water Culture and Water Conflict in the Mediterranean Area. Available at:
https://www.um.edu.mt/library/oar/bitstream/handle/123456789/21980/The_evolution_of_water
_culture_in_Malta_An_analysi.pdf?sequence=1&isAllowed=y.

Ex post evaluation of major projects supported by the European Regional Development Fund
(ERDF) and Cohesion Fund between 2000 and 2013
118
Spiteri D., Scerri C. and Valdramidis V., 2015. The current situation for the water sources in the
Maltese islands, in “Malta Journal of Health Sciences”.
Stirling Aquaculture, 2012. An aquaculture strategy for Malta - Preparatory study and
recommendations prepared for the Ministry of Resource and Rural Affairs. Available at:
https://eufunds.gov.mt/en/EU%20Funds%20Programmes/Agricultural%20Fisheries%20Fund/Doc
uments/DRAFT_AQUACULTURE_STRATEGY_FOR_MALTA_MARCH_2012[1].pdf.
Water Services Corporation, 2010. Malta South Sewage Treatment Infrastructure - Project Status
Update. Available at:
https://eufunds.gov.mt/en/Operational%20Programmes/Monitoring%20Committees/Documents/_
MC.OPI.11.10_CF116_04.pdf.
Water Services Corporation, 2017. Annual Report 2017. Available at: http://www.wsc.com.mt/wp-
content/uploads/2018/06/WSC-Annual-Report-2017-3-1.pdf.
Press
Malta Today, 2015. “Comparisons are odious, but sewage plants are necessary”,
https://www.maltatoday.com.mt/comment/blogs/52907/comparisons_are_odious_but_sewage_pl
ants_are_necessary#.XBJRfmhKg2y.
The Malta Independent, 2011. “An End to sewage in our seas”,
http://www.independent.com.mt/articles/2011-06-03/news/an-end-to-sewage-in-our-seas-
293500/.
The Malta Independent, 2016. “Mepa approves a landscaping project to hide sewage treatment
plant in Xghajra”, http://www.independent.com.mt/articles/2016-02-25/local-news/Mepa-has-
approved-a-landscaping-project-to-hide-sewage-treatment-plant-in-Xghajra-6736153945.
The Malta Independent, 2016. “Planning Authority approves solar farm at Ta’ Barkat sewage
treatment plant”, http://www.independent.com.mt/articles/2016-08-19/local-news/Planning-
Authority-approves-solar-farm-at-Ta-Barkat-sewage-treatment-plant-6736162602.
The Malta Independent, 2016. “EC considers enforcement against slime, sludge in Malta’s sea water
as national issue”, http://www.independent.com.mt/articles/2016-10-24/local-news/EC-considers-
enforcement-against-slime-sludge-in-Malta-s-sea-water-as-national-issue-6736165633.
The Malta Independent, 2018. “Water Services Corporation inaugurates New Water polishing plant
at Ras il-Hobz Gozo”, http://www.independent.com.mt/articles/2018-07-12/company-news/Water-
Services-Corporation-inaugurates-New-Water-polishing-plant-at-Ras-il-Hobz-Gozo-6736193292.
Times of Malta, 2011. “€60m sewage treatment plant inaugurated”,
https://www.timesofmalta.com/articles/view/20110602/local/60m-sewage-treatment-plant-
inaugurated.368575.
Times of Malta, 2018. “Agricultural-grade water now available in Gozo”,
https://www.timesofmalta.com/articles/view/20180706/local/agricultural-grade-water-now-
available-in-gozo.683711.

Ex post evaluation of major projects supported by the European Regional Development Fund
(ERDF) and Cohesion Fund between 2000 and 2013
119
Times of Malta, 2018. “Farmers in Malta's south can now water fields using purified sewage water”,
https://www.timesofmalta.com/articles/view/20180905/local/new-plant-to-supply-treated-
drainage-water-to-farmers.688423.