malocclusion and quality of life in tanzanian schoolchildren
TRANSCRIPT
Malocclusion and quality of life in Tanzanian
schoolchildren
Matilda Mtaya
This thesis is submitted in partial fulfillment of the requirements of the degree of Doctor of
Philosophy at the University of Bergen 2008
Center for International Health Department of Clinical Dentistry- Community Dentistry
University of Bergen 2008

ISBN 978-82-308-0712-5 Bergen, Norway 2008
Copyright © Matilda Mtaya, 2008

iii
Dedicated to my Husband David, sons Rodgers and Ronald and my beloved
daughter Hellen

iv

v
TABLE OF CONTENTS ACKNOWLEDGEMENTS......................................................................................................... vii ACRONYMS .............................................................................................................................. ix LIST OF PAPERS....................................................................................................................... xi ABSTRACT ...............................................................................................................................xiii 1. INTRODUCTION.................................................................................................................. 1
1.1. Outline of the thesis......................................................................................................... 1 1.2. Malocclusion in the permanent and primary dentition of children in developed and developing countries .............................................................................................................. 3 1.3. Risk indicators for malocclusion..................................................................................... 5
1.3.1. Dental caries ............................................................................................................ 6 1.3.2. Sucking habits .......................................................................................................... 6 1.3.3. Socio-demographic factors ...................................................................................... 7
1.4. Oral health related quality of life indicators for children................................................ 7 1.5. Psycho social impacts of malocclusion in children....................................................... 11 1.6. Aim of the study............................................................................................................ 15
1.6.1. Research questions ................................................................................................. 16 2. MATERIALS AND METHODS......................................................................................... 17
2.1. Study area...................................................................................................................... 17 2.2. Selection procedure and study profiles ......................................................................... 19
2.2.1. Survey I................................................................................................................... 20 2.2.2. Survey II ................................................................................................................. 24
2.3. Survey instrument ......................................................................................................... 25 2.3.1. Survey I................................................................................................................... 25 2.3.2. Survey II ................................................................................................................. 26
2.4. Clinical examination ..................................................................................................... 27 2.4.1. Survey I................................................................................................................... 27 2.4.2. Survey II ................................................................................................................. 27
2.5. Characteristics of data and statistical analyses.............................................................. 28 2.6. Ethical considerations ................................................................................................... 29
3. RESULTS............................................................................................................................. 30 3.1. Survey I ......................................................................................................................... 30
3.1.1. Paper I: Prevalence of malocclusion and its relationship with socio-demographic factors, dental caries and oral hygiene in 12-14-year-old Tanzanian schoolchildren. ... 30 3.1.2. Paper II: Applicability of an abbreviated version of the Child-OIDP inventory among primary schoolchildren in Tanzania. ................................................................... 30 3.1.3. Paper III: Malocclusion, psycho-social impacts and treatment need: a cross-sectional study of Tanzanian primary school-children. ................................................... 31 3.1.4. Direct age standardization of the crude prevalence estimates for children in Kinondoni and Temeke districts ....................................................................................... 32
3.2. Survey II ........................................................................................................................ 34 3.2.1 Unpublished manuscript: Prevalence of malocclusion and its relationship with socio-demographic factors in 3-5-yr-old preschool children .......................................... 34
4. DISCUSSION ...................................................................................................................... 36 4.1. Methodological issues ................................................................................................... 36
4.1.1. Reliability ............................................................................................................... 37 4.1.2. Validity ................................................................................................................... 38
4.2. Comments on the main findings.................................................................................... 43
vi
4.2.1. Prevalence of malocclusion, reported dental problems, Child-OIDP and dissatisfaction with dental appearance among primary school children ........................ 43 4.2.2. Prevalence of malocclusion in pre-school children ............................................... 44 4.2.3. Socio-demographic differentials ............................................................................ 45 4.2.4. Clinical differentials............................................................................................... 47 4.2.5. Behavioral differentials.......................................................................................... 47 4.2.6. Socio-dental orthodontic treatment need ............................................................... 48 4.2.7. Implication for preventive and therapeutic orthodontic services .......................... 49 4.2.8. Conclusions ............................................................................................................ 51
5. REFERENCES..................................................................................................................... 53 6. ORIGINAL PAPERS I – III................................................................................................. 61 7. APPENDICES I – IX ........................................................................................................... 62

vii
ACKNOWLEDGEMENTS
The accomplishment of this work was possible because of the collaboration between different
institutions namely, the Faculty of Medicine-Dentistry, Department of Clinical Dentistry, the
Center for International Health (CIH), University of Bergen and the Muhimbili University of
Health and Allied Sciences (MUHAS). I would like to acknowledge with great appreciation
the Norwegian State Education Loan Fund (Staten Lånekassen) for the financial support.
My heartfelt gratitude is due to my supervisors Associate Professor Pongsri Brudvik and
Professor Anne Nordrehaug Åstrøm whose tireless efforts and commitment have built me
professionally and made this work successful. I am greatly indebted to them for their valuable
advice, constructive criticism, encouragement and support throughout my study period. I am
truly inspired, thank you. I sincerely acknowledge my co-supervisor Dr Joyce R. Masalu for
her support and scholarly guidance.
My honest appreciation goes to the staff at the Department of Clinical Dentistry and the
Center for International Health for their kind assistance during the course of my study.
My utmost appreciation goes to the staff and management of the Muhimbili University of
Health and Allied Sciences, the School of Dentistry and the Department of Preventive and
Community Dentistry for granting me permission to undertake this study. I would like to
acknowledge the exceptional role–played by my research assistants, Dr Habiba Madjapa, Dr
May Alexander, Dr Ally Yusuph, Dr Abdulaziz, Dr Amri, Dada Editha, Kaka Kalambaya and
Mr Bahati Magota in the field. I would also like to thank the staff at the Muhimbili National
Hospital for their support. I extend my sincere appreciation to the Dar es Salaam region,
Kinondoni and Temeke district and schools administration for contributing to the
implementation of this study.
Many thanks go to the parents, caregivers and children who participated in both surveys.

viii
I express my heartfelt gratitude to my guardians Mr and Mrs J. P. Mabula, Bibi Grace
Mtawali, Mr and Mrs (Dr) M. Mgonja, Mr and Mrs Ronnie Mtawali, Mwamy and Ido,
Chippy and Edda, Chwele, my sisters, my brothers, my brothers in-law and their wives for all
the encouragement and special support. I would also like to express my sincere appreciation
to Dr Irene Kida Minja, my officemates, colleagues, friends and all those who have, in various
ways, made this work possible.
I thank my late parents and my late parents in-law for giving me a foundation and for being
my inspiration.
I am forever indebted to my husband David D. Mlangwa for his understanding,
uncomplaining support, for taking my maternal responsibilities and sacrifices he made to
further my career. My children Rodgers and Ronald who continued to love me despite my
absence, I am blessed to have them in my life.
Finally, I thank the Almighty God for keeping me strong and healthy throughout my study
period.

ix
ACRONYMS
SMO Sum score of Malocclusion
GDP Gross Domestic Product
MUHAS Muhimbili University of Health and Allied Sciences
OIDP Oral Impacts on Daily Performance
OR Odds ratio
WHO World Health Organization
MOH Ministry Of Health
OHI-S Oral Hygiene Index-Simplified
OHRQoL Oral Health Related Quality of Life
DHE Dental Health Education
OHP Oral Hygiene Practice
MM Matilda Mtaya
DMFT Decayed Missing and Filled Teeth
CI Confidence Interval
OIDPSC Oral Impacts on Daily Performance Sum Score
OIDPADD Oral Impacts on Daily Performance Additive score

x

xi
LIST OF PAPERS
The thesis is based on the following papers.
Paper I
Mtaya M, Brudvik P, Åstrøm AN. Prevalence of malocclusion and its relationship with socio-
demographic factors, dental caries and oral hygiene in 12-14 year-old Tanzanian
schoolchildren. European Journal of Orthodontics; 2008 (in press)
Paper II
Mtaya M, Åstrøm AN, Tsakos G. Applicability of an abbreviated version of the Child-OIDP
inventory among primary schoolchildren in Tanzania. Health and Quality of Life Outcomes
2007, 5:40
Paper III
Mtaya M, Åstrøm AN, Brudvik P. Malocclusion, psycho-social impacts and treatment need: a
cross-sectional study of Tanzanian primary school-children. BMC Oral Health 2008, 8:14

xii
xiii
ABSTRACT
Objective: The main objective of this study was to assess the prevalence of malocclusion, its
associated factors, its impact on quality of life and estimate its socio-dental treatment need in
children living in Kinondoni and Temeke Districts of Dar es Salaam, Tanzania.
Methods: Cross sectional surveys of children aged 3-5 and 12-14 years, residing in two
districts of Dar es Salaam region, was conducted from November 2005 to June 2006. A
stratified proportionate two stage cluster sample design with primary schools as the primary
sampling unit (N = 1601 Survey I) and a census (N = 253 Survey II) was utilized. In survey I,
participants from the selected primary schools (12-14 year-olds) were clinically examined for
decayed, missing and filled teeth due to caries, according to the criteria described by the
World Health Organization (1997). Oral hygiene was assessed using simplified Oral Hygiene
Index by Greene and Vermillion (1964). Interview schedules for 12-14 year-olds were
conducted using structured questionnaires, which included socio-demographic details,
perceived oral problems, satisfaction / dissatisfaction with mouth and teeth and Kiswahili
version of the Child Oral Impacts on Daily Performances (Child-OIDP) and also questions
regarding their perceived general and oral health conditions and oral health related behaviors.
In Survey II (3-5-year-olds) parents were interviewed regarding their socio-demographic
details and their children’s sucking habits and feeding methods. In both surveys (I and II)
malocclusion was assessed according to the criteria by Björk et al. (1964) with some
modifications by al-Emran et al. (1990).
Data were analyzed using Statistical Package for Social Scientists, SPSS version 14.0. Cross
tabulation and Chi-square statistics were used to assess bivariate relationships. Multivariate
analyses were performed by multiple logistic regression, with 95% confidence interval (CI)
given for the odds ratios indicating statistically significant relationship if both values were
above or below 1.

xiv
Results: The overall prevalence of malocclusion was 63.8% in 12-14 year-olds and 32.5% in
3-5 year-olds. For the 12-14-year-old children, residing in Temeke (a less socio-economically
privileged district) was associated with higher odds (OR 1.8) of being diagnosed with an open
bite, after controlling for socio-demographic factors. When subjects with and without caries
experience (DMFT) were compared, those with DMFT > 0 were more likely to have any type
of malocclusion (SMO>0), a midline shift, Angle Class II/III and an open bite. Oral hygiene
varied in unexpected direction with malocclusion (a midline shift) in this study. For the 3-5-
year-old children, malocclusion (an open bite) was associated with sucking habits. After
controlling for socio-demographic variables, only current sucking habits and gender remained
significant determinants for an open bite with the odds ratios of 13.5 and 2.2, respectively.
The Kiswahili version of the Child-OIDP inventory preserved the overall concept of the
original English version and was applicable to use among primary schoolchildren. A total of
28.6% of the participants had at least one oral impact. Problem with eating was the
performance reported most frequently followed by cleaning teeth in both districts. The most
frequently reported causes of impacts were toothache, ulcer in mouth and position of teeth.
Furthermore, moderate proportions of primary schoolchildren reported problems related to
teeth and mouth; ranging from 7.7% (space position) to 20.7% (pain). The odds ratios of
having problems with teeth position, spaces, pain and swallowing if having any malocclusion
were respectively, 6.7, 3.9, 1.4 and 6.8. A total of 23.3% primary schoolchildren were
dissatisfied with dental appearance and function. Primary schoolchildren dissatisfied with
their dental appearance were less likely to be Temeke residents and having parents of higher
education. They were more likely to report problems with teeth position (OR= 4.3) and have
oral impacts (OIDP>0) (OR=2.2). The socio-dental treatment need of 12% was five times
lower than a normative estimate of 63.8% based on the overall prevalence of malocclusion
(SMO>0).

xv
Conclusion: The study showed that, caries and social demographic status (in terms of district
of residence) were associated with malocclusion in primary schoolchildren. Sucking habits
and gender were associated with malocclusion in pre-school children. Kiswahili version of the
Child-OIDP inventory was applicable for use among Tanzanian primary schoolchildren. Oral
impacts and dissatisfaction with teeth appearance and function were not common among 12-
14-year-olds. The socio-dental treatment need of 12% was five times lower than a normative
estimate of 63.8% based on the overall prevalence of malocclusion (SMO>0). Thus,
prophylactic measures which may either totally prevent or at least lessen the development of
many forms of malocclusion are recommended, with a particular emphasis to less affluent
societies. Moreover, clinical measures of malocclusion together with reported functional- and
psychosocial impact scores determined subjects’ evaluation of their teeth appearance and
function and hence demand for orthodontic care, therefore these should be taken into account
when estimating treatment needs.

xvi

1
1. INTRODUCTION
1.1. Outline of the thesis
This thesis concerns the prevalence, associated factors and socio-demographic distribution of
malocclusion in Tanzanian children aged 3-5- and 12-14 years emanating from socio-
economically different districts of Tanzania. Secondly, this thesis assesses the applicability of
a Kiswahili version of the Child Oral Impact on Daily Performance (Child-OIDP)
questionnaire to 12-14-year-old primary school children. Thirdly, as part of the validation of
the Child-OIDP inventory, this thesis assesses the predictive potential of the Child-OIDP with
respect to schoolchildren’s perceived appearance and function of their teeth within the
theoretical framework of Gilbert et al. (1998) thus accommodating a range of social-, clinical
and non-clinical oral health related factors. Fourthly, this thesis assesses the socio-
psychological impact of malocclusion and estimate a need for orthodontic treatment in 12-14
year old schoolchildren using a modified socio-dental approach proposed by Gherunpong
(2006a). Specifically this thesis considers the following:
1) Prevalence and socio-demographic correlates of malocclusion in 3-5-year-old preschool
children (unpublished results presented in the summary).
2) Prevalence of malocclusion and its associated factors in 12-14-year-old primary school
children (paper I).
3) Psychometric properties in terms of reliability and validity of a Kiswahili version of the
Child-OIDP questionnaire in 12-14-year-olds (paper II).
4) Prevalence and correlates of perceived orthodontic conditions and dissatisfaction with teeth
appearance and function and estimate orthodontic treatment need using a socio-dental
approach in 12-14-year-olds (paper III).
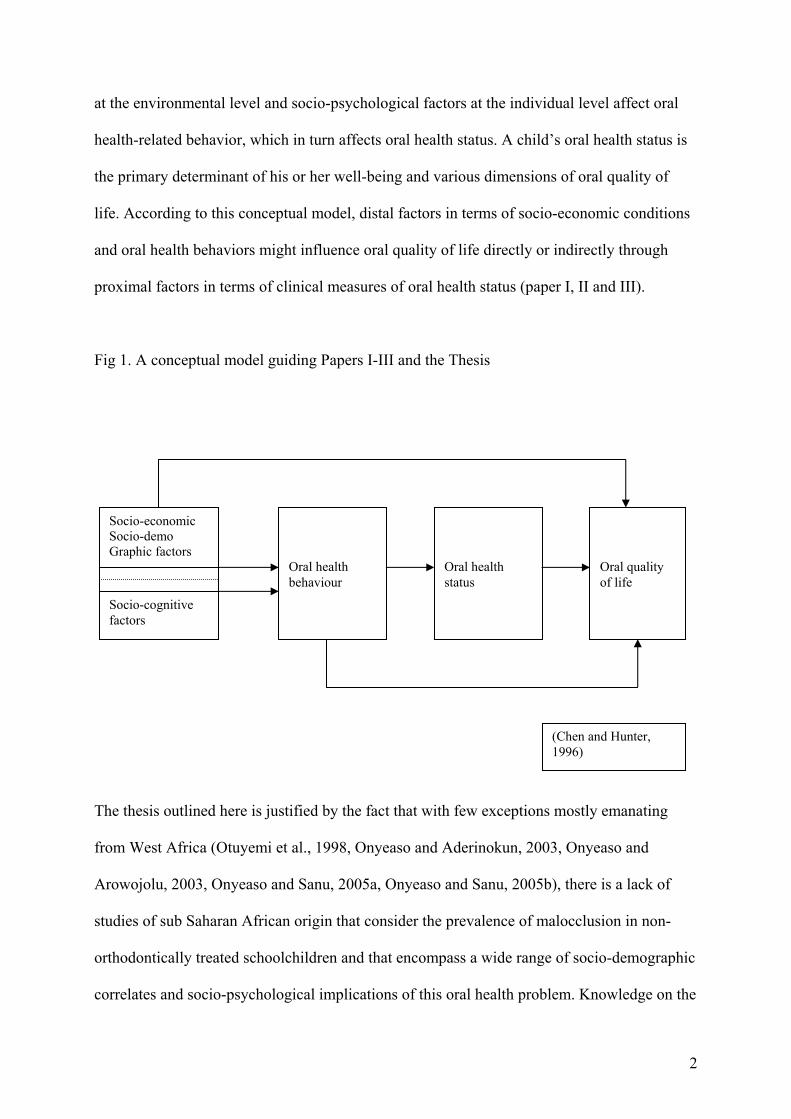
A conceptual model (Fig 1), developed by Chen and Hunter (1996), guides the three papers
and the thesis. According to this conceptual model, demographic- and socio-economic factors
2
at the environmental level and socio-psychological factors at the individual level affect oral
health-related behavior, which in turn affects oral health status. A child’s oral health status is
the primary determinant of his or her well-being and various dimensions of oral quality of
life. According to this conceptual model, distal factors in terms of socio-economic conditions
and oral health behaviors might influence oral quality of life directly or indirectly through
proximal factors in terms of clinical measures of oral health status (paper I, II and III).
Fig 1. A conceptual model guiding Papers I-III and the Thesis
The thesis outlined here is justified by the fact that with few exceptions mostly emanating
from West Africa (Otuyemi et al., 1998, Onyeaso and Aderinokun, 2003, Onyeaso and
Arowojolu, 2003, Onyeaso and Sanu, 2005a, Onyeaso and Sanu, 2005b), there is a lack of
studies of sub Saharan African origin that consider the prevalence of malocclusion in non-
orthodontically treated schoolchildren and that encompass a wide range of socio-demographic
correlates and socio-psychological implications of this oral health problem. Knowledge on the
Socio-economic Socio-demo Graphic factors
Socio-cognitive factors
Oral health behaviour
Oral health status
Oral quality of life
(Chen and Hunter, 1996)

3
distribution of malocclusion and causes/risk indicators of malocclusion in early childhood can
facilitate efforts to prevent such a disorder (especially that caused by environmental factors)
and its consequences and make it possible to reduce the complexity of costly orthodontic
treatment. Furthermore, this knowledge might help to minimize future treatment need,
considering that Tanzania is lacking human resources, materials and equipment for
orthodontic services. So far, little is known (Kerosuo, 1990) regarding risk indicators or
associated factors related to malocclusion in Tanzanian children. Oral health promotion
programs have been included in the School Health Program and in the Mother and Child
Health (MCH) clinics, aiming at fostering proper oral health behavior among school age
children and mothers of 0-5-year-olds, respectively (MOH, 1988). Therefore, information
regarding the magnitude of occlusal anomalies, their associated factors as well as their impact
on quality of life and well being would first assist in identifying what kind of information
public health workers should provide to school children, in MCH clinics and community at
large. Secondly, such information is important for the purpose of planning an organized
orthodontic service, which at the moment is virtually non-existent in Tanzania.
1.2. Malocclusion in the permanent and primary dentition of children in developed and
developing countries
Maloccclusion is any deviation in the arrangement of the teeth exceeding the standards of
normal occlusion (Rønning and Thilander, 1995). It may be associated with anomalies within
the dental arches (i.e. crowding and spacing), malrelation of dental arches (i.e. antero-
posterior, vertical and transverse anomalies) and skeletal discrepancies (Rønning and
Thilander, 1995, Proffit and Fields, 2000). Many studies have reported on the prevalence of
malocclusion in different populations (al-Emran et al., 1990, Ng'ang'a et al., 1996, Thilander
et al., 2001, Onyeaso, 2004, Ciuffolo et al., 2005, Josefsson et al., 2007). The reported

4
prevalence of malocclusions in deciduous dentition ranges from 13% among American
children to 76% in Brazilian children (Table 1). Malocclusions in the permanent dentition
have been reported to range from 39% in Indian (Dhar et al., 2007) to 98% in Tanzanian
(Rwakatema et al., 2006) children. Divergence in the prevalence figures may depend on
ethnic differences, wide ranges in number, as well as in the age range of subjects examined
(Abu Alhaija et al., 2005a). Moreover, the criteria for the recorded items (registration
methods) seem to play an important role for the variation in the prevalence figures (Thilander
et al., 2001).
Table 1. Prevalence (per cent) of malocclusion in the deciduous dentition in different ethnic
groups worldwide, published between 1988-2008
Subjects Registration
Authors Population n Age Method %
Visković et al. (1990) Croatian 301 3-6 WHO indices 47.5
Kerosuo (1990) Tanzanian 580 3-4 Occlusal
classification
18
Jones et al. (1993) USA 493 3-4 - 13
Kabue et al. (1995) Kenyan 221 3-6 Björk et al. 51
Trottman and Elsbach
(1996)
USA 238 2-5 Angle
Classification
49.8
Chevitarese et al. (2002) Brazilian 112 4-6 - 75.8
Stahl and Grabowski (2003) Germany 1225 mean 4½ Klink-Heckmann
& Bredy
42
Mugonzibwa et al. (2004a) Tanzanian 197 3½-5 Björk et al. 19.8
Katz et al. (2004) Brazilian 330 4 Occlusal
classification
49.7
Grabowski et al. (2007) Germany 766 mean 4½ - 74.7
Robke (2008) Germany 434 2-6 Modified WHO
indices
75.1

5
1.3. Risk indicators for malocclusion Risk is the term used in epidemiology to express the probability that a particular outcome (bad
one) will occur within a given period of time, following a particular exposure (Burt, 2005). In
order to establish risk factors for malocclusion in primary and permanent dentition,
longitudinal studies are required. On the other hand, cross-sectional data provide evidence of
risk indicators of malocclusion, since exposure and outcome data are collected at the same
time (Burt, 2005). Thus, a risk indicator may be a probable risk factor, although causality
cannot be inferred from cross-sectional data alone. In this thesis, the concept of risk indicators
is used since risk is imputed from cross-sectional data. It is generally acknowledged that two
major groups of aetiological factors for the development of malocclusion may be
distinguished, namely, genetic factors (inherited abnormalities) and non-genetic
(environmental) factors (Rønning and Thilander, 1995). A combination of both factors has
often been found in the same individual. Schopf (1981) highlighted the importance of
environmental (non-genetic) factors for the development of malocclusion. The author
(Schopf, 1981) found that in 75% of the subjects, the occurrence of anomalies had been
encouraged by environmental factors such as caries in deciduous teeth, early loss of teeth, and
biting habits. Genetic or developmental forms of malocclusion were found less often in that
study. Hence, this thesis intended to focus only on the environmental factors associated with
the occurrence of malocclusion in Tanzanian pre- and primary schoolchildren. Yet, the role of
genetic factors may not be ruled out in a cross-sectional study. Dental caries, early extraction
of deciduous teeth, abnormal pressure and sucking habits, abnormal swallowing and mouth
breathing are among important environmental factors associated with malocclusion (Rønning
and Thilander, 1995, Proffit and Fields, 2000).

6
1.3.1. Dental caries
Numerous epidemiological studies on the relationship between dental caries and malocclusion
in children have been presented in the literature (Helm and Petersen, 1989, Stahl and
Grabowski, 2004, Ciuffolo et al., 2005, Frazão and Narvai, 2006, Gábris et al., 2006, Nobile
et al., 2007). Some authors have suggested that dental caries and premature loss of primary
teeth are predisposing factors for occlusal and space anomalies in the mixed and permanent
dentitions (Pedersen et al., 1978, Ravn, 1980). Laine (1984) further stated that, the high
incidence of caries and the great number of extractions of severely decayed teeth have given
rise to several analyses of the effects of extraction such as occlusal disturbances and
interference with speech. Nevertheless, some previous attempts to investigate a possible
association of malocclusion and dental caries have shown conflicting results (Helm and
Petersen, 1989, Ben-Bassat et al., 1997).
1.3.2. Sucking habits
Sucking habit is a common behavior among young children in various populations (Fukuta et
al., 1996, Farsi and Salama, 1997). Sucking habits may initiate thrusting of the tongue and
abnormal swallowing pattern (Rønning and Thilander, 1995). The relationship between
prolonged sucking and occlusal abnormalities has been studied extensively (Øgaard et al.,
1994, Karjalainen et al., 1999, Larsson, 2001, Warren and Bishara, 2002). Decreased
maxillary arch width and increased mandibular arch width, with a correspondingly higher
prevalence of posterior crossbite have been reported to be some of the effects of prolonged
sucking (Øgaard et al., 1994). Fukuta et al. (1996) also mentioned anterior open bite as the
most frequently occurring malocclusion with digit sucking. However, other studies have
shown inconclusive results regarding the effect of these habits on occlusion (Farsi and
Salama, 1997, Warren and Bishara, 2002).

7
1.3.3. Socio-demographic factors
Dental caries, one of the most important environmental factor for malocclusion, has been
considered a social class disease (Gratrix and Holloway, 1994). In the developed and
increasingly also in developing countries studies have shown that the burden of dental caries
and the need for dental care is highest among the poor and disadvantaged populations (for
review see Petersen (2005)). Frazão and Narvai (2006) reported that greater caries incidence
combined with more untreated dental caries increased the risk of malocclusions in less
affluent Brazilian public-school students. Furthermore, Tickle et al. (1999) found normative
need for orthodontic treatment to be more common amongst deprived UK children than
among their affluent counterparts. In this regard therefore, socio-economic class (a socio-
demographic factor) is considered as a risk indicator for malocclusion in this thesis.
1.4. Oral health related quality of life indicators for children
In this thesis, the World health Organization quality of life groups definition of quality of life
is embraced in terms of “an individual’s perception of his/her position in life in the context of
culture and value systems in which they live and in relation to their goals, expectations,
standards and concerns” (WHOQOL, 1995). Although assessments of adults’ oral health
related quality of life (OHRQoL) have existed for decades (Slade and Assessing oral health
outcomes, 1997), there is a lack of measures developed and designed for children (for a
review see Kida et al. (2006)). This is peculiar since pediatric oral disorders such as dental
caries and malocclusion are common and likely to affect children’s quality of life negatively.
In an overview of studies from developed and developing countries, Kiwanuka (2006) found
the prevalence rates of reported pain and other oral impacts in children to vary from 21.6% in
0-18-year-old Kenyan to 68% in 12-year-old Indian children.

8
A few instruments (i.e. socio-dental indicators) are now available for measuring OHRQoL in
school-aged children; the Child Oral Quality of Life questionnaire including the Parental
Caregiver Perception Questionnaire, the Family Impact Scale, three Child Perception
Questionnaires for children aged 6-7-, 8-10- and 11- to 14 years, the Child Oral Impacts on
Daily Performance (Child-OIDP) inventory, that has been applied in the present thesis and
Child Oral Health Impact Profile for school aged children 8-15 years (see paper II for review).
Recently, the Early Childhood Oral Health Impact Scale (ECOHIS) was developed to assess
oral health impacts among preschool children aged 0-5 years and the impact of child’s oral
condition on the family (Pahel et al., 2007).
The dominance of short term memory, strong influence of recent incidents, absence of a fully
developed long term perspective, language problems and reading ability may impact the
reliability and validity of child’s responses regarding their own OHRQoL (Eiser and Morse,
2001). Using parents and caregivers as proxy informants, suggests that they have in general
low to modest agreement with the children’s own rating, emphasizing the usefulness of
obtaining both child and caregivers report of the child OHRQoL (Wilson-Genderson et al.,
2007, Weyant et al., 2007). However, according to child developmental specialists, early
school aged children are capable of expressing a range of emotions (such as anxiety and
happiness) as well as cultural values such as beauty (Hetherington et al., 1999). Recently
developed generic and disease specific OHRQoL questionnaires have demonstrated that with
appropriate technique, it is possible to obtain valid and reliable reports from children (Jokovic
et al., 2002). Table 2 shows an overview of recently developed generic and disease specific
OHRQoL instruments for children in various age groups, their number of items and the
wording of items in terms of positively and negatively worded items.

9
Table 2. Oral Health Related Quality of Life instruments used in children, their abbreviations, number of items
contained and original reference
Instrument Abbreviation Number of items Wording of items Original Reference
Early Childhood Oral
Health Impact Scale
ECOHIS 13 Negatively worded Pahel et al. (2007)
Child Oral Health Impact
Profile
COHIP for
children 8-15
yrs
34 Positively and
negatively
Broder and Wilson-
Genderson (2007)
Surgical Orthodontic
Outcome Questionnaire
SOOQ 33 Negatively worded Locker et al. (2007a)
Child Oral Health related
Quality of Life
COHRQoL for
8-10 yr olds
25 Negatively worded Humphris et al.
(2005)
Child-Oral Impact on
Daily Performance
Child-OIDP 8 Negatively worded Gherunpong et al.
(2004b)
Parental Perception
Questionnaire
P-CPQ 31 Negatively worded Jokovic et al. (2003)
Family Impact Scale - 14 Negatively worded Locker et al. (2002)
Child Perceptions
Questionnaire
CPQ 11-14 37 Negatively worded Jokovic et al. (2002)
Most measures developed to assess the OHRQoL in children, commonly referred to as socio-
dental indicators or subjective oral health indicators, appear to be theory based and well tested
for psychometric properties in terms of reliability and specific attributes of validity (i.e.
content, construct and criterion validity) (Brondani and MacEntee, 2007). Most OHRQoL
instruments, are based on Parson’s sick role theory (Streiner and Norman, 1995) and an
explicit conceptual framework of the World Health Organization’s International Classification
of Impairments, Disabilities and Handicaps (ICIDH, Badley (1987)) (Fig 2). Impairments
(level 1) refer to the immediate biophysical outcomes of disease, commonly assessed by
clinical indicators. The concepts of functional limitations, pain and discomfort (level 2) refer

10
to functioning, behavior experience and psychological and social well-being assessed through
self report procedures. Disability and handicap on the other hand, refer to any difficulty in
performing activities of daily living and to the broader social disadvantages and deprivation-
named “ultimate impacts” (level 3), respectively. The ICIDH provides a theoretical basis for
the empirical exploration of the links between various dimensions of oral health and has been
amended for dentistry by Locker (1988). In accordance with emerging consensus in the
literature that OHRQoL is multidimensional consisting of social-, functional and
psychological dimensions, researchers have started to examine the factorial validity of
instruments in addition to the more traditional attributes of validity using exploratory and
confirmative factor analyses (Brondani and MacEntee, 2007, Humphris et al., 2005).
Fig 2. Theoretical Framework of consequences of oral impacts
One of the most promising inventories that have been applied in the present thesis is the Child
Oral Impacts on Daily Performances (Child-OIDP) scale. The original OIDP version for use
among adults has been translated into different languages (for review see Åstrøm and Okullo
Impairment Level 1
Level 2 Intermediate Impacts
Level 3 Ultimate Impacts
Pain Discomfort Functional limitation
Dissatisfaction with appearance
Impacts on daily performance
Physical Psychological Social

11
(2003) , Masalu and Åstrøm (2003) and Kida et al. (2006)). The child version of the OIDP
was developed and tested in Thailand (Gherunpong et al., 2004a, Gherunpong et al., 2004b)
and has been found to be valid when applied to children in Tanzania (paper II), France and
UK (Tubert-Jeannin et al., 2005, Yusuf et al., 2006). Whereas psychometric properties of the
OIDP have been found to be satisfactory in various cultural contexts, there is less evidence as
to whether this inventory should be interpreted as a uni-dimensional or multidimensional
construct. Moreover, the issue of comparing scores between groups within and across cultures
remains problematic due to lack of evidence of its factorial validity for use in comparative
research (Åstrøm and Mtaya (2008), submitted).
1.5. Psycho social impacts of malocclusion in children
In addition to several multi-item scales for the assessment of children’s quality of life and
well being, single-item global indicators, such as self-rated dental appearance and function are
also widely used in oral health research (Locker and Gibson, 2005). As summary indicators,
intergrating several oral health concepts such as biological states, symptoms and physical-,
psychological- and social functioning, single item global indicators can substitute more
complex multi-item scales. However, single item global indicators of oral health have seldom
been used as the primary outcome in dental studies focusing children from developing
countries. Tables 3 and 4 respectively, show an overview of studies focusing the impact of
malocclusion on quality of life and well being in children and those that have assessed
perception of malocclusion from developed and developing countries.

12
Table 3. An overview of studies published globally between 1998 and 2008 focusing on the impact of
malocclusion on Oral Health Related Quality of Life (OHRQoL) among children and adolescents
Author(s) Country Subjects OHRQoL Index n Age Bernabé et al. (2008) Brazil 1060 15-16 Oral Impacts on Daily Performances (OIDP)
De Oliveira et al. (2008) UK 187 11-16 Child Perceptions Questionnaire (CPQ 11-14)
Bernabé et al. (2007a) Brazil 1318 15-16 Oral Impacts on Daily Performances (OIDP)
Bernabé et al. (2007b) Peru 805 11-12 Child Oral Impacts on Daily Performances
(Child-OIDP)
Locker (2007) Canada 370 Child Perceptions Questionnaire (CPQ 11-14)
O'Brien et al. (2007) UK 147 11-14 Child Perceptions Questionnaire (CPQ)
Locker et al. (2007b) Canada 141 Child Perceptions Questionnaire (CPQ 11-14)
Traebert and Peres (2007) Brazil 414 18 Oral Impacts on Daily Performances (OIDP)
Johal et al. (2007) UK 180 13-15 Child and Parental Perceptions Questionnaire (CPQ and P-CPQ)
Tsakos et al. (2006) Thailand 1034 11-12 Child Oral Impacts on Daily Performances (Child-OIDP)
Brown and Al-Khayal (2006)
Saudi Arabia
174 11-14 Child Perceptions Questionnaire (CPQ 11-14)
Gherunpong et al. (2006b) Thailand 1126 11-12 Child Oral Impacts on Daily Performances (Child-OIDP)
O'Brien et al. (2006) UK 325 11-12 Child Perceptions Questionnaire (CPQ 11-14)
Marques et al. (2006) Brazil 333 10-14 Oral Impacts on Daily Performances (OIDP)
Traebert and Peres (2005) Brazil 414 18 Oral Impacts on Daily Performances (OIDP)
Foster Page et al. (2005) New Zealand
430 12-13 Child Perceptions Questionnaire (CPQ 11-14)
Kok et al. (2004) UK 204 10-12 Child Perceptions Questionnaire (CPQ)
de Oliveira and Sheiham (2004)
Brazil 1675 15-16 Oral Impacts on Daily Performances and Oral Health Impacts Profile (OIDP and OHIP-14)
Jokovic et al. (2002) Canada 123 11-14 Child Perceptions Questionnaire (CPQ 11-14)

13
Tabl
e 4.
An
over
view
of s
tudi
es p
ublis
hed
glob
ally
bet
wee
n 19
98 a
nd 2
008
focu
sing
on
perc
eptio
n of
mal
occl
usio
n am
ong
child
ren
and
adol
esce
nts
Aut
hor(
s)
Cou
ntry
Su
bjec
ts
Con
clus
ions
n
Age
Nob
ile e
t al.
(200
7)
Italy
10
00
11-1
5 C
hild
ren’
s per
cept
ions
of o
rthod
ontic
trea
tmen
t do
not o
verla
p w
ith h
igh
norm
ativ
e or
thod
ontic
tre
atm
ent
need
Has
san
(200
6)
Saud
i A
rabi
a 74
3 17
-24
Patie
nt’s
per
cept
ion
to o
rthod
ontic
trea
tmen
t doe
s alw
ays c
orre
late
with
pro
fess
iona
l ass
essm
ent
O
nyea
so a
nd S
anu
(200
5a)
Nig
eria
57
7 12
-17
Sign
ifica
nt, n
egat
ive,
wea
k co
rrel
atio
ns w
ere
foun
d be
twee
n ad
oles
cent
s aw
aren
ess o
f mal
occl
usio
n an
d sa
tisfa
ctio
n w
ith p
erso
nal d
enta
l app
eara
nce
at v
ario
us se
verit
y le
vels
of m
aloc
clus
ion
O
nyea
so a
nd S
anu
(200
5b)
Nig
eria
61
4 12
-18
Subj
ects
with
cer
tain
mal
occl
usio
n tra
its e
xpre
ssed
unf
avou
rabl
e pe
rcep
tions
of t
eeth
sign
ifica
ntly
m
ore
than
oth
ers
A
bu A
lhai
ja e
t al
(200
5b)
Jord
an
1404
13
and
17
Stud
ents
who
repo
rted
a de
finite
nee
d fo
r tre
atm
ent p
erce
ived
thei
r tee
th to
be
wor
se th
an o
ther
s
Mug
onzi
bwa
et a
l. (2
004b
) Ta
nzan
ia
386
9-18
M
ost c
hild
ren
reco
gniz
ed w
ell-a
ligne
d te
eth
as im
porta
nt fo
r ove
rall
faci
al a
ppea
ranc
e, o
bjec
tive
and
subj
ectiv
e tre
atm
ent n
eed
did
not c
oinc
ide
Ony
easo
and
Aro
woj
olu
(200
3)
Nig
eria
56
7 12
-18
Con
side
rabl
e pr
opor
tions
of a
dole
scen
ts p
erce
ived
, des
ired
and
obje
ctiv
ely
need
ed o
rthod
ontic
car
e,
but d
iscr
epan
cy w
as o
bser
ved
betw
een
subj
ectiv
e fe
lt ne
ed a
nd o
bjec
tivel
y de
term
ined
nee
d
Ony
easo
and
Ade
rinok
un
(200
3)
Nig
eria
61
4 12
-18
Ther
e w
as a
wea
k bu
t sig
nific
ant c
orre
latio
n be
twee
n ob
ject
ivel
y de
term
ined
nee
d an
d ch
ildre
n's
perc
eptio
ns o
f the
app
eara
nce
of th
eir t
eeth
Abd
ulla
h an
d R
ock
(200
2)
Mal
aysi
a 51
12
12-y
ear-
olds
‘D
efin
ite n
eed
for o
rthod
ontic
trea
tmen
t’ pe
rcei
ved
by c
hild
ren
and
pare
nts w
ere
muc
h lo
wer
than
th
ose
of a
trai
ned
orth
odon
tist
Es
a et
al.
(200
1)
Mal
aysi
a 15
19
12-1
3 Si
gnifi
cant
ass
ocia
tions
wer
e fo
und
betw
een
obje
ctiv
ely
dete
rmin
ed n
eed
and
child
ren’
s per
cept
ion
of
need
for o
rthod
ontic
trea
tmen
t, sa
tisfa
ctio
n w
ith d
enta
l app
eara
nce
and
soci
al fu
nctio
ning
Shea
ts e
t al.
(199
8)
USA
11
55
12-1
6 C
linic
al ju
dgm
ent o
f orth
odon
tic n
eed
diff
ered
sign
ifica
ntly
am
ong
leve
ls o
f sat
isfa
ctio
n w
ith te
eth
O
tuye
mi e
t al.
(199
8)
USA
and
N
iger
ia
1337
US
& 2
00
Nig
eria
n
15-1
8 U
S &
12-
18
Nig
eria
ns
Perc
eptio
ns o
f den
tal a
esth
etic
s of N
iger
ian
subj
ects
wer
e ve
ry si
mila
r to
thos
e of
the
US
subj
ects
, but
sh
owed
the
leas
t cor
rela
tion
with
US
orth
odon
tists
14
Malocclusion or the variation of normal growth and development affecting muscles and facial
bones during childhood and adolescence, can cause psychological and social problems related
mainly to impaired dental and facial aesthetics (Kenealy et al., 1989). Thus, an important
aspect of orthodontic treatment is to improve dental aesthetics and enhance well being (Shaw
et al., 1991). It has been shown that a pleasing dental appearance is an important factor for
adolescents psychosocial well being (Peres et al., 2008). However, considerable discrepancies
are commonly found between measures of normative need for orthodontic treatment (such as
a measure of the prevalence of moderate to severe malocclusion) and oral impacts in terms of
psychosocial implications (i.e. dissatisfaction with teeth appearance and function) (Peres et
al., 2008). High proportions of children have been found to have normative need without
psychosocial impacts and vice versa. Gherunpong et al (2006a) developed a socio-dental
approach to assess dental treatment needs in children as a response to the suggestion that both
measures of normative need for treatment and measures of psycho-social implications should
be considered in combination to cover various dimensions of oral health. The conceptual
model for a socio-dental approach to need assessment is described in Paper III of this thesis.
Fig 3 provides a schematic representation of a socio-dental approach to need assessment for
non progressive oral conditions.

15
Fig 3. Basic model of dental needs – Gherunpong et al. (2006b)
1.6. Aim of the study
This study examined the prevalence, socio-demographic distribution, associated factors of
malocclusion and its impact on perceived dental appearance and function in Tanzanian
children with no history of orthodontic treatment. Considering the importance of perceived
teeth appearance for orthodontic treatment need and thus for the planning of oral health care
services, this study estimated a need for orthodontic treatment using a modified integrated
socio-dental approach. Moreover, this study examined the psychometric properties of a
quality of life assessment scale developed for children, the Child Oral Impact of Daily
Performance (Child-OIDP) and evaluated its applicability in Tanzanian primary school
children. Such information is pivotal for the planning and implementation of orthodontic
programs aimed at promoting oral health among children in Tanzania.
Standard normative estimate of need
Impacts on quality of life
Impact-related (sociodental) estimate of need
Propensity for treatments
Propensity-related need
Medium
DHE / OHP Most appropriate treatment + DHE / OHP
Initially planned treatment
High Low
No Yes

16
1.6.1. Research questions Paper I. Prevalence of malocclusion and its relationship with socio-demographic factors,
dental caries and oral hygiene in 12-14-year-old Tanzanian schoolchildren
Focusing 12-14-year-old primary schoolchildren, this study assessed:
1. Prevalence of malocclusion.
2. Its distribution according to socio-demographic factors, caries experience and oral
hygiene status.
Paper II. Applicability of an abbreviated version of the Child-OIDP inventory among
primary schoolchildren in Tanzania
Focusing 12-14-year-old primary schoolchildren, this study aimed to assess:
1. Psychometric properties of the Kiswahili version of the Child-OIDP.
2. Prevalence and perceived causes of the Child-OIDP and its socio-behavioral
correlates.
Paper III. Malocclusion, psycho-social impacts and treatment need: a cross-sectional study of
Tanzanian primary school-children
Focusing 12-14-year-old primary schoolchildren, this study aimed to assess:
1. The prevalence of self reported dissatisfaction with teeth appearance and function and
its relationship with socio-demographics, malocclusion and self reported oral health
problems.
Following the theoretical model of Gilbert et al (1998), it was hypothesized that:
a. Reported oral problems (pain, space, swallowing) would increase with
increased prevalence of malocclusion.
17
b. Dissatisfaction with teeth appearance/function would increase with increased
prevalence of malocclusion, reported oral problems and increased Child-OIDP.
2. This study estimated orthodontic treatment need- using an integrated socio-dental
approach.
Unpublished manuscript. Prevalence of malocclusion and its relationship with socio-
demographic factors in 3-5-year-old preschool children
Focusing 3-5-year-old pre-school children, this study assessed:
1. Prevalence of malocclusion.
2. Its distribution according to socio-demographic factors.
2. MATERIALS AND METHODS
2.1. Study area
Tanzania is a country located along the shores of the Indian Ocean and it is the biggest of the
East African countries. The country has about 50% of the population living below the poverty
line (http://www.tanzania.go.tz/profile.html). The gross domestic product (GDP) per capita of
Tanzania was estimated to US Dollars 251 in 2001 (http://www.tanzania.go.tz/profile.html)
and total health expenditure as percent of GDP in 2003 (http://www.who.int/countries/tza/en/)
was 4.3%. Tanzania has a total population of about 34 million with a growth rate of 2.8%
annually, according to the 2002 (http://www.tanzania.go.tz/census/) population and housing
census. About 46% of the population is under the age of 15 (WHO, 2000), with basic or first
level of education (which include pre- and primary schools) available for all of them
(http://www.tanzania.go.tz/profile.html). The basic education facilities exist both in urban and
rural areas. Medium of instruction in public primary schools is Kiswahili language. The
learning of Kiswahili enables pupils to keep in touch with their cultural values and heritage
18
(http://www.tanzania.go.tz/profile.html). Kiswahili is also a national and an official language
and almost all (more than 95%) of the Tanzanians speak the language proficiently.
Administratively, Tanzania is divided in 26 regions (21 mainland and 5 Zanzibar) and 130
administrative districts (120 mainland and 10 districts in Zanzibar).
The present thesis is based on two surveys conducted among children attending pre- and
primary schools in Dar es Salaam region with about 1mg fluoride/L (1 ppm) in drinking water
(Fig 4). Dar es Salaam is the commercial capital and major sea port of Tanzania, located in
the eastern part, on the shores of Indian Ocean. Dar es Salaam is the most densely populated
and socially and culturally heterogenic region in Tanzania. According to the 2002 population
and housing survey in Tanzania (NBS, 2004), Dar es Salaam has a total population of 2.5
million and population density of 1,793 per square km. Dar es Salaam is divided into three
districts; Kinondoni, Ilala and Temeke with total population sizes of 1.083,913, 634,924 and
768,451 people, respectively. Kinondoni and Temeke are quite diverse districts in terms of
their socio-demographic profile, with the former having higher employment rates, literacy
rates and proportions of the population using the most expensive form, electricity, as their
main source of energy for cooking (NBS, 2004).

19
Fig 4. A map of Tanzania and Dar es Salaam
2.2. Selection procedure and study profiles
The present thesis is based on two surveys; Survey I-II outlined in Table 5.
Table 5. Survey I and survey II constituting the basis of the 3 papers and unpublished results of this thesis
Paper Focus Sample description
I SURVEY I
Malocclusion prevalence and socio-demographic factors
II Applicability of an abbreviated version of the Child-OIDP
inventory
Stratified proportionate two-
stage cluster sampling,
n=1601of 12-14 year olds in
Kinondoni and Temeke, Year
2005-2006
III Malocclusion, psycho-social impacts and treatment need
Summary of
thesis
(Unpublished
manuscript)
SURVEY II
Malocclusion in the primary dentition and socio-behavioural
factors
Census of pre-school children
taken from the selected
primary schools, n=253, 3-5
years old children and
caregivers in Kinondoni and
Temeke, Year 2006

20
2.2.1. Survey I
The material for survey I, which applies for paper I, II and III, was collected between
November 2005 and June 2006. The study population comprised of children attending
standard 7 in public primary schools in Kinondoni and Temeke districts. A stratified
proportionate two-stage cluster sampling design with public primary schools as the primary
sampling unit was utilized. To obtain a sample of schoolchildren of mixed socio-economic
background, schools were selected at random from urban and rural areas in the Kinondoni and
Temeke districts in Dar es Salaam. Overall, 43 rural- (N=4,809 standard 7 pupils) and 78
urban primary schools (N=14725 standard 7 pupils) were listed in Kinondoni. The
corresponding number of schools in Temeke were 22 rural (N=1707 standard 7 pupils) and 77
urban (N= 14103 standard 7 pupils) schools. A sample size of 1200 schoolchildren aged 12-
14 years was calculated to be satisfactory for two sided tests, assuming the prevalence of
malocclusion and oral impacts to be 0.40 and 0.50 in children with and without caries
experience, a significance level of 5% , power of 90% and a design factor of 2 (Lwanga and
Lemeshow, 1991). At the first stage, 4 rural (4/43 n= 755 standard 7 pupils) and 6 urban
(6/77, n=1157 standard 7 pupils) schools in Kinondoni and 1 rural (1/22 n=184 standard 7
pupils) and 5 urban (5/78, n=949 standard 7 pupils) schools in Temeke were selected by
systematic random sampling using a unified sampling fraction within each area. From a total
of 3045 standard 7 pupils available in the selected schools, about 100 students in each
selected school (i.e. 1601 students constituting 52.6% of standard 7 students in the selected
schools) who fulfilled the inclusion criteria (being between 12-14 years, with permanent
dentition and without being orthodontically treated) were randomly selected from the
accessible classes (an overview of the selection process is shown in fig 5). The response rate
was about 100% from each school. Table 6 depicts the number of participating schools in
urban and rural areas of Kinondoni and Temeke, number of eligible standard 7 pupils in each
21
school and number of participants. The sample was self weighted, (with respect to urban/rural
schools in each district) i.e. equal probability samples were achieved in Kinondoni (sample
probability/sampling fraction of urban and rural schools, 0.09) and Temeke (sample
probability/sampling fraction of urban and rural schools, 0.05). However, since variable
sampling fraction was used in Kinondoni and Temeke, sample weights were used to achieve
unbiased population estimates for the two districts combined. Primary schoolchildren
participated in the interview followed by a clinical examination. A test-retest was carried out
on a randomly selected sub-sample of 71 primary schoolchildren considered to be a
representative of the study subjects, at a time interval of 3 weeks after the main survey. Test-
retest reliability of the 8 categorical Child-OIDP items was also assessed.

22
Fig 5. Selection procedure (Survey I)
Population of schools (220)
Kinondoni-Urban (78) N=14725
Rural schools selected (1)
N=184
Urban schools selected (6)
N=1157
Temeke-Rural (22) N=1707
Number of eligible subjects (1133)
Number of eligible subjects (1912)
Number of participants (598)
Number of participants (1003)
Stratification
First Stage (Systematic random sampling)
Rural schools selected (4) N=755
Urban schools selected (5) N=949
Kinondoni-Rural (43) N=4809
Temeke-Urban (77) N=14103
Second stage (random sampling of 12-14-yr-olds)

23
Table 6. Distribution of primary school children according to number (n) of eligible subjects
in each school and percentage of participation
District
Primary school
Number of eligible
standard seven
pupils per school
n
Participants
n
Percentage of
pupils
participated
%
Temeke Kinondoni
Wailes (u)
Miburani (u)
Mbagala A (u)
Mbagala Rangi 3 (u)
Azimio (u)
Kongowe (r)
Dr Omary (u)
Mabibo (u)
Hekima (u)
Msasani (u)
Tumaini (u)
Mbuyuni (u)
Jitihada (r)
Mbezi (r)
Bunju A (r)
Pwani (r)
Total
215
198
216
200
120
184
175
199
153
221
218
191
92
282
145
236
3045
97
92
103
92
108
106
103
102
95
104
116
117
89
110
89
78
1601
45.1
46.5
47.7
46
90
57.6
58.9
51.2
62.1
47
53.2
61.2
96.7
39
61.4
33
52.6
(u) Urban, (r) Rural

24
2.2.2. Survey II
Children 3-5 years of age attending the pre-school part of the selected primary schools in
Kinondoni and Temeke districts were invited to participate in Survey II. Most of the public
(government) primary schools in Tanzania are equipped with pre-school facilities. The study
was conducted during April-May 2006. Letters for permission to work with pre-school
children and their parents/caregivers were given to all targeted pre-school administrations, at
the same time when Survey I was taking place. School administration obtained consent from
parents before giving permission to conduct the study. A total of 8 of the 16 available pre-
schools gave permission to work with their children and were included in the study (Table 7).
All consenting parents (and their children) were given specific dates to be present for the
study. In order to obtain a sample of children with complete primary dentition, pre-school
children who were below 3- and above 5-years of age were excluded from the study. A total
of 253 of 305 (83% response rate) eligible pre-school children and their parents participated
in Survey II.

25
Table 7. Distribution of pre-school children according to number (n) of eligible subjects in
each school and response rate
District
Pre-school
Total number of
eligible pre-school
children per school
n
Participants
n
Response rate
%
Temeke Kinondoni
Miburani (u)
Mbagala A (u)
Azimio (u)
Mabibo (u)
Msasani (u)
Tumaini (u)
Mbezi (r)
Pwani (r)
Total
31
31
32
30
51
30
65
35
305
24
25
27
12
43
25
65
32
253
77.4
80.6
84.4
40
84.3
83.3
100
91.4
83
(u) Urban, (r) Rural
2.3. Survey instrument
2.3.1. Survey I
A structured questionnaire including the Child-OIDP inventory, questions on socio-
demographic characteristics, general health- and oral health status/perceived treatment needs
and oral health related behaviors was administered by 2 trained research assistants and
completed by primary school pupils in face to face interviews at the schools. The interviews
were of approximately 5-7 minutes duration and privacy was ensured in the interaction
between researcher and interviewee. The questionnaire had to be translated from English
(Appendix III) to Kiswahili (Appendix IV), the national and official language in Tanzania.

26
Description of the translation process has been provided in paper II. The questionnaire was
pilot tested and adjusted accordingly before being used in the field. For further information
about the variables included see Appendix III.
2.3.2. Survey II
A structured interview schedule was administered by 2 trained research assistants and
completed by parents/caregivers of the 3-5-year-old pre-school children in face to face
interviews in a classroom setting. The interviews were of approximately 5 minutes duration
and privacy was ensured in the interaction between researcher and interviewee. The
questionnaire was translated from English to Kiswahili and included questions on socio-
demographic characteristics, sucking habits, attitudes of parents towards sucking habits and
their children’s feeding methods. The questionnaire was pilot tested and adjusted accordingly
before being used in the field. For further information about the variables included see
Appendix VI.
Socio-demographics were assessed in terms of district (Kinondoni/Temeke), gender, age,
parental education and number of rooms in their houses. History of sucking was assessed by
asking the parents whether their children had ever sucked finger/lip or dummy. Response
categories were given as (1) yes and (2) no. These were then recoded into (1) no (2) yes for
use in cross tabulation and logistic regression analysis. Current sucking habit was assessed by
asking the parents if their children had any sucking habits currently. Response categories were
given as (1) no and (2) yes. Parental education was constructed into (0) ‘high’ (from original
categories 4, 5 and 6) and (1) ‘low’ (from original categories 1, 2, 3 and 7) variables
(Appendix VI). Number of rooms was constructed into (0) ‘more than 1 room’ (original

27
categories 2 and 3) and (1) ‘1 room’ (original categories 1 and 4) variables, for use in cross
tabulation and logistic regression analysis.
2.4. Clinical examination
2.4.1. Survey I
One trained and calibrated dentist (MM) conducted all clinical examinations in a classroom
setting with natural daylight as the source of illumination and with a trained assistant
recording the observations. First a dentist practiced on orthodontic casts, and then was
compared to an experienced orthodontist whose malocclusion diagnosis served as the standard
(gold standard) for comparison. In addition, the examiner (MM) was also trained on a routine
clinical orthodontic examination (orthodontic diagnosis) on schoolchildren in the Orthodontic
Clinic at the Department of Clinical Dentistry, University of Bergen, supervised by an
orthodontist for one week. For the diagnosis of caries and oral hygiene, a dentist was
compared to an experienced clinician. For a detailed description of the clinical examination in
Survey I, see papers I, II and III. Caries experience was assessed in accordance with the WHO
criteria (WHO, 1997). Oral hygiene was assessed using the simplified Oral Hygiene Index
(OHI-S) (Greene and Vermillion, 1964). Malocclusion was assessed in accordance with the
criteria evolved by Bjørk et al. (1964) with modifications by al-Emran et al. (1990) (Appendix
V).
2.4.2. Survey II
One trained and calibrated dentist (MM) conducted all clinical examinations in a classroom
setting with natural daylight as the source of illumination and with a trained assistant
recording the observations. The clinical examination took place in a private space set aside for

28
this purpose in a classroom setting. Pre-school children were clinically examined in the
presence of their parents/caregivers (after their parents had completed the interview). Pre-
school children were clinically examined for malocclusion only. The registration criterion was
according to Björk et al. (1964) with some modifications by al-Emran et al. (1990) (as
described in paper I, Appendix VIII). For the deciduous dentition, the molar relationship was
classified as Angle Class I, II or III when distal plane of the second deciduous molars in
centric occlusion was straight, distal (distal step) or had a mesial (mesial step) discrepancy,
respectively. Similarly, the deciduous canine was in a Class I relationship when the tip of the
maxillary deciduous canine occluded in the embrasure of the mandibular deciduous canine
and the first deciduous molar, Class II when the tip of the maxillary deciduous canine was
anterior to Class I relationship and Class III when it was posterior to Class I relationship.
Furthermore, occlusion in the anterior segment could not always be determined in pre-school
children due to shedding of the deciduous incisors. Such cases were excluded for the overjet
and overbite analyses, but were included in the analyses for other malocclusions. A sum score
of malocclusions (SMO) was constructed to provide the overall prevalence of malocclusion,
based on the diagnosis of the absence (0)/ presence (1) of the following recordings; a
maxillary overjet, a mandibular overjet, Class II/Class III molar occlusion, an open bite, a
deep bite, a lateral crossbite, a midline shift, crowding and spacing.
2.5. Characteristics of data and statistical analyses
Data were analyzed using the Statistical Package for Social Sciences (SPSS) version 14.0
(papers I, II, III and unpublished manuscript in the thesis); AMOS 6.0 (paper II) and STATA
version 9.0 with survey command (papers II and III). Table 8 summarizes the statistical
methods used for different papers. P-value for statistical significance was set at 0.05.

29
Table 8. Statistical tests and methods that were used in papers I, II and III
Statistics and methods used
Paper I
Paper II
Paper III
Thesis
(Unpublished
manuscript)
Chi-Square test + + + +
Mc Nemar’s statistics - - + -
Cohen’s Kappa + + + -
Principal Component Analysis - + - -
Confirmatory factor analysis (CFA) - + - -
Logistic Regression + + + +
Cronbach’s alpha - + + -
Mann-Whitney U test - + - -
2.6. Ethical considerations
Ethical clearance was obtained from all relevant persons, authorities and committees in
Tanzania, including written permission and clearance from the Research and Publication
Committee of the Muhimbili University of Health and Allied Sciences, MUHAS (Appendix
I). Permission to work with school children was obtained from Kinondoni and Temeke
municipalities, their respective educational authorities, schools administrations and parents.
Only consenting subjects were included in the studies, informed verbal consent was obtained
from all participating primary school children and from the parents.

30
3. RESULTS
3.1. Survey I
3.1.1. Paper I: Prevalence of malocclusion and its relationship with socio-demographic
factors, dental caries and oral hygiene in 12-14-year-old Tanzanian schoolchildren.
A total of 1601 children (mean age 13 years, 60.5% girls) attending 16 primary schools in
Kinondoni and Temeke districts participated in the study. The overall crude prevalence rate of
malocclusion (i.e. sum score of malocclusion, SMO>0 – any type of malocclusion) in the total
population, in Kinondoni and in Temeke was respectively, 63.8%, 62.6% and 66.0%. The
weighted (using sampling weights) unbiased prevalence estimate of malocclusion in the total
population (i.e. Kinondoni and Temeke) was 64.0%. The most frequently recorded anomalies
in the total population were midline shift (22.5%), spacing of at least 2 mm (21.9%) and open
bite (16.1%). A majority (93.6%) of the children showed a Class I molar relationship. Class II
and Class III were registered in 4.4% and 2.0%, respectively. Residing in Temeke (a less
socio-economically privileged district) was associated with higher odds (OR 1.8) of being
diagnosed with an open bite, after controlling for socio-demographic factors. When subjects
with and without caries experience were compared, those with caries experience (DMFT > 0)
were more likely to have any type of malocclusion (SMO>0), midline shift, Angle Class II/III
and open bite than those without caries experience.
3.1.2. Paper II: Applicability of an abbreviated version of the Child-OIDP inventory among
primary schoolchildren in Tanzania.
The Kiswahili version of the Child-OIDP inventory preserved the overall concept of the
original English version and revealed good reliability in terms of Cronbach’s alpha coefficient
of 0.77 (Kinondoni: 0.62, Temeke: 0.76). Weighted Kappa scores from a test-retest were 1.0
and 0.8 in Kinondoni and Temeke, respectively. Validity was supported in that the Child-

31
OIDP scores varied systematically and in the expected direction with self-reported oral health
measures and socio-behavioral indicators. Confirmatory factor analyses, CFA, confirmed
three dimensions underlying the eight item Child-OIDP questionnaire initially identified by
Principle Component Analysis. A total of 28.6% (crude prevalence rate) of the participants
had at least one oral impact. The weighted unbiased Child-OIDP prevalence estimate for the
total population (Kinondoni and Temeke) was 30.0%. The prevalence of oral impacts was
18.5% and 45.5% in Kinondoni and Temeke districts, respectively. Problems with eating was
the performance reported most frequently (13.3% in Kinondoni, 35.3% in Temeke) followed
by cleaning teeth (8.6% in Kinondoni, 26.9% in Temeke). The most frequently reported
causes of impacts were toothache, ulcer in mouth and position of teeth.
3.1.3. Paper III: Malocclusion, psycho-social impacts and treatment need: a cross-sectional
study of Tanzanian primary school-children.
Moderate proportions of children reported problems related to teeth and mouth; ranging from
7.7% (space position) to 20.7% (pain). The odds ratio of having problems with teeth position,
spaces, pain and swallowing if having any malocclusion were respectively, 6.7, 3.9, 1.4 and
6.8. In the total population (Temeke and Kinondoni), 23.3% children (the weighted estimate
was 22.3%) were dissatisfied with dental appearance/function. The corresponding crude
prevalence estimates of dissatisfaction in Kinondoni and Temeke was 25.6% and 19.4%,
respectively. Children dissatisfied with their dental appearance were less likely to be Temeke
residents and having parents of higher education and more likely to reporting problem with
teeth position (OR= 4.3) and having oral impacts (OIDP>0) (OR=2.2). The socio-dental
treatment need of 12% was five times lower than a normative estimate of 63.8% based on the
overall prevalence of malocclusion (SMO>0).

32
3.1.4. Direct age standardization of the crude prevalence estimates for children in Kinondoni
and Temeke districts
To adjust for a possible biasing effect of age in the two populations of 12-14-year-old
schoolchildren in Konondoni and Temeke, direct standardization of the crude prevalence
estimates of malocclusion, Child-OIDP and dissatisfaction with dental appearance/function
was applied. The crude prevalence rates in Kinondoni and Temeke were adjusted using the
Tanzanian 2002 housing and population census for the two districts as reference population
(Central Census Office, 2003). Tables 9-11 shows the crude and age adjusted prevalence rates
of malocclusion, Child-OIDP and dissatisfaction with appearance/function among 12-14-year-
olds in Kinondoni and Temeke. As shown in the tables, the standardization did not accentuate
the district differences with respect to any of the main variables examined in this thesis.
Table 9. Crude and direct age standardized prevalence rates of malocclusion (SMO>0) in
Kinondoni and Temeke using Tanzanian 2002 housing and population census as reference
population (Central Census Office, 2003)
Konondoni Temeke
Size (n) ASE (%) Size (n) ASE (%) Stand population
12 yr 263 61.3 143 61.4 25220
13 yr 420 60.3 290 68.2 20901
14 yr 321 66.9 165 65.4 21224
Total 1003 598 67345
Crude rates (%) 62.7 66.0
Standardized (%) 62.7 64.6
ASE- age specific estimates

33
Table 10. Crude and direct age standardized prevalence rates of Child-OIDP (OIDP>0) in
Kinondoni and Temeke using Tanzanian 2002 housing and population census as reference
population (Central Census Office, 2003)
Kinondoni Temeke
Size (n) ASE (%) Size (n) ASE (%) Stand pop
12 yr 263 17.2 143 36.4 25220
13 yr 420 19.5 290 47.2 20901
14 yr 321 18.4 165 50.3 21224
Total 1003 598 67345
Crude rates (%) 18.5 45.5
Standardized (%) 18.2 44.1
ASE- age specific estimates
Table 11. Crude and direct age standardized prevalence rate of dissatisfaction with teeth
appearance /function using Tanzanian 2002 housing and population census as reference
population (Central Census Office, 2003)
Kinondoni Temeke
Size (n) ASE (%) Size (n) ASE (%) Stand pop
12 yr 263 22.1 143 21.0 25220
13 yr 420 25.2 290 19.7 20901
14 yr 321 29.0 165 17.6 21224
Total 1003 598 67345
Crude rates (%) 25.6 19.4
Standardized (%) 25.2 19.5
ASE- age specific estimates

34
3.2. Survey II
3.2.1 Unpublished manuscript: Prevalence of malocclusion and its relationship with socio-
demographic factors in 3-5-yr-old preschool children
A total of 253 pre-school children (mean age 5 years, 53% boys) attending 8 pre-schools in
Kinondoni and Temeke districts participated in the study. The overall prevalence of
malocclusion (i.e. SMO>0 – any type of malocclusion) in the total population was 32.5%. A
majority (90.9%) of the children showed a Class I molar relationship. Class II and Class III
were registered in 0.8% and 8.3%, respectively. The most frequently recorded anomalies in
the total population were spacing of at least 2 mm (19.8%), open bite (18.6%) and Class III
molar relationship (8.3%). A majority of the children (65.6%) in the total population had
maxillary overjet < 5 mm, and the proportion was significantly greater in children from
Kinondoni than Temeke (68.4% versus 59.2%, p<0.05) (Table 12). There were no significant
district and gender differences in the diagnoses of other malocclusion. Twenty eight percent
of the pre-school children had a history of sucking either their thumb/finger (20.9%), tongue
(5.1%) or (lip 2%). Current sucking habits were reported in 19% of the children (not
presented in the tables). Open bite was the single malocclusion trait associated with sucking
habits. Pre-school children with the history of sucking habit had significantly more open bite
registered than children without such a history (p<0.001). Similarly, pre-school children with
current sucking habits were diagnosed with open bite more often than pre-school children
with absence of such habits (p<0.001). After controlling for socio-demographic variables,
only current sucking habits and gender remained significant determinants for open bite with
the odds ratios of 13.5 and 2.2, respectively (Table 13).

35
Table 12. Percentages (%) and number (n) of occlusal and space characteristics in Tanzanian
pre-school children according to district and gender
District Gender
Kinondoni
% (n)
Temeke
% (n)
Boys
% (n)
Girls
% (n)
Total
% (n)
Occlusal
Sagittal
Molar relationship
Class I 92.1 (163) 88.2 (67) 91.8 (123) 89.9 (107) 90.9 (230)
Class II 1.1 (2) 0 (0) 0 (0) 1.7 (2) 0.8 (2)
Class III 6.8 (12) 11.8 (9) 8.2 (11) 8.4 (10) 8.3 (21)
Maxillary overjet
1-4.9 mm 68.4 (121)* 59.2 (45) 67.9 (91) 63 (75) 65.6 (166)
5-8.9 mm
n/a
0 (0)
31.6 (56)
3.9 (3)
36.8 (28)
1.5 (2)
30.6 (41)
0.8 (1)
36.1 (43)
1.2 (3)
33.2 (84)
Mandibular overjet
<0--1.9 mm 6.8 (12) 2.6 (2) 6 (8) 5 (6) 5.5 (14)
Vertical
Overbite
0.1-2.9 mm
3-4.9 mm
n/a
63.3 (111)
5.6 (10)
31.6 (56)
55.3 (42)
7.9 (6)
36.8 (28)
63.4 (85)
6 (8)
30.6 (41)
58 (68)
6.7 (8)
36.1 (43)
60.9 (153)
6.3 (16)
33.2 (84)
Open bite
0-1.9 mm
≥ 2 mm
18.1 (32)
3.4 (6)
10.5 (8)
1.3 (1)
13.4 (18)
1.5 (2)
18.5 (22)
4.2 (5)
15.8 (40)
2.8 (7)
Transversal
Absent 98.9 (175) 98.7 (75) 100 (134) 97.5 (116) 98.8 (250)
Cross bite: Present 1.1 (2) 1.3 (1) 0 (0) 2.5 (3) 1.2 (3)
Midline shift
Absent (< 2 mm) 92.7 (164) 90.8 (69) 92.5 (124) 91.6 (109) 92.1 (233)
≥ 2 mm 7.3 (13) 9.2 (7) 7.5 (10) 8.4 (10) 7.9 (20)
Space
Absent (or < 2 mm) 81.4 (144) 75 (57) 80.6 (108) 78.2 (93) 79.4 (201)
Crowding (≥2 mm) 1.1 (2) 0 (0) 0.7 (1) 0.8 (1) 0.8 (2)
Spacing (≥ 2 mm) 17.5 (31) 25 (19) 18.7 (25) 21 (25) 19.8 (50)
*p<0.05

36
Table 13. Percentages (%) and number (n) of schoolchildren with open bite according to
district, gender, sucking habits (past and present). Logistic regression, odds ratios (OR) and
95% confidence intervals (CI) (adjusted for age, gender, parental educational status and
number of rooms in their houses)
Open bite present % (n) Adjusted OR (95% CI)
District: Kinondoni 21.5 (38) 1
Temeke 11.8 (9) 0.5 (0.2-1.3)
Gender: Male 14.9 (20) 1
Female 22.7 (27) 2.2 (1.1-4.7) *
Ever sucking: Yes 38 (27) ** 1
No 11 (20) 0.9 (0.2-3.7)
Current sucking: Yes 55.3 (26) ** 1
No 10.2 (21) 13.5 (3.3-55.4) **
*p<0.05, **p<0.001
4. DISCUSSION
This section considers methodological issues of importance for the present thesis and the main
findings of the constituting papers. A more detailed discussion of the results is found in the
individual papers included in this thesis.
4.1. Methodological issues
The data utilized in this thesis was collected in two cross-sectional sample surveys using
interview schedules and clinical examinations. Sample surveys are designed by definition to
provide estimates of the characteristics of a defined population (Moser and Kalton, 1971).
One study population consisted of 3-5-year-old pre-school children in Kinondoni and Temeke
districts. The second study population consisted of 12-14-year-old primary school children in
the same area. The main strength of the present study, as one of the advantages of a sample

37
survey approach, is that it yields information on many variables of a large number of people at
a relatively low cost (Moser and Kalton, 1971). However, it might be subject to various
sources of error, which might bias the results and the conclusions provided (Locker, 2000).
Bias is any systematic error in the data and occurs as two major categories. Selection bias
stem from study participants (e.g. non response) and information bias or misclassification
stem from errors in the information collected from participants (e.g. recall bias). The
methodological problems associated with the present approach are discussed in detail in the
separate papers. Some of the most important limitations are discussed below.
4.1.1. Reliability
Reliability is concerned with the degree of consistency or accuracy with which an instrument
measures an attribute (Moser and Kalton, 1971, Polit and Hungler, 1991). An instrument is
recognized to be reliable when it maximizes the true component and minimizes the error
component of the score. The stability aspect of reliability (precision) can be assessed by
comparing the same measure for the same sample at two or several points in time and then
translating it into convenient statistics (McDowell and Newell, 1996). A test-retest approach
was applied in Survey I. Other measures taken in this study to ensure data quality included
training of research assistants, use of pilot studies and repeated checks during the data entry
process (Survey I and Survey II). Due to logistical reasons, re-interviews and test retest
clinical examination could not be carried out in Survey II.
For measurement of consistency, a sub-sample of primary school children were re-examined
clinically after a period of three weeks. Cohens’ kappa statistics were 0.74, 0.78, 0.79, 0.82,
0.93, 0.93 and 0.97 for the OHI-S-, midline shift-, deep bite-, mandibular overjet-, maxillary
overjet-, DMFT- and spacing scores, respectively. Regarding the scores for an open bite,

38
Angle classification, a crossbite, a scissor bite and crowding, the Kappa statistics were 1.00.
Test retest reliability for the 8 Child-OIDP items were 0.7 (emotional state), 0.8 (carrying out
major schoolwork) and 1.00 (eating, speaking, cleaning teeth, sleeping, smiling and socio
contact). These figures indicate respectively, substantial, perfect and very good agreement
according to Landis and Koch (1977). Weighted Cohen’s kappa for the categorical Child-
OIDPSC scores were 0.91 (1.0 in Kindondoni and 0.83 in Temeke) and Intra-Class
Correlation coefficient for Child-OIDPADD scores were 0.98.
Cronbach’s alpha was used to assess internal consistency reliability (Streiner and Norman,
2003). The more homogenous the items, the higher the correlation (Cronbach’s alpha) and
therefore the more reliable the measure, indicating that, they measure the same underlying
concept. Internal consistency reliability (standardized item alpha) was 0.77 (0.62 in
Kinondoni and 0.76 in Temeke, indicating moderate and extensive internal consistency (paper
II) according to McDowell and Newell (1996). Item total correlation coefficient is the
correlation of the individual item with the scale total omitting that item (Streiner and Norman,
2003). It is recommended that, the items should correlate with the total score above 0.20 for
the instrument (test) to be reliable. Paper II shows that all the item total correlation
coefficients for the Child-OIDP inventory (r ≥ 0.21), were above the recommended total score
(Streiner and Norman, 2003).
4.1.2. Validity
A measure, test or scale is said to be valid if it measures what it claims to measure (McDowell
and Newell, 1996). Internal validity deals with the question of whether a true measure is
obtained for the subjects under study. External validity relates to whether it is permissible to
generalize findings from the sample to a wider population (Moser and Kalton, 1971).

39
Internal validity
An optimal method for obtaining correct diagnoses of malocclusion would have been to
include model (orthodontic casts) and radiographic (orthopantomogram, periapical status,
cephalometric analysis) analysis (Rønning and Thilander, 1995). For optimal diagnosis of
dental caries, x-ray units, adequate lighting and patient’s dental records to obtain reasons for
missing teeth would be required. Using a field method for data collection, the possibility of
misclassification by underreporting the prevalence of malocclusion and dental caries cannot
be ruled out. To limit biases in clinical registrations, the dentist (MM), was calibrated before
the main survey. Using dental casts, the dentist was compared with an experienced
orthodontist whose diagnosis served as the standard (gold standard) for comparison.
Furthermore, the dentist practiced on clinical examination (in schoolchildren) for one week in
the orthodontic clinic at the University of Bergen under supervision of an orthodontist. It was
also ensured that the clinical examinations adhered to the criteria set for field surveys by the
World Health Organization (WHO, 1997), Greene and Vermillion (1964) and Bjørk et al.
(1964).
The present study relies on self reported data in the assessment of risk indicators and
subjective oral health status. Studies have shown that self reports have proven to be valid in
assessing number of teeth although the validity varied with the degree of specificity required
(Gilbert et al., 1997, Gilbert et al., 2002). Common threats to the validity of self-reports that
can lead to information bias is social desirability and recall bias. Retrospective studies are
always prone to recall bias and children’s ability to recall past events and interpret the
questions might have influenced the validity of their answers, which indicates the
respondents’ tendency to represent a favorable image of one-self. In addition, there is a
possibility that socially desired and undesired behaviors have been over-and underestimated

40
in both Survey I and II. To overcome the problems with social desirable answers, interviews
were carried out before the clinical examination. It has been recognised that with the
appropriate questionnaire techniques, valid and reliable information can be obtained from
children (Jokovic et al., 2003, Jokovic et al., 2004, Tubert-Jeannin et al., 2005). As far as
parents’ questionnaire is concerned, the questionnaire was administered as an interview to
clarify any queries. Generally, the questionnaires used among 3-5-year-old pre-school
children’s parents and 12-14-year-old primary schoolchildren were pre-tested and adjusted
accordingly in order to make them socially acceptable.
As validity (i.e. construct validity) is dependant on theory, the observed associations
harmonizing the propositions of the Gilbert et al (1998) model (paper III) is as much a test of
theory as of the validity of the measurements. Similarly, a recall of three months utilized in
the Child-OIDP inventory has proved successful in a number of studies of child populations
(Gherunpong et al., 2004a, Gherunpong et al., 2004b, Tubert-Jeannin et al., 2005, Yusuf et al.,
2006).
External validity
The 12-14-year-old children investigated reflect the variety of characteristics of Tanzanian
children of that age attending primary schools in Kinondoni and Temeke districts. A
comparison of the sample characteristics with the Kinondoni and Temeke 12-14-year-old
child populations on markers of sex and parental education suggests that the sample was fairly
representative of the population of children of that age group in those districts. Direct age
standardization did not accentuate the district differences with respect to any of the main
outcomes investigated among 12-14-year-olds. It is questionable however, whether the
schoolchildren investigated are representative of urban and rural primary schoolchildren in

41
Tanzania generally. The proportionate stratified two-stage cluster sample employed for
primary school children within each district provided a self weighted sample with respect to
urban and rural residents, making weighting of the within district results to adjust for different
probability selection unnecessary. However, with respect to the combined population of
Kinondoni and Temeke, the sample was not self weighting due to unequal sampling fraction
applied in the two districts. Thus, sample weights were applied to obtain unbiased estimates
of the prevalence of malocclusion, oral impacts and dissatisfaction with teeth appearance and
teeth function in the total population covering both districts (Moser and Kalton, 1971).
The use of cluster sampling design with schools as the primary sampling unit materially
simplified and cheapened the field work. Random sampling of school pupils within each
selected school (i.e. primary sampling unit) was utilized in a second stage to make the clusters
equal in size, to reduce the size of the clusters and thus the design effect and to keep the
standard errors within a certain limit. To adjust for the cluster effect and avoid overestimating
the precision (i.e. underestimating the standard errors) data were transferred to STATA
version 9.0 to adjust for the cluster effect. The 95% confidence intervals of the estimates were
adjusted accordingly although the initial results provided without taking the survey design
into consideration were left essentially unchanged.
Although a census of pre-school children (and their parents) in the eligible pre-schools were
invited to participate in Survey II, taking this opportunity relied on each single
parent/caregiver. Initial differences due to self-selection attrition should make one attentive to
the potential presence of a divergence between the targeted parental population and the
studied one. A bias towards health conscious participants is a well-known problem in studies
where participation is voluntary (Locker, 2000). There was a good response rate (over 80%)

42
obtained in both surveys, being on average 100% in Survey I and 83% in Survey II. These
high response rates were probably due to the clear and appropriate information given to the
respondents and to the pre-testing exercises.
Nonetheless, lack of information about non-respondents precludes any firm conclusion about
selection bias and implies that the results of the present surveys, particularly Survey II, should
be drawn with caution. The results of the present thesis might be representative for primary
school children in Kinondoni and Temeke districts, given the sampling method, the good
response rate and the fact that almost all children of school going age are now enrolled in pre-
and primary schools. However, they might not be generalized to primary schoolchildren in the
whole country.
Cross cultural adaptation
Oral health related quality of life instruments are commonly developed in English and are
intended for use in English speaking countries (Guillemin et al., 1993). It would be costly
both in terms of time and money to develop measures specifically designed for use in other
non-English speaking populations, such as Tanzanian children. This is so although cultural
groups differ in disease expression and in use of various health care systems (Guillemin et al.,
1993). Translation and adaptation of oral health related quality of life instrument is
recommended and has become a common practice. Thus, translation and adaptation of the
Child-OIDP inventory into Kiswahili, was for this reason mandatory (paper II). In this study
guidelines for cross cultural adaptation (paper II) were adhered to in order to preserve
sensibility of the Child-OIDP inventory among Tanzanian schoolchildren (Guillemin et al.,
1993). The interpretation of Child-OIDP concepts was further confirmed by the focus group
discussions held among 10 schoolchildren, before the main survey.

43
4.2. Comments on the main findings
4.2.1. Prevalence of malocclusion, reported dental problems, Child-OIDP and dissatisfaction
with dental appearance among primary school children
This study has demonstrated that although malocclusions were prevalent in primary
schoolchildren (crude prevalence rate 63.8%) and with the most frequently recorded
anomalies being a midline shift (22.5%), spacing of 2 millimeters or more (21.9%) and an
open bite (16.1%), only moderate proportions of children reported dental problems (e.g.
23.3% dissatisfaction with appearance and function). Numerous studies have identified a gap
between professionally- and self reported oral health, suggesting that they document different
dimensions of human experience, which are conceptually and often empirically distinct and
which have different implications for treatment need (Locker and Miller, 1994). In
accordance with findings obtained previously, this gap was reflected in the relatively modest
associations obtained between malocclusion and dissatisfaction with teeth appearance and
function and between DMFT status and OIDP scores (paper II and paper III). A possible
explanation of the weak associations observed, is limitation on the part of the Child-OIDP
scale itself describing daily problems that are relatively complex and serious. In spite of
showing satisfactory psychometric properties in the study group investigated (paper II), the
floor effect was large and the mean OIDP score of 1.2 for the total sample of Tanzanian
primary schoolchildren showed only limited variability (paper II).
The overall prevalence of malocclusion (63.8%) among primary schoolchildren presented in
paper I, was found to be in agreement with that reported for Saudi Arabian children of similar
age (62.4%) (al-Emran et al., 1990), much lower than that reported earlier in Tanzania
(97.6%) by Rwakatema et al. (2006), but higher than those obtained by previous studies

44
among Tanzanian children (45%, 51%) (Kerosuo et al., 1991, Mugonzibwa et al., 2004a).
Differences in the methods of registration may explain the variability of the findings.
In Tanzania, as in other non-industrialized countries little is known about children’s self
reported oral health status or their psycho-social responses to oral problems (see Kiwanuka
(2006)). With few exceptions, the prevalence of self reported oral health observed in
Tanzanian primary schoolchildren corroborates what has been reported in similar age groups
in other developing countries. In a previous study of 13-19-year-old Ugandan secondary
school pupils, 28% and 62% were respectively dissatisfied with teeth and had experienced at
least one oral impact during the 6 months preceding the survey (Åstrøm and Okullo, 2003).
Another study focusing on Ugandan primary schoolchildren of 10-14 years found that despite
the low mean DMFT observed, the prevalence of dental pain reported was considerable
(47.6%) (Kiwanuka and Åstrøm, 2005). David and Åstrøm (2006) concluded in a study of 12-
year-old pupils from India that, in spite of their low average DMFT status, nearly one fourth
(23%) were dissatisfied with their teeth.
4.2.2. Prevalence of malocclusion in pre-school children
The total prevalence of malocclusion (32.5%) among pre-school children presented in this
thesis, was found to be lower than that reported among USA (Trottman and Elsbach, 1996)
and Germany (Robke, 2008) children. On the other hand, it was much higher than those
obtained by previous studies among Tanzanian children (Kerosuo et al., 1991, Mugonzibwa et
al., 2004a). Method of malocclusion registration could be the most important factor
explaining these differences.

45
4.2.3. Socio-demographic differentials
Kinondoni and Temeke are quite diverse districts in terms of their socio-demographic profile,
with the former having higher employment rates, literacy rates and proportions of the
population using the most expensive form, electricity, as their main source of energy for
cooking (NBS, 2004). Thus, Kinondoni dwellers are recognized to be more affluent and
highly educated than Temeke dwellers.
District (Temeke/Kinondoni), place of residence (urban/rural) and level of parents’ education
emerged as important risk indicators with respect to an open bite, reported dental problems,
OIDP and dissatisfaction with teeth appearance /function (paper I-III). The findings reported
in paper I, II and III indicated that the prevalence of any malocclusion (66.0% versus 62.6%)
and the prevalence of OIDP (45.5% versus 18.5%) were higher in the socioeconomically less
affluent Temeke district than in socioeconomically affluent Kinondoni. Conversely, Temeke
children were less likely to confirm dissatisfaction with teeth appearance and function than
their Kinondoni counterparts. A social gradient with respect to malocclusion in children and
adolescents has been reported elsewhere (Tickle et al., 1999, Frazão and Narvai, 2006).
Socio-demographic related inequalities in children’s oral health have been reported widely in
the literature, although less frequently from developing countries (Åstrøm and Okullo, 2003).
Contemporary evidence suggest that the lower the material standard of living, the worse the
oral health status irrespective of the measure (clinical or self reported) used to assess it
(Locker, 2007). Social and behavioral inequality in clinically recorded oral health status has
been identified in comparative studies of children from some sub Saharan African and South
East Asian countries where oral health services are not commonly available at the local
community level (for review see Petersen (2005)). In a recent publication concerning
Canadian children 5-14 years of age, Locker (2007) identified socio-economic disparities in
46
their oral health related quality of life, with low income children reporting the poorest oral
impact scores. A social gradient in children’s response to dental pain was not identified,
however, among 10-14-year-old Ugandan children (Kiwanuka and Åstrøm, 2005).
The district gradient in malocclusion among Tanzanian primary school children reported in
paper I might be attributed to the fact that Temeke schoolchildren had on average more caries,
more sucking habits and showed significantly higher OHI-S score than their counterparts in
Kinondoni (paper I and II). Thus, it has been assumed that inequality in oral health has
multiple causes and that the effect on oral health of socio-economic and demographic factors
is mediated through environmental exposure, psychosocial factors, lifestyle and availability of
health care services (Watt, 2007). Evaluating the mediating role of dental behavior in oral
health inequality, (Sanders et al., 2006) found that the slope of the social economic status
gradient in oral health impact profile (OHIP-14) scores was significantly attenuated by dental
visiting but not by dental self care practices.
As reported in paper III, the prevalence of children confirming dissatisfaction with teeth
appearance/function was larger in Kinondoni than in Temeke (25.6% vs. 19.4%). Social and
cultural context in which these children live might have influenced their concern with dental
appearance. It is evident for instance that spacing (especially median diastema) is significantly
disliked in white cultures (Helm et al., 1986, Kerosuo et al., 1995), but it is considered
desirable and a sign of beauty in many African cultures (Mugonzibwa et al., 2004b). Notably,
Temeke children were less dissatisfied with teeth appearance and function and at the same
time they showed a higher prevalence of any malocclusion (SMO> 0) and open bite than their
Kinondoni counterparts (paper I and III). This is noteworthy since children’s feelings
concerning their dental appearance and function tend to predict their demand for orthodontic

47
treatment (Bowling, 1997, Zhang et al., 2006). Many studies on subjects’ perceived
malocclusion have reported on a mismatch between subjectively and objectively determined
orthodontic treatment need (Birkeland et al., 1996, Onyeaso and Arowojolu, 2003,
Mugonzibwa et al., 2004b, Onyeaso and Sanu, 2005a, Hassan, 2006).
4.2.4. Clinical differentials
Dental caries emerged as important risk indicator of malocclusions among 12-14-year-old
primary schoolchildren (paper I). Children with caries experience were more likely to have
any malocclusion (SMO<0), midline shift, Angle Class II/III and open bite. Although, the
mean DMFT was low (0.38, sd=0.85) among the schoolchildren examined, untreated caries
(D component) constituted the greater percentage of the total score, followed by the missing
component of the DMFT. This result reflects a low priority given to the preservation of teeth
and a lack of dental treatment in general in Tanzanian children. Numerous studies have
indicated that decayed and premature loss of primary teeth and first permanent molars, can
bring about various malocclusion traits due to drifting of the neighbouring teeth (Graber,
1972, Koch and Poulsen, 2001, Stahl and Grabowski, 2004, Mitchell, 2005, Alkilzy et al.,
2007). Many other studies have further reported on a positive association between dental
caries and malocclusion (Stahl and Grabowski, 2004, Gábris et al., 2006, Alkilzy et al., 2007,
Peres et al., 2008).
4.2.5. Behavioral differentials
In paper I, girls confirmed more sucking habits than boys. As a result, the prevalence of an
open bite was higher in girls than in boys. Moreover, Temeke primary schoolchildren
confirmed more sucking habits than their counterparts in Kinondoni. Consequently, the
prevalence of an open bite was higher in Temeke children compared with Kinondoni children.

48
Likewise, pre-school children who had a history of sucking habits and who had current
sucking habits were diagnosed with an open bite more often than their counterparts without
such habits (Survey II). It should be noted however, that the prevalence of open bite in pre-
school children might have been under estimated due to elimination in the analysis of the 3-5-
year-olds who had their deciduous incisors shedded.
In addition, an open bite was a single malocclusion trait associated with sucking habits in both
surveys (paper I and Survey II). Previous studies of various designs, have provided evidence
of a positive relationship between sucking habits and various malocclusion traits (Øgaard et
al., 1994, Fukuta et al., 1996, Farsi and Salama, 1997, Karjalainen et al., 1999, Larsson, 2001,
Katz et al., 2004).
It has been indicated in the literature that sucking habits tend to decrease with age (Rønning
and Thilander, 1995). Similarly, in this study the prevalence of current sucking was higher
among 3-5-year-olds (19%) than in 12-14-year-olds (12.1%). It is important to note however,
that some Tanzanian children continue with the sucking habits until their permanent dentition
stage (12-14 years).
4.2.6. Socio-dental orthodontic treatment need
As a prelude to the planning of orthodontic care to combat psychosocial implications of
malocclusions in Tanzania, a socio-dental approach to the estimation orthodontic treatment
need was utilized (paper III). This is the first large population based African study to employ
a modified socio-dental approach to estimate orthodontic treatment need in children. Using
the theoretical framework by Gherunpong et al. (2006b), a socio-dental orthodontic treatment
need of 12% was obtained for Tanzanian primary schoolchildren (paper III). Compared with
the overall prevalence of any malocclusion (63.8%) observed in survey I, the treatment need
based on the socio-dental approach dropped by five times. This drop in the prevalence of

49
children with treatment need might have been overestimated since the total prevalence of
malocclusion was utilized as a measure of normative need. However, irrespective of the
measure of normative need utilized, a socio-dental approach for need assessment might be a
more realistic approach in Tanzania than a normative need assessment based on professional
judgment of clinical conditions. Previous studies have reported a 70% reduction in volume of
estimated treatment need, using a more restrictive measure of normative need assessment
(Gherunpong et al., 2006a, Gherunpong et al., 2006b). As discussed in paper III, caution
should be made when comparing the socio-dental orthodontic treatment need obtained in this
study with estimates reported elsewhere. This is because an Index of Orthodontic Treatment
Need (IOTN index) for normative need assessment, a malocclusion specific OIDP score and
dental attendance patterns were not applied in the present analyses.
4.2.7. Implication for preventive and therapeutic orthodontic services
Knowledge about the extent, associated factors, distribution and psychosocial impacts of
malocclusion as provided by Survey I and Survey II, clearly suggests a need for developing
preventive orthodontic services and strengthening therapeutic oral health services among
schoolchildren aged 3-5- and 12-14-years in Dar es Salaaam, Tanzania. In view of the
relatively scarce resources that are available for dental health care services in Tanzania,
emphasis should be put on oral health education to both dental health personnel (in terms of
continuing education) and community at large, oral health promotion activities and simple
treatment procedures (such as preventive and interceptive orthodontics). In doing so,
malocclusions related to environmental factors and their impacts may be minimized and oral
health improved in general.

50
The various risk indicators with respect to children’s malocclusion as identified in Survey I
and Survey II, in terms of low socio-economic status, dental caries and sucking habits suggest
the need to review the existing health policy and methods for oral health promotion in
Tanzania (Watt, 2003). Children are at risk of other non-communicable diseases than
malocclusions and other oral health problems, which are related to lifestyle. Adoption of the
common risk factor approach should be employed, utilizing a holistic approach rather than a
narrow disease focus in prevention of oral diseases (Sheiham and Watt, 2000, Watt, 2003).
In general, the findings of the present study point to the importance of early caries prevention,
restoration of decayed teeth and elimination of sucking habits as an early phase of orthodontic
interventions. Children from less social economically advantaged areas should be the primary
targets of preventive and interceptive orthodontic programs.
Data generated by Survey I and Survey II strongly indicates that proven preventive measures
such as oral health education (e.g. information on oral hygiene, diet, the effects of sucking
habits), preventive orthodontics such as atraumatic restorative treatment (ART) and topical
fluoride application (for dental caries), should be utilized. Given the cost for orthodontic
treatment, restoration of carious teeth such as deciduous molars to keep them as natural space
maintainers should be encouraged along with other preventive measures. Thus, malocclusions
that may be brought about or exacerbated by environmental factors and their subsequent
psychosocial impacts may be avoided. Parents and children should also be encouraged to
adopt preventive checkups and monitoring of oral health instead of the existing pattern of
symptomatic dental visits reported in this study (paper II). School based oral health programs
which have proved successful should be adopted in all parts of Tanzania.
Children represent a major focus of dental health research and practice and the key to
successful oral care is rooted in childhood; it is therefore the dental health personnel,
51
pediatricians and parents’ job to guide and control the acquisition of acceptable occlusion and
healthy oral status.
Further studies on indication for preventive and interceptive orthodontics and oral health
related quality of life in children should be considered.
4.2.8. Conclusions
• The prevalence of any malocclusion (SMO>0) in 12-14-year-olds was 62.6% and
66.0% in Kinondoni and Temeke districts, respectively. The figure for the 3-5-year-
olds was 32.5%. Dental caries, and socio-economic status, in terms of district of
residence were important risk indicators of malocclusion in 12-14-year-olds, whereas
sucking habits were important risk indicators of open bite among 3-5- year olds.
• The Kiswahili Child-OIDP inventory was applicable for use, in terms of acceptable
psychometric properties among Tanzanian primary schoolchildren. The district
specific prevalence of oral impacts (OIDP>0) was low to moderate, amounting to
18.5% in Kinondoni and 45.5% in Temeke. In both districts impacts on eating was the
most frequently reported impact.
• Dissatisfaction with dental appearance and function was not common, amounting to
only 23.3% among primary schoolchildren aged 12-14 years in the present study.
Children who were dissatisfied with their dental appearance were less likely to be
Temeke residents and having parents of higher education and more likely to report
problem with teeth position and having oral impacts (OIDP>0). Subjects with
malocclusion reported problems most frequently and malocclusion together with other
psycho-social impact scores determined children’s dissatisfaction with teeth

52
appearance /function. The socio-dental treatment need of 12% was five times lower
than a normative estimate of 63.8% based on the overall prevalence of any
malocclusion (SMO>0).

53
5. REFERENCES
ABDULLAH, M. S. & ROCK, W. P. (2002) Perception of dental appearance using Index of
Treatment Need (Aesthetic Component) assessments. Community Dent Health, 19, 161-5.
ABU ALHAIJA, E. S., AL-KHATEEB, S. N. & AL-NIMRI, K. S. (2005a) Prevalence of malocclusion in 13-15 year-old North Jordanian school children. Community Dent Health, 22, 266-71.
ABU ALHAIJA, E. S., AL-NIMRI, K. S. & AL-KHATEEB, S. N. (2005b) Self-perception of malocclusion among north Jordanian school children. Eur J Orthod, 27, 292-5.
AL-EMRAN, S., WISTH, P. J. & BØE, O. E. (1990) Prevalence of malocclusion and need for orthodontic treatment in Saudi Arabia. Community Dent Oral Epidemiol, 18, 253-5.
ALKILZY, M., SHAABAN, A., ALTINAWI, M. & SPLIETH, C. H. (2007) Epidemiology and aetiology of malocclusion among Syrian paediatric patients. European Journal of Paediatric Dentistry, 3, 131-135.
BADLEY, E. M. (1987) The ICIDH: format, application in different settings, and distinction between disability and handicap. A critique of papers on the application of the International Classification of Impairments, Disabilities, and Handicaps. Int Disabil Stud, 9, 122-5.
BEN-BASSAT, Y., HARARI, D. & BRIN, I. (1997) Occlusal traits in a group of school children in an isolated society in Jerusalem. Br J Orthod, 24, 229-35.
BERNABE, E., DE OLIVEIRA, C. M. & SHEIHAM, A. (2007a) Condition-specific sociodental impacts attributed to different anterior occlusal traits in Brazilian adolescents. Eur J Oral Sci, 115, 473-8.
BERNABE, E., FLORES-MIR, C. & SHEIHAM, A. (2007b) Prevalence, intensity and extent of Oral Impacts on Daily Performances associated with self-perceived malocclusion in 11-12-year-old children. BMC Oral Health, 7, 6.
BERNABE, E., SHEIHAM, A. & DE OLIVEIRA, C. M. (2008) Impacts on daily performances related to wearing orthodontic appliances. Angle Orthod, 78, 482-6.
BIRKELAND, K., BOE, O. E. & WISTH, P. J. (1996) Orthodontic concern among 11-year-old children and their parents compared with orthodontic treatment need assessed by index of orthodontic treatment need. Am J Orthod Dentofacial Orthop, 110, 197-205.
BJÖRK, A., KREBS, A. & SOLOW, B. (1964) A Method for Epidemiological Registration of Malocclusion. Acta Odontol Scand, 22, 27-41.
BOWLING, A. (1997) Measuring health : a review of quality of life measurement scales, Buckingham, Open University Press.
BRODER, H. L. & WILSON-GENDERSON, M. (2007) Reliability and convergent and discriminant validity of the Child Oral Health Impact Profile (COHIP Child's version). Community Dent Oral Epidemiol, 35 Suppl 1, 20-31.
BRONDANI, M. A. & MACENTEE, M. I. (2007) The concept of validity in sociodental indicators and oral health-related quality-of-life measures. Community Dent Oral Epidemiol, 35, 472-8.
BROWN, A. & AL-KHAYAL, Z. (2006) Validity and reliability of the Arabic translation of the child oral-health-related quality of life questionnaire (CPQ11-14) in Saudi Arabia. Int J Paediatr Dent, 16, 405-11.
BURT, B. A. (2005) Concepts of risk in dental public health. Community Dent Oral Epidemiol, 33, 240-7.

54
CENTRAL CENSUS OFFICE, N. B. S. (2003) The United Republic of Tanzania, 2002 Population and Housing Census, Volume II, Age and Sex Distribution, (President's Office Planning and Privatization), Dar es Salaam.
CHEN, M. S. & HUNTER, P. (1996) Oral health and quality of life in New Zealand: a social perspective. Soc Sci Med, 43, 1213-22.
CHEVITARESE, A. B., DELLA VALLE, D. & MOREIRA, T. C. (2002) Prevalence of malocclusion in 4-6 year old Brazilian children. J Clin Pediatr Dent, 27, 81-5.
CIUFFOLO, F., MANZOLI, L., D'ATTILIO, M., TECCO, S., MURATORE, F., FESTA, F. & ROMANO, F. (2005) Prevalence and distribution by gender of occlusal characteristics in a sample of Italian secondary school students: a cross-sectional study. Eur J Orthod, 27, 601-6.
DAVID, J., ASTROM, A. N. & WANG, N. J. (2006) Prevalence and correlates of self-reported state of teeth among schoolchildren in Kerala, India. BMC Oral Health, 6, 10.
DE OLIVEIRA, C. M. & SHEIHAM, A. (2004) Orthodontic treatment and its impact on oral health-related quality of life in Brazilian adolescents. J Orthod, 31, 20-7; discussion 15.
DE OLIVEIRA, C. M., SHEIHAM, A., TSAKOS, G. & O'BRIEN, K. D. (2008) Oral health-related quality of life and the IOTN index as predictors of children's perceived needs and acceptance for orthodontic treatment. Br Dent J, 204, 1-5; discussion 384-5.
DHAR, V., JAIN, A., VAN DYKE, T. E. & KOHLI, A. (2007) Prevalence of gingival diseases, malocclusion and fluorosis in school-going children of rural areas in Udaipur district. J Indian Soc Pedod Prev Dent, 25, 103-5.
EISER, C. & MORSE, R. (2001) The measurement of quality of life in children: past and future perspectives. J Dev Behav Pediatr, 22, 248-56.
ESA, R., RAZAK, I. A. & ALLISTER, J. H. (2001) Epidemiology of malocclusion and orthodontic treatment need of 12-13-year-old Malaysian schoolchildren. Community Dent Health, 18, 31-6.
FARSI, N. M. & SALAMA, F. S. (1997) Sucking habits in Saudi children: prevalence, contributing factors and effects on the primary dentition. Pediatr Dent, 19, 28-33.
FOSTER PAGE, L. A., THOMSON, W. M., JOKOVIC, A. & LOCKER, D. (2005) Validation of the Child Perceptions Questionnaire (CPQ 11-14). J Dent Res, 84, 649-52.
FRAZÃO, P. & NARVAI, P. C. (2006) Socio-environmental factors associated with dental occlusion in adolescents. Am J Orthod Dentofacial Orthop, 129, 809-16.
FUKUTA, O., BRAHAM, R. L., YOKOI, K. & KUROSU, K. (1996) Damage to the primary dentition resulting from thumb and finger (digit) sucking. ASDC J Dent Child, 63, 403-7.
GÁBRIS, K., MÁRTON, S. & MADLÉNA, M. (2006) Prevalence of malocclusions in Hungarian adolescents. Eur J Orthod, 28, 467-70.
GHERUNPONG, S., TSAKOS, G. & SHEIHAM, A. (2004a) Developing and evaluating an oral health-related quality of life index for children; the CHILD-OIDP. Community Dent Health, 21, 161-9.
GHERUNPONG, S., TSAKOS, G. & SHEIHAM, A. (2004b) The prevalence and severity of oral impacts on daily performances in Thai primary school children. Health Qual Life Outcomes, 2, 57.
GHERUNPONG, S., TSAKOS, G. & SHEIHAM, A. (2006a) A socio-dental approach to assessing children's orthodontic needs. Eur J Orthod, 28, 393-9.
GHERUNPONG, S., TSAKOS, G. & SHEIHAM, A. (2006b) A sociodental approach to assessing dental needs of children: concept and models. Int J Paediatr Dent, 16, 81-8.
55
GILBERT, G. H., CHAVERS, L. S. & SHELTON, B. J. (2002) Comparison of two methods of estimating 48-month tooth loss incidence. J Public Health Dent, 62, 163-9.
GILBERT, G. H., DUNCAN, R. P. & KULLEY, A. M. (1997) Validity of self-reported tooth counts during a telephone screening interview. J Public Health Dent, 57, 176-80.
GILBERT, G. H., FOERSTER, U. & DUNCAN, R. P. (1998) Satisfaction with chewing ability in a diverse sample of dentate adults. J Oral Rehabil, 25, 15-27.
GRABER, T. M. (1972) Orthodontics : principles and practice, Philadelphia ,. GRABOWSKI, R., STAHL, F., GAEBEL, M. & KUNDT, G. (2007) [Relationship between
occlusal findings and orofacial myofunctional status in primary and mixed dentition. Part I: Prevalence of malocclusions]. J Orofac Orthop, 68, 26-37.
GRATRIX, D. & HOLLOWAY, P. J. (1994) Factors of deprivation associated with dental caries in young children. Community Dent Health, 11, 66-70.
GREENE, J. C. & VERMILLION, J. R. (1964) The Simplified Oral Hygiene Index. J Am Dent Assoc, 68, 7-13.
GUILLEMIN, F., BOMBARDIER, C. & BEATON, D. (1993) Cross-cultural adaptation of health-related quality of life measures: literature review and proposed guidelines. J Clin Epidemiol, 46, 1417-32.
HASSAN, A. H. (2006) Orthodontic treatment needs in the western region of Saudi Arabia: a research report. Head Face Med, 2, 2.
HELM, S. & PETERSEN, P. E. (1989) Causal relation between malocclusion and caries. Acta Odontol Scand, 47, 217-21.
HELM, S., PETERSEN, P. E., KREIBORG, S. & SOLOW, B. (1986) Effect of separate malocclusion traits on concern for dental appearance. Community Dent Oral Epidemiol, 14, 217-20.
HETHERINGTON, E. M., PARKE, R. D. & LOCKE, V. O. (1999) Child psychology : a contemporary viewpoint, Boston, McGraw-Hill College.
HUMPHRIS, G., FREEMAN, R., GIBSON, B., SIMPSON, K. & WHELTON, H. (2005) Oral health-related quality of life for 8-10-year-old children: an assessment of a new measure. Community Dent Oral Epidemiol, 33, 326-32.
JOHAL, A., CHEUNG, M. Y. & MARCENE, W. (2007) The impact of two different malocclusion traits on quality of life. Br Dent J, 202, E2.
JOKOVIC, A., LOCKER, D., STEPHENS, M., KENNY, D., TOMPSON, B. & GUYATT, G. (2002) Validity and reliability of a questionnaire for measuring child oral-health-related quality of life. J Dent Res, 81, 459-63.
JOKOVIC, A., LOCKER, D., STEPHENS, M., KENNY, D., TOMPSON, B. & GUYATT, G. (2003) Measuring parental perceptions of child oral health-related quality of life. J Public Health Dent, 63, 67-72.
JOKOVIC, A., LOCKER, D., TOMPSON, B. & GUYATT, G. (2004) Questionnaire for measuring oral health-related quality of life in eight- to ten-year-old children. Pediatr Dent, 26, 512-8.
JONES, M. L., MOURINO, A. P. & BOWDEN, T. A. (1993) Evaluation of occlusion, trauma, and dental anomalies in African-American children of metropolitan Headstart programs. J Clin Pediatr Dent, 18, 51-4.
JOSEFSSON, E., BJERKLIN, K. & LINDSTEN, R. (2007) Malocclusion frequency in Swedish and immigrant adolescents--influence of origin on orthodontic treatment need. Eur J Orthod, 29, 79-87.
KABUE, M. M., MORACHA, J. K. & NG'ANG'A, P. M. (1995) Malocclusion in children aged 3-6 years in Nairobi, Kenya. East Afr Med J, 72, 210-2.

56
KARJALAINEN, S., RONNING, O., LAPINLEIMU, H. & SIMELL, O. (1999) Association between early weaning, non-nutritive sucking habits and occlusal anomalies in 3-year-old Finnish children. Int J Paediatr Dent, 9, 169-73.
KATZ, C. R., ROSENBLATT, A. & GONDIM, P. P. (2004) Nonnutritive sucking habits in Brazilian children: effects on deciduous dentition and relationship with facial morphology. Am J Orthod Dentofacial Orthop, 126, 53-7.
KENEALY, P., FRUDE, N. & SHAW, W. (1989) An evaluation of the psychological and social effects of malocclusion: some implications for dental policy making. Soc Sci Med, 28, 583-91.
KEROSUO, H. (1990) Occlusion in the primary and early mixed dentitions in a group of Tanzanian and Finnish children. ASDC J Dent Child, 57, 293-8.
KEROSUO, H., HAUSEN, H., LAINE, T. & SHAW, W. C. (1995) The influence of incisal malocclusion on the social attractiveness of young adults in Finland. Eur J Orthod, 17, 505-12.
KEROSUO, H., LAINE, T., NYYSSONEN, V. & HONKALA, E. (1991) Occlusal characteristics in groups of Tanzanian and Finnish urban schoolchildren. Angle Orthod, 61, 49-56.
KIDA, I. A., ASTROM, A. N., STRAND, G. V., MASALU, J. R. & TSAKOS, G. (2006) Psychometric properties and the prevalence, intensity and causes of oral impacts on daily performance (OIDP) in a population of older Tanzanians. Health Qual Life Outcomes, 4, 56.
KIWANUKA, S. N. (2006) Sugar snack consumption, caries experience and dental pain: surveys of 3-5- and 10-14-year old children in Uganda, Bergen, University of Bergen.
KIWANUKA, S. N. & ÅSTRØM, A. N. (2005) Self-reported dental pain and associated factors in Ugandan schoolchildren. Norsk Epidemiology, 15, 175-182.
KOCH, G. & POULSEN, S. (2001) Pediatric dentistry : a clinical approach, Copenhagen, Munksgaard.
KOK, Y. V., MAGESON, P., HARRADINE, N. W. & SPROD, A. J. (2004) Comparing a quality of life measure and the Aesthetic Component of the Index of Orthodontic Treatment Need (IOTN) in assessing orthodontic treatment need and concern. J Orthod, 31, 312-8; discussion 300-1.
LAINE, T. (1984) Morphology of the dentition in young adults. An epidemiological study on finnish students, Kuopio.
LANDIS, J. R. & KOCH, G. G. (1977) An application of hierarchical kappa-type statistics in the assessment of majority agreement among multiple observers. Biometrics, 33, 363-74.
LARSSON, E. (2001) Sucking, chewing, and feeding habits and the development of crossbite: a longitudinal study of girls from birth to 3 years of age. Angle Orthod, 71, 116-9.
LOCKER, D. (1988) Measuring oral health: a conceptual framework. Community Dent Health, 5, 3-18.
LOCKER, D. (2000) Response and nonresponse bias in oral health surveys. J Public Health Dent, 60, 72-81.
LOCKER, D. (2007) Disparities in oral health-related quality of life in a population of Canadian children. Community Dent Oral Epidemiol, 35, 348-56.
LOCKER, D., BERKA, E., JOKOVIC, A. & TOMPSON, B. (2007a) Does self-weighting of items enhance the performance of an oral health-related quality of life questionnaire? Community Dent Oral Epidemiol, 35, 35-43.

57
LOCKER, D. & GIBSON, B. (2005) Discrepancies between self-ratings of and satisfaction with oral health in two older adult populations. Community Dent Oral Epidemiol, 33, 280-8.
LOCKER, D., JOKOVIC, A., STEPHENS, M., KENNY, D., TOMPSON, B. & GUYATT, G. (2002) Family impact of child oral and oro-facial conditions. Community Dent Oral Epidemiol, 30, 438-48.
LOCKER, D., JOKOVIC, A., TOMPSON, B. & PRAKASH, P. (2007b) Is the Child Perceptions Questionnaire for 11-14 year olds sensitive to clinical and self-perceived variations in orthodontic status? Community Dent Oral Epidemiol, 35, 179-85.
LOCKER, D. & MILLER, Y. (1994) Evaluation of subjective oral health status indicators. J Public Health Dent, 54, 167-76.
LWANGA, S. K. & LEMESHOW, S. (1991) Sample size determination in health studies : a practical manual, Geneva, World Health Organization.
MARQUES, L. S., RAMOS-JORGE, M. L., PAIVA, S. M. & PORDEUS, I. A. (2006) Malocclusion: esthetic impact and quality of life among Brazilian schoolchildren. Am J Orthod Dentofacial Orthop, 129, 424-7.
MASALU, J. R. & ÅSTRØM, A. N. (2003) Applicability of an abbreviated version of the oral impacts on daily performances (OIDP) scale for use among Tanzanian students. Community Dent Oral Epidemiol, 31, 7-14.
MCDOWELL, I. & NEWELL, C. (1996) Measuring health : a guide to rating scales and questionnaires, New York, Oxford University Press.
MITCHELL, L. (2005) An Introduction to Orthodontics. 3rd edition, Oxford, Oxford University Press.
MOH (1988) The United Republic of Tanzania, National Plan for Oral Health 1988-2002, Central Dental Unit, Dar es Salaam. Ministry of Health and Social Welfare.
MOSER, C. & KALTON, G. (1971) Survey methods in social investigation, London, Heinemann.
MUGONZIBWA, E. A., ESKELI, R., KUIJPERS-JAGTMAN, A. M., LAINE-ALAVA, M. T. & VAN'T HOF, M. A. (2004a) Occlusal characteristics during different emergence stages of the permanent dentition in Tanzanian Bantu and finnish children. Eur J Orthod, 26, 251-60.
MUGONZIBWA, E. A., KUIJPERS-JAGTMAN, A. M., VAN 'T HOF, M. A. & KIKWILU, E. N. (2004b) Perceptions of dental attractiveness and orthodontic treatment need among Tanzanian children. Am J Orthod Dentofacial Orthop, 125, 426-33; discussion 433-4.
NBS (2004) National Bureau of Statistics. Ministry of Planning, Economy and Empowerment. The United Republic of Tanzania; Regional Profile.
NG'ANG'A, P. M., OHITO, F., OGAARD, B. & VALDERHAUG, J. (1996) The prevalence of malocclusion in 13- to 15-year-old children in Nairobi, Kenya. Acta Odontol Scand, 54, 126-30.
NOBILE, C. G., PAVIA, M., FORTUNATO, L. & ANGELILLO, I. F. (2007) Prevalence and factors related to malocclusion and orthodontic treatment need in children and adolescents in Italy. Eur J Public Health, 17, 637-41.
O'BRIEN, C., BENSON, P. E. & MARSHMAN, Z. (2007) Evaluation of a quality of life measure for children with malocclusion. J Orthod, 34, 185-93; discussion 176.
O'BRIEN, K., WRIGHT, J. L., CONBOY, F., MACFARLANE, T. & MANDALL, N. (2006) The child perception questionnaire is valid for malocclusions in the United Kingdom. Am J Orthod Dentofacial Orthop, 129, 536-40.
ONYEASO, C. O. (2004) Prevalence of malocclusion among adolescents in Ibadan, Nigeria. Am J Orthod Dentofacial Orthop, 126, 604-7.

58
ONYEASO, C. O. & ADERINOKUN, G. A. (2003) The relationship between dental aesthetic index (DAI) and perceptions of aesthetics, function and speech amongst secondary school children in Ibadan, Nigeria. Int J Paediatr Dent, 13, 336-41.
ONYEASO, C. O. & AROWOJOLU, M. O. (2003) Perceived, desired, and normatively determined orthodontic treatment needs among orthodontically untreated Nigerian adolescents. West Afr J Med, 22, 5-9.
ONYEASO, C. O. & SANU, O. O. (2005a) Perception of personal dental appearance in Nigerian adolescents. Am J Orthod Dentofacial Orthop, 127, 700-6.
ONYEASO, C. O. & SANU, O. O. (2005b) Psychosocial implications of malocclusion among 12-18 year old secondary school children in Ibadan, Nigeria. Odontostomatol Trop, 28, 39-48.
OTUYEMI, O. D., OGUNYINKA, A., DOSUMU, O., CONS, N. C., JENNY, J., KOHOUT, F. J. & JAKOBSEN, J. (1998) Perceptions of dental aesthetics in the United States and Nigeria. Community Dent Oral Epidemiol, 26, 418-20.
PAHEL, B. T., ROZIER, R. G. & SLADE, G. D. (2007) Parental perceptions of children's oral health: the Early Childhood Oral Health Impact Scale (ECOHIS). Health Qual Life Outcomes, 5, 6.
PEDERSEN, J., STENSGAARD, K. & MELSEN, B. (1978) Prevalence of malocclusion in relation to premature loss of primary teeth. Community Dent Oral Epidemiol, 6, 204-9.
PERES, K. G., BARROS, A. J., ANSELMI, L., PERES, M. A. & BARROS, F. C. (2008) Does malocclusion influence the adolescent's satisfaction with appearance? A cross-sectional study nested in a Brazilian birth cohort. Community Dent Oral Epidemiol, 36, 137-43.
PETERSEN, P. E. (2005) Sociobehavioural risk factors in dental caries - international perspectives. Community Dent Oral Epidemiol, 33, 274-9.
POLIT, D. F. & HUNGLER, B. P. (1991) Nursing research : principles and methods, Philadelphia, Lippincott.
PROFFIT, W. R. & FIELDS, H. W. (2000) Contemporary orthodontics, St. Louis, Mosby. RAVN, J. J. (1980) Longitudinal study of occlusion in the primary dentition in 3- and 7-year-
old children. Scand J Dent Res, 88, 165-70. ROBKE, F. J. (2008) Effects of Nursing Bottle Misuse on Oral Health : Prevalence of Caries,
Tooth Malalignments and Malocclusions in North-German Preschool Children. J Orofac Orthop, 69, 5-19.
RWAKATEMA, D. S., NGANGA, P. M. & KEMOLI, A. M. (2006) Prevalence of malocclusion among 12-15-year-olds in Moshi, Tanzania, using Bjork's criteria. East Afr Med J, 83, 372-9.
RØNNING, O. & THILANDER, B. (1995) Introduction to orthodontics, [Gøteborg], Gothia. SANDERS, A. E., SPENCER, A. J. & SLADE, G. D. (2006) Evaluating the role of dental
behaviour in oral health inequalities. Community Dent Oral Epidemiol, 34, 71-9. SCHOPF, P. (1981) Der Anteil Exogener Faktoren an der Entstehung von Dysgnathien.
Fortschr. Kieferorthop, 42, 19-28. SHAW, W. C., O'BRIEN, K. D. & RICHMOND, S. (1991) Quality control in orthodontics:
factors influencing the receipt of orthodontic treatment. Br Dent J, 170, 66-8. SHEATS, R. D., MCGORRAY, S. P., KEELING, S. D., WHEELER, T. T. & KING, G. J.
(1998) Occlusal traits and perception of orthodontic need in eighth grade students. Angle Orthod, 68, 107-14.
SHEIHAM, A. & WATT, R. G. (2000) The common risk factor approach: a rational basis for promoting oral health. Community Dent Oral Epidemiol, 28, 399-406.
SLADE, G. D. & ASSESSING ORAL HEALTH OUTCOMES (1997) Measuring oral health and quality of life : proceedings of a conference held June 13-14, at the University of

59
North Carolina-Chapel Hill, North Carolina, Chapel Hill, N.C., Department of Dental Ecology, School of Dentistry, University of North Carolina.
STAHL, F. & GRABOWSKI, R. (2003) Orthodontic findings in the deciduous and early mixed dentition--inferences for a preventive strategy. J Orofac Orthop, 64, 401-16.
STAHL, F. & GRABOWSKI, R. (2004) Malocclusion and caries prevalence: is there a connection in the primary and mixed dentitions? Clin Oral Investig, 8, 86-90.
STREINER, D. L. & NORMAN, G. R. (1995) Health measurement scales : a practical guide to their development and use, Oxford, Oxford University Press.
STREINER, D. L. & NORMAN, G. R. (2003) Health measurement scales : a practical guide to their development and use, Oxford, Oxford University Press.
THILANDER, B., PENA, L., INFANTE, C., PARADA, S. S. & DE MAYORGA, C. (2001) Prevalence of malocclusion and orthodontic treatment need in children and adolescents in Bogota, Colombia. An epidemiological study related to different stages of dental development. Eur J Orthod, 23, 153-67.
TICKLE, M., KAY, E. J. & BEARN, D. (1999) Socio-economic status and orthodontic treatment need. Community Dent Oral Epidemiol, 27, 413-8.
TRAEBERT, E. S. & PERES, M. A. (2005) Prevalence of malocclusions and their impact on the quality of life of 18-year-old young male adults of Florianopolis, Brazil. Oral Health Prev Dent, 3, 217-24.
TRAEBERT, E. S. & PERES, M. A. (2007) Do malocclusions affect the individual's oral health-related quality of life? Oral Health Prev Dent, 5, 3-12.
TROTTMAN, A. & ELSBACH, H. G. (1996) Comparison of malocclusion in preschool black and white children. Am J Orthod Dentofacial Orthop, 110, 69-72.
TSAKOS, G., GHERUNPONG, S. & SHEIHAM, A. (2006) Can oral health-related quality of life measures substitute for normative needs assessments in 11 to 12-year-old children? J Public Health Dent, 66, 263-8.
TUBERT-JEANNIN, S., PEGON-MACHAT, E., GREMEAU-RICHARD, C., LECUYER, M. M. & TSAKOS, G. (2005) Validation of a French version of the Child-OIDP index. Eur J Oral Sci, 113, 355-62.
VISKOVIC, R., VUJANOVIC, M. & BRCIC, V. (1990) [Prevalence of orthodontic anomalies, analysis and evaluation of dental health in three groups of pre-school children in Zadar]. Acta Stomatol Croat, 24, 271-80.
WARREN, J. J. & BISHARA, S. E. (2002) Duration of nutritive and nonnutritive sucking behaviors and their effects on the dental arches in the primary dentition. Am J Orthod Dentofacial Orthop, 121, 347-56.
WATT, R. G. (2003) New WHO diet and nutrition review: implications for dental disease prevention. Nutrition, 19, 1028-9.
WATT, R. G. (2007) From victim blaming to upstream action: tackling the social determinants of oral health inequalities. Community Dent Oral Epidemiol, 35, 1-11.
WEYANT, R. J., MANZ, M., CORBY, P., RUSTVELD, L. & CLOSE, J. (2007) Factors associated with parents' and adolescents' perceptions of oral health and need for dental treatment. Community Dent Oral Epidemiol, 35, 321-30.
WHO (1997) World Health Organization: Oral health survey: Basic methods, Geneva. WHO (2000) The World Health Report 2000, Geneva. WHOQOL (1995) The World Health Organization Quality of Life assessment (WHOQOL):
position paper from the World Health Organization. Soc Sci Med, 41, 1403-9. WILSON-GENDERSON, M., BRODER, H. L. & PHILLIPS, C. (2007) Concordance
between caregiver and child reports of children's oral health-related quality of life. Community Dent Oral Epidemiol, 35 Suppl 1, 32-40.

60
YUSUF, H., GHERUNPONG, S., SHEIHAM, A. & TSAKOS, G. (2006) Validation of an English version of the Child-OIDP index, an oral health-related quality of life measure for children. Health Qual Life Outcomes, 4, 38.
ZHANG, M., MCGRATH, C. & HAGG, U. (2006) The impact of malocclusion and its treatment on quality of life: a literature review. Int J Paediatr Dent, 16, 381-7.
ØGAARD, B., LARSSON, E. & LINDSTEN, R. (1994) The effect of sucking habits, cohort, sex, intercanine arch widths, and breast or bottle feeding on posterior crossbite in Norwegian and Swedish 3-year-old children. Am J Orthod Dentofacial Orthop, 106, 161-6.
ÅSTRØM, A. N. & MTAYA, M. (2008) Factorial Structure and Cross Cultural Invariance of the OIDP. Submitted.
ÅSTRØM, A. N. & OKULLO, I. (2003) Validity and reliability of the Oral Impacts on Daily Performance (OIDP) frequency scale: a cross-sectional study of adolescents in Uganda. BMC Oral Health, 3, 5.

61
6. ORIGINAL PAPERS I – III


Paper I


Matilda Mtaya*, **, Pongsri Brudvik*, Anne Nordrehaug Åstrøm*
* Department of Clinical Dentistry, University of Bergen, Norway and **Department of
Preventive and Community Dentistry, Muhimbili University of Health and Allied Sciences,
Dar es Salaam, Tanzania
Running title: Malocclusion and environmental factors
Address for correspondence
Matilda Mtaya
Faculty of Medicine and Dentistry
Department of Clinical Dentistry
Årstadveien 17
Postboks 7804
N-5009 Bergen
Norway
E-mail: M Mtaya- [email protected],

2
Prevalence of malocclusion and its relationship with socio-demographic
factors, dental caries and oral hygiene in 12-14 year-old Tanzanian
schoolchildren

3
SUMMARY The aim of this study was to assess the prevalence of malocclusion and its
association with socio-demographic characteristics, caries experience and level of oral
hygiene in schoolchildren aged 12-14 years residing in two socio-economically different
districts of Tanzania. A total of 1601 children (mean age 13 years, 60.5% girls) attending 16
primary schools in Kinondoni and Temeke districts participated in clinical examination and
were interviewed in school settings. Chi-square and multiple logistic regression models were
used to test for various statistically significant differences between different groups. The
results showed that 63.8 percent (62.6% in Kinondoni and 66.0% in Temeke) of the subjects
had at least one type of anomaly, with a midline shift (22.5%), spacing of at least 2 mm
(21.9%) and an open bite (16.1%) being most frequently recorded. A majority (93.6%) of the
children showed a Class I molar relationship. Class II and Class III malocclusions were
registered in 4.4 and 2.0 percent, respectively. Multiple logistic regression analyses
controlling for socio-demographic factors showed that the odds ratio (OR) for having an open
bite was 1.8 if residing in a less socio-economically privileged district. Subjects with caries
experience (DMFT > 0) were respectively 1.7, 2.1, 2.4 and 1.7 more likely to be diagnosed
with any type of malocclusion, a midline shift, Angle Class II/III and an open bite.
Schoolchildren with fair/poor oral hygiene were less likely than their counterparts with good
oral hygiene to be diagnosed with a midline shift in this study. It was concluded that
malocclusions were prevalent in Tanzanian children investigated and were associated with
environmental factors in terms of caries experience and residing in a less affluent Temeke
district. Preventive programmes to combat the prevalence are recommended.

4
Introduction
Planning orthodontic treatment within a public health system requires information on the
prevalence and distribution of malocclusion (Foster and Menezes, 1976). A malocclusion is
defined as an irregularity of the teeth or a malrelationship of the dental arches beyond the
range of what is accepted as normal (Walther et al., 1994). Malocclusion is one of the most
common dental problems annoying mankind, together with dental caries, gingival diseases
and dental fluorosis (Dhar et al., 2007). Maloccluded teeth can cause psychosocial problems
related to impaired dento-facial aesthetics (Kenealy et al., 1989); disturbances of oral
function, such as mastication, swallowing, and speech (Proffit and Fields, 2000); and greater
susceptibility to trauma (Grimm et al., 2004) and periodontal disease (Greiger, 2001).
Numerous studies have been published regarding the prevalence of malocclusion in various
populations. The results have shown wide variations, with the reported prevalence ranging
from 39-98 percent (Table 1). Differences in the age ranges of the populations studied,
ethnicity and the number of subjects examined could explain some of the variations (Abu
Alhaija et al., 2005). Moreover, differences in the methods of registration are probably the
most important factors explaining these variations.
In Tanzania, a number of epidemiological studies have provided evidence of the prevalence of
malocclusion in the child population. Kerosuo et al. (1988) examined schoolchildren aged 11-
18 years in the city of Dar es Salaam and found that 96 percent of the 642 children had Class I
molar occlusion, whereas 3, 1 and 16 percent had respectively distal occlusion, mesial
occlusion and crowding. The overall prevalence of malocclusion was reported to be 45
percent (Kerosuo et al., 1991). In a sample of 353 12-year-olds from Bukoba and Moshi
(townships in the Northern parts of Tanzania), a Class I occlusion was observed in 90 percent

5
while a large overjet (>3.5 mm), deep bite (≥3.5mm) and spacing were found in 35, 35 and 50
percent, respectively (Mugonzibwa et al., 1990). Another study in Dar es Salaam examined
698 schoolchildren aged 6-18 years. Ninety-three to ninety-six percent of the children showed
a Class I molar occlusion, 9-13 percent anterior open bite, and more than 33 percent spacing
(Mugonzibwa, 1992). In a further study by Mugonzibwa et al. (2004) considering 869
schoolchildren (3–16 years) in Dar es Salaam, an overall prevalence of malocclusion of up to
51 percent was found. Recently, the overall prevalence of malocclusion among 289
schoolchildren (12-15 years) in Moshi was reported to be 97.6 percent (Rwakatema et al.,
2006). Thus, earlier reports indicated a wide variation in the prevalence of malocclusion
among Tanzanian children.
Previous attempts to investigate a possible association of malocclusion and dental caries have
shown conflicting or inconclusive results (Helm and Petersen, 1989a, Stahl and Grabowski,
2004). While some authors reported upon a positive association between malocclusion and
dental caries (Gábris et al., 2006, Nobile et al., 2007), others could not establish any
significant relationship (Helm and Petersen, 1989a, Stahl and Grabowski, 2004). Moreover,
conflicting results have been obtained in studies considering a possible relationship between
malocclusion and various oral hygiene measures (Ramfjord, 1987). The presence of a
positive association between malocclusion and periodontal health have been described by
Helm and Petersen (1989b) and Gábris et al. (2006). Yet, other studies found no association
when the amount of plaque, calculus, gingivitis or pocketing was related to various indices of
malocclusion (Katz, 1978, Buckley, 1980).
The relationship between dental caries, oral hygiene and malocclusion has not yet been
investigated in Tanzania. Since the Tanzanian oral health policy gives priority to children as a

6
target group for oral health care services (Ministry of Health, 2002), such information is
worthy of consideration. Knowledge concerning the distribution of malocclusion in the child
population and the identification of predisposing factors and associated conditions might help
in understanding its occurrence and assist public-health policy makers improve interventions
(Frazão and Narvai, 2006). Considering the varying prevalence of malocclusion that has been
reported among Tanzanian children, the wide age ranges and mixed ethnicity of the study
groups, the relatively small samples sizes employed and the fact that many studies have been
confined to only one district, large scale epidemiological study was, therefore, conducted
focusing on schoolchildren aged 12-14 years residing in two socio-economically different
districts of Tanzania. This study aim to assess the prevalence of malocclusion and its
distribution by socio-demographic characteristics, dental caries experience and oral hygiene
status.
Subjects and methods
Subjects
The study was carried out in Kinondoni and Temeke districts of the Dar es Salaam region in
Tanzania. These two districts differ in that Kinondoni (with higher employment rate, literacy
rate and proportions of the population using electricity) is more affluent than Temeke
(National Bureau of Statistics, 2004). A stratified proportionate two-stage cluster sampling
design with public primary schools as the primary sampling unit was utilized. One thousand
six hundred and one (632 boys, 969 girls) primary schoolchildren aged 12-14 years were
randomly selected from 16 schools from a total of 220 public schools. The schools were
selected from urban and rural areas of the two districts covering different socio-economic
background. Lists of all schoolchildren in the 16 selected schools with information on age and
gender were collected from the schools. Selected children fulfilled the inclusion criteria of

7
being in the defined age range of 12-14 years and of having only permanent dentition. Only
consenting subjects were included in the study and none of the pupils invited for participation
had a history of orthodontic treatment (either interceptive or elective). A more detailed
description of the sampling procedure can be found elsewhere (Mtaya et al., 2008). Ethical
clearance was obtained from all relevant persons, authorities and committees in Tanzania.
These included written permission and clearance for the study from the Research and
Publication Committee of the Muhimbili University of Health and Allied Sciences (MUHAS).
Permission to work with school children was obtained from Kinondoni and Temeke
municipalities, their respective educational authorities, schools administrations, parents and
children.
Interview
Before being examined clinically, the participants completed a questionnaire in a face to face
interview undertaken by two trained research assistants. The content and performance of the
interview has been described in detail elsewhere (Mtaya et al., 2007).
Clinical Examination
One trained and calibrated dentist (MM) conducted all clinical examinations in a classroom
setting with natural daylight as the source of illumination and with an assistant recording the
observations. Participants identified with problems that needed treatment were referred or
advised to seek treatment at the two municipal hospitals of Kinondoni and Temeke districts.
Oral health education sessions were provided for all participants. Before commencing the
present investigation, a pilot study on 63 children was performed. Caries experience was
assessed in accordance with the criteria by the World Health Organization (WHO, 1997). Oral
hygiene was assessed using the simplified-Oral Hygiene Index (OHI-S) (Greene and

8
Vermillion, 1964). The simplified oral hygiene index is an index developed to assess oral
hygiene status, obtained by combining the average individual or group debris and calculus
scores (Greene and Vermillion, 1964). Occlusion was registered according to Björk et al.
(1964), with some modifications by al-Emran et al. (1990).
Sagittal molar occlusion: the basic Angle classification was used. The intermaxillary
relationship of first permanent molars was registered as Class I (normal/neutral) when the
mesiobuccal cusp of the maxillary first permanent molar occluded in line with mesiobuccal
groove of the mandibular first permanent molar. A Class II (distal) or Class III (mesial) molar
occlusion was recorded when there was deviation of at least one half cusp width distally or
mesially to Class I, respectively. It was recorded as Class I (CL I=1), II (CL II=2) and III (CL
III=3), and dichotomized into 0 (CL I) and 1(CL II and III) for use in cross tabulation and
logistic regression analysis. When the first permanent molars were missing, the registration
was considered not applicable.
Overjet: the distance from the most labial point of the incisal edge of maxillary right central
incisor to the most labial surface of the corresponding mandibular incisor. Measured to the
nearest half millimetre, using a metal ruler parallel to the occlusal plane. A positive value
(maxillary overjet) was recorded if the upper incisor was ahead of the lower incisor, and a
negative value (mandibular overjet), when the upper incisor was behind the lower incisor.
Maxillary overjet was categorized as 1; 1-4.9 mm (grade 1), 2; 5-8.9 mm (grade 2) and 3; ≥ 9
mm (grade 3). It was considered increased when the value exceeded 5 mm, and dichotomized
into 0 < 5 mm and 1 ≥ 5 mm for use in cross tabulation and logistic regression analyses.
Mandibular overjet was coded as 0; absent, 1; < 0 to -1.9 mm (grade 1) and 2; ≤ - 2 mm
(grade 2) and recoded into 0 = absent and 1 = present (1 and 2).
Overbite: the vertical overlap of incisors, measured to the nearest half millimetre vertically
from the incisal edge of the maxillary right central incisor to the incisal edge of the

9
corresponding mandibular right incisor. If the right central incisor was missing or fractured, it
was substituted by the left central incisor. It was coded as 1; 0.1-2.9 mm (grade 1), 2; 3-4.9
mm (grade 2) and 3; ≥ 5 mm (grade 3), then recoded into 0 = absent (< 5 mm) and 1 = present
(≥ 5 mm). It was considered as a deep bite when the value exceeded 5 mm.
Open bite: an anterior open bite (AOB) was recorded when there was no vertical overlap of
the incisors, measured to nearest half millimetre. A visible space between antagonistic fully
erupted canines, premolars or molars was registered as a lateral open bite. An open bite was
coded as 0; absent, 1; 0-1.9 mm (AOB grade 1), 2; ≥ 2 mm (AOB grade 2) and 3; lateral open
bite, and recoded into 0 = absent and 1 = present (1, 2 and 3).
Lateral crossbite: registered when one or more buccal cusps of the mandibular canines,
premolars and/or molars occluded bucally to the buccal cusps of the maxillary antagonists,
recorded either as 1; absent, 2; present unilaterally or 3; present bilaterally. It was then
dichotomized into 0 = absent (1) and 1 = present (2 and 3).
Scissor bite: registered when any of the maxillary premolars and/or molars totally occluded to
the buccal surface of the opposing mandibular teeth, recorded either as 1; absent, 2; present
unilaterally or 3; present bilaterally. It was then dichotomized into 0 = absent (1) and 1 =
present (2 and 3).
Midline shift: defined as non-coincident upper and lower midlines when the posterior teeth
were in maximum intercuspation. It was coded as 1; absent and 2; present when the
displacement was at least 2 mm or more. It was then recoded into 0 = absent (1) and 1 =
present (2).
Crowding: was recorded when the total sum of slipped contacts measured in the segment was
at least 2 mm. It was coded as 1; absent, 2; present upper jaw, 3; present lower jaw and 4;
present both jaws. Then it was recoded into 0 = absent (1) and 1 = present (2, 3 and 4).

10
Spacing: was recorded when the total spacing was at least 2 mm in a segment. It was coded
as 1; absent, 2; present upper jaw, 3; present lower jaw and 4; present both jaws. Then it was
recoded into 0 = absent (1) and 1 = present (2, 3 and 4).
A sum score of malocclusions was constructed for use in cross tabulation and logistic
regression, based on the diagnosis of the absence (0)/ presence (1) of the following
recordings; maxillary overjet, mandibular overjet, Class II and Class III molar occlusion, open
bite, deep bite, lateral crossbite, scissor bite, midline shift, crowding and spacing.
Statistical analyses
Data were analyzed using the Statistical Package for Social Sciences version 14.0 (SPSS Inc.,
Chicago, Illinois, USA). Test-retest reliability for the clinical parameters was assessed using
Cohen’s weighted kappa statistics. Cross-tabulation and chi-square statistics were used to
assess bivariate relationships. Multivariate analysis was conducted using multiple logistic
regression analysis. The P-value for statistical significance was set at 0.05.
Test retest reliability
Duplicate clinical examinations were carried out by the dentist (MM) on a randomly selected
sub-sample of 71 participants considered to be representative of the study subjects, at a time
interval of 3 weeks. Analyses performed on the duplicate examination recordings gave Kappa
values of 0.78, 0.79, 0.82, 0.93 and 0.97 for midline shift, deep bite, mandibular overjet,
maxillary overjet and spacing, respectively. The Kappa values for open bite, sagittal molar
relationship, crossbite, scissor bite and crowding were one. Intra-examiner consistencies for
Decayed, Missing and Filled Teeth (DMFT) and Oral Hygiene Index-Simplified scores gave
the Kappa values of 0.93 and 0.74, respectively. These figures indicate very good intra-
examiner reliability (World Health Oraganization, 1997).

11
Results
Sample profile
A total of 1003 children from Kinondoni (63.5% urban, 58.9% girls, mean age 13.1 years)
and 598 children from Temeke (82.3% urban, 63.2% girls, mean age 13.0 years) completed an
extensive personal interview and underwent a full mouth clinical examination. The mean
Decayed, Missing and Filled Teeth scores were 0.37 (sd=0.86) and 0.39 (sd=0.84) in
Kinondoni and Temeke, respectively. Corresponding scores concerning Oral Hygiene Index-
Simplified scores were 1.0 (sd=0.53, range 0.0-3.3) and 1.2 (sd= 0.54, range 0.0-4.2). Finger
sucking was reported in 12.1 percent of the total sample. Table 2 provides the percentage
distribution of participants’ socio-demographic characteristics, Decayed, Missing and Filled
Teeth scores, Oral Hygiene Index-Simplified score and sucking habits according to district of
residence.
Prevalence of malocclusion
Overall findings
As shown in Figure 2, dentitions without any irregularity were found in 36.2 percent of the
children. Thus, 63.8 percent (62.6% in Kinondoni and 66% in Temeke) of the children had
one or several types of the anomalies recorded. The majority of children had one (33%) and
two anomalies (21.5%), whereas more than five anomalies were registered in 0.2 percent of
the sample.
Sagittal molar occlusion
A Class I (normal/neutral) occlusion was observed in 93.6 percent of the total sample, while
Class II (distocclusion) and Class III (mesiocclusion) were recorded in 4.4 and 2.0 percent,
respectively (Table 3). There were no significant differences in diagnoses between districts

12
and gender. In 141 schoolchildren the molar relationship could not be registered due to
missing first molars and those children were excluded from sagittal molar occlusion analysis.
Maxillary overjet
A majority of the children (73.3%) in the total population had a maxillary overjet < 5 mm,
and the proportion was significantly greater in children from Kinondoni than in children from
Temeke (76.4% versus 68.2%, p<0.001). Overall, an overjet ≥ 5 mm occurred in 11.1 percent
and severe increased overjet (≥ 9 mm) was registered in 0.4 percent. A mandibular overjet
was found in 8.4 percent of the schoolchildren and 6.8 percent of the schoolchildren had an
edge to edge bite (Table 3).
Overbite
A normal overbite (grade 1; 0.1-2.9 mm) was recorded in 65.9 percent of the total sample,
while grade 2 (3-4.9 mm) and deep bite (grade 3; ≥ 5 mm) were registered in 17.9 and 0.9
percent, respectively. Furthermore, children in Kinondoni had significantly more overbite
grade 2 (3-4.9 mm) than in Temeke (P<0.001, Table 3).
Open bite
An AOB was recorded in 15 percent of the entire sample (Table 3). An AOB < 2 mm was
found less often in Kinondoni (7.4%) than in Temeke (11.5%) (P<0.001). Moreover, the
occurrence of an AOB of < 2 mm was significantly higher in girls (10.6%) than in boys
(6.3%) (P< 0.05). A lateral open bite was registered in 1.1 percent of all children (Table 3).

13
Transverse anomalies
Of the transverse anomalies, a midline shift (≥ 2 mm) was recorded in 22.5 percent of the
whole sample (Table 3). In addition, Temeke schoolchildren experienced more midline shift
(27.4%) than Kinondoni children (19.6%) (P<0.001). A posterior crossbite was found in 5.1
percent while a scissor bite was registered in 14.3 percent of all children.
Space discrepancies
Overall crowding (≥ 2 mm) was found in 14.1 percent of the sample. No gender or district
differences were recorded (Table 3). Spacing was noted in 21.9 percent of the subjects. This
anomaly was more frequent among children in Kinondoni than in Temeke (24.1% versus
18.2%, p<0.001).
Dental caries, oral hygiene, socio-demographic variables and malocclusions
The association between malocclusions, Decayed, Missing and Filled Teeth, Oral Hygiene
Index-Simplified score and socio-demographic variables was analyzed by cross tabulation and
Chi-square test (Table 4). Possible confounding factors due to strong associations between the
explanatory variables were taken into consideration in a multivariate logistic regression
analysis (Table 4). In the final models the district of residence and the Decayed, Missing and
Filled Teeth status varied systematically with malocclusion. After controlling for all other
variables in the analysis, district varied systematically with an open bite. Compared with
Kinondoni children those from Temeke were 1.8 times more likely to have an open bite.
District did not vary systematically with a midline shift in the multivariate logistic regression
analysis, although it was significant in the bivariate analysis. Caries experience varied
systematically with a midline shift and an open bite. Compared with children without caries
experience those with DMFT > 0 were 2.1 times more likely to have a midline shift and 1.7

14
times more likely to have an open bite. Children with caries experience were also 2.4 and 1.7
times more likely than caries free children to have an Angle Class II and III molar relationship
and to score above zero on the sum score of malocclusion. Oral Hygiene Index-Simplified
score was not statistically significant in the bivariate analysis but varied systematically with a
midline shift in the multiple logistic regression analysis. Thus, compared with children with
OHI-S score of zero, those with OHI-S score above zero were less likely to have a midline
shift (Table 4).
Discussion
Methodological issues
The present research is the first large population based study considering the prevalence of
malocclusion and its relationship with socio-demographic factors, dental caries and oral
hygiene among schoolchildren in Tanzania. Comparison of the sample characteristics with the
Kinondoni and Temeke child population statistics on the markers of gender and parental
education, suggest that the sample was representative of the population of children aged 12-14
years in those districts. None of the children had received orthodontic treatment, either by
interceptive or corrective measures. It has been noted that in studies concerning the
prevalence of malocclusion, the material should be obtained from a well-defined population
and be large enough and cover non-orthodontically treated children (Thilander et al., 2001).
The present sample seems to satisfy those requirements.
The clinical registrations were based on the method evolved by Björk et al. (1964) with some
modifications by al-Emran et al. (1990). Björk’s method has been used in many studies and
allows objective comparisons of the presence of malocclusion between different populations.
However, comparisons of the present findings with those of other studies must be done
cautiously because different methods and indices have been applied in varying age ranges of

15
the populations. Moreover, no radiographs or study casts were used in the present study. The
probability of having under- or overestimated some prevalence estimates such as agenesis,
supernumerary teeth, the accuracy of space analysis as well as some details on the deviations
of tooth positions cannot be overlooked. It has been shown that records made on the basis of
casts seem to give a higher prevalence of deviations than direct recording (Helm, 1970,
Heikinheimo, 1978). Nevertheless, given the sample size and the selection criteria used in this
study, the findings give a reasonably accurate indication of the occurrence of malocclusion in
12- to 14-year-old children in Dar es Salaam.
Prevalence of malocclusion
Overall findings
The overall prevalence of malocclusion (63.8%) registered among schoolchildren in Dar es
Salaam was found to be in agreement with that reported for Saudi Arabian children of a
similar age (al-Emran et al., 1990), lower than that reported by Rwakatema et al. (2006), but
much higher than those obtained in previous studies among Tanzanian children (Kerosuo et
al., 1991, Mugonzibwa et al., 2004). Differences in the registration methods may explain the
variability of the findings.
Sagittal molar occlusion
In accordance with the findings of previous studies (Lew et al., 1993, Ng'ang'a et al., 1996,
Silva and Kang, 2001, Thilander et al., 2001, Abu Alhaija et al., 2005), the predominant
sagittal molar relationship among Tanzanian schoolchildren was Angle Class I (93.6%). The
prevalence of a Class II molar relationship (4.4%) was in line with the previous investigations
from Tanzania (Kerosuo et al., 1988, Mugonzibwa et al., 1990), but was lower than that
reported among Swedish adolescents and Swedish Eastern European and Asian immigrants
(Josefsson et al., 2007). Moreover, the prevalence of a Class III molar relationship (2%)

16
compares with that reported by Mugonzibwa (1992) but lower than that reported by Josefsson
et al. (2007).
Mandibular overjet
The occurrence of a mandibular overjet was in agreement with that found in Colombian
children by Thilander et al (2001). The differences in the prevalence between Class III (2%)
and mandibular overjet (8.4%) observed in the present study may indicate a functional
anterior crossbite (Thilander et al., 2001). However, the possibility of early loss of upper
primary canines, leading to palatal tipping and/or distal migration of the upper permanent
anterior teeth, can not be excluded.
Maxillary overjet
The prevalence of an increased overjet (≥ 5 mm, 11.5%) found in the present study, was in
concordance with previous studies among Tanzanian and Kenyan children (Kerosuo et al.,
1988, Ng'ang'a et al., 1996), lower than that reported among Saudi children (al-Emran et al.,
1990) but higher than that observed by Mugonzibwa (1992). Differences in the definition of
an increased overjet between the aforementioned studies might have contributed to the
variations in the reported results.
Overbite
The majority of children in the present sample had a normal overbite. A severe deep bite that
exceeded 5 mm was rare (0.9%). This finding accords with a previous finding among
Tanzanian children with complete permanent dentition (ES4) (Mugonzibwa et al., 2004).
Most of the children in this study had full eruption of the premolars and second molars, which
might have stabilized their occlusion resulting in a decreased prevalence of a deep bite
(Thilander et al., 2001).

17
Open bite
An AOB (15%) was a more common vertical occlusal anomaly. Its prevalence in the present
study was close to that reported by Mugonzibwa et al. (2004) in children in the emergence
stage 4 (ES4). Thilander et al. (2001) pointed out that an AOB is more frequently observed in
Black than in White American adolescents, indicating that its occurrence might be genetically
determined, demonstrating a long lower-face and high mandibular plane angle on the part of
Black adolescents. However, environmental factors such as mouth breathing associated with
the warm climate (Lamberton et al., 1980) as well as prolonged sucking habits after eruption
of the permanent incisors (Larsson and Bishara, 2003) might have played a role. In this study,
the prevalence of an open bite was higher in girls who performed sucking habits more than
boys. The prevalence of prolonged sucking habits was 15.2 and 7.4 percent in girls and boys,
respectively (not presented in the tables). Nevertheless, a lateral open bite was rare and its
occurrence compares with that reported by Laine and Hausen (1983) and al-Emran et al.
(1990).
Transverse anomalies
The prevalence of a crossbite (5.1%) was in concordance with that reported in the literature
by Kerosuo et al. (1988), but lower and higher than those reported respectively by
Mugonzibwa (1992) and Abu Alhaija et al. (2005). A posterior crossbite has been considered
as a consequence of sucking habits which differ between different populations (Abu Alhaija et
al., 2005). On the other hand, the present prevalence of a scissor bite (14.3%) was much
higher than reported in earlier studies (Mugonzibwa et al., 1990, Kerosuo et al., 1991,
Ng'ang'a et al., 1996, Mugonzibwa et al., 2004, Abu Alhaija et al., 2005). A midline shift
(22.5%) was the most common anomaly in this study, its frequency was much higher than that
found among Kenyan and Saudi children (al-Emran et al., 1990, Ng'ang'a et al., 1996). The
high prevalence of midline shift found in the present study, might have been caused by a

18
unilateral premature loss of primary teeth particularly primary canines (Hollander and Full,
1992).
Space discrepancies
Spacing of 2 mm or more (21.9%) was the second most common anomaly present. Its
prevalence was in agreement with that reported among rural Nigerian children (Otuyemi and
Abidoye, 1993) but lower than that among Tanzanian children (Mugonzibwa et al., 1990).
Large arches in black people might explain the occurrence of more spacing than crowding
(Abu Alhaija et al., 2005). The prevalence of crowding (14.1%) was similar to that observed
by Gábris et al. (2006) and Kerosuo et al. (1988). Furthermore, both crowding and spacing
were found more often in the upper than lower jaws (data not presented). This finding was in
agreement with that observed among Kenyan children (Ng'ang'a et al., 1996).
Dental caries, oral hygiene, socio-demographic variables and malocclusions
By examining the relationship between malocclusions, dental caries, oral hygiene and socio-
demographic characteristics using multiple logistic regression analysis, it was possible to
compare the strength of the influence from each. Children with caries experience (DMFT > 0)
were almost two times more likely to have any type of malocclusion (sum score of
malocclusion > 0) as compared with their counterparts without caries experience (DMFT = 0).
Similar results were obtained by Gábris et al. (2006) among Hungarian adolescents.
Moreover, Stahl and Grabowski (2004) reported that dental caries and premature loss of
primary teeth are predisposing factors for occlusal and space anomalies in the mixed and
permanent dentition. In addition, schoolchildren with DMFT > 0 were two times more likely
than their counterparts without caries experience to be diagnosed with a midline shift. This
finding is consistent with that found in Israeli children (Ben-Bassat et al., 1997). A midline
shift may be a result of a unilateral loss of the primary canine or first molar due to caries
(Mitchell, 2005). Dental caries was further associated with an Angle Class II/III molar

19
relationship, where children with DMFT > 0 were two times more likely to be diagnosed with
an Angle Class II/III than children with no caries. A similar finding was reported by Ben-
Bassat et al. (1997). Untreated proximal caries in pimary molars or early loss of a second
primary molar may lead to forwards drift of the first permanent molar, promoting the change
in molar relationship (Graber, 1972, Koch and Poulsen, 2001, Mitchell, 2005). Thus, some of
the children with an Angle Class II or Class III recorded in the present investigation might,
indeed, have a neutral skeletal relationship. Lastly, the likelihood of being diagnosed with an
open bite was almost two times more in children with dental caries than in children without
caries. Corresponding results were reported by Peres et al. (2007) among Brazilian children.
Reduced salivary flow in children with an AOB and with a mouth breathing habit, may have
enhanced susceptibility to dental caries (Thylstrup and Fejerskov, 1994).
A considerable difference in the occurrence of an open bite was observed in the two districts,
children from Temeke were almost two times more likely than their Kinondoni counterparts
to be diagnosed with that anomaly. This result might reflect the role of environmental factors
in the occurrence of an open bite, with children from Temeke being not only less socio-
economically privileged but were also prolonged finger suckers to a larger extent than their
counterparts from Kinondoni.
Regarding oral hygiene in this study, children with fair/poor oral hygiene were less likely than
their counterparts with good oral hygiene to be diagnosed with a midline shift. In contrast,
Helm and Petersen (1989b) found higher scores of gingivitis and periodontal pocketing in
subjects with various malocclusion.
Conclusion
Malocclusions are still prevalent in Tanzanian primary schoolchildren with a prevalence that
is comparable with that observed in similar aged children from non-industrialized

20
communities. The most prevalent malocclusion traits were a midline shift, spacing (≥ 2 mm)
and an open bite. Furthermore, the most important finding in this study was the identification
of environmental factors (caries experience and residing in a less affluent district) associated
with malocclusion. This information is relevant for oral health policy making i.e. planning
preventive measures.
Acknowledgements
This study was financially supported by the Department of Clinical Dentistry and the Centre
for International Health, University of Bergen. The authors would like to acknowledge the
local administrative authorities and Research and Publication committee of the Muhimbili
University of Health and Allied Sciences in Tanzania for giving permission to conduct this
study. Thanks to the teachers for logistics assistance, parents for giving permission, all pupils
who volunteered to participate in this study and Prof. O. E. Bøe for statistical advice.
References
Abu Alhaija E S, Al-Khateeb S N, Al-Nimri K S 2005 Prevalence of malocclusion in 13-15
year-old North Jordanian school children. Community Dental Health 22: 266-271
al-Emran S, Wisth P J, Bøe O E 1990 Prevalence of malocclusion and need for orthodontic treatment in Saudi Arabia. Community Dentistry and Oral Epidemiology 18: 253-255
Behbehani F, Årtun J, Al-Jame B, Kerosuo H 2005 Prevalence and severity of malocclusion in adolescent Kuwaitis. Medical Principles and Practice 14: 390-395
Ben-Bassat Y, Harari D, Brin I 1997 Occlusal traits in a group of school children in an isolated society in Jerusalem. British Journal of Orthodontics 24: 229-235
Björk A, Krebs Å, Solow B 1964 A method for epidemiological registration of malocclusion. Acta Odontologica Scandinavica 22: 27-41

21
Buckley L A 1980 The relationships between irregular teeth, plaque, calculus and gingival disease. A study of 300 subjects. British Dental Journal 148: 67-9
Ciuffolo F, et al. 2005 Prevalence and distribution by gender of occlusal characteristics in a sample of Italian secondary school students: a cross-sectional study. European Journal of Orthodontics 27: 601-606
Dhar V, Jain A, Van Dyke T E, Kohli A 2007 Prevalence of gingival diseases, malocclusion and fluorosis in school-going children of rural areas in Udaipur district. Journal of the Indian Society of Pedodontics and Preventive Dentistry 25: 103-5
Foster T D, Day A J W 1974 A survey of malocclusion and the need for orthodontic treatment in a Shropshire school population. British Journal of Orthodontics 1: 73-78
Foster T D, Menezes D M 1976 The assessment of occlusal features for public health planning purposes. American Journal of Orthodontics 69: 83-90
Frazao P, Narvai P C 2006 Socio-environmental factors associated with dental occlusion in adolescents. American Journal of Orthodontics and Dentofacial Orthopedics 129: 809-16
Gábris K, Márton S, Madléna M 2006 Prevalence of malocclusions in Hungarian adolescents. European Journal of Orthodontics 28: 467-470
Graber T M 1972 Orthodontics: principles and practice. Philadelphia
Greene J C, Vermillion J R 1964 The simplified oral hygiene index. Journal of the American Dental Association 68: 7-13
Greiger A 2001 Malocclusion as an etiologic factor in periodontal disease: a retrospective essay. American Journal of Orthodontics and Dentofacial Orthopedics 120: 112-115
Grimm S, Frazao P, Antunes J L, Castellanos R A, Narvai P C 2004 Dental injury among Brazilian schoolchildren in the state of São Paulo. Dental Traumatology 20: 134-138
Heikinheimo K 1978 Need of orthodontic treatment in 7-year-old Finnish children. Community Dentistry and Oral Epidemiology 6: 129-134
Helm S 1970 Prevalence of malocclusion in relation to development of dentition. Thesis, University of Copenhagen

22
Helm S, Petersen P E 1989a Causal relation between malocclusion and caries. Acta Odontologica Scandinavica 47: 217-221
Helm S, Petersen P E 1989b Causal relation between malocclusion and periodontal health. Acta Odontologica Scandinavica 47: 223-228
Hollander C S, Full C A 1992 Midline correction by extraction of the remaining mandibular canine: myth or reality. ASDC Journal of Dentistry for Children 59: 207-211
Josefsson E, Bjerklin K, Lindsten R 2007 Malocclusion frequency in Swedish and immigrant adolescents--influence of origin on orthodontic treatment need. European Journal of Orthodontics 29: 79-87
Katz R V 1978 An epidemiologic study of the relationship between various states of occlusion and the pathological conditions of dental caries and periodontal disease. Journal of Dental Research 57: 433-439
Kenealy P, Frude N, Shaw W 1989 An evaluation of the psychological and social effects of malocclusion: some implications for dental policy making. Social Science & Medicine 28: 583-591
Kerosuo H, Laine T, Kerosuo E, Ngassapa D, Honkala E 1988 Occlusion among a group of Tanzanian urban schoolchildren. Community Dentistry and Oral Epidemiology 16: 306-309
Kerosuo H, Laine T, Nyyssonen V, Honkala E 1991 Occlusal characteristics in groups of Tanzanian and Finnish urban schoolchildren. Angle Orthodontist 61: 49-56
Koch G, Poulsen S 2001 Pediatric Dentistry: A clinical approach. Munksgaard, Copenhagen
Laine T, Hausen H 1983 Occlusal anomalies in Finnish students related to age, sex, absent permanent teeth and orthodontic treatment. European Journal of Orthodontics 5: 125-131
Lamberton C M, Reichart P A, Triratananimit P 1980 Bimaxillary protrusion as a pathologic problem in the Thai. American Journal of Orthodontics 77: 320-329
Larsson E, Bishara S 2003 The influence of oral habits on the developing dentition and their treatment: clinical and historical perspectives (2nd edn.). University of Iowa

23
Lew K K, Foong W C, Loh E 1993 Malocclusion prevalence in an ethnic Chinese population. Australian Dental Journal 38: 442-449
Mitchell L 2005 An introduction to orthodontics (3rd edn.). Oxford University Press, Oxford
Ministry of Health 2002 The United Republic of Tanzania: oral health care policy. Ministry of Health, Dar es Salaam
Mtaya M, Åstrøm A N, Tsakos G 2007 Applicability of an abbreviated version of the Child-OIDP inventory among primary schoolchildren in Tanzania. Health and Quality of Life Outcomes 5: 40
Mtaya M, Åstrøm A N, Brudvik P 2008 Malocclusion, psycho-social impacts and treatment need: a cross sectional study of Tanzanian primary school-children. BioMed Central Oral Health 8: 14
Mugonzibwa E A 1992 Variations in occlusal and space characteristics in a series of 6-18-year olds, in Ilala District, Tanzania. African Dental Journal 6: 17-22
Mugonzibwa E A, Eskeli R, Kuijpers-Jagtman A M, Laine-Alava M T, van't Hof M A 2004 Occlusal characteristics during different emergence stages of the permanent dentition in Tanzanian Bantu and Finnish children. European Journal of Orthodontics 26: 251-260
Mugonzibwa E A, Mumghamba E, Rugarabamu P, Kimaro S 1990 Occlusal and space characteristics among 12-year-old school children in Bukoba and Moshi, Tanzania. African Dental Journal 4: 6-10
National Bureau of Statistics 2004 The United Republic of Tanzania: Regional profile. National Bureau of Statistics. Ministry of Planning, Economy and Empowerment, Dar es Salaam
Ng'ang'a P M, Ohito F, Øgaard B, Valderhaug J 1996 The prevalence of malocclusion in 13- to 15-year-old children in Nairobi, Kenya. Acta Odontologica Scandinavica 54: 126-130
Nobile C G, Pavia M, Fortunato L, Angelillo I F 2007 Prevalence and factors related to malocclusion and orthodontic treatment need in children and adolescents in Italy. European Journal of Public Health 17: 637-641
Onyeaso C O 2004 Prevalence of malocclusion among adolescents in Ibadan, Nigeria. American Journal of Orthodontics and Dentofacial Orthopedics 126: 604-607
24
Otuyemi O D, Abidoye R O 1993 Malocclusion in 12-year-old suburban and rural Nigerian children. Community Dental Health 10: 375-380
Peres K G, De Oliveira Latorre Mdo R, Sheiham A, Peres M A, Victora C G, Barros F C 2007 Social and biological early life influences on the prevalence of open bite in Brazilian 6-year-olds. International Journal of Paediatric Dentistry 17: 41-49
Proffit W R, Fields H W 2000 Contemporary orthodontics (3rd edn.). Mosby, Inc., St Louis
Ramfjord S P 1987 Periodontal significance of orthodontic therapy. In: Derrik DD (ed.) The dental annual. Bristol, Wright, pp 156-166
Rwakatema D S, Ng'ang'a P M, Kemoli A M 2006 Prevalence of malocclusion among 12-15-year-olds in Moshi, Tanzania, using Bjork's criteria. East African Medical Journal 83: 372-379
Silva R G, Kang D S 2001 Prevalence of malocclusion among Latino adolescents. American Journal of Orthodontics and Dentofacial Orthopedics 119: 313-315
Stahl F, Grabowski R 2004 Malocclusion and caries prevalence: is there a connection in the primary and mixed dentitions? Clinical Oral Investigations 8: 86-90
Thilander B, Myrberg N 1973 The prevalence of malocclusion in Swedish schoolchildren. Scandinavian Journal of Dental Research 81: 12-21
Thilander B, Pena L, Infante C, Parada S S, de Mayorga C 2001 Prevalence of malocclusion and orthodontic treatment need in children and adolescents in Bogota, Colombia. An epidemiological study related to different stages of dental development. European Journal of Orthodontics 23: 153-167
Thylstrup A, Fejerskov O 1994 Textbook of clinical cariology (2nd edn.). Munksgaard, Copenhagen
Walther D P, Houston W J B, Jones M L, Oliver R G 1994 Walther and Houston's orthodontic notes (5th edn.). Wright, Oxford
World Health Organization 1997 Oral health surveys: basic methods. World Health Organization, Geneva
World Health Organization 1999 Oral health surveys: basic methods (4th edn.). World Health
Organization, Geneva

25
Table 1 Percentage (%) distribution of malocclusion in children and adolescents in different ethnic groups. Authors Population Subjects Registration %
n Age
Thilander and Myrberg
(1973)
Swedish 5459 13 Björk et al. (1964) 73.8
al-Emran et al. (1990) Saudi Arabian 500 14 Björk et al. (1964) 62.4
Kerosuo et al. (1991) Finnish 458 12-18 Angle classification 88
Kerosuo et al. (1991) Tanzanian 642 11-18 Angle classification 45
Lew et al. (1993) Chinese 1050 12-14 Foster and Day
(1974)
92.9
Ng’ang’a et al. (1996) Kenyan 919 13-15 Björk et al. (1964) 72
Silva and Kang (2001) American-Latino 507 12-18 Angle classification 93
Thilander et al. (2001) Colombian 1441 13-17 Björk et al. (1964) 88
Mugonzibwa et al.
(2004)
Tanzanian 869 3½-16 Björk et al. (1964) Up to
51
Onyeaso (2004) Nigerian 636 12-17 Angle
Classification
76
Abu Alhaija et al.
(2005)
Jordanian 1003 13-15 Björk et al. (1964) 92
Behbehani et al. (2005) Kuwaiti 1299 13-14 Angle classification 86
Ciuffolo et al. (2005) Italian 810 11-14 Criteria by US
National Health and
Nutrition
Examination
Survey
93
Gábris et al. (2006) Hungarian 483 16-18 Dental Aesthetic
Index
70.4
Rwakatema et al. (2006) Tanzanian 289 12-15 Björk et al. (1964) 97.6
Dhar et al. (2007) Indian 812 11-14 WHO oral health
assessment (1999)
38.9

26
Table 2 Distribution of socio-demographic characteristics, Decayed Missing and Filled
Teeth-, Oral Hygiene Index Simplified- status and sucking habits in Kinondoni and Temeke
districts.
Variables Categories Kinondoni
% (n)
Temeke
% (n)
p-value
Gender Male
Female
41.1 (412)
58.9 (591)
36.8 (220)
63.2 (378)
0.050
Age 12 yrs
13 yrs
14 yrs
26.1 (262)
41.9 (420)
32.0 (321)
23.9 (143)
48.5 (290)
27.6 (165)
0.033
Parental
education
Both low
One low/one high
Both high
38.5 (210)
24.2 (132)
37.2 (203)
53.8 (149)
20.9 (58)
25.3 (70)
< 0.001
Place of residence Urban
Rural
63.5 (637)
36.5 (366)
82.3 (492)
17.7 (106)
< 0.001
DMFT 0
≥ 1
78.3 (785)
21.7 (218)
77.6 (464)
22.4 (134)
0.399
OHI-S score Good
Fair/poor
68.0 (682)
32.0 (321)
61.9 (370)
38.1 (228)
0.007
Sucking habit no
yes
88.5 (888)
11.5 (115)
86.8 (519)
13.2 (79)
0.301

27
Table 3 Percentages (%) and number (n) of occlusal and space characteristics in Tanzanian
schoolchildren according to district and gender.
District Gender
Kinondoni
% (n)
Temeke
% (n)
Boys
% (n)
Girls
% (n)
Total
% (n)
Occlusal
Sagittal
Molar relationship
Class I 93.8 (855) 93.2 (511) 93.4 (539) 93.7 (827) 93.6 (1366)
Class II 3.8 (35) 5.5 (30) 4.3 (25) 4.5 (40) 4.4 (65)
Class III 2.4 (22) 1.3 (7) 2.3 (13) 1.8 (16) 2.0 (29)
Maxillary overjet
1-4.9 mm 76.4 (766) ** 68.2 (408) 75 (474) 72.2 (700) 73.3 (1174)
5-8.9 mm
≥9 mm
11.1 (111)
0.2 (2)
11.2 (67)
0.8 (5)
11.2 (71)
0.6 (4)
11.0 (107)
0.3 (3)
11.1 (178)
0.4 (7)
Mandibular overjet
0-1.9 mm
≥2 mm
8.8 (88)
0.1 (1)
7.2 (43)
0.5 (3)
9.5 (60)
0.3 (2)
7.3 (71)
0.2 (2)
8.2 (131)
0.2 (4)
Vertical
Overbite
0.1-2.9 mm
3-4.9 mm
≥ 5mm
65.4 (656)
21.1 (212) **
0.9 (9)
66.7 (399)
12.5 (75)
1.0 (6)
66.9 (423)
19.0 (120)
0.9 (6)
65.2 (632)
17.2 (167)
0.9 (9)
65.9 (1055)
17.9 (287)
0.9 (15)
Open bite
0-1.9 mm
≥ 2 mm
Lateral open bite
7.4 (74) **
4.8 (48)
1.0 (10)
11.5 (69)
8.2 (49)
1.2 (7)
6.3 (40) *
6.0 (38)
1.3 (8)
10.6 (103)
6.1 (59)
0.9 (9)
8.9 (143)
6.1 (97)
1.1 (17)
Transversal
Absent 82.0 (823) 78.0 (467) 79.3 (501) 81.4 (789) 80.6 (1290)
Crossbite 4.4 (44) 6.4 (38) 4.7 (30) 5.4 (52) 5.1 (82)
Scissor bite 13.6 (136) 15.6 (93) 16.0 (101) 13.2 (128) 14.3 (229)
Midline shift
Absent (< 2 mm) 80.4 (806) 72.6 (434) 75.9 (480) 78.4 (760) 77.5 (1240)
≥ 2 mm 19.6 (197) ** 27.4 (164) 24.1 (152) 21.6 (209) 22.5 (361)
Space
Absent (± 2 mm) 60.8 (610) 69.4 (415) 60.9 (385) 66.1 (640) 64.0 (1025)
Crowding (≥2 mm) 15.1 (151) 12.4 (74) 15.7 (99) 13.0 (126) 14.1 (225)
Spacing (≥ 2 mm) 24.1(242) ** 18.2 (109) 23.4 (148) 20.9 (203) 21.9 (351)
*p<0.05, **p<0.001

28
Table 4 Percentages (%) and number (n) of schoolchildren with malocclusion according to district, dental caries and oral hygiene status. Logistic
regression, odds ratios (OR) and 95 pecent confidence intervals (CI). Adjusted for age, gender, parental educational status and urban /rural
residency.
Sum score of malocclusion > 0
Midline shift present Angle Class II and III Open bite present
% (n) Adjusted OR
% (n) Adjusted OR % (n) Adjusted OR % (n) Adjusted OR
(95% CI)
(95% CI) (95% CI) (95% CI)
District: Kinondoni Temeke
62.6 (549)
66.0 (316)
1
1.3 (0.9-1.8)
19.6 (197)
27.4 (164)**
1
1.3 (0.9-1.9)
6.3 (57)
6.8 (37)
1
0.9 (0.5-1.7)
13.2 (132)
20.9 (125)**
1
1.8 (1.2-2.7)
Decayed Missing and
Filled Teeth = 0
62.1 (667) 1 20.2 (252) 1 5.6 (70) 1 14.4 (180) 1
Decayed Missing and
Filled Teeth > 0
70.2 (198)* 1.7 (1.1-2.6) 31.0 (109)** 2.1 (1.5-3.2) 11.4 (24)** 2.4 (1.3-4.6) 21.9 (77)** 1.7 (1.1-2.6)
Simplified Oral Hygiene
Index score = 0
62.9 (562) 1 22.6 (238) 1 6.1 (58) 1 15.6 (164) 1
Simplified Oral Hygiene
Index score > 0
65.4 (303) 0.8 (0.6-1.2) 22.4 (123) 0.6 (0.4-0.9) 7.2 (36) 1.3 (0.7-2.3) 16.9 (93) 1.1 (0.8-1.7)
*p<0.05, **p<0.001

29
Figure 1 Map of Tanzania showing Kinondoni and Temeke districts of the Dar es Salaam region.
Figure 2 Percentage of schoolchildren according to number of anomalies.
36.233
21.5
6.82.3 0.2
100
0
20
40
60
80
100
Subjects (%)
0 1 2 3 4 5 Total
Number of anomalies


Paper II

BioMed Central
Health and Quality of Life Outcomes
ss
Open AcceResearchApplicability of an abbreviated version of the Child-OIDP inventory among primary schoolchildren in TanzaniaMatilda Mtaya*1,2,3, Anne N Åstrøm1,3 and Georgios Tsakos4Address: 1Centre for international health, UoB, Bergen, Norway, 2Department of Preventive and Community Dentistry, Muhimbili University College of Health Sciences, Dar es Salaam, Tanzania, 3Department of Odontology-Community Dentistry, UoB, Bergen, Norway and 4Department of Epidemiology and Public Health, University College of London Medical School, London, UK
Email: Matilda Mtaya* - [email protected]; Anne N Åstrøm - [email protected]; Georgios Tsakos - [email protected]
* Corresponding author
AbstractBackground: There is a need for studies evaluating oral health related quality of life (OHRQoL)of children in developing countries.
Aim: to assess the psychometric properties, prevalence and perceived causes of the child versionof oral impact on daily performance inventory (Child-OIDP) among school children in two socio-demographically different districts of Tanzania. Socio-behavioral and clinical correlates of children'sOHRQoL were also investigated.
Method: One thousand six hundred and one children (mean age 13 yr, 60.5% girls) attending 16(urban and rural) primary schools in Kinondoni and Temeke districts completed a surveyinstrument in face to face interviews and participated in a full mouth clinical examination. Thesurvey instrument was designed to measure a Kiswahili translated and culturally adapted Child-OIDP frequency score, global oral health indicators and socio-demographic factors.
Results: The Kiswahili version of the Child-OIDP inventory preserved the overall concept of theoriginal English version and revealed good reliability in terms of Cronbach's alpha coefficient of 0.77(Kinondoni: 0.62, Temeke: 0.76). Weighted Kappa scores from a test-retest were 1.0 and 0.8 inKinondoni and Temeke, respectively. Validity was supported in that the OIDP scores variedsystematically and in the expected direction with self-reported oral health measures and socio-behavioral indicators. Confirmatory factor analyses, CFA, confirmed three dimensions identifiedinitially by Principle Component Analysis within the OIDP item pool. A total of 28.6% of theparticipants had at least one oral impact. The area specific rates for Kinondoni and Temeke were18.5% and 45.5%. The most frequently reported impacts were problems eating and cleaning teeth,and the most frequently reported cause of impacts were toothache, ulcer in mouth and position ofteeth.
Conclusion: This study showed that the Kiswahili version of the Child-OIDP was applicable foruse among schoolchildren in Tanzania.
Published: 13 July 2007
Health and Quality of Life Outcomes 2007, 5:40 doi:10.1186/1477-7525-5-40
Received: 27 March 2007Accepted: 13 July 2007
This article is available from: http://www.hqlo.com/content/5/1/40
© 2007 Mtaya et al; licensee BioMed Central Ltd. This is an Open Access article distributed under the terms of the Creative Commons Attribution License (http://creativecommons.org/licenses/by/2.0), which permits unrestricted use, distribution, and reproduction in any medium, provided the original work is properly cited.
Page 1 of 11(page number not for citation purposes)

Health and Quality of Life Outcomes 2007, 5:40 http://www.hqlo.com/content/5/1/40
BackgroundEmerging consensus in the literature has identified oralhealth related quality of life (OHRQoL) as a multidimen-sional construct containing physical, social and psycho-logical domains [1]. Over the years several socio-dentalindicators have been developed, ranging from single itemindicators to composite inventories or scoring systems,covering the aforementioned OHRQoL domains [2]. Theindices are requested to be simple to use, reliable, valid,precise, acceptable, amenable to statistical analysis, corre-spond to decision making criteria and to be supported bya relevant theoretical model [3].
Although a number of indices have been developed andtested in population-based studies and studies of patientswith specific disorders, most research has been carried outon adults in industrialized countries [4-6]. Yet, there is alack of OHRQoL measures designed for children and fewattempts have been made to evaluate OHRQoL and itsdeterminants in the child populations of non-industrial-ized countries [7-11]. This is notable, considering thatoral disorders are numerous in children globally andlikely to affect their quality of life negatively [7].Untreated dental caries might lead to dental pain which inturn results in impacts of affected play and sleep, avoid-ance of certain types of food and decreased school per-formance [12]. Children who have poor oral health havebeen reported to be 12 times more likely to have restrictedactivity days than those who do not [12]. A review of stud-ies considering children's self-reported dental painrevealed prevalence rates of 68% in 12-year-old Indians,42% in 10–14 year-old Ugandans and 21% among 0–18-year-olds in Kenya [13].
Numerous methodological and conceptual problems areinvolved when developing health related quality of lifemeasures for children; as such measures have to take intoconsideration distinct changes in the growing child [14].Most of the changes related to growth may affect the childand therefore the oral health related quality of life meas-ures may have to be age specific. Recently, it has been rec-ognized that using appropriate questionnaire techniques,children can give valid and reliable information and thusshould be the primary source of information regardingtheir OHRQoL [7,15,16]. Two instruments have beendeveloped to measure OHRQoL in younger age groups,namely the Child Perception Questionnaire assessingsymptoms, functional limitations and well being in 6–10-year- and 11–14-year-olds and the Child version of theOral Impacts on Daily Performance (OIDP) inventory[7,8,15,17]. The Child-OIDP, which has been derivedfrom the OIDP [5,18], was developed and tested amongThai school children aged 11–12 yr [7,8]. It has beenfound to be a reliable and valid instrument when appliedto children in Thailand, France and UK [7,8,19,20]. How-
ever, further evaluation of its performance across coun-tries and age groups has been requested. As with the adultOIDP, the Child-OIDP measures oral impacts that seri-ously affect the person's daily life. It is based on the con-ceptual framework of the World Health Organisation'sInternational Classification of Impairments, Disabilitiesand Handicaps, ICIDH [21], which has been amended fordentistry by Locker [22]. The OIDP concentrates only ondisability and handicap, thus demonstrating strong theo-retical coherence and reduced possibility of double scor-ing of the same oral impacts at different levels [5,18].Considering respondent burden, the OIDP (and theChild-OIDP) is suitable for use in population surveys, notonly in terms of being easier when measuring behavioursrather than feeling states, but also in being short. In orderto suit children's cognitive development, the Child-OIDPdeviates from the OIDP with respect to the sequence ofquestions, having a shorter recall period in terms of 3months instead of 6 months and with pictures used asinterviews guide [7]. Since the Tanzanian oral health pol-icy gives priority to children as a target group for oralhealth care services [23], the Child-OIDP questionnaire isworthy consideration because of its adaptation for use inoral health care needs assessment making it useful forplanning services. The original OIDP inventory has previ-ously been translated into Kiswahili and found to beapplicable to young adults and older people in Tanzaniawhilst administered as self-performed questionnaires andin face to face interviews [24,25].
The aim of this study was to assess validity, reliability andprevalence estimates of a Kiswahili translated version ofthe Child-OIDP frequency inventory for use in primaryschoolchildren emanating from two socio-economicallydifferent districts in Tanzania.
MethodsStudy areaA cross sectional survey was conducted in Dar es Salaam,the commercial capital and major sea port of Tanzania,from November 2005 to June 2006. Dar es Salaam is themost densely populated and socially and culturally heter-ogenic city in Tanzania. According to the 2002 populationand house survey in Tanzania, Dar es Salaam has a totalpopulation of 2.5 million and population density of1,793 per square km. Dar es Salaam is divided into threedistricts; Kinondoni, Ilala and Temeke with total popula-tion sizes of 1.083,913, 634,924 and 768,451 peoplerespectively. All districts have drinking water with fluoridecontent of about 1 mg fluoride/L (1 ppm). Kinondoni andTemeke are quite diverse districts in terms of their socio-demographic profile, with the former having higheremployment rates, literacy rates and proportions of thepopulation using the most expensive form, electricity, astheir main source of energy for cooking [26].
Page 2 of 11(page number not for citation purposes)

Health and Quality of Life Outcomes 2007, 5:40 http://www.hqlo.com/content/5/1/40
SamplingThe study population comprised of children attendingstandard 7 in public primary schools. A stratified propor-tionate two-stage cluster sampling design with public pri-mary schools as the primary sampling unit was utilized.To obtain a sample of schoolchildren of mixed socio-eco-nomic background, schools were selected at random fromurban and rural areas in the Kinondoni and Temeke dis-tricts in Dar es Salaam. Overall, 43 rural- (N = 4,809standard 7 pupils) and 78 urban primary schools (N =14.725 standard 7 pupils) were listed in Kinondoni. Thecorresponding number of schools in Temeke were 22rural (N = 1707 standard 7 pupils) and 77 urban (N =14103 standard 7 pupils) schools. A sample size of 1200school children aged 12–14 yr was calculated to be satis-factory for two sided tests, assuming the prevalence of oralimpacts to be 0.40 and 0.50 in children with and withoutcaries experience, a significance level of 5%, power of 90%and a design factor of 2 [27]. At the first stage, 4 rural (4/43 n = 755 standard 7 pupils) and 6 urban (6/77, n = 1157standard 7 pupils) schools in Kinondoni and 1 rural (1/22 n = 184 standard 7 pupils) and 5 urban (5/78, n = 949standard 7 pupils) schools in Temeke were selected by sys-tematic random sampling using a unified sampling frac-tion. From a total of 3045 standard 7 pupils available inthe selected schools, about 100 students in each selectedschool (i.e. 1601 students constituting 52.6% of all stand-ard 7 students in the selected schools) and fulfilling theinclusion criteria of being in the defined age range of 12–14 yr were randomly selected from the accessible classes.Only consenting subjects were included in the study andnone of the students invited for participation were ill, hada history of psychiatric problems or were disabled. Ethicalclearance was obtained from all relevant persons, author-ities and committees in Tanzania. These included writtenpermission and clearance for the study from the Researchand Publication Committee of the Muhimbili UniversityCollege of Health Sciences (MUCHS). Permission to workwith school children was obtained from Kinondoni andTemeke municipalities, their respective educationalauthorities, schools administrations, parents and chil-dren.
Translation and adaptation of the Child-OIDP inventoryA structured interview schedule, including the 8 itemChild-OIDP inventory was translated from English intoKiswahili, the language of instruction in all Tanzanianpublic primary schools, by three professionals fluent inKiswahili and English and back-translated into English bytwo independent translators. A group of dental profes-sionals reviewed the Kiswahili version of the question-naire for semantic, experiential and conceptualequivalence with the source version. Sensitivity to cultureand selection of appropriate words were considered. Theinventory was subsequently discussed and compared with
de novo oral impacts on daily performances identified in afocused group interview with 10 primary school children.No modifications to scale content and wording weremade and the questionnaire was finally pilot tested in anew convenience sample of 63 primary schoolchildren.This confirmed the feasibility of the methodology andhelped to determine the time necessary for completion ofthe interview (about 5–7 minutes). It also led to the deci-sion to avoid pictures as interview guides as well as theseverity scales for logistic-, time sparing- and simplicityreasons. In accordance with previous studies that haveapplied the Child-OIDP inventory [7,8,19], the partici-pants of this study were able to respond to the questionswithout the aid of pictures and had no difficulty under-standing both the content of the questionnaire and anyspecific words in particular.
Interview variablesThe children completed the Kiswahili version of theChild-OIDP frequency questionnaire at school in face toface interviews administered by two trained researchassistants before the clinical examination. The interviewstarted with the children reviewing common oral prob-lems and tick off whether they had experienced them dur-ing the previous 3 months [7,8]. The Child-OIDPfrequency index referred to difficulty carrying out eightdaily life activities namely eating, speaking, cleaningmouth, sleeping, smiling, school work, emotion andsocial contact each scored 0–3 where (0) never, (1) onceor twice a month, (2) once or twice a week, (3) very day/nearly every day [7,8]. Participants were also asked toidentify the oral condition that caused the specific impactsby answering for each reported item (1) yes or (0) no tothe following alternatives: "toothache, sensitive teeth,tooth exfoliation, problems with position of teeth, ulcerin mouth, bleeding in mouth, swollen gums, bad breath,problems with colour of teeth, problems with spaces ofteeth, other problems". The total Child-OIDP score wasconstructed in two ways. First, by adding the 8 perform-ance scores as originally scored (0–3) into a Child-OIDPadditive score (ADD) (range 0–24). Second, the Child-OIDP simple count (SC) score (range 0–8) was con-structed by summing the dichotomized frequency itemsof (1) affected and (0) not affected.
The predictor variables and the number of subjectsaccording to categories are summarized in Table 1. Socio-demographics were assessed in terms of place of residence(urban/rural), district (Kinondoni/Temeke), gender, ageand parental education. A group variable on parental edu-cation was constructed from two dummy variables (0/1)on father's and mother's highest level of education. Selfreported oral health status, satisfaction with teeth/mouthand self rated health status were coded on 4-point Likertscales and recoded further into dummy variables in terms
Page 3 of 11(page number not for citation purposes)

Health and Quality of Life Outcomes 2007, 5:40 http://www.hqlo.com/content/5/1/40
of (0) good/satisfied and (1) bad/dissatisfied. Overall sat-isfaction with teeth was constructed as a sum variablefrom 4 variables (satisfaction with mouth/teeth, positionof teeth, appearance and colour of teeth) and dichot-omized for use in cross tabulation and logistic regressionanalysis. Frequency sugar intake was made up by a sumscore of items assessing the frequency intake of biscuits,chocolate/toffee/sweets, ice cream, soda, and sugared fruitjuice. Each item originally assessed on a scale rangingfrom (1) more than once a day to (4) seldom or never wasdichotomized into (1) (categories 1,2) and (0) (categories3,4); then, the scores of those derived variables were againsummed and dichotomized. Dental attendance was con-structed into two Yes (1) and No (0) variables originallyscored from (1) attended more than 3 times to (5) neverattended. Sucking behaviour, including finger, lip tonguesucking was scored as Yes (1) and No (2) variables.
Clinical ExaminationOne trained and calibrated dentist (MM) conducted allclinical examinations in the classroom setting with natu-ral daylight as the source of illumination and with anassistant recording the observations. Participants identi-fied with problems that needed treatment were referred oradvised to seek treatment at the two municipal hospital ofKinondoni and Temeke districts and oral health educa-tion sessions were provided. Caries experience wasassessed in accordance with the WHO criteria [28]. Oralhygiene was assessed using the simplified-Oral HygieneIndex (OHI-S) [29]. Duplicate clinical examinations werecarried out on a randomly selected sub-sample of 71 par-ticipants considered to be representative of the study sub-jects. Analyses performed on the duplicate examinationrecordings gave kappa statistics of 0.93 and 0.74 for theDMFT- and OHI-S scores, respectively. These figures indi-cate very good intra-examiner reliability [28].
Statistical analysesTest-retest reliability for the clinical parameters and thequestionnaire variables was assessed using Cohen'sweighted kappa statistics with an independent conven-ience sample of 60 12–14-year-olds and a time interval of1.5 weeks. Internal consistency reliability was assessed inthe main sample using Cronbach's alpha [30]. Constructvalidity was determined by comparing OIDP scores ofgroups that differ regarding subjective measures of healthstatus. Furthermore, differences in Child-OIDP were alsoassessed between groups according to socio-economic-,clinical and behavioral characteristics. Construct validitywas also evaluated using exploratory factor analysis, EFA(i.e. Principle Component Analysis with Varimax rota-tion) with the independent sample constituting the test-retest group- and confirmative factor analysis, CFA withthe main sample. The parameters of CFA were estimatedwith maximum likelihood estimation (ML) and boot-
strapping advocated for non-normally distributed varia-bles [31]. Bias corrected 90% CI (SE/BC 90% CI) wasreported for the estimates. Adequacy of the model fit wasassessed using chi-square statistics, the Goodness of Fitindex (GFI), the Incremental Fit Index (IFI), the NormedFit Index (NFI) and the Comparative Fit Index [31]. Cross-tabulation and chi-square statistics were used to assessbivariate relationships. Multivariate analysis was done byLogistic regression. For the purpose of cross tabulationand logistic regression analysis the OIDPSC score (0–8)was dichotomized as 0/1+, producing the categories (0)"no daily performance affected" and (1) "at least one dailyperformance affected". The distribution of the OIDPSCscores supported this cut-off point. Data were analyzedusing SPSS version 14.0 and AMOS 6.0. To adjust for theeffect of the cluster design, data were reanalysed usingSTATA 9.0 with survey command. P-value for statisticalsignificance was set at 0.05.
ResultsSample profileA total of 1003 children from Kinondoni (63.5% urban,58.9% girls, mean age 13.1 yr) and 598 children fromTemeke (82.3% urban, 63.2% girls, mean age 13.0 yr)completed an extensive personal interview and under-went a full mouth clinical examination. The mean DMFTscores were 0.37 (sd = 0.86) and 0.39 (sd = 0.84) inKinondoni and Temeke, respectively. Correspondingscores concerning OHI-S were 1.0 (sd = 0.53, range 0.0–3.3) and 1.2 (sd = 0.54, range 0.0–4.2). Table 1 providesthe percentage distribution of participants' socio-demo-graphic-, clinical-, perceived oral health- and behavioralcharacteristics in the total sample and according to districtof residence.
Reliability and validity of the Child-OIDPAll the participating subjects completed the Child-OIDPfrequency inventory providing support to its face validity.Internal consistency reliability (standardized item alpha)was .77 (.62 in Kinondoni, .76 in Temeke). The inter itemcorrelations ranged from 0.05 (speaking/carrying outmajor work) to 0.79 (speaking/contact with people). Thecorrected item total correlation (i.e. the correlationbetween each item and the total score omitted for thatitem) ranged from .21 (carrying out major work) to .69(contact with people) being above the minimum level of0.20 for including an item into a scale [30]. The Cron-bach's alpha decreased when any one item was deletedfrom the scale except for the items of emotion and school-work. Test-retest reliability of the 8 categorical Child-OIDP items in terms of weighted Cohen's kappa were 0.7(emotional state), 0.8 (carrying out major schoolwork)whereas eating, speaking, cleaning teeth, sleeping, smilingand social contact showed a kappa value of 1.00.Weighted Cohen's kappa for the categorical Child-
Page 4 of 11(page number not for citation purposes)

Health and Quality of Life Outcomes 2007, 5:40 http://www.hqlo.com/content/5/1/40
OIDPSC scores were 0.91 (1.0 in Kinondoni and 0.83 inTemeke) and intraclass correlation coefficient for Child-OIDPADD scores were 0.98.
Construct validity was demonstrated in that the Child-OIDP scores increased as the children's self-reported oralhealth-, general health-, dental appearance- and oralproblems status changed from healthy to unhealthy. Thiswas evident with Chi-square test in cross-tabulation anal-yses and with Mann Whitney U test using the Child-OIDPSC and the Child-OIDP ADD scores, respectively (Table2). Children that were not satisfied with their oral healthand rated their teeth status as bad had mean Child-OIDPADD score at least twice as high as that of children whofelt satisfied and rated their teeth status to be good (Table2). The Child-OIDP SC and the Child-OIDP ADD scoresalso varied with socio-demographic variables (Table 3).
By examining the relationship between Child-OIDP SCand clinical and non-clinical variables in a single regres-sion model, possible confounding due to strong associa-tions between the explanatory variables was taken intoconsideration (Table 4). Socio-demographic and behavio-ral variables were entered in the first step with model sum-mary in terms of Nagelkerkes R2 = .147 and with all
variables being statistically significantly associated withChild-OIDP. By entering the DMFT and OHI-S status instep 2, the model summary increased to Nagelkerkes R2 =.152. Variables on self-reported oral health entered in step3 raised the model summary to Nagelkerkes R2 = .301. Inthe final model (Model Chi Square = 377.006, df = 14, p= 0.001), district of residence (Kinondoni/Temeke), areaof residence (urban/rural) and reported satisfaction withoral health, status of teeth, status of health and reportednumber of oral problems remained highly statistically sig-nificant predictors with odds ratios of 4.8, 1.6, 1.9, 3.1,1.8 and 3.9, respectively. Interactions between district andDMFT status (B = -0.704, p = 0.016) and between districtsand sugar frequency intake (B = -0.780, p = 0.005) uponChild-OIDP scores were revealed indicating that the ten-dency of children with caries experience and frequentsugar intake to be more likely than their counterpartswithout those characteristics to report any oral impact(Child-OIDP > 0) was evident in Kinondoni but not inTemeke district.
EFA gave 3 factors with eigenvalue greater than 1. The fac-tors accounted for 71.7% of the Child-OIDP variables.Factor 1 consisted of "speaking" "smiling" and "socialcontact" (loading higher than 0.4), Factor 2 consisted of
Table 1: Frequency distribution of independent variables and their categories according to district
Variables Categories Kinondoni % (n) Temeke %(n) p-value
Sex Male 41.1 (412) 36.8 (220) P = 0.050Female 58.9 (591) 63.2 (378)
Age 12 Yrs 26.1 (262) 23.9 (143) P = 0.03313 yrs 41.9 (420) 48.5 (290)14 yrs 32.0 (321) 27.6 (165)
Parental education Both low 38.5 (210) 53.8 (149) P = 0.000One low/one high 24.2 (132) 20.9 (58)Both high 37.2 (203) 25.3 (70)
Place of residence: Urban 63.5 (637) 82.3 (492) P = 0.000Rural 36.5 (366) 17.7 (106)
DMFT 0 78.3 (785) 77.6 (464) P = 0.399> 1 21.7 (218) 22.4 (134)
OHIS Debris score Good 68.0 (682) 61.9 (370) P = 0.007Fair/poor 32.0 (321) 38.1 (228)
Overall satisfaction Satisfied 87.8 (881) 90.1 (539) P = 0.092with oral health Dissatisfied 12.2 (122) 9.9 (59)State of teeth Good 84.8 (851) 91.6 (548) P = 0.000
Bad 15.2 (152) 8.4 (50)State of health Good 93.2 (935) 96.5 (577) P = 0.003
Bad 6.8 (68) 3.5 (21)Oral problems None 43.3 (434) 30.1 (180) P = 0.000
≥1 56.7 (569) 69.9 (418)Finger sucking No 70.6 (708) 66.1 (395) P = 0.033
Yes 29.4 (295) 33.9 (203)Dental attendance No 86.8 (871) 80.9 (484) P = 0.001
Yes 13.2 (132) 19.1 (114)Sugar intake 0–1 item 35.3 (354) 36.5 (218) P = 0.339
> 1 items 64.7 (649) 63.5 (380)
Page 5 of 11(page number not for citation purposes)

Health and Quality of Life Outcomes 2007, 5:40 http://www.hqlo.com/content/5/1/40
"eating" and "cleaning" (loading above 0.4) and Factor 3consisted of "emotion" and "schoolwork", all with factorloadings above 0.4. "Sleeping" loaded highly (loading0.5) on both Factor 2 and 3. CFA was then used to test thehypothesized 3-factor (social function, physical function,psychological function) model identified from the EFAwhich is consistent with previous experience [32]. Thefour indices from CFA indicated acceptable fit of themodel with the data in terms of GFI (0.96), AGFI (0.93).
NFI (0.95) and CFI (0.96). However, the Chi -square wasstatistically significant (Chi-square = 221.137 (17), p <0.001) and the RMSEA (0.08) a bit below the optimallevel of 0.05 indicating a mediocre fit. The amount of var-iance (R2) accounted for was 26% (.012/0.24–0.28), 32%(.03/0.28–0.37) and 4% (0.04/0.03–0.05) by the social(speaking, smiling, contact with people), functional/physical (eating, cleaning) and psychological (emotion,schoolwork, sleeping) dimensions, respectively. The
Table 2: The Child-OIDP scores and self-reported and clinically assessed variables. Percent of children with Child-OIDP > 0 and mean Child-OIDP scores with differences in mean rank, DMR, (Mann Whitney U test).
Self rated oral health % Child OIDPSC > 0 Mean (SD) Child OIDP ADD scores DMR
Overall satisfaction with teethSatisfied 26.0 (369) 1.0 (2.5)Dissatisfied 49.2 (89)** 2.4 (3.8)** 91.1State of teethGood 25.1 (351) 1.0 (2.6)Bad 53 (107)** 2.3 (3.4)** 120.5State of general healthGood 27.6 (417) 1.1 (2.7)Bad 46.1 (41)** 1.9 (3.3)** 38.0Reported oral problemsNo problem 11.6 (71) 0.4 (1.7)≥1 problems 39.2 (387)** 1.6 (3.1)** 256.2DMFTDMFT = 0 26.7 (333) 1.1 (2.6)DMFT > 0 35.5 (125)* 1.5 (3.1)** 59.5Oral Hygiene scoreGood 27.3 (287) 1.1 (2.7)Fair/poor 31.1 (171)ns 1.2 (2.8) ns 34.1
**p < 0.001, *p < 0.05
Table 3: The Child OIDP and socio-demographic and behavioral variables. Percent of children with OIDP > 0 and mean OIDP scores with differences in mean rank (Mann Whitney U test).
Socio-behavioral variables % OIDP > 0 Mean (SD) OIDP ADD scores DMR
Place of residenceUrban 28.3 (319) 1.1 (2.7)Rural 29.4 (139)ns 1.2 (2.7) ns 9.7Age12 yrs 24.0 (97) 1.1 (2.8)13 yrs 30.8 (219) 1.2 (2.5)14 yrs 29.2 (142)* 1.3 (2.9) ns 37.6DistrictKinondoni 18.5 (186) 0.4 (1.2)Temeke 45.5 (272)** 2.3 (3.9)** 247.1Finger suckingNo 25.8 (285) 1.0 (2.7)Yes 34.7 (173)** 1.4 (2.9)** 74.8Dental attendanceNo 26.5 (359) 1.1 (2.6) 70.1Yes 40.2 (99)** 1.8 (3.4)**Sugar intake0–1 item 25.2 (144) 1.1 (2.9)> 1 items 30.5 (314)* 1.2 (2.6)* 48.1
** p < 0.001. *p < 0.05
Page 6 of 11(page number not for citation purposes)

Health and Quality of Life Outcomes 2007, 5:40 http://www.hqlo.com/content/5/1/40
present model appeared to provide the "best" descriptionof the Child-OIDP data in this study when compared witha 2-factor and a 1-factor model.
Child-OIDP prevalence and the perceived causes of oral impactsThe most common oral problems in both districts initiallylisted by the schoolchildren were toothache (Kinondoni:18.7%, Temeke: 24.1%), having ulcer in the mouth(Kinondoni: 15.7%, Temeke: 26.6%), bleeding (Kinon-doni: 15.4%, Temeke: 17.4%) and swollen gums (Kinon-doni: 18.1%, Temeke 21.4%). The mean Child-OIDPADD scores for the total sample showed limited variabil-ity with a mean of 1.2 (sd= 2.8). Overall, a total of 28.6%(95% CI: 26.6, 30.6) had at least one oral impact. As canbe seen from Table 5, the prevalence of oral impacts wasmoderate in Kinondoni (18.5%; 95% CI: 16.5, 20.5) butrelatively high in Temeke (45.5%; 95% CI: 42.5, 48.5).Impacts on eating were the most prevalent reportedimpairment in Temeke (35.3%), followed by cleaningteeth (26.9%) and smiling without embarrassment(13.0%). The corresponding figures in Kinondoni were
eating (13.3%) and cleaning teeth (8.6%), with all otheractivities showing very low levels of oral impacts. Impactson emotion and school work were the least frequentlyreported impacts in both districts. As shown in Figure 1,toothache was the most frequently perceived cause ofimpairments for almost all performances particularly inKinondoni. In Temeke, the majority of impacts on speak-ing and smiling were attributed to bad breath, colour ofteeth and position of teeth. Swollen gums, bad breath andbleeding in mouth were frequently perceived causes ofimpairments in both districts.
DiscussionThe present study is the first large population based surveyabout OHRQoL covering schoolchildren in Tanzania.Comparison of the sample characteristics with the Kinon-doni and Temeke child populations on the markers of sexand parental education suggest that the sample was repre-sentative of the population of children aged 12–14 yr inthose districts. When administered in face to face inter-views, the Kiswahili version of the inventory showed goodreliability and validity in 12–14-year-old schoolchildren,
Table 4: Unadjusted and adjusted odds ratios and 95% confidence interval (CI) of having at least one oral impact on daily performances (OIDP = 1) according to non-clinical and clinical variables.
Unadjusted OR (95% CI) Adjusted OR (95% CI) p-value
Step 1
District: Kinondoni 1 1 P = 0.001Temeke 3.6 (2.9–4.5) 4.8 (3.6–6.2)
Area: Urban 1 1 P = 0.001Rural 1.0 (0.8–1.3) 1.6 (1.2–2.2)
Sex: Male 1 1 P = 0.736Female 0.9 (0.7–1.1) 0.9 (0.7–1.2)
Age: 12 yrs 1 1 P = 0.05213 yrs 1.4 (1.1–1.8) 1.3 (1.0–1.7)14 yrs 1.3 (0.9–1.7) 1.2 (0.9–1.7)
Finger/lip sucking: no 1 1 P = 0.093yes 1.5 (1.2–1.9) 1.2 (0.9–1.6)
Sugar items: 0–1 1 1 P = 0.207> 1 1.3 (1.0–1.6) 1.2 (0.9–1.5)
Dental attendance: no 1 1 P = 0.062yes 1.8 (1.4–2.7) 1.3 (0.9–1.9)
Step 2DMFT = 0 1 1 P = 0.238DMFT > 0 1.5 (1.2–1.9) 1.2 (0.8–1.6)Step 3OHIS: good 1 1 P = 0.916
fair/poor 1.2 (1.0–1.5) 1.0 (0.7–1.3)Satisfied with oral health 1 1 P = 0.001Dissatisfied with oral health 2.8 (2.0–3.7) 1.9 (1.3–2.8)No oral problem 1 1 P = 0.001≥1 oral problems 4.9 (3.7–6.5) 3.9 (2.9–5.2)State of teeth: good 1 1 P = 0.001
bad 3.3 (2.4–4.5) 3.1 (2.1–4.5)State of health: good 1 1 P = 0.023
bad 2.2 (1.4–3.4) 1.8 (1.1–3.0)
Page 7 of 11(page number not for citation purposes)

Health and Quality of Life Outcomes 2007, 5:40 http://www.hqlo.com/content/5/1/40
Page 8 of 11(page number not for citation purposes)
Perceived oral problems associated with oral impacts in schoolchildren from Kinondoni and Temeke districtsFigure 1Perceived oral problems associated with oral impacts in schoolchildren from Kinondoni and Temeke districts.
TA; 39
TA; 27
TA; 15
TA; 62
TA; 14
TA; 47TA; 54
TA; 25
TA; 36
ST; 7
ST; 18
ST; 5
ST; 5
ST; 8
ST; 5
PT; 4 PT; 14
PT; 11
PT; 4
UM; 17
UM; 9
UM; 3
BM; 5
BM; 23
BM; 4
SG; 15
SG; 9
SG; 22 SG; 3
SG; 10
SG; 5
SG; 8
SG; 8
SG; 10
BB; 18
BB; 8
BB; 17
BB; 5
CT; 5
Eating Speaking Cleaning Sleeping Smiling Emotion Major work Contact Total
TA; 29
TA; 3
TA; 12
TA; 46
TA; 4
TA; 23
TA; 38
TA; 7
TA; 20
ST; 19ST; 6
ST; 3
TE; 13PT; 13 PT; 12
PT; 8 PT; 4
UM; 32
UM; 26
UM; 8 UM; 9
BM; 33
BM; 6
BM; 6
SG; 28
SG; 3
SG; 23
SG; 3
SG; 30
SG; 11
BB; 29BB; 26
BB; 23BB; 10
CT; 28
CT; 24
CT; 8
CT; 8
TE; 3
UM; 3
BM; 3
Abbreviations:TA-Toothache; ST-Sensitive teeth; BM-Bleeding in the mouth; SG-Swollen gums: BB-Badbreath; PT-Position of teeth; CT-Colour of teeth; TE-Tooth exfoliation; UM-Ulcer in themouthNote: Unmarked spaces and causes of impacts not presented in the figure had value <3%
Kinondoni
Temeke

Health and Quality of Life Outcomes 2007, 5:40 http://www.hqlo.com/content/5/1/40
thus indicating its applicability. The internal consistencyreliability was successfully tested in several ways. All inter-item correlations were positive and all corrected item totalcorrelations were above the minimum level of 0.20 for anitem to be included into a scale [30,33]. Cronbach'a alphawas 0.77 which is satisfactory according to the standardsof 0.50 and 0.70 thresholds set by most authors for groupcomparisons [33]. These figures compare in magnitudewith those reported for the Thai-, UK- and French versionof the Child-OIDP inventory [7,8,19,20]. Previous appli-cations of OIDP among adolescents and young adults invarious populations in Africa have yielded higher internalconsistency values ranging from 0.70 to 0.91 [34,35].
All participating children completed the 8 item Child-OIDP inventory adding support to the face validity of itsKiswahili version. There was no indication from the refer-ence groups of academics or from the focus group discus-sions and pilot surveys that the relevance of any of theitems was low in the Tanzanian context. This suggests thatTanzanian schoolchildren were capable of fully under-standing the Kiswahili translated version without alteringthe meaning of the questions and that the Kiswahili andEnglish frequency inventories are comparable. Whereasface and content validity was assessed by a ground up orde novo approach based on qualitative focus group inter-views with the targeted children, hypotheses regarding theconstruct validity were confirmed in that the inventoryvaried systematically and in the expected direction withself-reported oral health indicators. Thus, the Child-OIDPscores indicated lower levels of oral impacts when the self-perceived oral health was better and when no oral prob-lems were recorded.
By examining the relationships between the Child-OIDPscores and clinical-, non clinical and socio-behavioral var-iables in a single regression model, it was possible toobtain a better understanding of their combined effectsand to compare the strength of the influence from each.Consistent with previous findings and with the proposi-
tions derived from the ICIDH conceptual framework [21],the present results suggest that adjacent concepts such asoral health perceptions and reported oral problems werethe strongest predictors of oral impacts. In contrast, theeffects of the more remote concepts of clinical scores ofDMFT- and OHI-S did not remain statistically significantin the multivariate analyses, suggesting that their effectswere mediated through other variables. Previous studiesconducted in Tanzania have shown that the OIDP fre-quency scale is able to discriminate between subjects withand without at least one clinically defined problem, andbetween older adults with complete and reduced numberof posterior occluding support [24,25]. Bivariate associa-tions between the Child-OIDP scores and number ofdecayed primary and permanent teeth were recentlyreported among French children [19].
The more frequent oral impairments reported by childrenalready disadvantaged in terms of being Temeke residentsand from a rural area must have been due to factors asso-ciated with material and social deprivation and could notentirely be attributed to various levels of oral diseases.Although not statistically significant in the multiple logis-tic regression analysis, the present results indicate a clearnegative gradient with respect to dental visiting; the morefrequent this habit, the less favorable the children's oralquality of life. This is consistent with results reported pre-viously [34,35] and suggest that dental attendance may berecognized as a proxy for oral problems among Tanzanianschool children. The results of the CFA confirm the threedimensions structure that the EFA identified namely thesocial-, physical-, and psychological-functional dimen-sions in the Kiswahili version of the Child-OIDP inven-tory. Those dimensions explain, respectively, 26%, 32%and 4% of the variance supporting the relative importanceof the three domains of OHRQoL in this particular con-text. Factor analyses have been used previously with manyother OHRQoL indicators to group their items intodomains of various numbers, whereas some instrumentsconsider OHRQoL as a single construct [32,36,37].
Table 5: Percentage distribution of the eight Oral Impacts on Daily Performance (OIDP) frequency items in the whole sample (n = 1601) and by district of Kinondoni and Temeke.
Child – OIDP performance items All % (n) Kinondoni % (n) Temeke % (n)
Eating 21.5 (344) 13.3 (133) 35.3 (211)Speaking 5.4 (86) 1.1 (11) 12.5 (75)Cleaning teeth 15.4 (247) 8.6 (86) 26.9 (161)Sleeping/relaxing 5.3 (85) 3.7 (37) 8.0 (48)Smiling 6.2 (99) 2.1 (21) 13.0 (78)Emotional 2.0 (32) 1.9 (19) 2.2 (13)School work 1.8 (29) 1.3 (13) 2.7 (16)Enjoying contact with people 5.1 (81) 1.2 (12) 11.5 (69)% with at least one OIDP 28.6 (458) 18.5 (186) 45.5 (272)
Page 9 of 11(page number not for citation purposes)

Health and Quality of Life Outcomes 2007, 5:40 http://www.hqlo.com/content/5/1/40
The Tanzanian Child-OIDP index exhibited marked flooreffects in Kinondoni (81.5%) and Temeke (54.5%) butsufficient discriminative properties suggest that it is suita-ble for detecting group differences in cross-sectional stud-ies. However, a substantial difference between the twodistricts occurred across the 8 aspects of daily living with18.5% and 45.5% of children in Kinondoni and Temekehaving experienced any oral impact during the 3 monthspreceding the survey. The observed prevalence is lowerthan those observed among similar age groups in othercultures [7,8,19], and also lower than those observedbetween older adolescents in Uganda as well as amongTanzanian adults of various ages [24,25,34]. Nevertheless,the prevalence rate of the Child-OIDP in Temeke com-pares with that obtained among UK children using thesame instrument [20]. The higher prevalence of OIDPseen in Temeke as compared to Kinondoni is in line withKinondoni children having a healthier profile generallyboth in terms of better clinical- and subjective oral healthmeasures as well as socio-demographic characteristicssuch as parental education (Table 1). Eating was the mostfrequently reported impairment in both districts, a find-ing that is consistent with those of other populationsusing the adults and child versions of the OIDP instru-ment [6-8,19,20]. Although the prevalence of dental car-ies was low, toothache was recognized as the main causeof 6 out of 8 performances in Kinondoni and the maincause of 4 out of 8 performances evaluated in the Child-OIDP in Temeke where children reported a large range oforal problems as causes of oral impacts.
Further evaluation of the performance of children's OHR-QoL instruments across countries and age groups hasbeen requested. Validation of such instruments at thepopulation level is important since clinical samples due totheir biased nature may give a misleading picture. Furtherstudies should assess its evaluative properties to deter-mine its applicability to support clinical measures in oralhealth care intervention research.
Competing interestsThe author(s) declare that they have no competing inter-ests.
Authors' contributionsMM: Principle investigator, conceived of the study,designed the study, collected data, performed statisticalanalyses and manuscript writing.
ANÅ: Main supervisor, designed study, guided the statisti-cal analyses. She has been actively involved in manuscriptwriting.
GT: He has provided valuable comments on the paper ingeneral and on the OIDP scoring in particular. He hasbeen actively involved in manuscript writing.
All authors read and approved the final manuscript.
AcknowledgementsThis study was financially supported by the Faculty of Dentistry and the Centre for International Health, University of Bergen. The authors would like to acknowledge the Local administrative authorities, the College research and Publication committee of the Muhimbili University College of Health Sciences, Tanzania for giving permission to conduct this study. Thanks to all pupils who volunteered to participate in this study.
References1. Slade GD, Assessing oral health outcomes: Measuring oral health
and quality of life : proceedings of a conference held June 13-14, at the University of North Carolina-Chapel Hill, NorthCarolina. Chapel Hill, N.C. , Department of Dental Ecology, Schoolof Dentistry, University of North Carolina; 1997:IX, 160 s..
2. Slade GD, Strauss RP, Atchison KA, Kressin NR, Locker D, ReisineST: Conference summary: assessing oral health outcomes--measuring health status and quality of life. Community DentHealth 1998, 15(1):3-7.
3. Sheiham A, Spencer J: Health need assessment. In Community OralHealth Edited by: Pine CM. Oxford , Wright; 1997:39-54.
4. Slade GD, Spencer AJ: Development and evaluation of the OralHealth Impact Profile. Community Dent Health 1994, 11(1):3-11.
5. Adulyanon A, Sheiham A: Oral impacts on daily performance. InMeasuring oral health and quality of life Edited by: Slade GD. Chapel Hill, University of North Carolina, Dental Ecology; 1997:151-160.
6. Astrom AN, Haugejorden O, Skaret E, Trovik TA, Klock KS: OralImpacts on Daily Performance in Norwegian adults: validity,reliability and prevalence estimates. Eur J Oral Sci 2005,113(4):289-296.
7. Gherunpong S, Tsakos G, Sheiham A: Developing and evaluatingan oral health-related quality of life index for children; theCHILD-OIDP. Community Dent Health 2004, 21(2):161-169.
8. Gherunpong S, Tsakos G, Sheiham A: The prevalence and sever-ity of oral impacts on daily performances in Thai primaryschool children. Health Qual Life Outcomes 2004, 2:57.
9. Allen PF, Locker D: Do item weights matter? An assessmentusing the oral health impact profile. Community Dent Health1997, 14(3):133-138.
10. Kiwanuka SN, Åstrøm AN: Self reported dental pain and associ-ated factors in Ugandan schoolchildren. In Norsk EpidemiologyVolume 15. Issue 2 Norway ; 2005:175-182.
11. Jamil D, Åstrøm AN: Prevelence and correlates of self-reportedstate of teeth among schoolchildren in Kerala, India. BMCOral Health 2006, 6:10.
12. Gift HC, Reisine ST, Larach DC: The social impact of dentalproblems and visits. Am J Public Health 1992, 82(12):1663-1668.
13. Kiwanuka SN: Sugar snack consumption, caries experienceand dental pain: surveys of 3-5 and 10-14-year-old children inUganda. PhD Thesis. Volume PhD. Bergen , University of Bergen,Norway; 2006.
14. Connolly MA, Johnson JA: Measuring quality of life in paediatricpatients. Pharmacoeconomics 1999, 16(6):605-625.
15. Jokovic A, Locker D, Stephens M, Kenny D, Tompson B, Guyatt G:Validity and reliability of a questionnaire for measuring childoral-health-related quality of life. J Dent Res 2002,81(7):459-463.
16. Jokovic A, Locker D, Stephens M, Kenny D, Tompson B, Guyatt G:Measuring parental perceptions of child oral health-relatedquality of life. J Public Health Dent 2003, 63(2):67-72.
17. Foster Page LA, Thomson WM, Jokovic A, Locker D: Validation ofthe Child Perception Questionnaire (CPQ 11-14). J Dent Res2005, 48(7):649-652.
18. Adulyanon S, Vourapukjaru J, Sheiham A: Oral impacts affectingdaily performance in a low dental disease Thai population.Community Dent Oral Epidemiol 1996, 24(6):385-389.
Page 10 of 11(page number not for citation purposes)

Health and Quality of Life Outcomes 2007, 5:40 http://www.hqlo.com/content/5/1/40
Publish with BioMed Central and every scientist can read your work free of charge
"BioMed Central will be the most significant development for disseminating the results of biomedical research in our lifetime."
Sir Paul Nurse, Cancer Research UK
Your research papers will be:
available free of charge to the entire biomedical community
peer reviewed and published immediately upon acceptance
cited in PubMed and archived on PubMed Central
yours — you keep the copyright
Submit your manuscript here:http://www.biomedcentral.com/info/publishing_adv.asp
BioMedcentral
19. Tubert-Jeanin S, Pegon-Machat E, Gremeau-Richard C, M-M L, TsakosG: Validation of the French version of the Child-OIDP index.Eur J of Oral Sci 2005, 113:355-362.
20. Yusuf H, Gherunpong S, Sheiham A, Tsakos G: Validation of anEnglish version of the Child-OIDP index, an oral health-related quality of life measure for children. Health Qual Life Out-comes 2006, 4:38.
21. Badley EM: The ICIDH: format, application in different set-tings, and distinction between disability and handicap. A cri-tique of papers on the application of the InternationalClassification of Impairments, Disabilities, and Handicaps.Int Disabil Stud 1987, 9(3):122-125.
22. Locker D: Measuring oral health: a conceptual framework.Community Dent Health 1988, 5(1):3-18.
23. Ministry of Health. The United Republic of Tanzania:OralHealth Care Policy. 2002.
24. Kida IA, Astrom AN, Strand GV, Masalu JR, Tsakos G: Psychomet-ric properties and the prevalence, intensity and causes oforal impacts on daily performance (OIDP) in a population ofolder Tanzanians. Health Qual Life Outcomes 2006, 4:56.
25. Masalu JR, Astrom AN: Applicability of an abbreviated versionof the oral impacts on daily performances (OIDP) scale foruse among Tanzanian students. Community Dent Oral Epidemiol2003, 31(1):7-14.
26. National Bureau of Statistics. Ministry of Planning, economy andempowerment , The United Republic of Tanzania: Regional Profile;2004.
27. Lwanga SK, Lemeshow S: Sample size determination in healthstudies : a practical manual. Geneva , World Health Organiza-tion; 1991:viii, 80 s..
28. World Health Organization: Oral health surveys: Basicmethods. Geneva , ; 1997.
29. Greene JC, Vermillion JR: The Simplified Oral Hygiene Index. JAm Dent Assoc 1964, 68:7-13.
30. Streiner DL, Norman GR: Selecting the items. In Health measure-ment scales A practical guide to their development and use Volume 62.Edited by: Streiner DL. Oxford , Oxford University Press; 1998.
31. Byrne BM: Structural equation modeling with AMOS : basicconcepts, applications, and programming. In Multivariate appli-cations book series Mahwah, N.J. , Lawrence Erlbaum Associates;2001:XIV, 338 s..
32. Bernabe E, Sheiham A, Tsakos G: A comprehensive evaluation ofthe validity of the Child OIDP: further evidence from Peru.Community Dent Oral Epidemiol (submitted) .
33. McDowell I, Newell C: Measuring health : a guide to ratingscales and questionnaires. New York , Oxford University Press;1987:xiv, 342 s..
34. Astrom AN, Okullo I: Validity and reliability of the OralImpacts on Daily Performance (OIDP) frequency scale: across-sectional study of adolescents in Uganda. BMC OralHealth 2003, 3(1):5.
35. Masalu JR, Astrom AN: Social and behavioral correlates of oralquality of life studied among university students in Tanzania.Acta Odontol Scand 2002, 60(6):353-359.
36. John MT, Hujoel P, Miglioretti DL, LeResche L, Koepsell TD,Micheelis W: Dimensions of oral-health-related quality of life.J Dent Res 2004, 83(12):956-960.
37. John MT: Exploring dimensions of oral health-related qualityof life using experts' opinions. Qual Life Res 2007, 16(4):697-704.
Page 11 of 11(page number not for citation purposes)


Paper III


BioMed CentralBMC Oral Health
ss
Open AcceResearch articleMalocclusion, psycho-social impacts and treatment need: A cross-sectional study of Tanzanian primary school-childrenMatilda Mtaya1,2,3, Anne N Astrom*1,2 and Pongsri Brudvik4Address: 1Department of Odontology-Community Dentistry, UoB, Norway, 2Centre for international health, UoB, Norway, 3Muhimbili University of Health and Allied Sciences, Dar es Salaam, Tanzania and 4Department of Odontology- Orthodontics, UoB, Norway
Email: Matilda Mtaya - [email protected]; Anne N Astrom* - [email protected]; Pongsri Brudvik - [email protected]
* Corresponding author
AbstractBackground: studies on the relationship between children's malocclusion and its psycho-socialimpacts are so far largely unexplored in low-income countries. This study aimed to assess theprevalence of malocclusion, reported dental problems and dissatisfaction with dental appearanceamong primary school children in Tanzania. The relationship of dissatisfaction with socio-demographic characteristics, clinically defined malocclusion and psychosocial impacts of dentalanomalies was investigated. Orthodontic treatment need was estimated using an integrated socio-dental approach.
Method: One thousand six hundred and one children (mean age 13 yr) attending primary schoolsin the districts of Kinondoni and Temeke completed face to face interviews and a full mouth clinicalexamination. The survey instrument was designed to measure a Kiswahili translated and culturallyadapted Child Oral Impact on Daily Performance (Child-OIDP) frequency score, reported dentalproblems, dissatisfaction with dental appearance/function and socio-demographic characteristics.
Results: The prevalence of malocclusion varied from 0.9% (deep bite) to 22.5% (midline shift) witha total of 63.8% having at least one type of anomaly. Moderate proportions of children admitteddental problems; ranging from 7% (space position) to 20% (pain). The odds ratio of having problemswith teeth position, spaces, pain and swallowing if having any malocclusion were, respectively 6.7,3.9, 1.4 and 6.8. A total of 23.3% children were dissatisfied with dental appearance/function.Children dissatisfied with their dental appearance were less likely to be Temeke residents (OR =0.5) and having parents of higher education (OR = 0.6) and more likely to reporting problem withteeth position (OR = 4.3) and having oral impacts (OR = 2.7). The socio-dental treatment need of12% was five times lower than the normative need assessment of 63.8%.
Conclusion: Compared to the high prevalence of malocclusion, psycho social impacts anddissatisfaction with appearance/function was not frequent among Tanzanian schoolchildren.Subjects with malocclusion reported problems most frequently and malocclusion together withother psycho-social impact scores determined children's satisfaction with teeth appearance- andfunction.
Published: 6 May 2008
BMC Oral Health 2008, 8:14 doi:10.1186/1472-6831-8-14
Received: 6 December 2007Accepted: 6 May 2008
This article is available from: http://www.biomedcentral.com/1472-6831/8/14
© 2008 Mtaya et al; licensee BioMed Central Ltd. This is an Open Access article distributed under the terms of the Creative Commons Attribution License (http://creativecommons.org/licenses/by/2.0), which permits unrestricted use, distribution, and reproduction in any medium, provided the original work is properly cited.
Page 1 of 10(page number not for citation purposes)

BMC Oral Health 2008, 8:14 http://www.biomedcentral.com/1472-6831/8/14
BackgroundIt is generally accepted that the main benefit of orthodon-tic treatment relates to improvements in oral function andoro-facial aesthetics and thus to improved oral healthrelated quality of life [1-3]. A recent review on the impactof malocclusion on quality of life based on studies fromindustrialized countries concluded that patients are moti-vated to seek orthodontic care due to the physical, psycho-logical and social effects of malocclusion [3,4]. Thus,information regarding the psycho social impacts ofmalocclusion is important in providing understanding ofthe demand for orthodontic treatment beyond clinicalindicators [3,4]. Valid and reliable oral health relatedquality of life instruments for use among children areemerging and have the potential to provide informationabout the subjectively experienced consequences of oraldiseases including malocclusion, the effect of malocclu-sion if left untreated and to facilitate appropriate treat-ment need assessment for dental service planning [3,5-8].However, values attributed to dental esthetics and func-tioning vary according to social and cultural contexts andstudies regarding the relationship between malocclusionand its psycho social impacts is so far largely unexploredin low income countries [9-14]. Recent studies of Nigerianadolescents suggest that consciousness of malocclusiondoes not agree with the objectively determined orthodon-tic treatment need [15-17]. In Tanzania, studies investigat-ing the functional and behavioral consequences ofmalocclusion in children are either non-existent or veryfew [9,18]. This is noteworthy as normatively assessedorthodontic treatment needs based on clinical indicatorsalone are commonly found to vary according to age, to behigh (60–90%) and thus are unlikely to be met due to thehigh costs of treatment that goes beyond the financialcapabilities of this country [19,20]. Three quarters of thelow-income countries lack sufficient human and financialresources to provide an essential health care package fortheir children [21].
Considering the impracticality and inappropriateness of anormative approach to the assessment of children's needfor orthodontic treatment, Gherunpong et al [11] devel-oped a new theoretical framework and model for estimat-ing orthodontic treatment need in children. In theirmodel they integrated clinical measures of orthodonticanomalies with children's feeling of impacts related toappearance and function as well as with measures of theiroral health related behaviors. This socio-dental system forneed assessment includes three levels. The first level refersto standard normative need assessment and is basedsolely on professionally judged malocclusions that nor-mally require orthodontic treatments. The second levelrefers to impact related need assessment and relies on theintegration of normative need with OHRQoL. Childrenwho have both normative needs and their oral quality of
life impaired by malocclusion are considered to haveimpact related need for orthodontic treatment. Propensityrelated need assessment (level three) is calculated by inte-grating normative need assessment with impacts on OHR-QoL and children's behavioral propensity in terms ofappropriate oral hygiene and dental attendance patterns,thus taking into account the effectiveness and appropri-ateness of suggested treatments in the decision makingprocess. Following this socio-dental approach, Gherun-pong et al [10-12] reported that relying on normativemethods (i.e. clinical diagnosis) alone without integratingthe psychosocial dimensions of oral health, seriouslyoverestimated need for orthodontic treatment in 11–12year old Thais. Compared to a normative approach toneed assessment, the socio-dental approach provided areduction of 70% in the volume of estimated treatmentneed [10-12]. Accordingly, a normative measure of ortho-dontic treatment need estimated by converting clinicalmeasures alone is expected to be too high to be met in aTanzanian context where the government's oral healthcare budget is inadequate to meet the increasing oralhealth needs of the population [21].
The present study aims to assess the prevalence and corre-lates of perceived orthodontic conditions and dissatisfac-tion with dental appearance/dental function in Tanzanianschoolchildren that are without any history of orthodon-tic treatment. The conceptual model of Gilbert et al [22](Fig 1) classifying oral health outcomes into four mainlevels was applied to organize the independent variablesand to guide the analyses. These four levels were as fol-lows; 1) oral disease and tissue damage referring to disor-der at the organic level such as active disease or tissue loss,2) oral pain/discomfort denoting the immediate conse-quences of disease in terms of physical dysfunction suchas the inability to speak, swallow and chew food ade-quately, 3) oral disadvantage referring to the psychosocialand behavioral consequences of oral diseases, such as dif-ficulties performing daily activities and 4) overall satisfac-tion with dental health. The final concept of satisfactionwith dental health is subjects' expressed overall evaluation,incorporating expectations, values and social and culturalbackground. Following this model, it was hypothesizedthat reported problems in terms of pain, swallowing, teethposition and spaces of teeth and reported oral impacts ondaily performances would increase with increased preva-lence of malocclusion. Secondly, it was hypothesized thatdissatisfaction with dental appearance/function wouldincrease with increased prevalence of malocclusion,increased frequency of reported problems related to teethand increased oral impacts on daily performances. Con-sidering that feelings regarding teeth appearance andfunction are central for need assessment and thus for theplanning and implementation of oral health care services
Page 2 of 10(page number not for citation purposes)

BMC Oral Health 2008, 8:14 http://www.biomedcentral.com/1472-6831/8/14
in Tanzania, orthodontic treatment need was estimatedusing a modified integrated socio-dental approach [11].
MethodsA cross-sectional survey was conducted in Dar Es Salaam,the commercial capital and major sea port of Tanzania,from November 2005 to June 2006. Dar Es Salaam is themost densely populated and socially and culturally heter-ogenic city in Tanzania. According to the 2002 populationand house survey in Tanzania, Dar Es Salaam has a totalpopulation of 2.5 million and population density of1,793 per square km. Dar es Salaam is divided into threedistricts; Kinondoni, Ilala and Temeke with total popula-tion sizes of 1.083,913, 634,924 and 768,451 peoplerespectively. All districts have drinking water with fluoridecontent of about 1 mg fluoride/L (1 ppm). Kinondoni andTemeke are quite diverse districts in terms of their socio-demographic profile, with the former having higheremployment rates, literacy rates and proportions of thepopulation using the most expensive form, electricity, astheir main source of energy for cooking [23].
The study population comprised of children attendingstandard 7 in public primary schools. A stratified propor-tionate two-stage cluster sampling design with public pri-mary schools as the primary sampling unit was utilized.To obtain a sample of schoolchildren of mixed socio-eco-nomic background, schools were selected at random fromurban and rural areas in Kinondoni and Temeke districts.Overall, 43 rural- (N = 4,809 standard 7 pupils) and 78urban primary schools (N = 14.725 standard 7 pupils)were listed in Kinondoni. The corresponding number of
schools in Temeke were 22 rural (N = 1707 standard 7pupils) and 77 urban (N = 14103 standard 7 pupils)schools. A sample size of 1200 school children aged 12–14 yr was calculated to be satisfactory for two sided tests,assuming the prevalence of oral impacts to be 0.40 and0.50 in children with and without orthodontic anomaly,a significance level of 5%, power of 90% and a design fac-tor of 2 [24]. At the first stage, 4 rural (4/43 n = 755 stand-ard 7 pupils) and 6 urban (6/78, n = 1157 standard 7pupils) schools in Kinondoni and 1 rural (1/22 n = 184standard 7 pupils) and 5 urban (5/77, n = 949 standard 7pupils) schools in Temeke were selected by systematicrandom sampling using a unified sampling fraction. Froma total of 3045 standard 7 pupils available in the selectedschools, about 100 students in each selected school (i.e.1601 students constituting 52.6% of all standard 7 stu-dents in the selected schools) and fulfilling the inclusioncriteria of being in the defined age range of 12–14 yrs wererandomly selected from the accessible classes. Only con-senting subjects were included in the study and none ofthe students invited for participation were ill, had a his-tory of psychiatric problems or were disabled. Ethicalclearance was obtained from all relevant persons, author-ities and committees in Tanzania. These included writtenpermission and clearance for the study from the Researchand Publication Committee of the Muhimbili UniversityCollege of Health Sciences (MUCHS). Permission to workwith school children was obtained from Kinondoni andTemeke municipalities, their respective educationalauthorities, schools administrations, parents and chil-dren.
Conceptual model of chewing satisfaction showing associations between oral health constructs (Gilbert et al. 1998)Figure 1Conceptual model of chewing satisfaction showing associations between oral health constructs (Gilbert et al. 1998).
Page 3 of 10(page number not for citation purposes)

BMC Oral Health 2008, 8:14 http://www.biomedcentral.com/1472-6831/8/14
A structured interview schedule was constructed in Eng-lish and translated into Swahili by two trained researchassistants. Oral health professionals reviewed the inter-view schedule for semantic, experiential and conceptualequivalence. Sensitivity to culture and selection of appro-priate words were considered. The interview schedule waspiloted before administration [9]. The model of Gilbertand coworkers [22] linking oral diseases with their func-tional and behavioral outcomes was applied to identifywhich factors to consider as determinants of dissatisfac-tion with dental appearance/function, and to help struc-ture the multivariate regression analysis. The interviewschedule in Swahili contained three of the four key con-cepts derived from this model. Oral pain and discomfort,the second level in Gilbert's model [22], was assessed byasking subjects, whether or not they had experiencedproblems with pain, tooth position and tooth spaces dur-ing the previous 3 months. Response categories weregiven as (0) no and (1) yes. Problems with swallowingwas registered in clinical examination as present = 1 andabsent = 0. Oral disadvantage, referring to the third levelof Gilbert's model [22], was measured broadly using theeight item Child-OIDP, inventory (e.g. During the previ-ous 3 months – how often have problems with your teethand mouth caused you any difficulty with; eating, speak-ing, cleaning teeth, smiling, sleeping, emotional balance,study and social contact). For purpose of cross tabulation
and logistic regression analysis the OIDPscore (0–8) wasdichotomized as 0/1+, producing the categories (0) "nodaily performance affected" and (1) "at least one dailyperformance affected". The scoring method, reliabilityand validity of the Kiswahili version of the Child-OIDPinventory have been described in detail in a previouspaper [9]. Reported state of teeth was assessed using thecategories (1) very good (2) good (3) bad (4) very bad anddichotomized into (0) good (original categories 1,2) and(1) bad (original categories 3,4). Satisfaction with teethappearance/function was coded on 4-point Likert-scalesand recoded further into dummy variables in terms of (0)satisfied and (1) dissatisfied. Overall satisfaction withteeth appearance/functioning was constructed as a sumvariable from the 2 variables and dichotomized for use incross tabulation and logistic regression analysis. Socio-demographics were assessed in terms of place of residence(urban/rural), district (Kinondoni/Temeke), gender, ageand parental education. A group variable on parental edu-cation was constructed from two dummy variables (0/1)on father's and mother's highest level of education. Theindependent and dependent variables and the number ofsubjects according to categories are summarized in Table1.
One trained and calibrated dentist (MM) conducted allclinical examinations in classroom setting with natural
Table 1: Frequency distribution of independent and dependent variables and their categories in Kinondoni and Temeke districts
Variables Categories (code) Kinondoni % (n) Temeke %(n) p-value
Sex e Male (1) 41.1 (412) 36.8 (220) P = 0.050Female (2) 58.9 (591) 63.2 (378)
Age 12 Yr (1) 26.1 (262) 23.9 (143) P = 0.03313 yr (2) 41.0 (420) 48.5 (290)14 yr (3) 32.0 (321) 27.6 (165)
Parental education Both low (1) 38.5 (210) 53.8 (149) P = 0.000One low/one high (2) 24.2 (132) 20.9 (58)Both high (3) 37.2 (203) 25.3 (70)
Place of residence: Urban (1) 63.5 (637) 82.3 (492) P = 0.000Rural (2) 36.5 (366) 17.7 (106)
State of health Good (0) 93.2 (935) 96.5 (577) P = 0.003Bad (1) 6.8 (68) 3.5 (21)
Reported problems tooth position Yes (1) 10.5 (105) 13.9 (83) P = 0.025No (2) 89.5 (898) 86.1 (515)
Reported problems tooth spaces Yes (1) 7.8 (78) 7.5 (45) P = 0.465No (2) 92.2 (925) 92.5 (553)
Problem swallowing No (0) 93.5 (938) 90.8 (543) P = 0.030Yes (1) 6.5 (65) 9.2 (55)
Problem pain No (0) 81.3 (815) 75.9 (454) P = 0.066Yes (1) 18.7 (188) 24.1 (144)
OHIS debris score Good = 0 68.0 (682) 61.9 (370) P = 0.007Fair/poor = 1 32.0 (321) 38.1 (228)
OIDP extent None = 0 81.5 (817) 54.5 (326) P = 0.001> 1 = 1 18.5 (186) 45.5 (272)
Malocclusion index (SMO) No (0) 37.4 (328) 34.0 (163) P = 0.237Yes (1) 62.6 (549) 66.0 (316)
Dissatisfied appearance/function Yes (0) 25.6 (257) 19.4 (116) P = 0.002No (1) 74.4 (746) 80.6 (482)
Reported state of teeth Good (1) 84.8 (851) 91.6 (548) P = 0.001Bad (2) 15.2 (152) 8.4 (50)
Page 4 of 10(page number not for citation purposes)

BMC Oral Health 2008, 8:14 http://www.biomedcentral.com/1472-6831/8/14
daylight as the source of illumination and with an assist-ant recording the observations. Participants identifiedwith problems that needed treatment were referred oradvised to seek treatment at the two municipal hospitalsof Kinondoni and Temeke districts and oral health educa-tion sessions were provided. Occlusion was registeredaccording to Björk et al., [25], with some modifications byAl-Emran et al., [26]. Caries experience was assessed inaccordance with the criteria by the World health Organi-zation [27]. Oral hygiene was assessed using the simpli-fied-Oral Hygiene Index (OHI-S) [28].
Sagittal molar occlusion: the basic Angle classification wasused. The intermaxillary relationship of first permanentmolars was registered as CL I (normal/neutral) when themesiobuccal cusp of the maxillary first permanent molaroccluded in line with mesiobuccal groove of the mandib-ular first permanent molar. CL II (distal) or CL III (mesial)molar occlusion was recorded when there was deviationof at least one half cusp width distally or mesially to CL I,respectively. It was recorded as Class I (CL I = 1), II (CL II= 2) and III (CL III = 3), and dichotomized into 0 (CL I)and 1(CL II and III) for use in cross tabulation and logisticregression analysis. When first permanent molars weremissing, the registration was considered not applicable.Overjet: the distance from the most labial point of theincisal edge of maxillary right central incisor to the mostlabial surface of the corresponding mandibular incisor.Positive value (maxillary overjet) was recorded if theupper incisor was ahead of the lower incisor, and negativevalue (mandibular overjet), was registered if the upperincisor was behind the lower incisor. Maxillary overjet wascategorized as 1; 1–4.9 mm (grade 1), 2; 5–8.9 mm (grade2) and 3: ≥ 9 mm (grade 3). It was considered increasedwhen the value exceeded 5 mm, and dichotomized into 0< 5 mm and 1 ≥ 5 mm for use in cross tabulation andlogistic regression analyses. Mandibular overjet was codedas 0; absent, 1: < 0 to -1.9 mm (grade 1) and 2; ≤ – 2 mm(grade 2) and recoded into 0 = absent and 1 = present (1and 2). Overbite: the vertical overlap of incisors, meas-ured to the nearest half millimetre vertically from theincisal edge of the maxillary right central incisor to theincisal edge of the corresponding mandibular right inci-sor. If the right central incisor was missing or fractured, itwas substituted by left central incisor. It was coded as 1;0.1–2.9 mm (grade 1), 2; 3–4.9 mm (grade 2) and 3; > 5mm (grade 3), then recoded into 0 = absent (< 5 mm) and1 = present (> 5 mm). It was considered deep bite whenthe value exceeded 5 mm. Open bite: frontal open bitewas recorded when there was no vertical overlap of theincisors, measures to nearest half millimetre. A visiblespace between antagonistic fully erupted canines, premo-lars or molars was registered as a lateral open bite. Openbite was coded as 0; absent, 1; 0–1.9 mm (frontal openbite grade 1), 2; ≥ 2 mm (frontal open bite grade 2) and 3;
lateral open bite, and recoded into 0 = absent and 1 =present (1, 2 and 3). Lateral crossbite: was registered whenone or more buccal cusps of the mandibular canines,premolars and/or molars occluded bucally to the buccalcusps of the maxillary antagonists, recorded either as 1;absent, 2; present unilaterally or 3; present bilaterally. Itwas then dichotomized into 0 = absent (1) and 1 = present(2 and 3). Scissors bite: registered when any of the maxil-lary premolars and/or molars totally occluded to the buc-cal surface of the opposing mandibular teeth. It wasrecorded as 1 = absent, 2 = present unilaterally or 3 =present bilaterally. It was then dichotomized into 0 =absent (1) and 1 = present (2 and 3). Midline shift: wasdefined as non-coincident upper and lower midlineswhen the posterior teeth were in maximum intercuspalrelationship. It was coded as (1) absent (2) present whenthe displacement was at least 2 mm or more and recodedinto 0 = absent (1) and 1 = present (2). Crowding: wasrecorded when the total sum of crowding in the segmentwas at least 2 mm. It was coded as 1 = absent, 2 = presentupper jaw, 3 = present lower jaw and 4 = present bothjaws. It was recoded into 0 = absent (1) and 1 = present (2,3 and 4). Spacing: was recorded when the total spacingwas least 2 mm in a segment. It was coded as 1; absent, 2;present upper jaw, 3; present lower jaw and 4; presentboth jaws. Then it was recoded into 0 = absent (1) and 1= present (2, 3 and 4).
A sum score of malocclusions (SMO) was constructed foruse in logistic regression, based on the diagnosis of theabsence (0)/presence (1) of the following recordings;maxillary overjet, mandibular overjet, Class II and ClassIII molar occlusion, open bite, deep bite, lateral cross bite,midline shift, scissors bite, crowding and spacing.
Statistical analysesData were analyzed using SPSS version 14.0. Test-retestreliability for the clinical parameters and the question-naire variables was assessed using Cohen's weightedkappa statistics with an independent sample of 71 12–14-year-olds and a time interval of 3 weeks. Internal consist-ency reliability was assessed in the main sample usingCronbach's alpha. Cross-tabulation, Chi-square statistics,Mc Nemar's statistics and multiple logistic regressionanalyses were used for bivariate- and multivariate analy-ses, respectively. To adjust for the effect of the clusterdesign, data were reanalysed using STATA 9.0 with surveycommand. P-value for statistical significance was set at0.05.
ResultsSample profileA total of 1003 children from Kinondoni (63.5% urban,58.9% girls, mean age 13.1 yr) and 598 children fromTemeke (82.3% urban, 63.2% girls, mean age 13.0 yr)
Page 5 of 10(page number not for citation purposes)

BMC Oral Health 2008, 8:14 http://www.biomedcentral.com/1472-6831/8/14
completed an extensive personal interview and under-went a full mouth clinical examination. The mean OHI-Sscores were 1.0 (sd = 0.53, range 0.0–3.3) in Kinondoniand 1.2 (sd = 0.54, range 0.0–4.2) in Temeke. Table 1 pro-vides the percentage distribution of participants' inde-pendent and dependent variables in the districts ofKinondoni and Temeke.
ReproducibilityDuplicate clinical examinations gave Kappa statistics of0.74, 0.78, 0.79, 0.82, 0.93 and 0.97 for the OHI-S-, mid-line shift-, deep bite-, mandibular overjet-, maxillary over-jet and spacing scores, respectively. Regarding the scoresfor open bite, Angle classification, cross bite, scissor biteand crowding, the kappa statistics were 1. Test retest relia-bility for the 8 Child- OIDP items were in the range 0.7(emotional state) to 1.00 (eating, speaking, cleaningteeth, sleeping, smiling and social contact). Kappa valuesfor the items assessing satisfaction with teeth appearanceand teeth function and self-reported problems with teethwere all 1.00. These figures indicate very good intra-exam-iner reliability according to Landis & Koch [29].
Prevalence and correlates of self- reported problems with teethThe prevalence of malocclusions varied from 22.5% (mid-line shift) to 0.9% (deep bite). Prevalence of mandibularoverjet and crowding were statistically significantly higherin children who were dissatisfied with dental appearanceand function than in their counterparts who were satis-fied. A total of 63.8% had at least one type of anomaly(i.e. scored above zero on the SMO score) and the preva-lence was higher in dissatisfied- than in satisfied children(71.6% versus 62.5%, p < 0.001). Moderate proportions
of the children investigated confirmed problems withpain (20.7%), teeth position (11.7%) and problems withspaces (7.7%). Moreover, a total of 7.5% of the childrenwere observed with swallowing problems, whereas 28.6%had at least one oral impact (OIDP > 0) (not in table).After controlling for possible confounding effects ofsocio-demographic factors, the odds ratios for confirmingproblems with teeth position, spaces, pain and swallow-ing were respectively 6.7, 3.9 and 1.4, and 6.8 if havingany occlusion anomaly (SMO > 0) compared to beingwithout such anomaly (Table 2, 3). Problems related toteeth position were consistently more frequently reportedamong children in Temeke than among their counterpartsin Kinondoni (Table 2, 3).
Prevalence and correlates of dissatisfaction with dental appearance/functioningIn total, 23.3% (373/1601) children were dissatisfiedwith their dental appearance/function. The correspondingfigures in Kinondoni and Temeke were 25.6 (257/1003)and 19.4 (116/598), respectively. Table 4 depicts unad-justed and adjusted OR from binary and multiple logisticregression analysis of children being dissatisfied with theirdental appearance/function according to socio-demo-graphic-, clinically assessed malocclusion, reported dentalproblems and oral disadvantage variables. Age, gender,district, place of residence and parental education wereentered into step one providing a Nagelkerke's R2 of 0.016(Model Chi square: 9.133, df = 7, p = 0.243). Entering theSMO index in step two raised the Nagelkerke's R2 to 0.026(Model Chi square: 14,546, df = 8, p = 0.069). Enteringfour variables of reported dental problems in step threeand the OIDP score and self rated health in step fourraised the Nagelkerke's R2 to 0.095 (Model Chi square
Table 2: Percentage and OR (95% CI) of participants who reported problem with position- and spaces of teeth by socio demographic variables and malocclusion index, SMO.
Tooth position % (n) Adjusted step OR (95% CI Space % (n) Adjusted step OR (95% CI)
Socio demographicsKinondoni 10.5 (105) 1 7.8 (78) 1Temeke 13.9 (83)* 1.6 (1.0–2.5) 7.5 (45) 0.9 (0.5–1.6)Boy 13.1 (83) 1 8.4 (53) 1Girl 10.8 (105) 0.7 (0.4–1.0) 7.2 (70) 1.1 (0.6–1.7)Urban 11.3 (128) 1 8.4 (95) 1Rural 12.7 (60) 1.1 (0.7–1.8) 5.9 (28) 0.7 (0.4–1.3)12 yr 11.9 (48) 1 7.7 (31) 113 yr 12.5 (89) 0.8 (0.4–1.4) 6.8 (48) 0.7 (0.3–1.3)14 10.5 (51) 0.7 (0.3–1.3) 9.1 (44) 1.1 (0.5–1.9)Both parents low education 14.2 (51) 1 8.9 (32) 1One low/one high 8.9 (17) 0.5 (0.2–0.9) 11.6 (22) 1.3 (0.7–2.3)Both parents high education 13.2 (369 0.8 (0.5–1.3) 8.8 (24) 0.9 (0.5–1.7)Clinical statusSMO = 0 (no malocclusion diagnosed) 1.6 (8) 1 2.9 (14) 1SMO > 0 16.4 (142)** 6.7 (3.3–13.3) 8.8 (76)** 3.9 (2.0–7.8)
**p < 0.001, *p < 0.05
Page 6 of 10(page number not for citation purposes)

BMC Oral Health 2008, 8:14 http://www.biomedcentral.com/1472-6831/8/14
Table 3: Percentage and OR (95% CI) of participants who reported problem with swallowing and pain by socio demographic variables and malocclusion index, SMO.
Variables Problem with swallowing % (n)
Adjusted step OR (95% CI Problem with pain % (n) Adjusted step OR (95% CI)
Socio demographicsKinondoni 6.5 (65) 1 18.7 (188) 1Temeke 9.2 (55)* 1.3 (0.7–2.3) 24.1 (144)** 1.5 (1.1–2.1)Boy 6.6 (42) 1 19.3 (12) 1Girl 8.0 (78) 1.5 (0.8–2.7) 21.7 (210) 1.3 (0.9–1.8)Urban 8.4 (95) 1 20.9 (236) |Rural 5.3 (25)* 0.4 (0.2–0.8) 20.3 (96) 1.2 (0.8–1.8)12 yr 7.2 (29) 1 18.0 (73) 113 yr 6.1 (43) 0.8 (0.4–1.7) 20.1 (143) 1.2 (0.7–1.8)14 9.9 (48) 1.1 (0.5–2.3) 23.9 (116) 1.3 (0.8–2.1)Both parents low education 8.4 (30) 1 20.3 (73) 1One low/one high 7.4 (14) 0.9 (0.4–1.8) 21.6 (41) 1.1 (0.7–1.7)Both parents high education 7.0 (19) 0.8 (0.4–1.6) 20.5 (56) 1.1 (0.7–1.7)Clinical statusSMO = 0 (at least one malocclusion diagnosed)
1.0 (5) 1 17.1 (87) 1
SMO > 0 5.3 (46)** 6.8 (2.7–17.4) 21.0 (182)** 1.4 (1.0–2.0)
**p < 0.001, *p < 0.05
Table 4: Unadjusted and adjusted odds ratio (OR) and 95% confidence interval (CI) of being dissatisfied with dental appearance and function according to socio-demographics (step 1), clinically assessed criteria of malocclusion, SMO (step 11) and subject-rated oral health (step III)
Variables Unadjusted OR (95% CI) Adjusted step I OR (95% CI
Step I (socio demographics R2=Kinondoni 1 1Temeke 0.7 (0.5–0.8) 0.5 (0.3–0.8)Boy 1 1Girl 0.9 (0.7–1.1) 1.0 (0.7–1.4)Urban 1 1Rural 0.9 (0.7–1.2) 0.7 (0.4–1.0)12 yr 1 113 yr 1.0 (0.8–1.4) 0.8 (0.5–1.3)14 1.2 (0.8–1.6) 0.9 (0.7–1.4)Both parents low education 1 1One low/one high 0.7 (0.4–1.1) 0.7 (0.4–1.1)Both parents high education 0.6 (0.4–0.9) 0.6 (0.4–0.9)Step II (clinical status)SMO = 0 1 1SMO > 0 1.6 (1.2–1.9) 1.2 (0.6–1.6)Step III (reported problems)Pain : no 1 1Pain: yes 1.4 (1.1–1.8) 0.8 (0.5–1.3)Problem swallowing: no 1 1Problem swallowing: yes 1.5 (1.0–2.1) 1.1 (0.5–1.9)Problem position: no 1 1Problem position: yes 3.4 (2.5–4.7) 4.3 (2.7–6.9)Problem spaces: no 1 1Problem spaces: yes 1.7 (1.1–2.4) 1.4 (0.8–2.3)Step IV (oral disadvantage)OIDP = 0 1 1OIDO > 0 1.8 (1.4–2.3) 2.2 (1.4–3.1)Self rated health: good 1 1Self rated health: bad 3.3 (2.1–5.1) 2.7 (1.5–5.1)
Page 7 of 10(page number not for citation purposes)
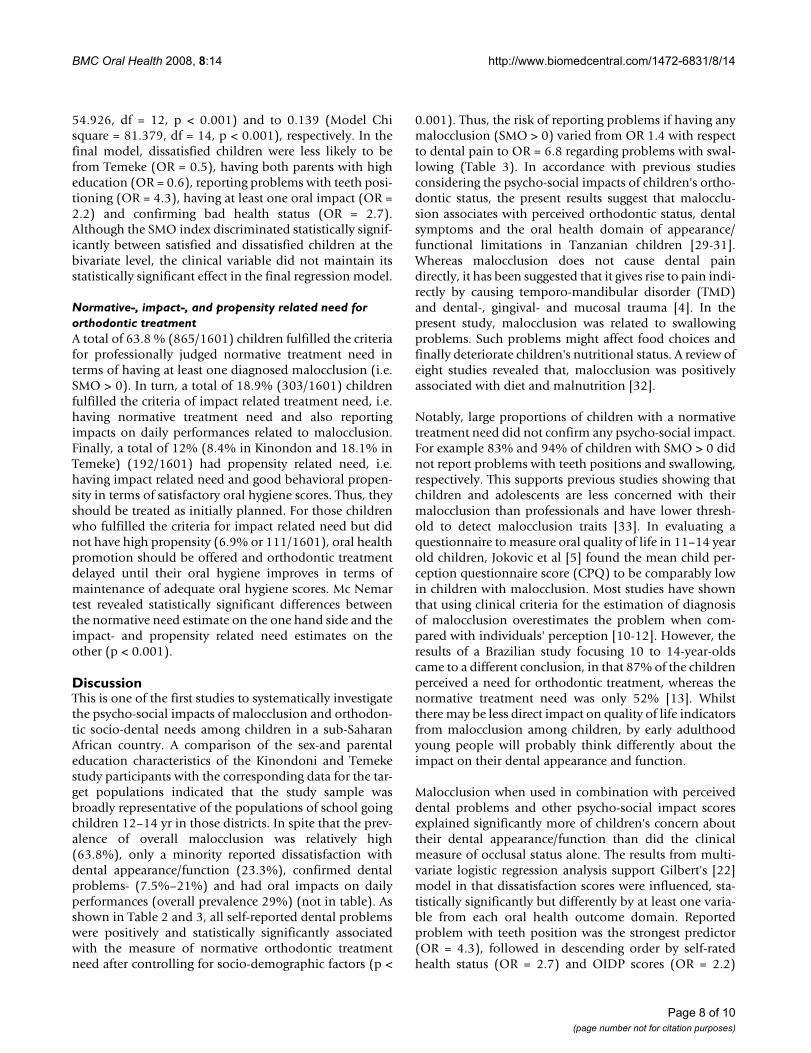
BMC Oral Health 2008, 8:14 http://www.biomedcentral.com/1472-6831/8/14
54.926, df = 12, p < 0.001) and to 0.139 (Model Chisquare = 81.379, df = 14, p < 0.001), respectively. In thefinal model, dissatisfied children were less likely to befrom Temeke (OR = 0.5), having both parents with higheducation (OR = 0.6), reporting problems with teeth posi-tioning (OR = 4.3), having at least one oral impact (OR =2.2) and confirming bad health status (OR = 2.7).Although the SMO index discriminated statistically signif-icantly between satisfied and dissatisfied children at thebivariate level, the clinical variable did not maintain itsstatistically significant effect in the final regression model.
Normative-, impact-, and propensity related need for orthodontic treatmentA total of 63.8 % (865/1601) children fulfilled the criteriafor professionally judged normative treatment need interms of having at least one diagnosed malocclusion (i.e.SMO > 0). In turn, a total of 18.9% (303/1601) childrenfulfilled the criteria of impact related treatment need, i.e.having normative treatment need and also reportingimpacts on daily performances related to malocclusion.Finally, a total of 12% (8.4% in Kinondon and 18.1% inTemeke) (192/1601) had propensity related need, i.e.having impact related need and good behavioral propen-sity in terms of satisfactory oral hygiene scores. Thus, theyshould be treated as initially planned. For those childrenwho fulfilled the criteria for impact related need but didnot have high propensity (6.9% or 111/1601), oral healthpromotion should be offered and orthodontic treatmentdelayed until their oral hygiene improves in terms ofmaintenance of adequate oral hygiene scores. Mc Nemartest revealed statistically significant differences betweenthe normative need estimate on the one hand side and theimpact- and propensity related need estimates on theother (p < 0.001).
DiscussionThis is one of the first studies to systematically investigatethe psycho-social impacts of malocclusion and orthodon-tic socio-dental needs among children in a sub-SaharanAfrican country. A comparison of the sex-and parentaleducation characteristics of the Kinondoni and Temekestudy participants with the corresponding data for the tar-get populations indicated that the study sample wasbroadly representative of the populations of school goingchildren 12–14 yr in those districts. In spite that the prev-alence of overall malocclusion was relatively high(63.8%), only a minority reported dissatisfaction withdental appearance/function (23.3%), confirmed dentalproblems- (7.5%–21%) and had oral impacts on dailyperformances (overall prevalence 29%) (not in table). Asshown in Table 2 and 3, all self-reported dental problemswere positively and statistically significantly associatedwith the measure of normative orthodontic treatmentneed after controlling for socio-demographic factors (p <
0.001). Thus, the risk of reporting problems if having anymalocclusion (SMO > 0) varied from OR 1.4 with respectto dental pain to OR = 6.8 regarding problems with swal-lowing (Table 3). In accordance with previous studiesconsidering the psycho-social impacts of children's ortho-dontic status, the present results suggest that malocclu-sion associates with perceived orthodontic status, dentalsymptoms and the oral health domain of appearance/functional limitations in Tanzanian children [29-31].Whereas malocclusion does not cause dental paindirectly, it has been suggested that it gives rise to pain indi-rectly by causing temporo-mandibular disorder (TMD)and dental-, gingival- and mucosal trauma [4]. In thepresent study, malocclusion was related to swallowingproblems. Such problems might affect food choices andfinally deteriorate children's nutritional status. A review ofeight studies revealed that, malocclusion was positivelyassociated with diet and malnutrition [32].
Notably, large proportions of children with a normativetreatment need did not confirm any psycho-social impact.For example 83% and 94% of children with SMO > 0 didnot report problems with teeth positions and swallowing,respectively. This supports previous studies showing thatchildren and adolescents are less concerned with theirmalocclusion than professionals and have lower thresh-old to detect malocclusion traits [33]. In evaluating aquestionnaire to measure oral quality of life in 11–14 yearold children, Jokovic et al [5] found the mean child per-ception questionnaire score (CPQ) to be comparably lowin children with malocclusion. Most studies have shownthat using clinical criteria for the estimation of diagnosisof malocclusion overestimates the problem when com-pared with individuals' perception [10-12]. However, theresults of a Brazilian study focusing 10 to 14-year-oldscame to a different conclusion, in that 87% of the childrenperceived a need for orthodontic treatment, whereas thenormative treatment need was only 52% [13]. Whilstthere may be less direct impact on quality of life indicatorsfrom malocclusion among children, by early adulthoodyoung people will probably think differently about theimpact on their dental appearance and function.
Malocclusion when used in combination with perceiveddental problems and other psycho-social impact scoresexplained significantly more of children's concern abouttheir dental appearance/function than did the clinicalmeasure of occlusal status alone. The results from multi-variate logistic regression analysis support Gilbert's [22]model in that dissatisfaction scores were influenced, sta-tistically significantly but differently by at least one varia-ble from each oral health outcome domain. Reportedproblem with teeth position was the strongest predictor(OR = 4.3), followed in descending order by self-ratedhealth status (OR = 2.7) and OIDP scores (OR = 2.2)
Page 8 of 10(page number not for citation purposes)
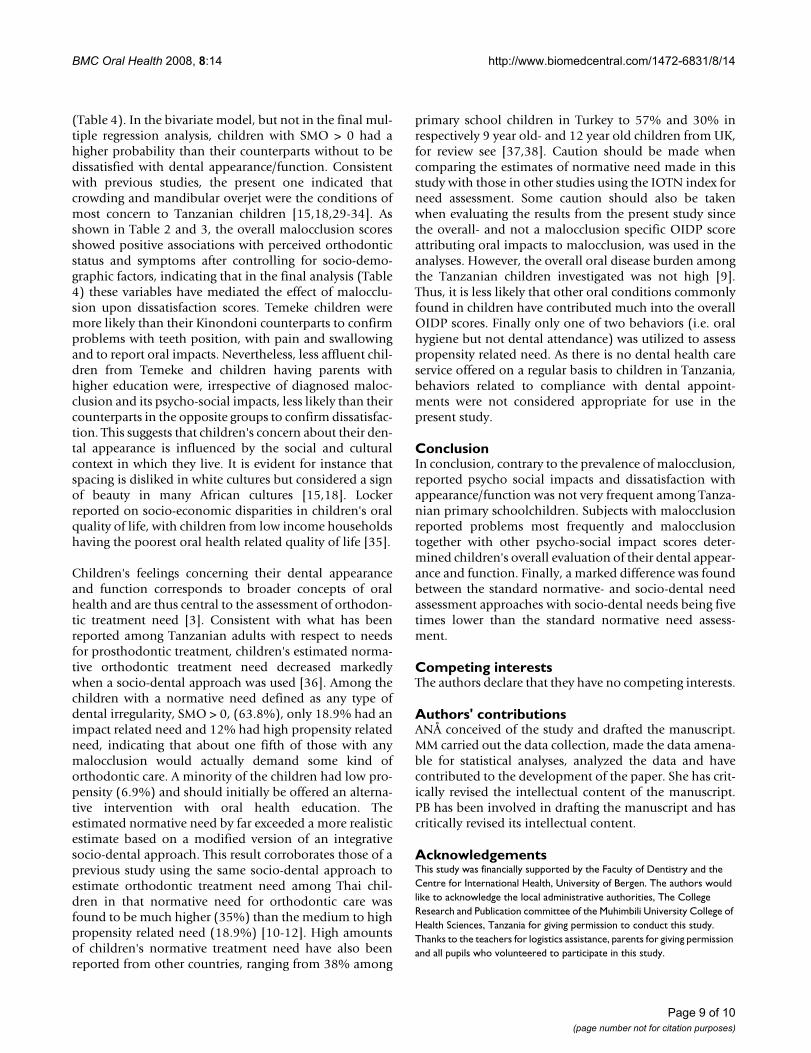
BMC Oral Health 2008, 8:14 http://www.biomedcentral.com/1472-6831/8/14
(Table 4). In the bivariate model, but not in the final mul-tiple regression analysis, children with SMO > 0 had ahigher probability than their counterparts without to bedissatisfied with dental appearance/function. Consistentwith previous studies, the present one indicated thatcrowding and mandibular overjet were the conditions ofmost concern to Tanzanian children [15,18,29-34]. Asshown in Table 2 and 3, the overall malocclusion scoresshowed positive associations with perceived orthodonticstatus and symptoms after controlling for socio-demo-graphic factors, indicating that in the final analysis (Table4) these variables have mediated the effect of malocclu-sion upon dissatisfaction scores. Temeke children weremore likely than their Kinondoni counterparts to confirmproblems with teeth position, with pain and swallowingand to report oral impacts. Nevertheless, less affluent chil-dren from Temeke and children having parents withhigher education were, irrespective of diagnosed maloc-clusion and its psycho-social impacts, less likely than theircounterparts in the opposite groups to confirm dissatisfac-tion. This suggests that children's concern about their den-tal appearance is influenced by the social and culturalcontext in which they live. It is evident for instance thatspacing is disliked in white cultures but considered a signof beauty in many African cultures [15,18]. Lockerreported on socio-economic disparities in children's oralquality of life, with children from low income householdshaving the poorest oral health related quality of life [35].
Children's feelings concerning their dental appearanceand function corresponds to broader concepts of oralhealth and are thus central to the assessment of orthodon-tic treatment need [3]. Consistent with what has beenreported among Tanzanian adults with respect to needsfor prosthodontic treatment, children's estimated norma-tive orthodontic treatment need decreased markedlywhen a socio-dental approach was used [36]. Among thechildren with a normative need defined as any type ofdental irregularity, SMO > 0, (63.8%), only 18.9% had animpact related need and 12% had high propensity relatedneed, indicating that about one fifth of those with anymalocclusion would actually demand some kind oforthodontic care. A minority of the children had low pro-pensity (6.9%) and should initially be offered an alterna-tive intervention with oral health education. Theestimated normative need by far exceeded a more realisticestimate based on a modified version of an integrativesocio-dental approach. This result corroborates those of aprevious study using the same socio-dental approach toestimate orthodontic treatment need among Thai chil-dren in that normative need for orthodontic care wasfound to be much higher (35%) than the medium to highpropensity related need (18.9%) [10-12]. High amountsof children's normative treatment need have also beenreported from other countries, ranging from 38% among
primary school children in Turkey to 57% and 30% inrespectively 9 year old- and 12 year old children from UK,for review see [37,38]. Caution should be made whencomparing the estimates of normative need made in thisstudy with those in other studies using the IOTN index forneed assessment. Some caution should also be takenwhen evaluating the results from the present study sincethe overall- and not a malocclusion specific OIDP scoreattributing oral impacts to malocclusion, was used in theanalyses. However, the overall oral disease burden amongthe Tanzanian children investigated was not high [9].Thus, it is less likely that other oral conditions commonlyfound in children have contributed much into the overallOIDP scores. Finally only one of two behaviors (i.e. oralhygiene but not dental attendance) was utilized to assesspropensity related need. As there is no dental health careservice offered on a regular basis to children in Tanzania,behaviors related to compliance with dental appoint-ments were not considered appropriate for use in thepresent study.
ConclusionIn conclusion, contrary to the prevalence of malocclusion,reported psycho social impacts and dissatisfaction withappearance/function was not very frequent among Tanza-nian primary schoolchildren. Subjects with malocclusionreported problems most frequently and malocclusiontogether with other psycho-social impact scores deter-mined children's overall evaluation of their dental appear-ance and function. Finally, a marked difference was foundbetween the standard normative- and socio-dental needassessment approaches with socio-dental needs being fivetimes lower than the standard normative need assess-ment.
Competing interestsThe authors declare that they have no competing interests.
Authors' contributionsANÅ conceived of the study and drafted the manuscript.MM carried out the data collection, made the data amena-ble for statistical analyses, analyzed the data and havecontributed to the development of the paper. She has crit-ically revised the intellectual content of the manuscript.PB has been involved in drafting the manuscript and hascritically revised its intellectual content.
AcknowledgementsThis study was financially supported by the Faculty of Dentistry and the Centre for International Health, University of Bergen. The authors would like to acknowledge the local administrative authorities, The College Research and Publication committee of the Muhimbili University College of Health Sciences, Tanzania for giving permission to conduct this study. Thanks to the teachers for logistics assistance, parents for giving permission and all pupils who volunteered to participate in this study.
Page 9 of 10(page number not for citation purposes)

BMC Oral Health 2008, 8:14 http://www.biomedcentral.com/1472-6831/8/14
Publish with BioMed Central and every scientist can read your work free of charge
"BioMed Central will be the most significant development for disseminating the results of biomedical research in our lifetime."
Sir Paul Nurse, Cancer Research UK
Your research papers will be:
available free of charge to the entire biomedical community
peer reviewed and published immediately upon acceptance
cited in PubMed and archived on PubMed Central
yours — you keep the copyright
Submit your manuscript here:http://www.biomedcentral.com/info/publishing_adv.asp
BioMedcentral
References1. Shaw WC, O'Brien KD, Richmond S, Brook P: Quality control in
orthodontics: risk/benefit considerations. Br Dent J 1991,170(1):33-37.
2. O'Brien K, Kay L, Fox D, Mandall N: Assessing oral health out-comes for orthodontics--measuring health status and qualityof life. Community Dent Health 1998, 15(1):22-26.
3. Bowling A: Measuring health: a review of quality of life meas-urement scales. 2nd edition. Buckingham, Open University Press;1997:XI, 159 s.
4. Zhang M, McGrath C, Hagg U: The impact of malocclusion andits treatment on quality of life: a literature review. Int J Paedi-atr Dent 2006, 16(6):381-387.
5. Jokovic A, Locker D, Stephens M, Kenny D, Tompson B, Guyatt G:Validity and reliability of a questionnaire for measuring childoral-health-related quality of life. J Dent Res 2002,81(7):459-463.
6. Gherunpong S, Tsakos G, Sheiham A: Developing and evaluatingan oral health-related quality of life index for children; theCHILD-OIDP. Community Dent Health 2004, 21(2):161-169.
7. McGrath C, Broder H, Wilson-Genderson M: Assessing theimpact of oral health on the life quality of children: implica-tions for research and practice. Community Dent Oral Epidemiol2004, 32(2):81-85.
8. O'Brien C, Benson PE, Marshman Z: Evaluation of a quality of lifemeasure for children with malocclusion. J Orthod 2007,34(3):185-93; discussion 176.
9. Mtaya M, Astrom AN, Tsakos G: Applicability of an abbreviatedversion of the Child-OIDP inventory among primary school-children in Tanzania. Health Qual Life Outcomes 2007, 5:40.
10. Gherunpong S, Tsakos G, Sheiham A: A sociodental approach toassessing dental needs of children: concept and models. Int JPaediatr Dent 2006, 16(2):81-88.
11. Gherunpong S, Tsakos G, Sheiham A: A socio-dental approach toassessing children's orthodontic needs. Eur J Orthod 2006,28(4):393-399.
12. Gherunpong S, Sheiham A, Tsakos G: A sociodental approach toassessing children's oral health needs: integrating an oralhealth-related quality of life (OHRQoL) measure into oralhealth service planning. Bull World Health Organ 2006,84(1):36-42.
13. Marques LS, Ramos-Jorge ML, Paiva SM, Pordeus IA: Malocclusion:esthetic impact and quality of life among Brazilian school-children. Am J Orthod Dentofacial Orthop 2006, 129(3):424-427.
14. Otuyemi OD, Ogunyinka A, Dosumu O, Cons NC, Jenny J, KohoutFJ, Jakobsen J: Perceptions of dental aesthetics in the UnitedStates and Nigeria. Community Dent Oral Epidemiol 1998,26(6):418-420.
15. Onyeaso CO, Sanu OO: Psychosocial implications of malocclu-sion among 12-18 year old secondary school children inIbadan, Nigeria. Odontostomatol Trop 2005, 28(109):39-48.
16. Onyeaso CO, Aderinokun GA: The relationship between dentalaesthetic index (DAI) and perceptions of aesthetics, functionand speech amongst secondary school children in Ibadan,Nigeria. Int J Paediatr Dent 2003, 13(5):336-341.
17. Onyeaso CO, Aderinokun GA, Arowojolu MO: The pattern ofmalocclusion among orthodontic patients seen in DentalCentre, University College Hospital, Ibadan, Nigeria. Afr JMed Med Sci 2002, 31(3):207-211.
18. Mugonzibwa EA, Kuijpers-Jagtman AM, Van 't Hof MA, Kikwilu EN:Perceptions of dental attractiveness and orthodontic treat-ment need among Tanzanian children. Am J Orthod DentofacialOrthop 2004, 125(4):426-33; discussion 433-4.
19. Mtaya M, Brudvik P, Åstrøm AN: Prevalence of malocclusion andits relationship with socio-demographic factors, dental car-ies and oral hygiene in 12-14 year-old Tanzanian schoolchil-dren. Eur J Orthod in press.
20. Rwakatema DS, Nganga PM, Kemoli AM: Prevalence of malocclu-sion among 12-15-year-olds in Moshi, Tanzania, using Bjork'scriteria. East Afr Med J 2006, 83(7):372-379.
21. Mosha HJ: Primary oral health care. The Tanzanian experi-ence. Odontostomatol Trop 1990, 13(2):55-59.
22. Gilbert GH, Foerster U, Duncan RP: Satisfaction with chewingability in a diverse sample of dentate adults. J Oral Rehabil 1998,25(1):15-27.
23. National Bureau of Statistics. Ministry of Planning, Economyand Empowerment. The United Republic of Tanzania; Regional Profile2004.
24. Lwanga SK, Lemeshow S: Sample size determination in healthstudies: a practical manual. Geneva, World Health Organization;1991:viii, 80 s.
25. Björk , Krebs , Solow : A method for epidemiological registra-tion of malocclusion. Acta Odontol Scand 1964, 22:27-41.
26. al-Emran S, Wisth PJ, Boe OE: Prevalence of malocclusion andneed for orthodontic treatment in Saudi Arabia. CommunityDent Oral Epidemiol 1990, 18(5):253-255.
27. WHO: World Health Organization. Oral health surveys:basic methods. Geneva 1997.
28. Greene JC, Vermillion JR: The Simplified Oral Hygiene Index. JAm Dent Assoc 1964, 68:7-13.
29. Johal A, Cheung MY, Marcene W: The impact of two differentmalocclusion traits on quality of life. Br Dent J 2007, 202(2):E2.
30. Locker D, Jokovic A, Tompson B, Prakash P: Is the Child Percep-tions Questionnaire for 11-14 year olds sensitive to clinicaland self-perceived variations in orthodontic status? Commu-nity Dent Oral Epidemiol 2007, 35(3):179-185.
31. de Oliveira CM, Sheiham A: The relationship between norma-tive orthodontic treatment need and oral health-relatedquality of life. Community Dent Oral Epidemiol 2003, 31(6):426-436.
32. Hollister MC, Weintraub JA: The association of oral status withsystemic health, quality of life, and economic productivity. JDent Educ 1993, 57(12):901-912.
33. Koochek AR, Yeh MS, Rolfe B, Richmond S: The relationshipbetween Index of Complexity, Outcome and Need, andpatients' perceptions of malocclusion: a study in general den-tal practice. Br Dent J 2001, 191(6):325-329.
34. Traebert ES, Peres MA: Prevalence of malocclusions and theirimpact on the quality of life of 18-year-old young male adultsof Florianopolis, Brazil. Oral Health Prev Dent 2005, 3(4):217-224.
35. Locker D: Disparities in oral health-related quality of life in apopulation of Canadian children. Community Dent Oral Epidemiol2007, 35(5):348-356.
36. Astrom AN, Kida IA: Perceived dental treatment need amongolder Tanzanian adults - a cross-sectional study. BMC OralHealth 2007, 7:9.
37. Murray JJ: Whither paediatric dentistry? Int J Paediatr Dent 1998,8(4):235-242.
38. Ugut T, Ciger S, Askoy A, Telli A: An epidemiological surveyusing the treatment priority index (TPI). Eur J Orthod 1998,20:189-193.
Pre-publication historyThe pre-publication history for this paper can be accessedhere:
http://www.biomedcentral.com/1472-6831/8/14/prepub
Page 10 of 10(page number not for citation purposes)

7. APPENDICES I – IX
62


Appendix I


Appendix II


APPENDIX II
Request to participate in the Non-nutritive sucking habits and Oral Quality of Life survey
for children in Tanzania
Dear participant,
We hereby would like to ask you to participate in a study, entitled ‘Non-nutritive sucking
habits in Tanzanian children: Effects on the deciduous and permanent dentition and
oral health related quality of life’ considering your/your child’s occlusion status, dental
health and quality of life. Participation involves completion of a clinical dental
examination and /a personal interview. Participation in the study is voluntary. Through
this study we want to gain information on non-nutritive sucking habits, occlusion status,
oral health status oral health related quality of life in Tanzanian children aged 3-5 and 12-
14 years. Similar studies have been carried out in many countries worldwide but are
scarce in Tanzania and other sub-Saharan African countries. The clinical examination and
the interview will be carried out at the school premises. All information gained through
examination and interview will be treated confidentially. The present study is carried out
by the University of Bergen and Muhimbili University College for health Sciences in
Tanzania.

Serial number Date
CONSENT FORM
(Participating subject/parent)
Title of the project: Non-nutritive sucking habits in Tanzanian children: Effects on
the deciduous and permanent dentition and oral health related quality of life
Name of researcher:
Matilda Mtaya 1. I confirm that I have been informed about the present study. I also
confirm that I had the opportunity to ask questions and that I fully understand the information provided
2. I understand that my participation is voluntary and that I am free to
withdraw at any time with out giving any reason. 3. I accept the invitation to participate in the above study. Name of participant/parent Date Signature (of parent) ____________________________ ____/____/____ __________________ Name of interviewer Date Signature ____________________________ ____/____/____ __________________

Appendix III


i
Appendix III STRUCTURED PERSONAL INTERVIEW FOR CHILDREN 12-14 YEARS (Quality of life, oral health behaviours assessment)
A: Identification details. ID No. ................................................... Name of district ................................................... Urban/rural ................................................... Name of school ................................................... Class ................................................... Stream ................................................... Name of the respondent ................................................... Date of interview ................................................... B: The first questions are about you and your family.
Please choose the answer that fits you the best. Tick only one answer for each question
B1 Age (give your age at last birthday) ................................................... B2 Gender of informant 1. Boy 2. Girl
B3 Where and with whom do you live now? 1. Home with parents 2. Home with guardians
2. Hostel 3. Other (specify)......................
B4 What is your religion?
1. Muslim 2. Christian
3. Hindu
4. No religion

ii
B5 Up to what level did your mother go to school? 1. □ No formal education
2. □ Not completed primary school 3. □ Completed primary school 4. □ Secondary school 5. □ Completed secondary education 6. □ College / university 7. □ Don’t know
B6 Up to what level did your father go to school?
1. □ No formal education 2. □ Not completed primary school 3. □ Completed primary school 4. □ Secondary school 5. □ Completed secondary education 6. □ College / university 7. □ Don’t know
B7 Does any member of your family (with whom you live) own a bicycle?
1. Yes 2. No
B8 Does any member of your family (with whom you live) own a motorcycle?
1. Yes 2. No
B9 Does any member of your family (with whom you live) own a car?
1. Yes 2. No
B10 Does any member of your family (with whom you live) own a television?
1. Yes 2. No
B11 Does any member your family (with whom you live) own a refrigerator?
1. Yes 2. No

iii
B12 How many rooms are there in your home?
1. One
2. Two to five
3. Six or more 4. I don’t have a house B13 What is the main source of cooking fuel at home?
1. Gas cooker
2. Kerosene stove
3. Wood
4. Cow dung
5. Charcoal
6. Electricity
7. Other (specify).......................
C: The following are questions about your mouth and teeth (Oral quality of life- using the OIDP frequency scale)
Please tick only one answer for each statement.
C1) Think back on the previous 3 months, have you experienced the following? Yes No
A Toothache? 1 2
B Sensitive teeth? 1 2
C Tooth exfoliation? 1 2
D Problems with the positioning of your teeth? 1 2
E Ulcer in the mouth? 1 2 F Bleeding in the mouth? 1 2
G Swollen gums? 1 2
H Bad breath? 1 2
I Problems with the colour of your teeth? 1 2
J Problems with spaces for your teeth? 1 2

iv
Please answer the next questions irrespective of the answers to the above problems (tick only one category)
C2) During the past 3 months- how often have problems with your mouth or teeth (for example
such as mentioned above or other) caused you any difficulty with eating and enjoying food?
0 Never
1 Once or twice a month
2 Once or twice a week 3 Everyday/ nearly everyday
C3) What was the actual oral problem(s) that caused your difficulty with eating and enjoying food? Condition Yes No Toothache Sensitive teeth Tooth exfoliation Problems with the position of your teeth Ulcer in the mouth Bleeding in the mouth Swollen gums Bad breath Problems with the colour of your teeth Problems with spaces between your teeth
Other problems C4) During the past 3 months- how often have problems with your mouth or teeth caused you any difficulty with speaking and pronouncing clearly?
0 Never
1 Once or twice a month
2 Once or twice a week 3 Everyday/ nearly everyday

v
C5) What was the actual oral problem(s) that caused your difficulty with speaking and pronouncing clearly? Condition Yes No Toothache Sensitive teeth Tooth exfoliation Problems with the position of your teeth Ulcer in the mouth Bleeding in the mouth Swollen gums Bad breath Problems with the colour of your teeth Problems with spaces between your teeth
Other problems C6) During the past 3 months- how often have problems with your mouth or teeth caused you any difficulty with cleaning teeth?
0 Never
1 Once or twice a month
2 Once or twice a week 3 Everyday/ nearly everyday
C7) What was the actual oral problem(s) that caused your difficulty with cleaning teeth? Condition Yes No Toothache Sensitive teeth Tooth exfoliation Problems with the position of your teeth Ulcer in the mouth Bleeding in the mouth Swollen gums Bad breath Problems with the colour of your teeth Problems with spaces between your teeth
Other problems

vi
C8) During the past 3 months- how often have problems with your mouth or teeth caused you any difficulty with sleeping and relaxing?
0 Never
1 Once or twice a month
2 Once or twice a week 3 Everyday/ nearly everyday
C9) What was the actual oral problem(s) that caused your difficulty with sleeping and relaxing?
C10) During the past 3 months- how often have problems with your mouth or teeth caused you any difficulty with smiling, laughing and showing teeth without embarrassment?
0 Never
1 Once or twice a month
2 Once or twice a week 3 Everyday/ nearly everyday
C11) What was the actual oral problem(s) that caused your difficulty with smiling, laughing and showing teeth without embarrassment? Condition Yes No Toothache Sensitive teeth Tooth exfoliation Problems with the position of your teeth Ulcer in the mouth Bleeding in the mouth Swollen gums Bad breath Problems with the colour of your teeth Problems with spaces between your teeth
Condition Yes No Toothache Sensitive teeth Tooth exfoliation Problems with the position of your teeth Ulcer in the mouth Bleeding in the mouth Swollen gums Bad breath Problems with the colour of your teeth Problems with spaces between your teeth

vii
C12) During the past 3 months- how often have problems with your mouth or teeth caused you any difficulty with maintaining usual emotional state without being irritable?
0 Never
1 Once or twice a month
2 Once or twice a week 3 Everyday/ nearly everyday
C13) What was the actual oral problem(s) that caused your difficulty with maintaining usual emotional state without being irritable? Condition Yes No Toothache Sensitive teeth Tooth exfoliation Problems with the position of your teeth Ulcer in the mouth Bleeding in the mouth Swollen gums Bad breath Problems with the colour of your teeth Problems with spaces between your teeth
C14) During the past 3 months- how often have problems with your mouth or teeth caused you any difficulty with carrying out major school work or social role?
0 Never
1 Once or twice a month
2 Once or twice a week 3 Everyday/ nearly everyday
C15) What was the actual oral problem(s) that caused your difficulty with carrying out major school work or social role? Condition Yes No Toothache Sensitive teeth Tooth exfoliation Problems with the position of your teeth Ulcer in the mouth Bleeding in the mouth Swollen gums Bad breath Problems with the colour of your teeth Problems with spaces between your teeth

viii
C16) During the past 3 months- how often have problems with your mouth or teeth caused you any difficulty with enjoying contact with people?
0 Never
1 Once or twice a month
2 Once or twice a week 3 Everyday/ nearly everyday
C17) What was the actual oral problem(s) that caused your difficulty with enjoying contact with people? Condition Yes No Toothache Sensitive teeth Tooth exfoliation Problems with the position of your teeth Ulcer in the mouth Bleeding in the mouth Swollen gums Bad breath Problems with the colour of your teeth Problems with spaces between your teeth
Reported general & oral health status/perceived treatment needs. Please tick only one answer C 18 What do you think about the state of your teeth?
1. Very good
2. Good
3. Bad
4. Very bad C19 Are you satisfied or dissatisfied with your mouth/teeth?
1. Very satisfied
2. Satisfied
3. Dissatisfied
4. Very dissatisfied

ix
C20 How satisfied or dissatisfied are you with the position of your teeth?
1. Very satisfied
2. Satisfied
3. Dissatisfied
4. Very dissatisfied C21 How satisfied or dissatisfied are you with the appearance of your teeth?
1. Very satisfied
2. Satisfied
3. Dissatisfied
4. Very dissatisfied C22 How satisfied or dissatisfied are you with the colour of your teeth?
1. Very satisfied
2. Satisfied
3. Dissatisfied
4. Very dissatisfied C23 What do you think about the state of your general health?
1. Very good
2. Good
3. Bad
4. Very bad D: The following are questions about your oral health related behaviors? Please tick only one answer for each question. D1 How often do you usually brush your teeth?
1. More than once a day
2. Once a day
3. Several times a week
4. Seldom/Never

x
D2 For cleaning your teeth what do you use? Yes No
A Finger 1 2 B Tooth brush 1 2
C Chewing stick 1 2
D I don’t clean 1 2
E Other (specify) ............................................ D3 With what substance do you clean your teeth? Yes No
A Toothpaste 1 2
B I don’t use anything 1 2 C Other (specify) ..............................................
D4 Have you ever attended dentist? 1. Yes 2. No D5 Think back on the previous 2 years- how often did you attend?
1. Attended more than three times
2. Attended three times
3. Attended twice 4. Attended once 5. Never attended
Think back on the previous 2 years- how often have you taken the following? D6 Biscuits
1. More than once a day
2. Once a day
3. Several times a week
4. Seldom/Never

xi
D7 Chocolates or toffees/sweets 1. More than once a day
2. Once a day
3. Several times a week
4. Seldom/Never
D8 Sugared Ice sticks
1. More than once a day
2. Once a day
3. Several times a week
4. Seldom/Never
D9 Soda (pepsi, coca cola etc)
1. More than once a day
2. Once a day
3. Several times a week 4. Seldom/Never
D10 Sugared fruit juice
1. More than once a day
2. Once a day
3. Several times a week
4. Seldom/Never
D11 Sugared tea/coffee
1. More than once a day
2. Once a day
3. Several times a week
4. Seldom/Never

xii
Sucking habits Please tick only one answer D12 Have you ever sucked your finger/s (or lip, tongue etc)? 1. Yes 2. No D13 If yes, when did you start? _________________________________ D14 When did you stop? _________________________________ D15 How often were you sucking?
1. □ 1 hr/day
2. □ 2-5 hr/day
3. □ ≥ 6 hr/day 9. □ Not applicable
D16 Do you suck your finger/s (or lip, tongue etc) currently? 1. Yes 2. No D17 If yes, how often do you suck?
1. □ 1 hr/day
2. □ 2-5 hr/day
3. □ ≥ 6 hr/day 9. □ Not applicable
D18 Does your sucking activity affect your school performance or socialization with others? 1. Yes 2. No 9. Not applicable D19 Do you have conjoined behaviours with sucking, as listed below?
1. □ Hair pulling (causing hair loss) 2. □ Nose picking 3. □ Genital fondling 4. □ Other (specify)....................... 9. □ Not applicable
D20 Do you frequently perform sucking activity to avoid confrontation?
1. □ Yes 2. □ No 9. □ Not applicable

Appendix IV


1
Kiambatanisho IV Usaili binafsi kwa watoto wa miaka 12-14 (Ubora wa Maisha, kupima tabia za afya ya Kinywa) A: Maelezo ya Utambulisho Namba ya Utambulisho……………………………………. Jina la Wilaya ………………………………………….. Mjini/Vijijini ………………………………………….. Jina la Shule …………..…………………………….. Darasa …………………….. … Mkondo……………………….. Jina la Mtafitiwa ………………………………………. Tarehe ya usaili ………………………………………. B: Maswali ya kwanza ni kukuhusu wewe na familia yako. Tafadhali chagua jibu linalokufaa zaidi. Tia tiki jibu moja tu kwa kila swali B1 Umri (toa umri wako hadi siku ya kuzaliwa iliyopita) B2 Jinsia 1. Mvulana 2. Msichana B3 Sasa unaishi wapi na unaishi na nani?
1 Nyumbani na wazazi 2 Nyumbani na walezi 3 Hosteli 4 Kwingineko (taja)…………………………..
B4 Wewe ni dini gani?
1 Muislamu 2 Mkristo 3 Hindu 4 Sina dini
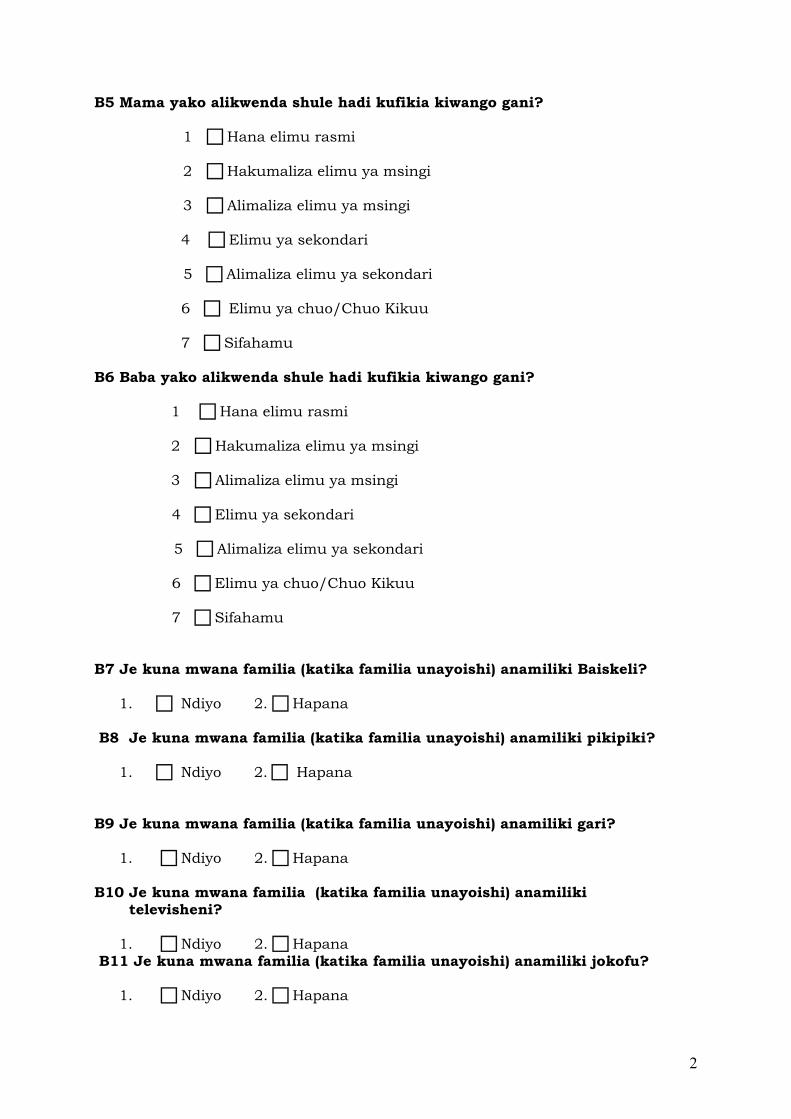
2
B5 Mama yako alikwenda shule hadi kufikia kiwango gani?
1 Hana elimu rasmi
2 Hakumaliza elimu ya msingi
3 Alimaliza elimu ya msingi
4 Elimu ya sekondari
5 Alimaliza elimu ya sekondari 6 Elimu ya chuo/Chuo Kikuu 7 Sifahamu
B6 Baba yako alikwenda shule hadi kufikia kiwango gani?
1 Hana elimu rasmi
2 Hakumaliza elimu ya msingi
3 Alimaliza elimu ya msingi
4 Elimu ya sekondari
5 Alimaliza elimu ya sekondari 6 Elimu ya chuo/Chuo Kikuu 7 Sifahamu
B7 Je kuna mwana familia (katika familia unayoishi) anamiliki Baiskeli? 1. Ndiyo 2. Hapana B8 Je kuna mwana familia (katika familia unayoishi) anamiliki pikipiki? 1. Ndiyo 2. Hapana B9 Je kuna mwana familia (katika familia unayoishi) anamiliki gari? 1. Ndiyo 2. Hapana B10 Je kuna mwana familia (katika familia unayoishi) anamiliki televisheni? 1. Ndiyo 2. Hapana B11 Je kuna mwana familia (katika familia unayoishi) anamiliki jokofu? 1. Ndiyo 2. Hapana

3
B12 Nyumba yenu ina vyumba vingapi?
1 Kimoja
2 Viwili hadi vitano
3 Sita au zaidi
4 Sina nyumba B13 Mnapika kwa kutumia nishati gani hasa hapo nyumbani?
1 Jiko la gesi
2 Jiko la mafuta ya taa
3 Kuni
4 Kinyesi cha ng’ombe
5 Mkaa
6 Umeme
7 Nyingine ………………………….. C: Yafuatayo ni maswali kuhusu kinywa chako na meno yako ( Ubora wa maisha ya kinywa – kwa kutumia skeli ya mrudio wa OIDP) Tafadhali tia tiki kwenye jibu moja tu kwa kila kauli C1 Fikiria nyuma katika miezi mitatu iliyopita, umeshapata lolote kati ya haya yafuatayo? Ndiyo Hapana A Maumivu ya jino? 1. 2. B Meno hisishi/meno kufa ganzi? 1. 2. C Kung’ooka kwa meno ya utoto? 1. 2. D Matatizo ya namna meno yalivyokaa ? 1. 2. E Kidonda kwenye mdomo? 1. 2. F Kutoka damu kwenye mdomo? 1. 2. G Fizi kuvimba? 1. 2. H Harufu mbaya mdomoni? 1. 2.

4
I Matatizo ya rangi ya meno yako? 1. 2. J Matatizo ya nafasi katika meno yako 1. 2 Tafadhali jibu maswali yanayofuata bila kujali majibu uliyotoa kwa maswali ya hapo juu (tiki jibu moja tu) C2 Katika miezi mitatu iliyopita ni mara ngapi umekuwa na matatizo katika kinywa chako au meno (kwa mfano kama yale yaliyotajwa hapo juu au mengine) yaliyokusababishia taabu wakati wa kula na kufaidi chakula?
0 Hata mara moja haijatokea 1 Mara moja au mbili kwa mwezi
2 Mara moja au mbili kwa wiki
3 Kila siku/ karibu kila siku
C3 Ni matatizo gani hasa ya kinywa yaliyokusababishia taabu wakati wa kula na kufaidi chakula? Hali Ndiyo Hapana Maumivu ya jino Meno hisishi (meno kufa ganzi) Kung’ooka kwa meno ya utoto Matatizo ya namna meno yalivyokaa Kidonda kwenye mdomo Kutoka damu kwenye mdomo Fizi kuvimba Harufu mbaya mdomoni Matatizo ya rangi ya meno yako Matatizo ya nafasi katika meno yako C4 Katika miezi mitatu iliyopita ni mara ngapi umekuwa na matatizo katika kinywa chako au meno yaliyokusababishia taabu wakati wa kuzungumza na kutamka kwa uwazi?
0 Hata mara moja haijatokea 1 Mara moja au mbili kwa mwezi
2 Mara moja au mbili kwa wiki
3 Kila siku/ karibu kila siku

5
C5 Ni matatizo gani hasa ya kinywa yaliyokusababishia taabu wakati wa kuzungumza na kusema kwa uwazi? Hali Ndiyo Hapana Maumivu ya jino Meno hisishi (meno kufa ganzi) Kung’ooka kwa meno ya utoto Matatizo ya namna meno yalivyokaa Kidonda kwenye mdomo Kutoka damu kwenye mdomo Fizi kuvimba Harufu mbaya mdomoni Matatizo ya rangi ya meno yako Matatizo ya nafasi katika meno yako C6 Katika miezi mitatu iliyopita ni mara ngapi umekuwa na matatizo katika kinywa chako au meno yaliyokusababishia taabu wakati wa kuyasafisha meno yako?
0 Hata mara moja haijatokea 1 Mara moja au mbili kwa mwezi
2 Mara moja au mbili kwa wiki
3 Kila siku/ karibu kila siku C7 Ni matatizo gani hasa ya kinywa yaliyokusababishia taabu wakati wa kuyasafisha meno yako? Hali Ndiyo Hapana Maumivu ya jino Meno hisishi (meno kufa ganzi) Kung’ooka kwa meno ya utoto Matatizo ya namna meno yalivyokaa Kidonda kwenye mdomo Kutoka damu kwenye mdomo Fizi kuvimba Harufu mbaya mdomoni Matatizo ya rangi ya meno yako Matatizo ya nafasi katika meno yako

6
C8 Katika miezi mitatu iliyopita ni mara ngapi umekuwa na matatizo katika kinywa chako au meno yaliyokusababishia taabu wakati wa kulala na kupumzika?
0 Hata mara moja haijatokea 1 Mara moja au mbili kwa mwezi
2 Mara moja au mbili kwa wiki
3 Kila siku/ karibu kila siku C9 Ni matatizo gani hasa ya kinywa yaliyokusababishia taabu wakati wa kulala na kupumzika? Hali Ndiyo Hapana Maumivu ya jino Meno hisishi (meno kufa ganzi) Kung’ooka kwa meno ya utoto Matatizo ya namna meno yalivyokaa Kidonda kwenye mdomo Kutoka damu kwenye mdomo Fizi kuvimba Harufu mbaya mdomoni Matatizo ya rangi ya meno yako Matatizo ya nafasi katika meno yako C 10 Katika miezi mitatu iliyopita ni mara ngapi umekuwa na matatizo katika kinywa chako au meno yaliyokusababishia taabu katika kutabasamu, kucheka, na kuonyesha meno bila kuona aibu?
0 Hata mara moja haijatokea
1 Mara moja au mbili kwa mwezi 2 Mara moja au mbili kwa wiki
3 Kila siku/ karibu kila siku C11 Ni matatizo gani hasa ya kinywa yaliyokusababishia taabu Katika kutabasamu, kucheka, na kuonyesha meno bila kuona aibu? Hali Ndiyo Hapana Maumivu ya jino Meno hisishi (meno kufa ganzi) Kung’ooka kwa meno ya utoto Matatizo ya namna meno yalivyokaa Kidonda kwenye mdomo Kutoka damu kwenye mdomo Fizi kuvimba Harufu mbaya mdomoni Matatizo ya rangi ya meno yako Matatizo ya nafasi katika meno yako

7
C12 Katika miezi mitatu iliyopita ni mara ngapi umekuwa na matatizo katika kinywa chako au meno yaliyokusababishia taabu katika kuendelea kuwa na hali ya kawaida ya mhemko bila ya kukereka?
0 Hata mara moja haijatokea
1 Mara moja au mbili kwa mwezi 2 Mara moja au mbili kwa wiki
3 Kila siku/ karibu kila siku C13 Ni matatizo gani hasa ya kinywa yaliyokusababishia taabu Katika kuendelea kuwa na hali ya kawaida ya mhemko bila ya kukereka? Hali Ndiyo Hapana Maumivu ya jino Meno hisishi (meno kufa ganzi) Kung’ooka kwa meno ya utoto Matatizo ya namna meno yalivyokaa Kidonda kwenye mdomo Kutoka damu kwenye mdomo Fizi kuvimba Harufu mbaya mdomoni Matatizo ya rangi ya meno yako Matatizo ya nafasi katika meno yako C14 Katika miezi mitatu iliyopita ni mara ngapi umekuwa na matatizo katika kinywa chako au meno yaliyokusababishia taabu katika kufanya kazi kubwa za shule au kutekeleza majukumu ya kijamii?
0 Hata mara moja haijatokea
1 Mara moja au mbili kwa mwezi 2 Mara moja au mbili kwa wiki
3 Kila siku/ karibu kila siku

8
C15 Ni matatizo gani hasa ya kinywa yaliyokusababishia taabu katika kufanya kazi kubwa za shule au kutekeleza majukumu ya kijamii? Hali Ndiyo Hapana Maumivu ya jino Meno hisishi (meno kufa ganzi) Kung’ooka kwa meno ya utoto Matatizo ya namna meno yalivyokaa Kidonda kwenye mdomo Kutoka damu kwenye mdomo Fizi kuvimba Harufu mbaya mdomoni Matatizo ya rangi ya meno yako Matatizo ya nafasi katika meno yako C16 Katika miezi mitatu iliyopita ni mara ngapi umekuwa na matatizo katika kinywa chako au meno yaliyokusababishia taabu kufurahia kukutana na watu?
0 Hata mara moja haijatokea
1 Mara moja au mbili kwa mwezi 2 Mara moja au mbili kwa wiki
3 Kila siku/ karibu kila siku C17 Ni matatizo gani hasa ya kinywa yaliyokusababishia taabu kufurahia kukutana na watu? Hali Ndiyo Hapana Maumivu ya jino Meno hisishi (meno kufa ganzi) Kung’ooka kwa meno ya utoto Matatizo ya namna meno yalivyokaa Kidonda kwenye mdomo Kutoka damu kwenye mdomo Fizi kuvimba Harufu mbaya mdomoni Matatizo ya rangi ya meno yako Matatizo ya nafasi katika meno yako

9
Taarifa ya afya kwa ujumla & Hali ya afya ya kinywa/mahitaji ya matibabu. Tafadhali tiki jibu moja tu. C18 Unaifikiria vipi hali ya meno yako?
1 Nzuri sana 2 Nzuri
3 Mbaya
4 Mbaya sana
C19 Unaridhika au huridhiki na hali ya kinywa chako/meno yako?
1 Ninaridhika sana 2 Ninaridhika
3 Siridhiki
4 Siridhiki kabisa
C20 Unaridhika au huridhiki kwa kiasi gani na jinsi meno yako yalivyokaa?
1 Ninaridhika sana 2 Ninaridhika
3 Siridhiki
4 Siridhiki kabisa
C21 Unaridhika au huridhiki kwa kiasi gani na jinsi meno yako yanavyoonekana?
1 Ninaridhika sana 2 Ninaridhika
3 Siridhiki
4 Siridhiki kabisa
C22 Unaridhika au huridhiki kwa kiasi gani na rangi ya meno yako?
1 Ninaridhika sana 2 Ninaridhika
3 Siridhiki
4 Siridhiki kabisa
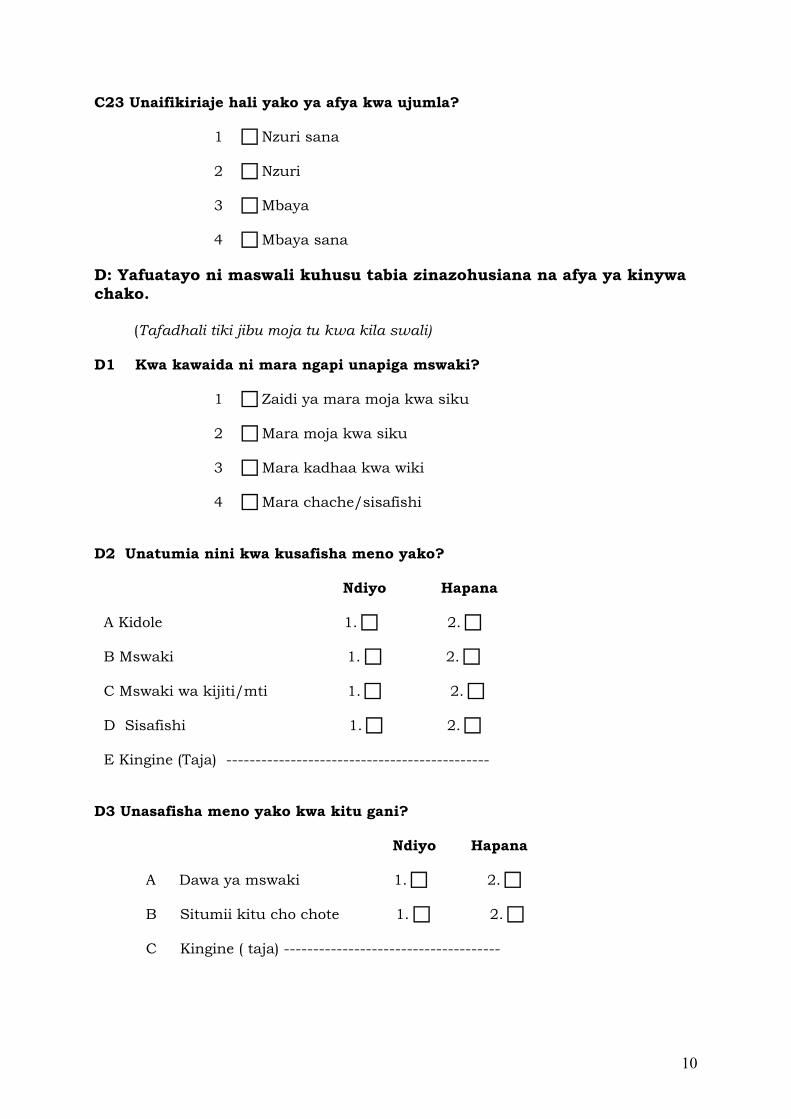
10
C23 Unaifikiriaje hali yako ya afya kwa ujumla?
1 Nzuri sana 2 Nzuri
3 Mbaya
4 Mbaya sana
D: Yafuatayo ni maswali kuhusu tabia zinazohusiana na afya ya kinywa chako. (Tafadhali tiki jibu moja tu kwa kila swali) D1 Kwa kawaida ni mara ngapi unapiga mswaki?
1 Zaidi ya mara moja kwa siku 2 Mara moja kwa siku
3 Mara kadhaa kwa wiki
4 Mara chache/sisafishi
D2 Unatumia nini kwa kusafisha meno yako? Ndiyo Hapana A Kidole 1. 2. B Mswaki 1. 2. C Mswaki wa kijiti/mti 1. 2. D Sisafishi 1. 2. E Kingine (Taja) --------------------------------------------- D3 Unasafisha meno yako kwa kitu gani? Ndiyo Hapana A Dawa ya mswaki 1. 2. B Situmii kitu cho chote 1. 2. C Kingine ( taja) -------------------------------------

11
D4 Umeshawahi kwenda kwa daktari wa meno? 1. Ndiyo 2. Hapana D5 Fikiria nyuma katika miaka miwili iliyopita, ni mara ngapi umehudhuria kwa daktari wa meno?
1 Nimehudhuria zaidi ya mara tatu 2 Nimehudhuria mara tatu 3 Nimehudhuria mara mbili 4 Nimehudhuria mara moja 5 Sijahudhuria hata mara moja
Fikiria nyuma katika miaka miwili iliyopita, ni mara ngapi umekula vitu vifuatavyo? D6 Biskuti
1. Zaidi ya mara moja kwa siku 2. Mara moja kwa siku 3. Mara kadhaa kwa wiki 4. Sijawahi kula biskuti
D7 Chokoleti/tofi/peremende
1. Zaidi ya mara moja kwa siku 2. Mara moja kwa siku 3. Mara kadhaa kwa wiki 4. Sijawahi kula chokoleti/tofi wala peremende
D8 Barafu (zenye sukari/iskrimu)
1 Zaidi ya mara moja kwa siku 2 Mara moja kwa siku 3 Mara kadhaa kwa wiki 4 Sijawahi kutumia
D9 Soda (pepsi, coca cola n.k)
1 Zaidi ya mara moja kwa siku 2 Mara moja kwa siku 3 Mara kadhaa kwa wiki 4 Sijawahi kutumia
D10 Maji ya matunda yenye sukari
1 Zaidi ya mara moja kwa siku 2 Mara moja kwa siku 3 Mara kadhaa kwa wiki
4 Sijawahi kula

12
D11 Chai/ kahawa yenye sukari
1 Zaidi ya mara moja kwa siku 2 Mara moja kwa siku 3 Mara kadhaa kwa wiki
4 Sijawahi kutumia Tabia ya kunyonya vidole/mdomo/ulimi n.k. Tafadhali tiki jibu moja tu. D12 Je umewahi kunyonya kidole( au mdomo,ulimi n.k.)? 1. Ndiyo 2. Hapana D13 Kama ndiyo ulianza lini? ----------------------------------- D14 Uliacha lini? ------------------------------------ D15 Ulikuwa unanyonya kwa muda gani?
1. saa moja kwa siku 2. masaa 2-5 kwa siku 3. zaidi ya masaa 6 kwa siku 9. Haihusiki
D16 Unanyonya kidole ( au mdomo, ulimi n.k) hivi sasa ? 1. Ndiyo 2. Hapana D17 Kama ndiyo, unanyonya kwa muda gani?
1 saa moja kwa siku 2 masaa 2-5 kwa siku 3 zaidi ya masaa 6 kwa siku
9 Haihusiki D18 Je kitendo chako cha kunyonya kinaathiri maendeleo yako shuleni au kujihusisha na watoto wengine? 1 Ndiyo 2. Hapana 9 Haihusiki D19 Je una tabia zinazoambatana na kunyonya kidole/mdomo n.k. kama zilivyoorodheshwa hapo chini?
1 Kuvuta nywele (kunakosababisha kupoteza nywele) 2 Kuchokonoa puani
3 Kuchezea sehemu za siri 4 Nyingine (taja)………………….
9 Haihusiki
13
D20 Je mara kwa mara huwa unanyonya kidole/mdomo n.k. ili kuepuka ugomvi? 1. Ndiyo 2. Hapana 3. Haihusiki


Appendix V


i
Appendix V CLINICAL EXAMINATION FORM FOR PRIMARY SCHOOL CHILDREN (12-14 yrs) Date of interview ---------------------- ID NO ---------------------------------- Gender (M= 1, F= 2) Name ---------------------------------- DATE OF BIRTH:____ /____/ _______
School --------------------------------- Class ---------- Stream ----------
District (Kinondoni=1, Temeke=2) Place of residence (1= Urban, 2= rural)
I) FUNCTIONAL CHARACTERISTICS 1) Swallowing (1= normal, 2= tonguethrusting, 3= contraction of mentalis) 2) Habit (1=No, 2= Yes) 3) What do you actually suck? (1=Finger, 2=lip, 3=tongue, 9= not applicable) 4) Duration ---------- 5) Speech problems (1=No, 2= Yes) II) DENTITION STATUS (DMFT)
Upper right Upper left 18 17 16 15 14 13 12 11 21 22 23 24 25 26 27 28 Lower right Lower left 48 47 46 45 44 43 42 41 31 32 33 34 35 36 37 38 Tooth codes (WHO, 1997): 0=Sound tooth 1=Decayed 2=Filled with decay 3=Filled no decay
4=Missing due to caries 5=Missing any other reason 6=Fissure sealant 7=Bridge abutment, special crown veneer
8=Un-erupted crown 9=Not recorded T=Trauma/fracture

ii
III) Simplified Oral Hygiene Index (Greene and Vermillion, 1964): Oral Debris: Upper right upper left 16(B) 11(L) 26(B) Lower right Lower left 46(L) 31(L) 36(L)
Oral Debris: 0= No debris or stain present 1= Soft debris covering not more than one 3rd of
the tooth surface being examined/the presence of extrinsic stains without debris regardless of surface area covered
2= Soft debris covering more than one 3rd but not more than two 3rds of the exposed tooth surface.
3= Soft debris covering more than two 3rd of the exposed tooth surface.
Oral Calculus:Upper right Upper left 16(B) 11(L) 26(B) Lower right Lower left 46(L) 31(L) 36(L)
Oral Calculus: 0= No calculus present 1= Supragingival calculus covering not more
than one 3rd of the exposed tooth surface being examined.
2= Supragingival calculus covering more than one 3rd but not more than two 3rds of the exposed tooth surface or the presence of individual flecks of subgingival calculus around the cervical portion of the tooth.
3= Supragingival calculus covering more than one 3rd of the exposed tooth surface or a continuous heavy band of subgingival calculus around the cervical portion of the tooth.
IV) OCCLUSION (Björk et al., 1964, with slight modification): Sagittal 1. Maxillary overjet 1 = grade 1 (1-4.9 mm) 2 = grade 2 (5-8.9 mm) 3 = grade 3 (9 mm or more)
9= not registered 2. Mandibular overjet 0 = absent 1 = grade 1 (<0 to-1.9 mm)
2 = grade 2 (≤-2 mm) 3. Angle Classification 1 = class I 2 = class II (occlusion distal to Cl. I relation) 3 = class III (occlusion mesial to Cl. I relation)
9= not registered

iii
Vertical 4. Deep bite 1 = grade 1 (0.1-2.9 mm, overlapping of the upper & lower right incisors) 2 = grade 2 (3-4.9 mm) 3 = grade 3 (5 mm or more)
9= not registered 5. Open bite 0 = absent 1 = frontal open bite grade 1 (0-1.9 mm)
2 = frontal open bite grade 2 (2 mm or more) 3= lateral open bite Transversal 6. Crossbite (crossbite of one or more teeth in the side segments) 1 = absent
2 = present unilateral 3= present bilateral 7. Midline shift (if the displacement in relation to the midline of the face was ≥2 mm) 1 = absent 2 = present 8. Scissor bite (Scissor bite of one or more teeth in the side segments) 1 = absent
2 = present unilateral 3= present bilateral
9. Crowding (of ≥2mm in a segment) 1 = absent
2 = present upper jaw 3= present lower jaw 4= present both jaws 10. Spacing (≥ 2mm in a segment) 1 = absent
2 = present upper jaw 3= present lower jaw 4= present both jaws

iv

Appendix VI


i
Appendix VI STRUCTURED PERSONAL INTERVIEW FOR PARENTS A: Identification details. ID No. ................................................... Name of district ................................................... Urban/rural ................................................... Name of child’s school ................................................... Child’s class ................................................... Name of the respondent ................................................... Date of interview ...................................................
B: Social demographic details B1 Age (give your age at last birthday) ................................................... B2 Gender 1. Male 2. Female B3 Relationship with the child 1. Parent 2. Guardian B4 Religion
1. □ Muslim 2. □ Christian 3. □ Hindu 4. □ No religion
B5 Education
1. □ No formal education 2. □ Not completed primary school 3. □ Completed primary school 4. □ Secondary school 5. □ Completed secondary education 6. □ College / university 7. □ Don’t know
B6 Does any member of your family (with whom you live) own a bicycle?

ii
1. Yes 2. No
B7 Does any member of your family (with whom you live) own a motorcycle?
1. Yes 2. No
B8 Does any member of your family (with whom you live) own a car?
1. Yes 2. No
B9 Does any member of your family (with whom you live) own a television?
1. Yes 2. No
B10 Does any member of your family (with whom you live) own a refrigerator?
1. Yes 2. No
B11 How many rooms are there in your home?
1. One
2. Two to five
3. Six or more 4. I don’t have a house B12 What is the main source of cooking fuel at home?
1. Gas cooker
2. Kerosene stove
3. Wood
4. Cow dung
5. Charcoal
6. Electricity
7. Other (specify).......................
B13 What is your child’s birth rank?
1. First born
2. Last born
3. Other (specify).......................

iii
C. Sucking habits C1 Have your child ever sucked finger/lip or dummy? 1. Yes 2. No
C2 If yes, what was your child actually sucking?
1. □ Thumb/finger 2. □ Dummy 3. □ Combined finger and dummy 4. □ Lip 5. □ Other (specify)__________________ 9. □ Not applicable
C3 At what age did he/she started the habit? _________________________________ C4 At what age did he/she stopped? _________________________________ C5 How often were he/she sucking?
1. □ 1 hour a day
2. □ 2-5 hours a day
3. □ ≥ 6 hours a day 9. □ Not applicable
C6 Does your child suck finger/lip or dummy currently? 1. Yes 2. No C7 If yes, what is your child actually sucking?
1. □ Thumb/finger 2. □ Dummy 3. □ Combined finger and dummy 4. □ Lip 5. □ Other (specify)__________________ 9. □ Not applicable
C8 How often does he/she suck?
1. □ 1 hour a day
2. □ 2-5 hours a day
3. □ ≥ 6 hours a day

iv
9. □ Not applicable C9 Does the sucking activity of your child affect his/her school performance or socialization with others?
1. Yes 2. No 9. □ Not applicable C10 Does your child have a conjoined behaviour with sucking, as listed below?
1. □ Hair pulling (causing hair loss) 2. □ Genital fondling 3. □ Other (specify)__________________ 9. □ Not applicable
C11 Does your child frequently retreat to the sucking behaviour to avoid confrontation?
1. Yes 2. No 9. □ Not applicable D. Attitudes of parents towards sucking habits D1 Do you accept sucking habit (finger/dummy/lip sucking etc) of your child?
1. □ No, I don’t accept at all 2. □ Yes, up to 3-4 years of age 4. □ Other (specify)__________________ 9. □ Not applicable
D2 Will you attempt to intervene the habit?
1. □ Yes 2. □ No 9. □ Not applicable D3 Why will you intervene?
1. □ Because of its effect on dental occlusion 2. □ Because of its effect on the finger/s 3. □ Because of its psychosocial effect on the child 4. □ Because of its effect on the child’s speech 5. □ Because it causes loss of appetite on the child 6. □ Because it causes microbial transmission 7. □ Other (specify)_____ 9. □ Not applicable
D4 Will you seek dental advice concerning the habit?
1. □ Yes 2. □ No 9. □ Not applicable

v
D5 Will you seek paediatrician advice concerning the habit? 1. □ Yes 2. □ No 9. □ Not applicable
D6 If your child had the habit in the past, did you accept it?
1. □ No, I did not accepted it at all 2. □ Yes, up to 3-4 years of age 4. □ Other (specify)__________________ 9. □ Not applicable
D7 Did you try to intervene?
1. □ Yes 2. □ No 9. □ Not applicable D8 Why did you intervene?
1. □ Because of its effect on dental occlusion 2. □ Because of its effect on the finger/s 3. □ Because of its psychosocial effect on the child 4. □ Because of its effect on the child’s speech 5. □ Because it causes loss of appetite on the child 6. □ Because it causes microbial transmission 7. □ Other (specify)_____ 9. □ Not applicable
D9 Did you seek dental advice concerning the habit?
1. □ Yes 2. □ No 9. □ Not applicable D10 Did you seek paediatrician advice concerning the habit?
1. □ Yes 2. □ No 9. □ Not applicable D11 What technique/s did you use to stop the habit in your child?
1. □ Bitter taste (substances on the digit/dummy) 2. □ Reinforcement (reward) 3. □ Tape 4. □ Socks or gloves 5. □ Hot sauce 6. □ wrapping the hand 7. □ Physical punishment 8. □ Other (specify)__________________

vi
9. □ Not applicable E. Feeding methods E1 How was your child fed during the first 6 months of infancy?
1. □ was breastfed 2. □ was bottle fed 3. □ was fed with a cup 4. □ was breastfed and fed with a cup 5. □ was bottle fed and fed with a cup
E2 How long was your child breastfed? 1. □ ≥ 2 years 2. □ ≥ 6 months, but < 2 years 3. □ 1-5 months 4. □ was not breastfed at all 9. □ Not applicable
E3. How often was your child breastfed?
1. □ At will 2. □ Hourly 3. □ few times a day 9. □ Not applicable E4. How long was your child bottle fed?
1. □ ≥ 2 years 2. □ ≥ 6 months, but < 2 years 3. □ 1-5 months 9. □ Not applicable
E5. At what age was your child weaned?
1. □ at 4 months 2. □ at ≥ 6 months 3. □ weaned and breastfed at the same time

Appendix VII


1
Kiambatanisho VII USAILI BINAFSI KWA WAZAZI A: Maelezo ya Utambulisho Namba ya Utambulisho……………………………………. Jina la Wilaya ………………………………………….. Mjini/Vijijini ………………………………………….. Jina la Shule ya mtoto …………………………….. Darasa analosoma mtoto ………………………….. Jina la Mtafitiwa ………………………………………. Tarehe ya usaili ………………………………………. B: Maelezo ya Kijamii na Kidemografia B1 Umri (toa umri wako hadi tarehe ya kuzaliwa iliyopita) B2 Jinsia 1. Mme 2. Mke B3 Uhusiano na mtoto 1. Mzazi 2. Mlezi B4 Dini
1 Muislamu 2 Mkristo
3 Hindu
4 Sina Dini
B5 Elimu
1 Sina elimu rasmi 2 Sijamaliza elimu ya msingi
3 Nimemaliza elimu ya msingi
4 Elimu ya sekondari 5 Nimemaliza elimu ya sekondari 6 Elimu ya Chuo/Chuo Kikuu 7 Sifahamu

2
B6 Je kuna mwana familia (katika familia unayoishi) anamiliki Baiskeli? 1. Ndiyo 2. Hapana B7 Je kuna mwana familia (katika familia unayoishi) anamiliki pikipiki? 1. Ndiyo 2. Hapana B8 Je kuna mwana familia (katika familia unayoishi) anamiliki gari? 1. Ndiyo 2. Hapana B9 Je kuna mwana familia (katika familia unayoishi) anamiliki televisheni? 1. Ndiyo 2. Hapana B10 Je kuna mwana familia (katika familia unayoishi) anamiliki jokofu? 1. Ndiyo 2. Hapana B11 Nyumba yenu ina vyumba vingapi?
1 Kimoja 2 Viwili hadi vitano
3 Sita au zaidi
4 Sina nyumba
B12 Mnapika kwa kutumia nishati gani hasa hapo nyumbani?
1 Jiko la gesi 2 Jiko la mafuta ya taa 3 Kuni
4 Kinyesi cha ng’ombe 5 Mkaa
6 Umeme 7 Nyingine
B13 Huyu mtoto wako ni wangapi katika kuzaliwa?
1 Wa Kwanza kuzaliwa 2 Wa mwisho kuzaliwa 3 Nyingine (taja) ……………….

3
C Tabia ya Kunyonya Vidole/mdomo au kidanganyio C1 Mtoto wako amewahi kunyonya kidole/mdomo au kidanganyio? 1. Ndiyo 2. Hapana C2 Kama ndiyo, Mtoto wako alikuwa ananyonya kitu gain hasa? 1 Kidole 2 Kidanganyio/nyonyo bandia 3 Vyote, kidole na kidanganyio 4 Mdomo 5 Kingine (taja)----------------------- 9 Haihusiki C3 Alianza tabia hii akiwa na umri gani? ---------------------------- C4 Aliacha tabia hii akiwa na umri gani? --------------------------- C5 Alikuwa ananyonya kwa muda gani katika siku moja?
1 Saa moja kwa siku 2 Masaa 2-5 kwa siku
3 Zaidi ya masaa sita kwa siku
9 Haihusiki
C6 Mtoto wako sasa ananyonya kidole/mdomo au kidanganyio? 1. Ndiyo 2. Hapana C7 Kama jibu ni ndiyo mtoto wako ananyonya nini hasa? 1 Kidole 2 Kidanganyio/nyonyo bandia 3 Vyote, kidole na kidanganyio 4 Mdomo 5 Kingine (taja)----------------------- 9 Haihusiki C8 Ananyonya kwa muda gani kwa siku?
1 Saa moja kwa siku
2 Masaa 2-5 kwa siku
3 Zaidi ya masaa sita kwa siku
9 Haihusiki

4
C9 Je kitendo cha kunyonya anachofanya mtoto wako kinaathiri maendeleo yake shuleni au kujihusisha na watoto wengine? 1. Ndiyo 2. Hapana 9 haihusiki C10 Je mtoto wako ana tabia zinazoambatana na kunyonya kidole/mdomo n.k. kama zilivyoorodheshwa hapa chini?
1. Kuvuta nywele (kunakosababisha kupoteza nywele) 2. Kuchezea sehemu za siri
3. Nyingine (taja)………………….
9. Haihusiki
C11 Je mtoto wako mara kwa mara huwa ananyonya kidole/mdomo n.k. ili kuepuka ugomvi? 1. Ndiyo 2. Hapana 9. Haihusiki D Mwelekeo wa wazazi kuhusu tabia ya kunyonya D1 Je unaikubali tabia ya kunyonya( kidole/kidanganyio/mdomo) ya mtoto wako?
1 Hapana, siikubali kabisa 2 Ndiyo, hadi umri wa miaka 3-4 3 Mengineyo (taja) ……………………. 9 Haihusiki
D2 Je utajaribu kuingilia kati tabia hii (ili aache)? 1. Ndiyo 2. Hapana 9. Haihusiki D3 Kwa nini utaingilia kati tabia hii? 1 Kwa sababu ya athari zake kwa mpangilio wa meno 2 Kwa sababu ya athari zake kwa kidole/vidole 3 Kwa sababu ya athari za kisaikolojia na kijamii kwa mtoto 4 Kwa sababu ya athari zake kwa kuongea kwa mtoto 5 Kwa sababu inasababisha mtoto kukosa hamu ya kula 6 Kwa sababu inasababisha maambukizi ya vijidudu vya maradhi 7 Nyingine (taja)--------------------------------------------- 9 Haihusiki D4 Je utaomba ushauri kutoka kwa daktari wa meno kuhusiana na tabia hii? 1. Ndiyo 2. Hapana 9. Haihusiki

5
D5 Je utaomba ushauri kutoka kwa daktari wa watoto kuhusiana na tabia hii? 1. Ndiyo 2. Hapana 9. Haihusiki D6 Kama mtoto wako alikuwa na tabia hii hapo nyuma, je uliikubali? 1 Hapana, siikubali kabisa
2 Ndiyo, hadi umri wa miaka 3-4 3 Mengineyo (taja) ----------------------
9 Haihusiki D7 Ulijaribu kuingilia kati tabia hiyo (ili aache)? 1. Ndiyo 2. Hapana 9. Haihusiki D8 Kwa nini uliingilia kati? 1 Kwa sababu ya athari zake kwa mpangilio wa meno 2 Kwa sababu ya athari zake kwa kidole/vidole 3 Kwa sababu ya athari za kisaikolojia na kijamii kwa mtoto 4 Kwa sababu ya athari zake kwa kuongea kwa mtoto 5 Kwa sababu inasababisha mtoto kukosa hamu ya kula 6 Kwa sababu inasababisha maambukizi ya vijidudu vya maradhi 7 Nyingine (taja)-----------------------
9 Haihusiki D9 Je uliwahi kuomba ushauri kutoka kwa daktari wa meno kuhusiana na tabia hii? 1. Ndiyo 2. Hapana 9. Haihusiki
D10 Je Uliwahi kuomba ushauri kutoka kwa daktari wa watoto kuhusiana na tabia hii? 1. Ndiyo 2. Hapana 9. Haihusiki D11 Ni mbinu gani uliitumia/ ulizitumia kufanya motto wako aache tabia hiyo? 1 Kuweka mwonjo wenye uchungu (kwenye kidole au kidanganyio) 2 Kumhimiza ( kwa kutoa zawadi) 3 Kumweka gundi ya karatasi (tape)
4 Kumvisha soksi au glovu 5 Kumwekea pilipili
6 Kuviringisha kitu kwenye mkono
7 Adhabu ya kumpiga

6
8 Nyingine (taja) ---------------------
9 Haihusiki. E. Mbinu za Kumlisha Mtoto E1 Mtoto wako alikuwa analishwa namna gani katika kipindi cha miezi sita ya kwanza ya utoto?
1 Alinyonyeshwa maziwa ya mama 2 Alinyonyeshwa kwa chupa 3 Alilishwa kwa kikombe 4 Alinyonyeshwa maziwa ya mama na kulishwa kwa kikombe 5 Alinyonyeshwa kwa chupa na kulishwa kwa kikombe
E2 Mtoto wako alinyonyeshwa maziwa ya mama kwa muda gani?
1 Zaidi ya miaka miwili 2 Zaidi ya miezi 6 lakini chini ya miaka miwili 3 Mwezi 1-5 4 Hakunyonyeshwa maziwa ya mama kabisa
9 Haihusiki E3 Mtoto wako alinyonyeshwa maziwa ya mama mara ngapi? 1. Kila anapotaka 2. kila saa 3. mara chache kwa siku 9. Haihusiki E4 Mtoto wako alinyonyeshwa kwa chupa kwa muda gani?
1 Zaidi ya miaka miwili 2 Zaidi ya miezi 6 lakini chini ya miaka miwili 3 Mwezi 1-5
9 Haihusiki E5 Mtoto wako alianzishiwa chakula cha kawaida akiwa na umri gani?
1. Alipokuwa na miezi minne 2. Alipokuwa na zaidi ya miezi 6
3. Alianzishiwa chakula cha kawaida na kunyonyeshwa maziwa ya mama wakati huo huo.

Appendix VIII


i
Appendix VIII CLINICAL EXAMINATION FORM FOR PRESCHOOL CHILDREN (3-5 yrs) Date of interview --------------------- ID NO ---------------------------------- Gender (M= 1, F= 2) Name ---------------------------------- DATE OF BIRTH:____ /____/ _______
School --------------------------------- Class ---------- Age ----------
District (Kinondoni=1, Temeke=2) Place of residence (1= Urban, 2= rural) I) FUNCTIONAL CHARACTERISTICS 1) Swallowing (1= normal, 2= tonguethrusting, 3= contraction of mentalis) 2) Habit (1=No, 2= Yes) 3) What type? (1= finger, 2= lip, 3= tongue, 4= not applicable) 4) Duration ----- 5) Speech problems (1=No, 2= Yes) IV) OCCLUSION (Björk et al., 1964, with slight modification): Sagittal 1. Maxillary overjet 1 = grade 1 (1-4.9 mm) 2 = grade 2 (5-8.9 mm) 3 = grade 3 (9 mm or more)
9= not registered 2. Mandibular overjet 0 = absent 1 = grade 1 (<0 to-1.9 mm)
2 = grade 2 (≤-2 mm) 3. Angle Classification 1 = class I 2 = class II (occlusion distal to Cl. I relation)
3 = class III (occlusion mesial to Cl. I relation) 9= not registered

ii
Vertical 4. Deep bite 1 = grade 1 (0.1-2.9 mm, overlapping of the upper & lower right incisors) 2 = grade 2 (3-4.9 mm) 3 = grade 3 (5 mm or more)
9= not registered 5. Open bite 0 = absent 1 = frontal open bite grade 1 (0-1.9 mm)
2 = frontal open bite grade 2 (2 mm or more) 3= lateral open bite Transversal 6. Crossbite (crossbite of one or more teeth in the side segments) 1 = absent
2 = present unilateral 3= present bilateral 7. Midline shift (if the displacement in relation to the midline of the face was ≥ 2 mm) 1 = absent 2 = present 8. Scissor bite (Scissor bite of one or more teeth in the side segments) 1 = absent
2 = present unilateral 3= present bilateral
9. Crowding (of ≥2mm in a segment) 1 = absent
2 = present upper jaw 3= present lower jaw 4= present both jaws 10. Spacing (≥ 2mm in a segment) 1 = absent
2 = present upper jaw 3= present lower jaw 4= present both jaws

Appendix IX


APPENDIX IX
ERRATA
We regret that some errors occurred in the following papers.
Paper II
Abstract: results section, last line; “problems eating” corrected to “problems with eating” and
“cause of impacts” corrected to “causes of impacts”.
Methods (Interview variables): paragraph 1, 3rd line; “cleaning mouth” corrected to “cleaning
teeth” and frequency option (3) “very day” corrected to “every day”. Paragraph 2, last
line; a comma should be placed between lip and tongue.
Discussion: paragraph 1, 6th line “Cronbach’a alpha” corrected to “Cronbach’s alpha”.
Paper III
Table 1: variables column, 1st row; “sex e” corrected to “sex”.
Tables 2, 3 and 4: socio demographics column, 10th row; “14” corrected to “14 yr”.