malnutrition in south-asia poverty, diet or lack of female ... · public debate on international...
TRANSCRIPT

Malnutrition in South-Asia Poverty, diet or lack of female empowerment?
Magnus Hatlebakk
WP 2012: 4

Chr. Michelsen Institute (CMI) is an independent, non-profit research institution and a major international centre in policy-oriented and applied development research. Focus is on development and human rights issues and on international conditions that affect such issues. The geographical focus is Sub-Saharan Africa, Southern and Central Asia, the Middle East and Latin America.
CMI combines applied and theoretical research. CMI research intends to assist policy formulation, improve the basis for decision-making and promote public debate on international development issues.

Malnutrition in South-Asia
Poverty, diet or lack of female empowerment?
Magnus Hatlebakk*
WP 2012: 4
* Chr. Michelsen Institute (CMI), P.O. Box 6033, 5892 Bergen, Norway. Tel: +47 47 93 80 00. Fax: +47 47 93 80 01. [email protected].

ii
Project number 25128 Project title Economic determinants of food intake and health outcomes in Nepal
iii
Contents Abstract .......................................................................................................................................................... iv
Acknowledgements ......................................................................................................................................... iv
1. Introduction ............................................................................................................................................. 1
2. Theoretical approach ............................................................................................................................... 2
3. Model ...................................................................................................................................................... 4
4. Methodological issues ............................................................................................................................. 6
5. Data ......................................................................................................................................................... 7
6. Results ..................................................................................................................................................... 8
7. Conclusions ............................................................................................................................................ 13
References ..................................................................................................................................................... 14

CMI WORKING PAPER Malnutrition in South-Asia: Poverty, diet or lack of female empowerment? WP 2012:4
iv
Abstract Despite economic growth, and a reduction in poverty, malnutrition is still rampant in South-Asia. This indicates that non-economic factors are important, and we use a nation-wide survey from Nepal to identify factors that may explain why small children are stunted. In contrast to designated studies of child nutrition we do not have information on individual food intake, but we demonstrate that analysis of large sample surveys is a good supplement to designated studies, with the main benefit being that findings are nationally representative. We find that pulses are critical for child growth, and that boys are more often malnourished, maybe because they are expected to take other food than breast milk. Furthermore we find that girls are more likely malnourished if they have many older brothers, and we find that female empowerment improves child nutrition.
Acknowledgements The research is funded by the Research Council of Norway (RCN) via a project with the Center for International Health, University of Bergen.

CMI WORKING PAPER Malnutrition in South-Asia: Poverty, diet or lack of female empowerment? WP 2012:4
1
1. Introduction Malnutrition is still a major problem in South-Asia despite economic growth and reduction in poverty as about half of the children below five are stunted (47% in 2008 according to WDI)1
It is a puzzle beyond Nepal that income poverty and malnutrition are not necessarily linked. Sub-Saharan Africa has similar poverty levels as South-Asia, but lower levels of malnutrition, although the differences are not major if one look into countries with similar poverty levels
. While poverty in Nepal declined from 42% in 1995 to 31% in 2003 (CBS, 2005), the extent of stunting was stable at 57% in 1996 and 2001, and then declined to 49% in 2006 (DHS, 2006). As stunting is measured for children up to five years old, and the first year is probably the most essential, the decline from 2001 to 2006 will reflect the economic situation from 1996 to 2001. So the decline in stunting may reflect the improved economic conditions as reflected in the decline in poverty from 1995 to 2003. However, the improvement may also reflect improved health conditions (which may or may not be a function of economic conditions) as reflected in the decline in child mortality (below five years old) from 11.7% in 1995 via 8.5% in 2000 to 6.2% in 2005. But we note that child mortality has gradually declined, while there appears to be a shift in nutrition patterns around 1995. In this paper we will dig deeper into these patterns using a household survey from 1995.
2
1 World Development Indicators (WDI): http://databank.worldbank.org. Stunting means that the height for a certain age, measured in months, is more than two standard deviations below the median taken from a reference population.
. While approximately 47% of the children are stunted in Nepal, Bangladesh and India, the average is 42% in Sub-Saharan Africa with Nigeria and Tanzania having prevalence of stunting in this range, while countries like Malawi and Ethiopia are even worse off than South-Asia according to WDI.
2 For a good discussion of food intake and malnutrition in India, see Deaton and Dreze (2009). They also have references to the differences with Sub-Saharan Africa, where they argue that the worst off countries are comparable to South-Asia.

CMI WORKING PAPER Malnutrition in South-Asia: Poverty, diet or lack of female empowerment? WP 2012:4
2
2. Theoretical approach We study stunting, which is the result of a biological process where small children (we focus on children below two years of age) do not grow to their theoretical potential. The potential is defined by the growth of healthy children as defined by reference tables from the World Health Organization3
Malnutrition is the result of the amount and type of food eaten. Children need staples, such as rice, but also vegetables, legumes and, if affordable, meat and fish. We will attempt to separate the effects of amount and type of food, that is, what is the role of different food items for child growth when we control for the food budget? Ideally we should measure the food intake of each child, and others have done so in Nepal, see Shankar et al. (1998 and 2001), and for a broader study that also focuses on Nepal, see Gittelsohn (1991). Such studies are normally on relatively small samples from specific locations. And they are hard to do as the food is prepared in large containers and one will have to measure the food of each person after it is distributed but before it is eaten, with this potentially affecting the allocation of food during the measurement period.
. There is a unified international standard that now, in contrast to previous versions, is no longer only based on data from the western world. The present standard is based on data from six countries, Brazil, Ghana, India, Norway, Oman and the USA.
We will take a different approach. We do not attempt to measure individual intake of food, and we have a nationally representative random sample of households. We know the food intake at the household level for a number of food items, but we are missing the intra-household allocation of food. To handle this we include, as explanatory variables, indicators that we know from the literature are likely to affect intra-household decision making. These are the gender of the child, the number of girls among the siblings, and the interaction between these two variables, as well as indicators of the mother's bargaining position, that is, her educational level and main occupation, as well as her social identity, meaning caste and ethnic background as we, based on our experience with Nepali society, know that female empowerment vary between ethnic groups. We also include indicators of the mother's exposure to the society by measuring days of work per year as well as, again, occupation and level of educational. Education has also a direct effect as she will be able to read information regarding child nutrition, whether this is on food packages, or information material from the government or non-governmental organizations. Exposure to the outside world will for some women in Nepal simply mean that they are allowed to leave the household compound and meet women from other communities that live within the same settlement. Our findings support the impression we have that some women from the indigenous groups of the terai (the plains of Nepal) rarely leave the household compound4
Others have conducted similar studies of determinants of stunting using national level survey data, see in particular Sahn and Stifel (2002) on DHS data from 14 African countries, Gaina and Kulkarni (2005) and Som, Pal and Bharati (2007) on survey data from India, and Dancer and Rammohan (2009) on DHS data from Nepal. However, these studies estimate reduced form models where stunting is a function of individual and household characteristics. In contrast we estimate the direct link from the availability of specific food items on malnutrition controlling for the food budget. So in our model the household characteristics will only explain the intrahousehold allocation of food, not the amount of
. The number of days of work, and the parents' occupation, will also control for the need for staple food, which is the source of calories among hard-working laborers.
3 http://www.who.int/childgrowth/mgrs/en. 4 Strictly speaking the Nepalis separate ethnic groups (Janajatis) from castes and religious minorities. In the Census they operate with 100 distinct groups. The focus on ethnic and caste identity has increased lately, while in the 1995 survey, that we use here, there were only 15 categories, with in particular the terai groups being lumped together in the "other" category.

CMI WORKING PAPER Malnutrition in South-Asia: Poverty, diet or lack of female empowerment? WP 2012:4
3
different types of food, which in a reduced form model would play an important role if the interpretation of why for example household wealth affects the nutritional status of children.

CMI WORKING PAPER Malnutrition in South-Asia: Poverty, diet or lack of female empowerment? WP 2012:4
4
3. Model We study how household food budgets map into the nutritional status of small children. The focus on the food-budget, and not the total budget, is a simplification, as we expect food to have a more direct effect on child growth. However, we realize that in particular health spending may also affect child growth, but our data is poor on health spending. This will add noise to the analysis, but only bias the findings if health spending is correlated with spending on particular food items after we control for the food budget. This may be a problem for luxurious food, such as meat, as wealthy households may have larger budget shares for both health spending and meat. But the parameters for other variables appear not to depend on whether we include meat or not in the regressions.
Households split their food-budget between different items according to the composition of the household, energy needs of different household members, the importance ascribed to different household members, the expected nutritional and health effects of different food-items, as well as the food-preferences of the household members. If we were able to summarize all these concerns in a household welfare, or utility, function then the mix of food-items that, for a certain food-budget, is optimal with respect to the health conditions of the household members may differ from the mix that maximizes utility, since even poor people may eat unhealthy food. This is illustrated in Figure 1, where household A and B spend their (equal) food-budget on pulses and maize only.
Figure 1. Optimal budget shares
Maize
Pulses
H
B
A
U A
B U
0 H
Healthy expansion path
Less healthy expansion path
The two households in Figure 1 have the same health optimizing mix (H) of pulses and maize, while household A likes pulses (mix A), and household B likes maize (mix B). Other households may differ in composition, and thus have a different H-mix, or differ in preferences or weight on the preferences of different household members, which will give other positions of A and B. Even though the H-mix is not the same as the preferred mix, we expect all households to put some weight on the H-mix when they select their optimal food shares as illustrated by A or B. So a household that for health reasons should eat more pulses than the average (maybe because they have many children) will normally choose a large budget share for pulses even though this may not be the mix that maximize health outcomes. So if a particular food item in fact has a positive effect on child health, while many

CMI WORKING PAPER Malnutrition in South-Asia: Poverty, diet or lack of female empowerment? WP 2012:4
5
households eat too little, then we shall in fact expect to find a positive effect on child health in the data.
We may model these mechanisms using a simple model where the level of the food-budget y will shift the budget line, while for a large group of preferences (the homothetic ones) the budget-share for each item will be fixed, and even for other preferences fixed budget shares may be a reasonable approximation. We have depicted these linear expansion paths in Figure 1, and the further is an optimal path, let us say B, from the healthy path H, the more likely are the household members in a poor health condition. We do not know a priori whether a certain budget share is too large, or small, as compared to the optimal budget mix. So if we formulate the empirical model
zxxyH mp 43210 βββββ ++++= , (1)
to be estimated on the assumedly optimal choices of actual households, then we will not know a priori whether an increase in the budget share for pulses px , or maize mx , will improve the health condition H, or not. If some households eat too much maize, and others too little, then we shall expect the health condition to be at a peak for middle levels, that is, we shall expect to find an inverse-U. But if most households eat too much maize, then we shall expect the health-condition to decline with an increase in the budget share. Similarly we may believe that most households eat too little pulses, and thus expect the health-condition to improve with budget share of pulses. That is, we may expect most households to be along the B-path. Based on previous knowledge, and preliminary estimations, this will in fact be our main hypothesis.
With more than two food-items we again expect the health-maximizing bundle to be an interior solution. So the general hypothesis is that a balanced budget is good for you, as illustrated by the H-expansion path in Figure 1. If so, then we may identify food-items for which the health outcome declines as the budget share increases. In theory we may include all food-items that are part of the aggregate food budget. This will lead to an estimation problem, so at least one item will need to be excluded. However, many of the items have very low budget shares, so the actual reference category will be all items that are not specifically included in the analysis. The items we do include are those items that we based on previous knowledge, preliminary estimations, and the descriptive statistics, expect to explain the variation in health outcomes.
Finally, note that we need to add variables reflecting the household composition as well as variables reflecting the intrahousehold position of different household members, we include all these in z. As discussed above, the effects of these variables will be conditional on the food-budget and the food-shares.
CMI WORKING PAPER Malnutrition in South-Asia: Poverty, diet or lack of female empowerment? WP 2012:4
6
4. Methodological issues Even though we in principle estimate a biological model where food-intake of the child determines height, we also add a behavioral model that determines the food-intake, which in theory may imply estimation problems. There may be unobservable characteristics, of let us say the mother, that determine the composition of the food-intake of the children as well as other health indicators that in turn affect the height of the child. To some extent education will control for these effects, a well educated mother will tend to buy, or produce, nutritious food, and be aware of the importance of, let us say, safe water and immunization. Still there may be some variation that we are not able to measure. Most likely this will lead to an upward bias in the role of food-intake as we expect that mothers who feed their children well also take care of their health more in general. However, the bias may go the other way. If the mothers know that they take well care of the children's health for a given food-intake, then they may allow themselves to give the children less food than their peers. We have not been able to find any instrument that affect food-intake, while having no direct effect on the height of the child. Social identity may be a candidate, but we expect different social groups to have different practices also when it comes to other health related behavior. This implies that any effect of the food budget shares may reflect more than the direct effect on malnutrition, mothers who buy more healthy food may also be more health conscious in other matters that affect child growth.

CMI WORKING PAPER Malnutrition in South-Asia: Poverty, diet or lack of female empowerment? WP 2012:4
7
5. Data We use the Nepal Living Standard Survey (NLSS) conducted by CBS (1996) during the period June 25, 1995 to June 15, 1996. CBS interviewed 3373 households in 274 wards5. In most wards 12 households were interviewed6. The wards were sorted into three strata or ecological belts, the mountains, hills and terai (the plains along the border to India). Within each stratum, wards were selected with probabilities proportional to the number of households in the ward. Then the households were randomly selected within each ward7
It is argued in a methodological note from the World Bank LSMS team that one should not use the anthropometric data from the NLSS as the reported year and month of birth is not precise. This information is collected on page 33 of the questionnaire, where also height and weight are recorded. But there is in fact a quality check already on the same page, as the enumerators asked for date of birth, which can be compared to date of interview, as well as the age in months. These two measures do not always coincide in the data, which may be why the LSMS team recommends not to use the data. But why should this information be less reliable than other information in the survey, only because there are two separate measures? On the contrary two measures should rather make the estimates more reliable. We also have years of age from page 4 of the questionnaire as an extra control. We will use the directly reported months as the main indicator, but we drop the child from the sample if this indicator differ with more than six months from both the other indicators (approximately 3% are dropped). Nyyssölä (2007) has also used the data with corrections, although the corrections are not necessarily the same.
. As the local conditions, including food production technologies and transportation, differ between the terai and the hills, we will report separate analysis for these two largest subsamples.
Our dependent variable is stunting, that is, whether the child is two standard deviations below the median for a reference population of the same age, measured in months of age8
The NLSS data are for households, and not nucleus families. In preliminary analyses we included many different household types. But in the final analysis reported here we study only households where there is a single child below two years old that is the child of the household head. In these cases we can easily identify siblings living in the household, and since the child is very small, the siblings in the household will normally be all living siblings of the sampled child. We are left with a final sample of 473 children, and in the full regression analysis there are 469 children as we lack information on occupation for four mothers. The independent variables are all taken from the same household survey, and are summarized in Table 1.
. In the WHO tables the children are measured horizontally up to 2 years of age. We assume that this was also the case in NLSS. But in particular above this age we expect measurement problems as it may have happened that the enumerators measured the child lying down in some cases, and standing in other cases. To minimize biases we limit our sample to children up to 2 years of age, or more precisely 23 months to be on the safe side.
5 In Nepal every village is divided into nine administrative zones, called wards. 6 In the remote Far-Western region 16 households were interviewed in each village, to increase the number of respondents. It was the plan to interview 3388 households in 275 wards. A ward in the remote Dolpa district in the mountains was not visited. In addition, three households are missing in another mountain ward. 7 Approximately 12% of the households in the initial sample were replaced by other randomly selected households, because the households were not found or not at home. 8 The tables for the reference population are downloaded from: www.who.int/childgrowth/standards/h_f_a_tables_z_girls/en/index.html.
CMI WORKING PAPER Malnutrition in South-Asia: Poverty, diet or lack of female empowerment? WP 2012:4
8
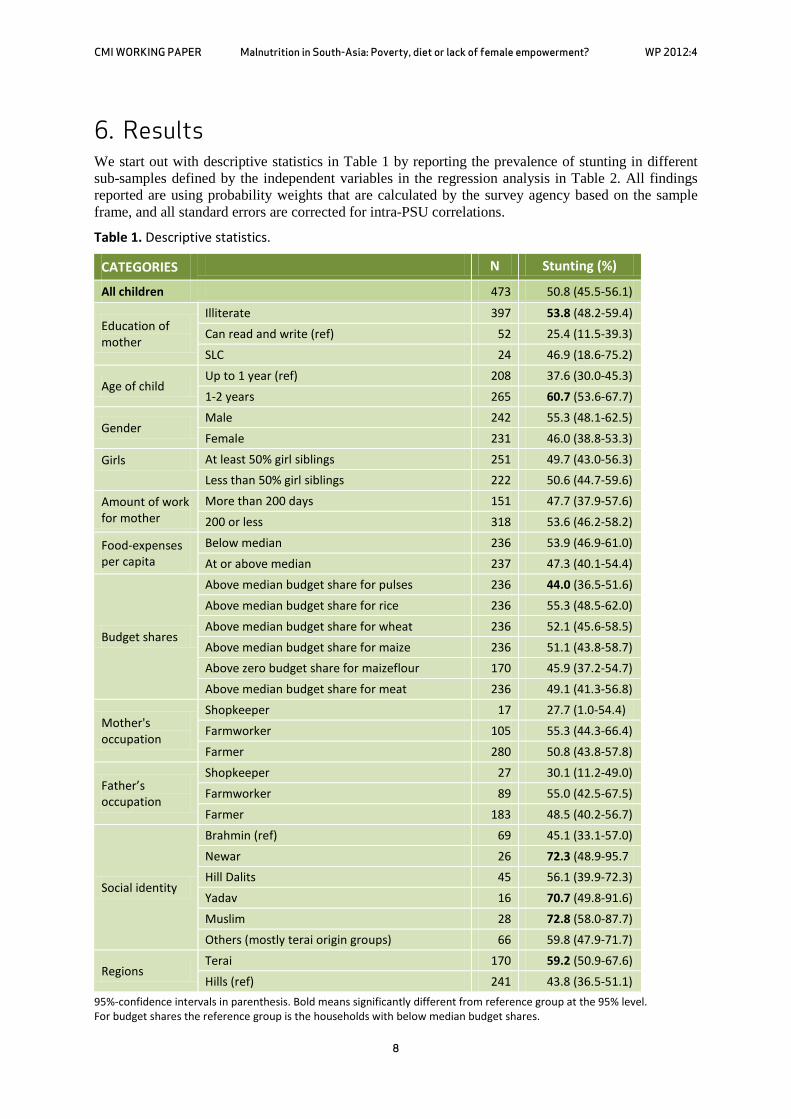
6. Results We start out with descriptive statistics in Table 1 by reporting the prevalence of stunting in different sub-samples defined by the independent variables in the regression analysis in Table 2. All findings reported are using probability weights that are calculated by the survey agency based on the sample frame, and all standard errors are corrected for intra-PSU correlations.
Table 1. Descriptive statistics.
CATEGORIES N Stunting (%)
All children 473 50.8 (45.5-56.1)
Education of mother
Illiterate 397 53.8 (48.2-59.4) Can read and write (ref) 52 25.4 (11.5-39.3) SLC 24 46.9 (18.6-75.2)
Age of child Up to 1 year (ref) 208 37.6 (30.0-45.3) 1-2 years 265 60.7 (53.6-67.7)
Gender Male 242 55.3 (48.1-62.5) Female 231 46.0 (38.8-53.3)
Girls At least 50% girl siblings 251 49.7 (43.0-56.3) Less than 50% girl siblings 222 50.6 (44.7-59.6)
Amount of work for mother
More than 200 days 151 47.7 (37.9-57.6) 200 or less 318 53.6 (46.2-58.2)
Food-expenses per capita
Below median 236 53.9 (46.9-61.0) At or above median 237 47.3 (40.1-54.4)
Budget shares
Above median budget share for pulses 236 44.0 (36.5-51.6) Above median budget share for rice 236 55.3 (48.5-62.0) Above median budget share for wheat 236 52.1 (45.6-58.5) Above median budget share for maize 236 51.1 (43.8-58.7) Above zero budget share for maizeflour 170 45.9 (37.2-54.7) Above median budget share for meat 236 49.1 (41.3-56.8)
Mother's occupation
Shopkeeper 17 27.7 (1.0-54.4) Farmworker 105 55.3 (44.3-66.4) Farmer 280 50.8 (43.8-57.8)
Father’s occupation
Shopkeeper 27 30.1 (11.2-49.0) Farmworker 89 55.0 (42.5-67.5) Farmer 183 48.5 (40.2-56.7)
Social identity
Brahmin (ref) 69 45.1 (33.1-57.0) Newar 26 72.3 (48.9-95.7 Hill Dalits 45 56.1 (39.9-72.3) Yadav 16 70.7 (49.8-91.6) Muslim 28 72.8 (58.0-87.7) Others (mostly terai origin groups) 66 59.8 (47.9-71.7)
Regions Terai 170 59.2 (50.9-67.6) Hills (ref) 241 43.8 (36.5-51.1)
95%-confidence intervals in parenthesis. Bold means significantly different from reference group at the 95% level. For budget shares the reference group is the households with below median budget shares.

CMI WORKING PAPER Malnutrition in South-Asia: Poverty, diet or lack of female empowerment? WP 2012:4
9
We find significant difference (at the 95%-level) in the average level of stunting depending on the consumption of pulses, which is in accordance with one of our main hypothesis. Pulses contain important micronutrients and small children tend to eat pulses (Dal) in combination with rice when they start eating normal food. Households with a budget share for pulses above the median are less likely to have stunted children. In Table 2 we find that when we control for other variables this finding is only significant for the hill sub-sample. In the plains all households appear to give small children sufficient amounts of pulses, while in the hills some households do not (hill households with stunted children have a significantly lower budget share for pulses, while there is no difference in the terai). This finding is in accordance with any sensible health advice, see for example Ali and Tsou (1997).
Table 2. Stunting in Nepal
Sample: Full Hills Terai
depvar: stunted stunted stunted
indepvars: dprobit dprobit dprobit
age in months 0.024*** 0.022*** 0.025***
(0.005) (0.007) (0.007)
male child -0.052 -0.040 -0.042
(0.086) (0.131) (0.126)
girls among siblings -0.298*** -0.402*** -0.361**
(0.098) (0.138) (0.166)
male*girlrate 0.314** 0.319 0.420*
(0.154) (0.251) (0.218)
readwrite-mother -0.206** -0.247** -0.048
(0.091) (0.106) (0.163)
days of work-mother 0.176*** 0.059* 0.214**
(0.060) (0.033) (0.086)
days-squared -0.028*** -0.030**
(0.011) (0.015)
shopkeeper-mother -0.327** -0.416*** -0.351*
(0.127) (0.042) (0.210)
farmworker-mother -0.025 -0.230** 0.067
(0.072) (0.093) (0.116)
newar 0.265** 0.530***
(0.109) (0.071)
dalit 0.211** 0.196*
(0.084) (0.108)

CMI WORKING PAPER Malnutrition in South-Asia: Poverty, diet or lack of female empowerment? WP 2012:4
10
Sample: Full Hills Terai
yadav 0.291** 0.327***
(0.123) (0.091)
muslim 0.348*** 0.369***
(0.072) (0.072)
other-ethnic 0.195** 0.283***
(0.088) (0.094)
terai 0.156**
(0.075)
food-budget/capita 0.015 0.017 -0.000
(0.014) (0.017) (0.034)
spulses -0.445 -1.773** 0.328
(0.610) (0.872) (1.024)
srice 0.187 0.423 0.065
(0.232) (0.306) (0.394)
swheat -0.467 -0.062 -0.549
(0.396) (0.595) (0.672)
smaize 0.945** 1.020* 1.781***
(0.474) (0.606) (0.691)
smaizef 0.521 0.817** 0.951
(0.361) (0.392) (0.864)
smeat -0.876 0.996 -2.707**
(0.605) (0.800) (1.084)
Observations 469 239 170
Pseudo-R-squared 0.1751 0.2128 0.2309
Robust standard errors in parentheses *** p<0.01, ** p<0.05, * p<0.1
If we go on to the control variables we first note that there is no effect of the per capita food budget. This supports the aggregate data that we discussed in the introduction, there is no clear connection between household income levels and child malnutrition, which in turn motivated the paper. Next we find that stunting is higher in the terai. This is a robust finding that also turns up in the regression analysis where we control for budget-shares, the total food budget, ethnicity and a number of other controls. So there is something about living in the plains that leads to stunting. Infected drinking water leading to diarrhea would be one possible explanation, but if there was any difference at the time of data-collection, the prevalence of diarrhea was in fact lower in the terai, see DHS (1996). The same DHS indicates lower vaccination coverage in the terai, which in turn may make the children more prone to diseases that can affect nutritional uptake, but robustness tests indicate that this cannot

CMI WORKING PAPER Malnutrition in South-Asia: Poverty, diet or lack of female empowerment? WP 2012:4
11
explain the higher level of stunting in our data9
We do control for social identity (caste/ethnic background), and it explains some of the variation in data. In the hills we find that the low-status Dalit groups have more stunted children, which may be due to discrimination in access to health services, whether there is direct discrimination, or indirect as low castes may live further away from health facilities. And we also know that Dalits traditionally have had inferior access to drinking water, which may in turn lead to diarrhea and thus lower uptake of nutrients. It is more surprising that the Newar group, which populates the Kathmandu valley, has high levels of stunting. But this may also reflect a water problem. The Newars live in cities and towns where there are problems with sewers, which again may lead to diarrhea and lower uptake on nutrients.
. So there appears to be some additional effect of living in the terai beyond the controls that we have included.
In the terai, we find that the groups that are considered as more conservative, or traditional, have higher rates of child malnutrition. Many of these groups have a relatively high social status, although there are large differences in status within this so-called Madhes community. We believe that part of the explanation is traditional social values that imply that women stay at home and do not get exposure to new ideas, including on child nutrition and care. So in particular in traditional terai communities we expect that sensitive female empowerment programs will have an effect on child nutrition and growth.
We now turn to more methodological issues, the budget allocated to food is for the most part consumed by other household members. We will discuss the siblings below, but start with the parents. A large budget share for pulses may not necessarily mean that the small child will eat pulses. This is a problem with our data that we cannot solve, but when we in fact find a link between the budget share of pulses and child growth it is likely that there is a direct effect.
In the regressions we do control for variables that may reflect the energy needs of the parents. The father's occupation and days of work appear to have no influence on child nutrition as shown in Table 1, and in robustness checks the variable has no significant effect in the regression analysis10. The mother's occupation and days of work do have effects, as we may expect. The more the mother is working the more likely the child is malnourished. This may be because the mother does not have the time to take care of the child, or she may need more food herself if she is engaged in hard work, for example on the farm11
9 If we control for vaccination, it has an effect on stunting, but only in the hills, not in the terai, and with no effect on the terai dummy in the full sample. So vaccinations appear to be more important in the hills, which may be why people vaccinate more. As this is only one variable that reflects health behavior, and we do not go deeper into the demand for health services in this paper, we have decided not to control for vaccinations in our regressions.
. But since there was no effect of the father's days of work, we have more confidence in the first interpretation. The negative coefficient for the mother being a farm-worker in the hill sub-sample supports this interpretation. Farm labor is hard work, but still these women have better fed children. We believe that this is a female empowerment effect. Women who work outside their own farm get income that they may control themselves, and they get exposure to new ideas as labor involves social interaction. There is even more support for this interpretation as mothers who run
10 We thus omit the variable as it leads to a smaller sample because information is lacking on the father's occupation for some households. The other parameters are only marginally affected by this. 11 We have in robustness tests controlled for land-holding but there was no significant effect on stunting.

CMI WORKING PAPER Malnutrition in South-Asia: Poverty, diet or lack of female empowerment? WP 2012:4
12
a shop also have better fed children. And the positive effect of having a literate mother add to the evidence that informed and empowered women will have better nourished children12
Note that we do control for the gender and age of the child. We find that children are better nourished the first year of life, maybe due to breastfeeding. But more surprisingly, boys are more often stunted than girls. This might be because boys sooner are expected to take other food in addition to breast milk, and thus more easily get diarrhea. We do, however, find expected effects of the gender of the siblings, the larger is the fraction of siblings being girls the better nourished is the child. This may indicate that at higher ages than two years old the girls get less food and more is thus allocated to the new born child. However, a significant interaction term implies that this gender of the siblings effect is significant only if the new born is a girl. So the nutrition of boys does not depend on the gender composition of the siblings. Boys may be malnourished because the parents believe that boys should get real food and not only breast milk, but in contrast to girls they are not malnourished because of lack of food due to many older brothers.
.
12 The descriptive statistics indicate that mothers with SLC (school leaving certificate) have more malnourished children. Now the difference is not significant, and the sample is small, but in some of our robustness checks the SLC dummy was significant. So there may be such an effect in the data. If so, then the explanation may be that women with resources may have others to take care of their children, either other family members or servants, and these caretakers may not be literate.

CMI WORKING PAPER Malnutrition in South-Asia: Poverty, diet or lack of female empowerment? WP 2012:4
13
7. Conclusions We find that pulses are critical for child growth in Nepal. This is not a surprising finding in a country where small children are normally served pulses along with rice when they shift from breastfeeding to other food. Furthermore we find that boys are more often malnourished than girls, maybe because they are expected to switch away from breast milk earlier than girls. However when we control for this effect, then girls are more likely to be malnourished if they have many male siblings. We also find multiple evidence indicating that female empowerment matters for child nutrition. In sum we conclude that strengthening women's position is society through education and labor market participation will have positive effects on child malnutrition. There is however a regional difference in these findings with the composition of the food basket being important in the hills, and female empowerment being important in the terai.
On a methodological note, we have shown that nutritional studies can be conducted on large scale datasets that are not particularly designed to collect data on food intake of small children. This is a useful supplement to tailor-made studies on small samples in a particular location, where one measure food intake for each individual child. We have demonstrated that one can explain individual outcomes even when the independent variables are measured at the household level.

CMI WORKING PAPER Malnutrition in South-Asia: Poverty, diet or lack of female empowerment? WP 2012:4
14
References Ali, M. and Tsou, S.C.S. (1997). "Combating Micronutrient Deficiencies through Vegetables. A
Neglected Food Frontier in Asia". Food Policy. 22(1): 17-38.
CBS (1996). Nepal Living Standards Survey Report 1996. Main findings. Central Bureau of Statistics. National Planning Commission Secretariat. Nepal.
CBS (2005). Poverty Trends in Nepal (1995-96 and 2003-04). Central Bureau of Statistics. Kathmandu, Nepal.
Dancer, D. and Rammohan, A. (2009). "Maternal Autonomy and Child Nutrition. Evidence from Rural Nepal". Indian Growth and Development Review. 2(1): 18-38.
Deaton, A. and Dreze J. (2009). "Food and Nutrition in India: Facts and Interpretations". Economic and Political Weekly. 44(7): 42-65.
DHS (1996 and 2006). Nepal Demographic And Health Survey. Available at www.measuredhs.com.
Gaina, R. and Kulkarni, V. (2005). "Anthropometric Failure and Persistence of Poverty in Rural India". International Review of Applied Economics. 19(2): 179-197.
Gittelsohn, J. (1991). "Opening the box: Intrahousehold Food Allocation in Rural Nepal". Social Science and Medicine. 33(10): 1141-1154.
Nyyssölä, M. (2007). Women's Status and Child Labour in Nepal. Research Paper No. 2007/85. UNU-WIDER, Helsinki.
Sahn, D. and Stifel, D.C. (2002). "Parental Preferences for Nutrition of Boys and Girls: Evidence from Africa". Journal of Development Studies. 39(1): 21-45.
Shankar, A.V., Gittelsohn, J., West, K.P., Stallings, R., Gnywali, T. and Faruque, F. (1998). "Eating from a Shared Plate affects Food Consumption in Vitamin A-Deficient Nepali Children". Journal of Nutrition. 128(7): 1127-1133.
Shankar, A.V., Gittelsohn, J., Stallings, R., West, K.P., Gnywali, T., Dhungel, C. and Dahal, B. (2001). "Comparison of Visual Estimates of Children's Portion Sizes under both Shared-Plate and Individual-Plate conditions". Journal of the American Dietetic Association. 101(1): 47-52.
Som, S., Pal, M. and Bharati, P. (2007). "Role of Individual and Household level factors on Stunting. A Comparative study in three Indian states". Annals of Human Biology. 34(6): 632-646.

CMI WORKING PAPERSThis series can be ordered from:
CMI (Chr. Michelsen Institute)Phone: +47 47 93 80 00 Fax: +47 47 93 80 01E-mail: [email protected]
P.O.Box 6033 Bedriftssenteret,N-5892 Bergen, NorwayVisiting address: Jekteviksbakken 31, Bergen
Web: www.cmi.no
Price: NOK 50Printed version: ISSN 0804-3639Electronic version: ISSN 1890-5048Printed version: ISBN 978-82-8062-432-1 Electronic version: ISBN 978-82-8062-433-8
This paper is also available at:www.cmi.no/publications
INDEXING TERMSFemale autonomy Stunting Intra-household allocation
Despite economic growth, and a reduction in poverty, malnutrition is still rampant in South-Asia. This indicates that non-economic factors are important, and we use a nation-wide survey from Nepal to identify factors that may explain why small children are stunted. In contrast to designated studies of child nutrition we do not have information on individual food intake, but we demonstrate that analysis of large sample surveys is a good supplement to designated studies, with the main benefit being that findings are nationally representative. We find that pulses are critical for child growth, and that boys are more often malnourished, maybe because they are expected to take other food than breast milk. Furthermore we find that girls are more likely malnourished if they have many older brothers, and we find that female empowerment improves child nutrition.