maldi-tof ms based discovery workflows: a fully automated, bottom-up approach
TRANSCRIPT

1 / 9 �
MALDI-TOF MS Based Discovery Workflows: A Fully Automated, Bottom-Up Approach M. Nazim Boutaghou1; David R. Colquhoun1; Kevin Meyer2; Brian J. Feild1; Scott Kuzdzal1
1 Shimadzu Scientific Instruments, Columbia, MD , 2 Perfinity Biosciences, West Lafayette, IN
2 / 9 �2 / 12 �
Novel Aspect
Combining an automated MALDI plate spotter with an automated digestion workstation results in reduced experimental time and improved qualitative results.
3 / 9 �3 / 9 �
Introduction
Bottom-up workflows have been a staple of mass spectrometry based proteomic approaches. Most of these protocols require overnight digestion, sample clean-up and, when involving MALDI, fraction collection, dry down and sample matrix deposition. Such lengthy protocols limit the number of samples that can be analyzed while suffering from great variability in digestion efficiency qualitatively and quantitatively. We present in this work a fully automated solution for MALDI-TOF MS based peptide mapping experiments. Using an online digestion, desalt, reversed phase separation and fraction collection platform, we were able to decrease the experimental time from over 18 hours to less than 30 min (reversed phase separation included – acquisition time not included) while substantially improving sequence coverage.

4 / 9 �4 / 12 �
Methods An automated sample preparation workstation (Perfinity Workstation (PWS), Perfinity Biosciences) was directly coupled to a MALDI plate spotter (AccuSpot, Shimadzu). Online digestion was performed using an immobilized enzyme column (4 minutes, 50C), followed by reversed phase (Phenomenex Aeris XB-C18, 100 x 2.10 mm, 3.6u) separation (15 min, 2 - 60% acetonitrile in water and 0.1 % formic acid) and fraction plate deposition on a 384 well plate (split ratio, R= 20:1, 3 seconds interval spotting). Benchtop digest was performed overnight using trypsin following standard reduction and alkylation (Trypsin Gold, Promega). Reaction was quenched and solution was dried down, re-suspended and desalted using reversed phase microcolumns (Zip Tip, Millipore).
MALDI analysis was performed on a MALDI TOF/TOF (Shimadzu AXIMA Performance MALDI TOF/TOF) in the automated mode, using external calibration.
Sequence coverage was assessed using MASCOT Peptide Mass Fingerprinting (PMF) (Swissprot) and was further confirmed by manual review of spectra.
5 / 9 �5 / 9 �
Methods
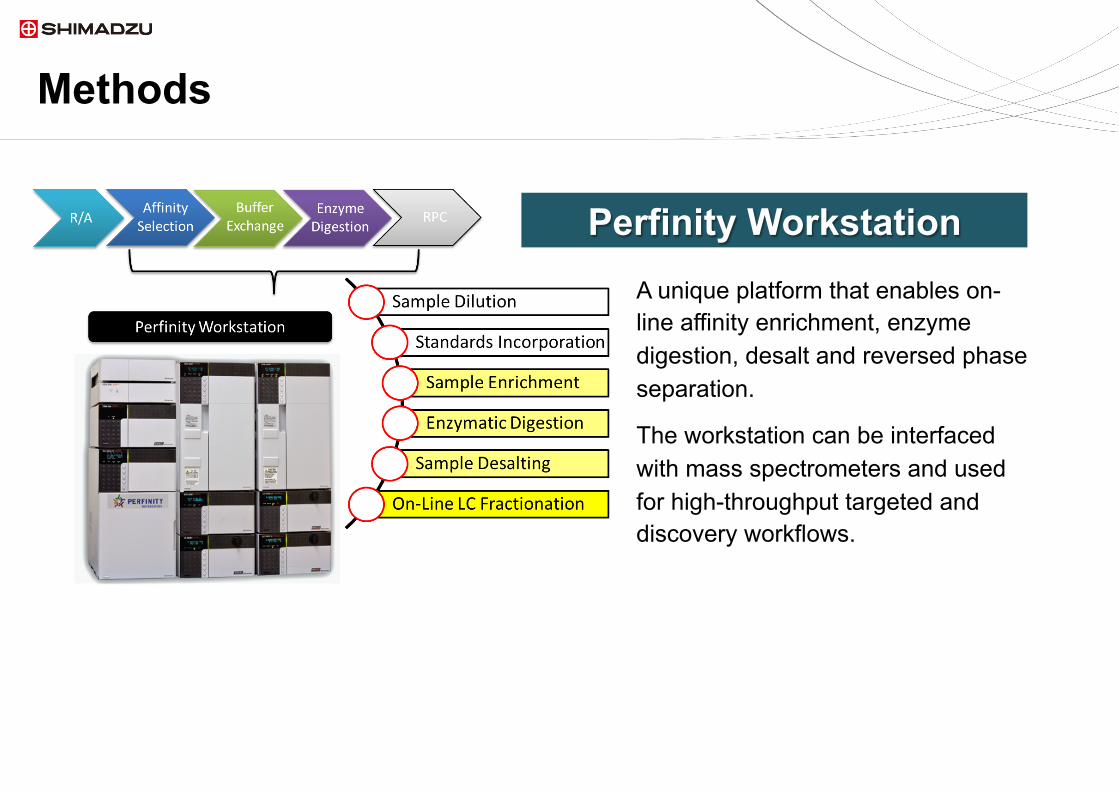
A unique platform that enables on-line affinity enrichment, enzyme digestion, desalt and reversed phase separation.
The workstation can be interfaced with mass spectrometers and used for high-throughput targeted and discovery workflows.
Perfinity Workstation

6 / 9 �6 / 12 �
Methods Effluent
AccuSpot
The AccuSpot© is an automated plate spotter instrument that enables mixing LC effluent with MALDI matrices and deposits the mixture on a MALDI plate. The AccuSpot uses concentric flow of effluent and matrix to avoid cross contamination and clogging.
7 / 9 �7 / 12 �
Results: Figure 1
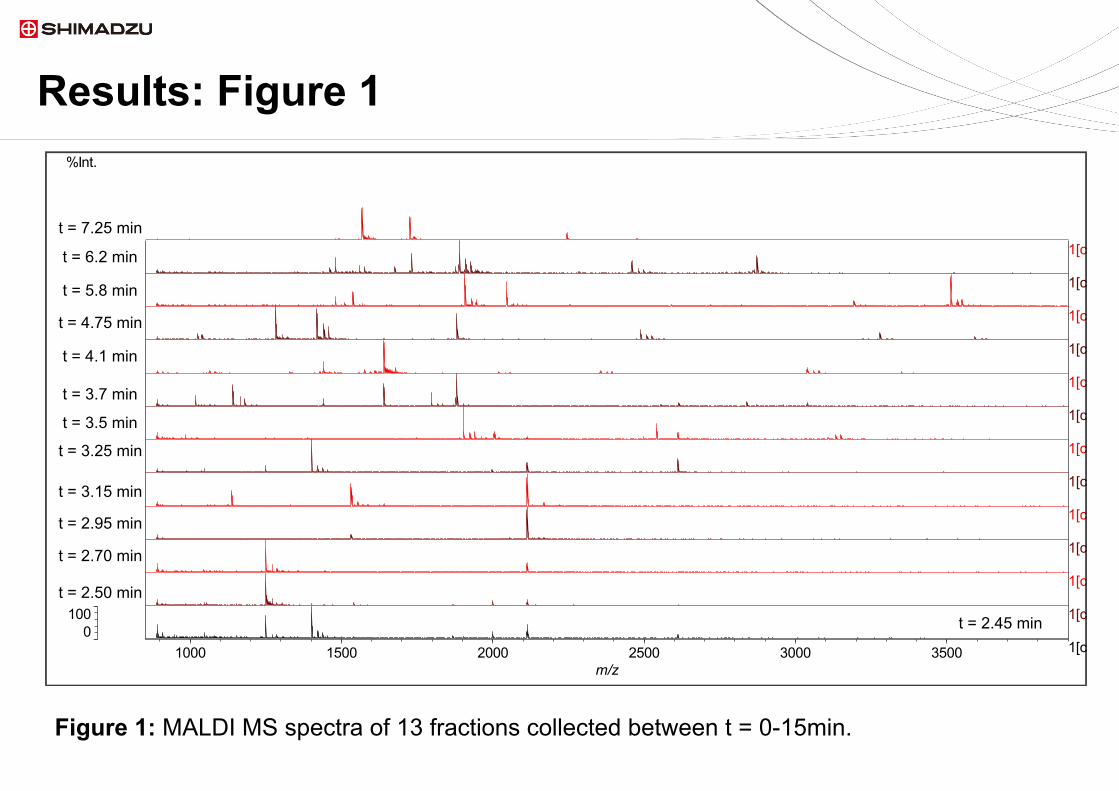
Figure 1: MALDI MS spectra of 13 fractions collected between t = 0-15min.
0100
%Int.
1000 1500 2000 2500 3000 3500m/z
1[c].A4
1[c].B4
1[c].F4
1[c].K4
1[c].O4
1[c].A5
1[c].J5
1[c].B6
1[c].G6
1[c].D7
1[c].I8
1[c].A9
1[c].F10
t = 2.45 min
t = 2.50 min
t = 2.70 min
t = 2.95 min
t = 3.15 min
t = 3.25 min
t = 3.5 min
t = 3.7 min
t = 4.1 min
t = 4.75 min
t = 5.8 min
t = 6.2 min
t = 7.25 min
8 / 9 �8 / 12 �
Results: Figure 2
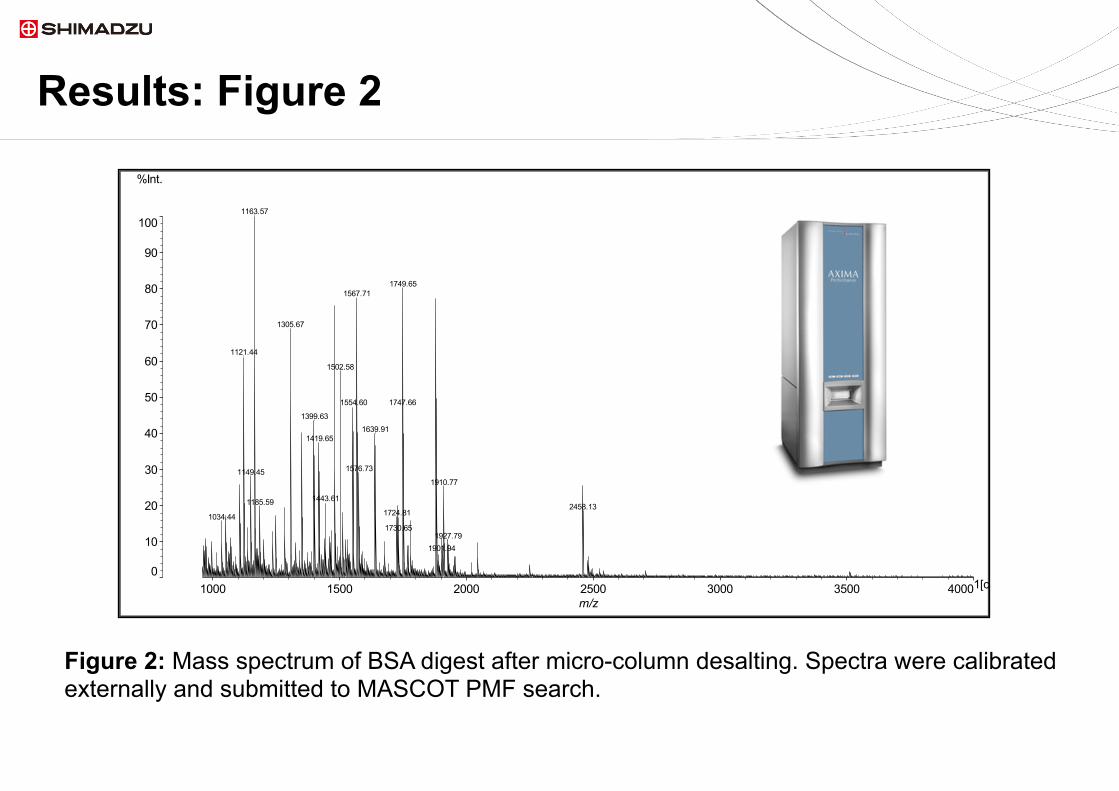
Figure 2: Mass spectrum of BSA digest after micro-column desalting. Spectra were calibrated externally and submitted to MASCOT PMF search.
0
10
20
30
40
50
60
70
80
90
100
%Int.
1000 1500 2000 2500 3000 3500 4000m/z
1[c].K8
1163.57
1749.651567.71
1305.67
1121.44
1502.58
1747.661554.60
1399.631639.91
1419.65
1576.731149.451910.77
1443.611185.59 2458.131724.811034.441730.65
1927.791901.94
9 / 9 �9 / 12 �
Results: Figure 3 1 MKWVTFISLL LLFSSAYSRG VFRRDTHKSE IAHRFKDLGE EHFKGLVLIA 51 FSQYLQQCPF DEHVKLVNEL TEFAKTCVAD ESHAGCEKSL HTLFGDELCK
101 VASLRETYGD MADCCEKQEP ERNECFLSHK DDSPDLPKLK PDPNTLCDEF 151 KADEKKFWGK YLYEIARRHP YFYAPELLYY ANKYNGVFQE CCQAEDKGAC 201 LLPKIETMRE KVLASSARQR LRCASIQKFG ERALKAWSVA RLSQKFPKAE 251 FVEVTKLVTD LTKVHKECCH GDLLECADDR ADLAKYICDN QDTISSKLKE 301 CCDKPLLEKS HCIAEVEKDA IPENLPPLTA DFAEDKDVCK NYQEAKDAFL 351 GSFLYEYSRR HPEYAVSVLL RLAK EYEATL EECCAKDDPH ACYSTVFDKL 401 KHLVDEPQNL IKQNCDQFEK LGEYGFQNAL IVRYTRKVPQ VSTPTLVEVS 451 RSLGKVGTRC CTKPESERMP CTEDYLSLIL NRLCVLHEKT PVSEKVTKCC 501 TESLVNRRPC FSALTPDETY VPKAFDEKLF TFHADICTLP DTEKQIKKQT 551 ALVELLKHKP KATEEQLKTV MENFVAFVDK CCAADDKEAC FAVEGPKLVV 601 STQTALA
(a) Manual D
igest
1 MKWVTFISLL LLFSSAYSRG VFRRDTHKSE IAHRFKDLGE EHFKGLVLIA 51 FSQYLQQCPF DEHVKLVNEL TEFAKTCVAD ESHAGCEKSL HTLFGDELCK
101 VASLRETYGD MADCCEKQEP ERNECFLSHK DDSPDLPKLK PDPNTLCDEF 151 KADEKKFWGK YLYEIARRHP YFYAPELLYY ANKYNGVFQE CCQAEDKGAC 201 LLPKIETMRE KVLASSARQR LRCASIQKFG ERALKAWSVA RLSQKFPKAE 251 FVEVTKLVTD LTKVHKECCH GDLLECADDR ADLAKYICDN QDTISSKLKE 301 CCDKPLLEKS HCIAEVEKDA IPENLPPLTA DFAEDKDVCK NYQEAKDAFL 351 GSFLYEYSRR HPEYAVSVLL RLAKEYEATL EECCAKDDPH ACYSTVFDKL 401 KHLVDEPQNL IKQNCDQFEK LGEYGFQNAL IVRYTRKVPQ VSTPTLVEVS 451 RSLGKVGTRC CTKPESERMP CTEDYLSLIL NRLCVLHEKT PVSEKVTKCC 501 TESLVNRRPC FSALTPDETY VPKAFDEKLF TFHADICTLP DTEKQIKKQT 551 ALVELLKHKP KATEEQLKTV MENFVAFVDK CCAADDKEAC FAVEGPKLVV 601 STQTALA
(b) Autom
ated Digest
10 / 9 �10 / 12 �
Results: Figure 3
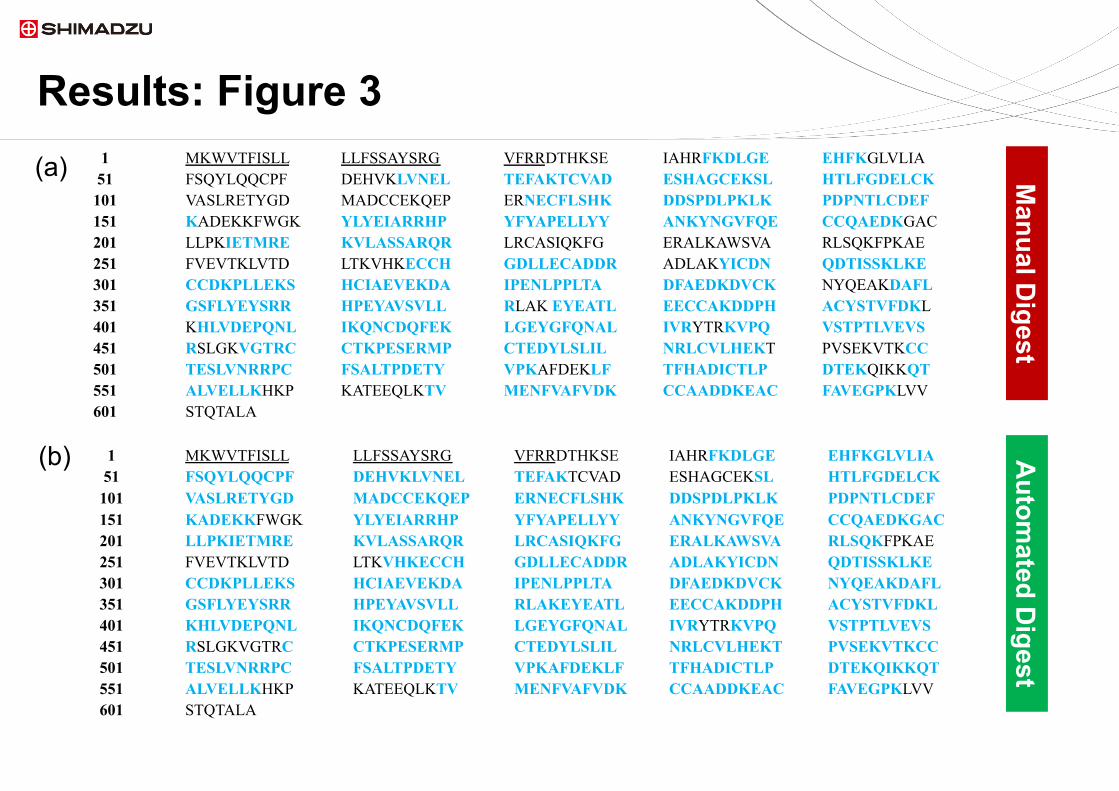
Figure 3 (previous slide): Bovine Serum Albumin sequence coverage using benchtop digest (a) and PWS-AccuSpot (b). Amino acids belonging to the signal peptide (1-18) and pro-peptide (19-25) (underlined) were not included in the sequence coverage calculations. Peptides matched in the sequence are highlighted in bold and light blue.
11 / 9 �11 / 12 �
Results
Digestion method Experimental time (red/alkylation not
included) Matrix used Sequence Coverage
Automated PWS-AccuSpot 28 min CHCA 87%
Benchtop In-solution digest
18 hours + desalt CHCA 68%
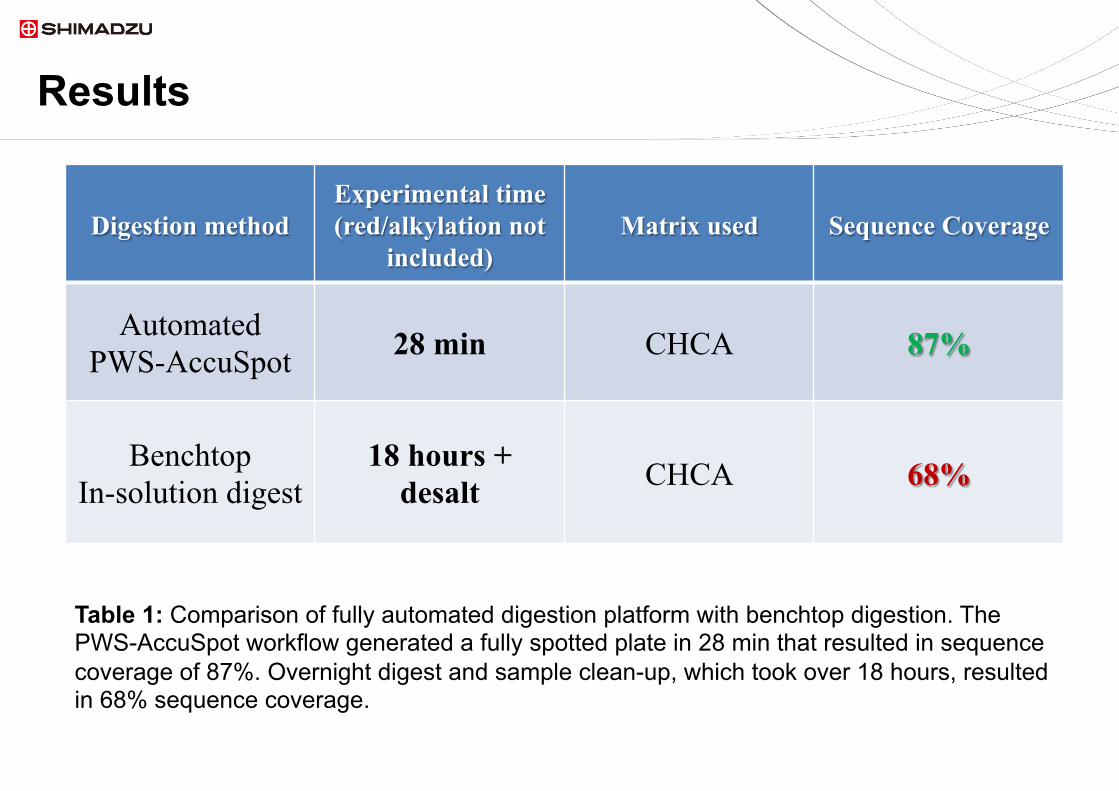
Table 1: Comparison of fully automated digestion platform with benchtop digestion. The PWS-AccuSpot workflow generated a fully spotted plate in 28 min that resulted in sequence coverage of 87%. Overnight digest and sample clean-up, which took over 18 hours, resulted in 68% sequence coverage.
12 / 9 �12 / 9 �
Summary
The PWS-AccuSpot platform was able to improve sequence coverage of the protein standard Bovine Serum Albumin by 19% when compared to the regular benchtop digest at a fraction of the experimental time.
The platform offers variable parameters that can be optimized: digestion temperature, digestion time, LC gradient and choice of MALDI matrices.
The PWS-AccuSpot workflow took only 28 min and resulted in a MALDI ready plate. This combination makes for one of the fastest available MALDI-based, bottom-up sample preparation platforms.
Automation removes user error, improves reproducibility and decreases chances of contamination.
Optimum coverage required the injection of at least 6 pmol of protein on trypsin column.
13 / 9 �13 / 9 �
Future Directions
More experiments on sequence coverage could be performed. We want to look at the effect of digestion time and temperature on sequence coverage. Sensitivity will also be of interest as we will work on decreasing the split ratio and design a splitless configuration.

14 / 9 �
Thank you for viewing this presentation. Should you have any questions or require additional information about our research, products or services, please visit our support page: www.ssi.shimadzu.com/support/
@shimadzussi
Follow us on Twitter
Need More Info?