malaysia strategy - · pdf filemalaysia strategy 3q15 results roundup: growth reverses ......
TRANSCRIPT
December 2, 2015
ST
RAT
EG
Y R
ESEA
RC
H |
Mala
ysi
a
SEE PAGE 24 FOR IMPORTANT DISCLOSURES AND ANALYST CERTIFICATIONS PP16832/01/2013 (031128)
Malaysia Strategy
3Q15 results roundup: Growth reverses
3Q15 core net profit -3.1% YoY, resulting in 9M15 growth
remaining in the negative zone at -3.5% YoY.
Looking at negative core earnings growth now in 2015, at -
0.2% for the KLCI, and a slower +7.7% growth in 2016.
Maintaining our KLCI targets of 1,730 end-2015, 1,830 end-
2016. Volatilities to persist; defensive strategy reiterated.
What’s New
3Q15 core net profit of our research universe was weaker YoY for
the 2nd consecutive quarter at -3.1%, resulting in 9M15 core profit
remaining in the negative zone at -3.5% YoY. Quarterly earnings
were weaker both YoY and QoQ in the plantation, telco, building
material, oil & gas, property development, gaming and media
sectors. Earnings were however stronger YoY and QoQ in the export
related sectors – semi-conductor, glove, petrochemical.
Of the 97 stocks under our coverage which reported, 36% fell
short, 26% were above. Stocks that prominently missed were FGV
(it fell into a loss), GENM, UEMS, GENP, IOI, Sime, Lafarge, Digi,
UMWH, GENT, TM, HLB, HLFG, Mah Sing, YTLP, AMMB. Stocks that
positively surprised were MAHB, Top Glove, Malakoff, Nestle, MISC,
Westports, PGas, Tenaga and AirAsia. Our new stock BUYs are
PCHEM, AFG, Padini; new SELLs are UMWH, FGV, Lafarge, Barakah.
What’s Our View
We now forecast KLCI core earnings to contract -0.2% YoY in 2015
(+1.9% previously), and to grow a slower +7.7% YoY in 2016 (+8.1%
previously) after lowering core earnings by 1.6% for 2015 and 1.9%
for 2016. As for our research universe, we now project negative
core earnings growth of -0.7% in 2015 (+1.8% previously), +9.6% in
2016 (+9.4% previously). Since the beginning of this year, we have
cut KLCI core earnings by a total 8.7% for 2015, 9.7% for 2016.
After multiple rounds of earnings disappointments and forecasts
cuts, the question now is whether there is still earnings downside
risk or has the earnings downgrade cycle bottomed. We think the
risk remains on the downside; pressure points remain at the banks,
consumer-related and plantation sectors. Cushioning the downside
would be the positive weak MYR impact on the export related
sectors as our FX Research team expects the MYR to be weaker at
an average 4.11 against the USD in 2016, versus 3.87 2015 YTD.
We maintain our KLCI targets of 1,730 for end-2015, 1,830 for end-
2016, which tag the KLCI to about its mean PER valuation. A re-
rating should come when corporate earnings show a firmer
uptrend, and when commodity prices recover on a sustained basis.
For the near term, we continue to advocate a defensive strategy.
Into 2016, we think the external headwinds will persist, inducing
volatilities in FX and equities too.
.
Analysts
Country Index vs MSCI
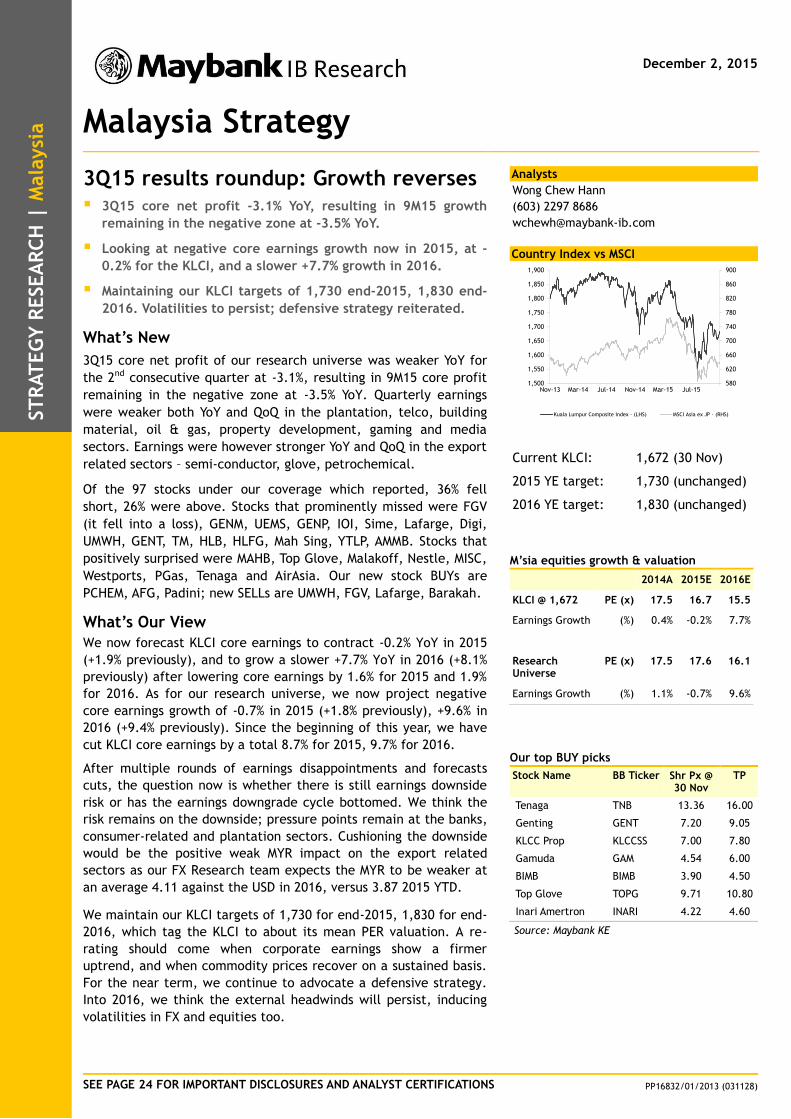
Current KLCI: 1,672 (30 Nov)
2015 YE target: 1,730 (unchanged)
2016 YE target: 1,830 (unchanged)
M’sia equities growth & valuation
2014A 2015E 2016E
KLCI @ 1,672 PE (x) 17.5 16.7 15.5
Earnings Growth (%) 0.4% -0.2% 7.7%
Research Universe
PE (x) 17.5 17.6 16.1
Earnings Growth (%) 1.1% -0.7% 9.6%
Our top BUY picks
Stock Name BB Ticker Shr Px @ 30 Nov
TP
Tenaga TNB 13.36 16.00
Genting GENT 7.20 9.05
KLCC Prop KLCCSS 7.00 7.80
Gamuda GAM 4.54 6.00
BIMB BIMB 3.90 4.50
Top Glove TOPG 9.71 10.80
Inari Amertron INARI 4.22 4.60
Source: Maybank KE
Wong Chew Hann
(603) 2297 8686
580
620
660
700
740
780
820
860
900
1,500
1,550
1,600
1,650
1,700
1,750
1,800
1,850
1,900
Nov-13 Mar-14 Jul-14 Nov-14 Mar-15 Jul-15
Kuala Lumpur Composite Index - (LHS) MSCI Asia ex JP - (RHS)

December 2, 2015 2
Strategy Research
3Q15 results roundup
Weaker YoY, for the 2nd consecutive quarter
3Q15 core net profit of our research universe (73% of the Malaysian bourse
market capitalisation) was weaker YoY for the 2nd consecutive quarter at -
3.1% (2Q15: -9.0%). QoQ, 3Q15 core net profit rebounded just 2.9%. As a
result, 9M15 core net profit remained in the negative zone at -3.5% YoY
(6M15: -3.7% YoY). Quarterly earnings were weaker both YoY and QoQ in
the plantation, telco, building material, oil & gas, property development,
gaming and media sectors. Earnings were however stronger YoY and QoQ in
the export related sectors – semi-conductor, glove, petrochemical. Other
sectors with stronger YoY and QoQ core earnings were utility, transport
(aviation), construction, consumer and REIT. Of the 97 stocks under our
coverage which reported, 36% fell short of our forecasts, 26% were above.
Quarterly recurring net profit of research universe, 1Q 2009 - 3Q 2015
Source: Maybank KE
Sector earnings analysis
Down YoY, down QoQ: Sectors that reported YoY and QoQ lower core
earnings were plantation (GENP, IOI, Sime, FGV), telco (Digi, Axiata,
Maxis), building material (AJR, Lafarge), oil & gas (Perdana, Wah
Seong, MMHE, Perisai, UMWOG, Barakah reported core net losses),
property development (Mah Sing, UEMS), gaming (GENM, Magnum) and
media (skewed by Star).
Up YoY, up QoQ: Sectors that reported both YoY and QoQ stronger
core earnings were utility (Tenaga, YTLP, Malakoff, PGas), transport
(AirAsia, AirAsia X, MAHB), construction (IJM, Kimlun), consumer
(Carlsberg, Guinness, Nestle, QL, BAT, Padini, Oldtown, 7-Eleven),
semi-conductor (Inari, Vitrox, Globetronics), glove (Hartalega, Top
Glove, Kossan), petrochemical (PCHEM), and REIT.
Down YoY, up QoQ: Sectors that reported weaker YoY core earnings
but improved QoQ core earnings were banks (Maybank, Public and CIMB
reported both YoY and QoQ growth in core earnings), auto (TCM and
UMWH reported weaker YoY but improved QoQ core earnings, while
MBM’s core earnings were weaker both YoY and QoQ).
4000
6000
8000
10000
12000
14000
16000
18000
CY
1Q
09
CY
2Q
09
CY
3Q
09
CY
4Q09
CY
1Q
10
CY
2Q
10
CY
3Q
10
CY
4Q
10
CY
1Q
11
CY
2Q
11
CY
3Q
11
CY
4Q
11
CY
1Q
12
CY
2Q
12
CY
3Q
12
CY
4Q
12
CY
1Q
13
CY
2Q
13
CY
3Q
13
CY
4Q
13
CY
1Q
14
CY
2Q
14
CY
3Q
14
CY
4Q
14
CY
1Q
15
CY
2Q
15
CY
3Q
15
MYR m
3Q15: +2.9% QoQ, -3.1% YoY

December 2, 2015 3
Strategy Research
Quarterly recurring net profit of research universe
CY 4Q12
CY 1Q13
CY 2Q13
CY 3Q13
CY 4Q13
CY 1Q14
CY 2Q14
CY 3Q14
CY 4Q14
CY 1Q15
CY 2Q15
CY 3Q15
QoQ (%)
YoY (%)
Financial (1) 5,503 5,283 5,585 6,095 5,900 5,849 5,664 5,970 5,666 5,781 5,715 5,894 3.1% (1.3%)
Plantation 1,729 1,636 1,558 1,507 1,718 1,827 2,006 1,130 952 822 1,618 630 (61.0%) (44.2%)
Utility (2) 1,606 1,546 2,711 1,513 1,994 1,847 2,479 2,215 3,223 3,192 1,383 2,299 66.2% 3.8%
Telco 1,580 1,670 1,908 2,109 1,989 1,688 1,961 1,751 1,864 1,850 1,851 1,661 (10.3%) (5.1%)
Transport (3) 1,308 772 543 834 1,525 795 306 536 720 739 838 992 18.4% 85.0%
Construction 332 213 295 307 323 263 321 285 273 278 299 347 16.0% 21.7%
Building Mat 95 62 91 120 136 84 79 73 51 89 59 33 (43.6%) (54.3%)
Oil & gas 295 266 337 381 397 296 414 442 396 317 156 (16) NM NM)
Property,REIT 696 682 699 786 732 681 672 732 1,003 712 747 727 (2.7%) (0.8%)
Consumer 752 868 842 865 865 912 908 929 972 1,025 920 1,039 12.9% 11.8%
Auto 282 347 341 307 305 293 254 254 146 223 97 106 9.0% (58.4%)
Gaming 1,137 917 989 946 907 911 770 851 879 796 585 580 (0.9%) (31.8%)
Media 153 97 131 147 153 82 104 109 121 83 110 101 (7.6%) (7.4%)
Semi-con 17 13 44 48 41 45 70 63 69 65 69 82 19.0% 30.1%
Glove 148 146 137 149 139 126 134 133 144 152 187 235 25.2% 76.7%
Petrochem 1,046 1,105 958 635 450 749 555 661 450 605 557 916 64.5% 38.6%
Total 16,679 15,623 17,168 16,747 17,574 16,447 16,697 16,133 16,926 16,729 15,191 15,626 2.9% (3.1%)
Ex-Tenaga 15,663 14,742 15,805 15,995 16,289 15,324 15,139 14,620 14,630 14,287 14,458 14,045 (2.3%) (6.8%)
QoQ Chg (%) 5.0% (6.3%) 9.9% (2.5%) 4.9% (6.4%) 1.5% (3.4%) 4.9% (1.2%) (9.2%) 2.9%
YoY Chg (%) 14.7% 9.7% 7.2% 5.5% 5.4% 5.3% (2.7%) (3.7%) (3.7%) 1.7% (9.0%) (3.1%)
Note: (1) Comprises the banks, BIMB, Bursa Malaysia and MPHB Capital; (2) Comprises Tenaga, YTLP, PGas, Gas Malaysia; (3) Comprises AirAsia, AirAsia X, MAHB, MISC, Westports, NCB, Harbour-Link; Source: Maybank KE
Recurring net profit of research universe, 9M 2015 YoY growth (%)
Source: Maybank KE
Key sector comments
Banks: The 3Q15 results season saw disappointments from AMMB
(weak topline), BIMB (higher-than-expected tax rate), HLB (lower
contributions from Bank of Chengdu) and HLFG (weaker HLB
contributions). No banks earnings surprised on the upside.
Operationally, it was a fairly decent quarter, with cumulative income
up 9% YoY in 3Q15 and 7% YoY for 9M15. However, loan loss
allowances more than doubled and as a result, cumulative core net
profit was down 1% YoY in 3Q15 and flat YoY for 9M15.
Cumulative gross loan growth was a robust 15% YoY end-Sep 2015, but
the larger banks benefited significantly from forex translation gains
during the period. Domestic loan growth, meanwhile, was a more
sedate 9.2% YoY, which was generally in line with the industry’s loan
(60.3%)
(46.9%)
(38.1%)
(23.1%)
(22.5%)
(0.7%)
(0.5%)
(0.5%)
4.8%
5.1%
5.8%
6.3%
8.5%
21.3%
45.9%
56.9%
-80% -60% -40% -20% 0% 20% 40% 60% 80%
Oil & gas
Auto
Plantation
Bldg material
Gaming
Telco
Financial
Media
Property & REIT
Utility
Petrochemical
Construction & infrastructure
Consumer
Semi-conductor
Glove producer
Transport

December 2, 2015 4
Strategy Research
growth of 9.7% YoY end-Sep 2015. A positive trend during the quarter
was that several banks were successful in lifting their NIMs, resulting
in an average 4bp QoQ expansion in NIM. This was, however, at the
expense of a higher gross loan/deposit ratio of 93.2% end-Sep 2015 vs
91.7% end-Jun 2015. Credit charge rates, meanwhile, normalized
higher to 40bps in 3Q15 from 31bps in 2Q15.
Looking forward, NIM compression is expected to persist, particularly
amid heavy deposit competition in 4Q15. On a cumulative basis, we
are projecting recurring net profit in 2015 to come in flat (+0.5% YoY)
and to expand by 6% in 2016 (+3.7% YoY ex-CIMB).
Utility: Power results were mixed (Tenaga and Malakoff beat
expectations, YTLP disappointed) while gas results were in line (PGas’
core earnings were slightly ahead but due to lower taxes). Tenaga
achieved a record-low system loss in FY8/15, resulting in full year
earnings beating expectations. Malakoff’s beat was due to lower-than-
expected taxes as operating profits were in line. YTLP’s results were
below expectations due to weak showings at both Power Seraya and
the Wimax division.
Tenaga’s earnings are already at a high base, but could be further
enhanced if it can sustain the current low level of system loss (8.3% in
FY8/15, historical range 10-12%). YTLP has yet to finalise terms for
the PPA extension of its Paka plant. Gas Malaysia meanwhile, is due to
migrate to the IBR regime in Jan 2016. While IBR should theoretically
reduce Gas Malaysia’s earnings volatility, the impact to spreads upon
migration is still unclear for now.
Telco: Telco results were mixed, with Digi and TM below
expectations, Maxis in line, and TDC above expectations. In the
wireless space, Digi’s results were below expectations due to softness
in its prepaid segment. TM’s EBITDA was in line, but a spike in tax rate
resulted in the net profit disappointment. TDC benefitted from the
MYR weakness, as forex gains boosted its margins.
We expect mild sequential earnings growth for all the big-cap telcos
in 4Q15. The wireless players should gradually adapt to the various
challenges that have plagued the industry in recent quarters (GST
implementation problems, price-led competition, migrant segment
weakness). In the fixed line space, 4Q is seasonally a strong quarter
for TM as it closes/completes its managed contracts for the year.
Gaming: The sector faired poorly in the 3Q15 results. First, GENS was
hit by VIP volume share loss of 7ppts QoQ to 40% and provision for
doubtful debts hit a new record. Second, GENM was hit by low VIP
hold rate at GENUK. We estimate that the 3Q15 GENUK VIP hold rate
was down 65% YoY. As GENS and GENM contribute ~80% of GENT’s
earnings, the latter’s results disappointed as well. Positively, GENM’s
Resorts World Genting (RWG) 3Q15 EBITDA and EBITDA margin of 37%
was the highest since 4Q13 on higher gaming volumes YoY (both VIP
and mass market) and lower cost to serve VIPs. For the NFOs, BST
results was in line but Magnum results disappointed, albeit, only due
to higher-than-expected prize payout ratio.
We are still sanguine on the sector going forward. For GENS, we
expect provision for doubtful debts to normalize after another two to
three quarters. For GENM, we expect the GENUK VIP hold rate to
normalize and the opening of new amenities from the Genting

December 2, 2015 5
Strategy Research
Integrated Tourism Plan from mid-2016 (3Q16: Sky Avenue Mall, 4Q16:
Sky Plaza, 2Q17: 20th Century Fox World, 2Q17: 236-room Theme
Park Hotel) to drive visitor arrivals and gaming revenue growth.
Again, as GENS and GENM contribute ~80% of GENT’s earnings, the
aforementioned will flow through to GENT. For Magnum, we expect
the prize payout ratio to normalize at 63-64% going forward.
Plantation: 3Q15 results were broadly below expectations. Out of the
10 stocks under our coverage, 50% fell short (IOI, GENP, SIME, FGV,
SOP), 20% was above (BPLANT, TAH; but largely due to strong timber
earnings for the latter) and 30% in line (KLK, TSH THP). The under-
performance of 3 of the 5 stocks was largely due to non-plantation
related reasons (as their plantation segment’s results were in line). In
the case of SIME, its industrial and motors divisions saw poorer-than-
expected contributions. As for IOI and SOP, they were affected by fair
valuation losses on financial derivative instruments (used as a hedging
instrument) due to the sudden slump in MYR against USD (-14% QoQ at
30 Sep 2015). In addition, IOI had massive unrealized forex translation
losses of MYR854m on its USD debt exposure.
On upstream, the seasonally stronger 3Q15 FFB output (+5.9% QoQ,
+5.8% YoY) for companies under our coverage was offset by lower CPO
ASP (-6.2% QoQ, -7.0% YoY). And 3Q15 FFB output did not reach its
full potential for some, as the bone-dry weather in Kalimantan and
the southern part of Sumatra Island affected FFB output. The one
positive takeaway from this results season is that rainfall is back and
this has resulted in bumper harvests in the affected areas in the
month of October and into early November.
On downstream, Malaysia’s 3Q15 refining margin was negative-to-
breakeven in the absence of CPO export taxes to aid refiners. The
weakened MYR vs. USD also resulted in fair valuation losses on
financial derivatives instruments used to hedge their USD receivables.
Quarterly FFB production, and CPO and PK ASP trend
Company 3Q14 4Q14 1Q15 2Q15 3Q15 4Q15 QoQ YoY FYE
(tonnes) (tonnes) (tonnes) (tonnes) (tonnes) (tonnes) % %
FFB output
SIME- Sime Darby 2,524,437 2,193,539 2,022,264 2,897,307 2,854,359 2,524,437 (1.5) 13.1 June
IOI- IOI Corp 967,203 1,002,804 683,718 888,497 967,406 967,203 8.9 0.0 June
KLK- KL Kepong 1,013,980 954,709 825,549 981,809 1,043,973 1,013,980 6.3 3.0 Sept
FGV- Felda Global 1,340,298 1,254,000 930,018 1,222,735 1,306,435 1,340,298 6.8 (2.5) Dec
GENP -Gent Plant 431,207 473,942 353,078 405,228 468,727 431,207 15.7 8.7 Dec
THP- TH Plant 234,852 194,434 137,988 189,610 251,190 234,852 32.5 7.0 Dec
SOP- Swk Oil Palms 317,744 258,915 198,830 280,571 349,282 317,744 24.5 9.9 Dec
TAH- Ta Ann 179,436 151,271 110,648 149,463 193,025 179,436 29.1 7.6 Dec
TSH- TSH Resources 163,646 157,321 143,258 153,963 152,768 163,646 (0.8) (6.6) Dec
BPlant- Bous Plant 275,008 262,645 211,674 269,179 291,226 275,008 8.2 5.9 Dec
Malaysia sub-total 7,447,811 6,903,580 5,617,025 7,438,362 7,878,391 7,447,811 5.9 5.8
CPO production
Sabah 1,557,448 1,632,858 1,132,799 1,496,246 1,550,793 1,557,448 3.6 (0.4)
Sarawak 1,022,973 924,486 644,888 902,575 1,116,108 1,022,973 23.7 9.1
Peninsular Malaysia 3,013,893 2,451,048 1,999,465 2,869,240 3,158,797 3,013,893 10.1 4.8
Malaysia 5,594,314 5,008,392 3,777,152 5,268,061 5,825,698 5,594,314 10.6 4.1
MPOB – CPO ASP 2,212 2,194 2,263 2,194 2,058 2,212 (6.2) (7.0)
MPOB – PK ASP 1,480 1,451 1,848 1,565 1,410 1,480 (9.9) (4.7)
Source: Companies, MPOB, Maybank KE
December 2, 2015 6
Strategy Research
Below-to-above expectation results
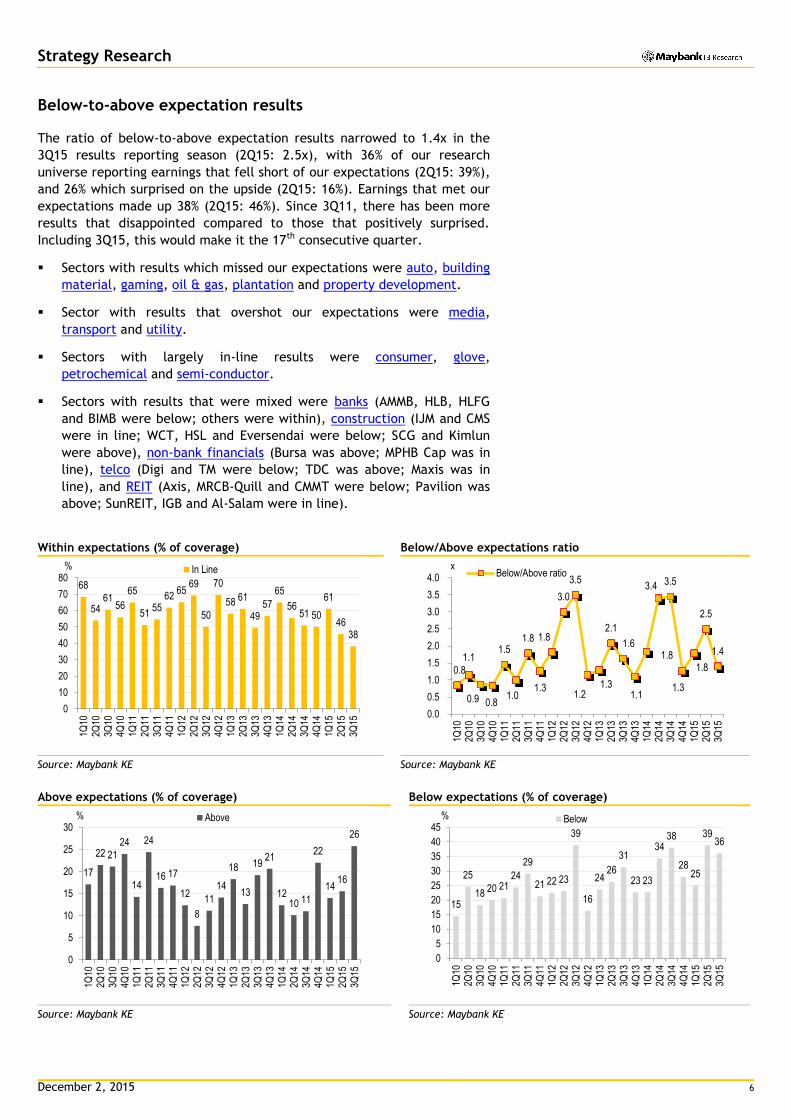
The ratio of below-to-above expectation results narrowed to 1.4x in the
3Q15 results reporting season (2Q15: 2.5x), with 36% of our research
universe reporting earnings that fell short of our expectations (2Q15: 39%),
and 26% which surprised on the upside (2Q15: 16%). Earnings that met our
expectations made up 38% (2Q15: 46%). Since 3Q11, there has been more
results that disappointed compared to those that positively surprised.
Including 3Q15, this would make it the 17th consecutive quarter.
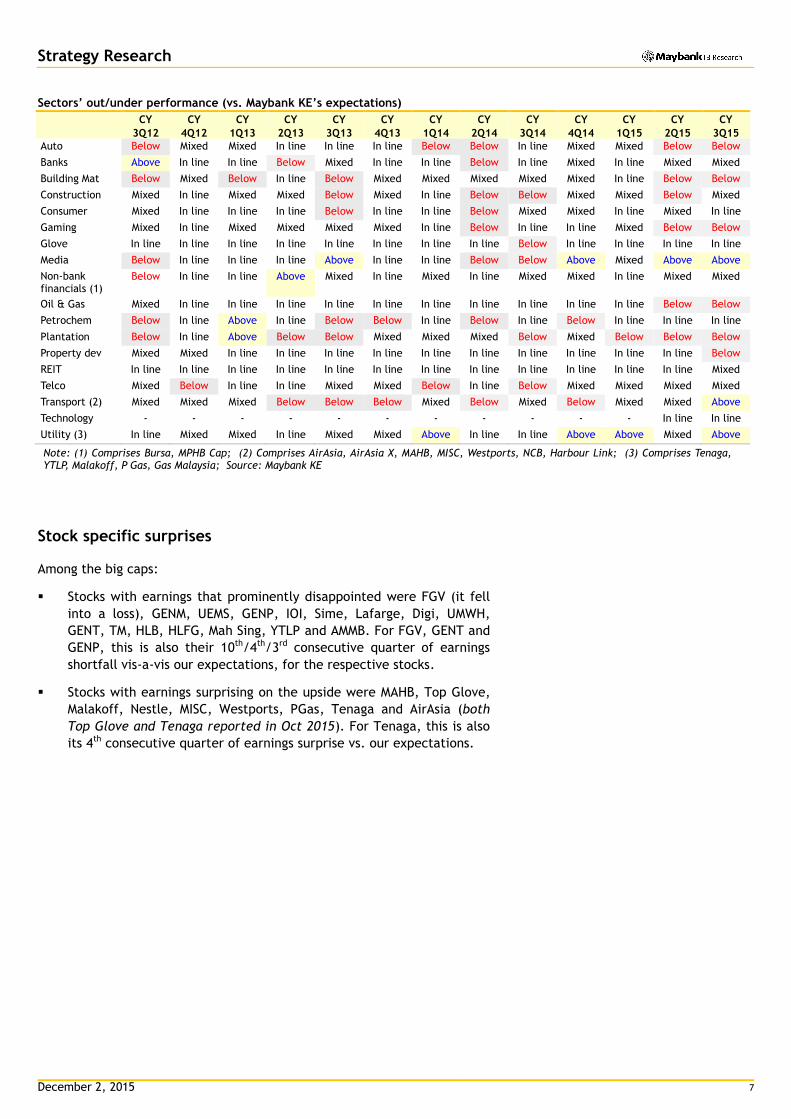
Sectors with results which missed our expectations were auto, building
material, gaming, oil & gas, plantation and property development.
Sector with results that overshot our expectations were media,
transport and utility.
Sectors with largely in-line results were consumer, glove,
petrochemical and semi-conductor.
Sectors with results that were mixed were banks (AMMB, HLB, HLFG
and BIMB were below; others were within), construction (IJM and CMS
were in line; WCT, HSL and Eversendai were below; SCG and Kimlun
were above), non-bank financials (Bursa was above; MPHB Cap was in
line), telco (Digi and TM were below; TDC was above; Maxis was in
line), and REIT (Axis, MRCB-Quill and CMMT were below; Pavilion was
above; SunREIT, IGB and Al-Salam were in line).
Within expectations (% of coverage) Below/Above expectations ratio
Source: Maybank KE Source: Maybank KE
Above expectations (% of coverage) Below expectations (% of coverage)
Source: Maybank KE Source: Maybank KE
68
5461
56
65
5155
6265
69
50
70
58 61
4957
65
5651 50
61
4638
0
10
20
30
40
50
60
70
80
1Q10
2Q10
3Q10
4Q10
1Q11
2Q11
3Q11
4Q11
1Q12
2Q12
3Q12
4Q12
1Q13
2Q13
3Q13
4Q13
1Q14
2Q14
3Q14
4Q14
1Q15
2Q15
3Q15
% In Line
0.8
1.1
0.9 0.8
1.5
1.0
1.8
1.3
1.8
3.0
3.5
1.2 1.3
2.1
1.6
1.1
1.8
3.4 3.5
1.3
1.8
2.5
1.4
0.0
0.5
1.0
1.5
2.0
2.5
3.0
3.5
4.0
1Q10
2Q10
3Q10
4Q10
1Q11
2Q11
3Q11
4Q11
1Q12
2Q12
3Q12
4Q12
1Q13
2Q13
3Q13
4Q13
1Q14
2Q14
3Q14
4Q14
1Q15
2Q15
3Q15
xBelow/Above ratio
17
22 21
24
14
24
16 17
12
8
11
14
18
13
1921
1210 11
22
1416
26
0
5
10
15
20
25
30
1Q10
2Q10
3Q10
4Q10
1Q11
2Q11
3Q11
4Q11
1Q12
2Q12
3Q12
4Q12
1Q13
2Q13
3Q13
4Q13
1Q14
2Q14
3Q14
4Q14
1Q15
2Q15
3Q15
% Above
15
25
18 20 2124
29
21 22 23
39
16
2426
31
23 23
3438
2825
3936
0
5
10
15
20
25
30
35
40
45
1Q10
2Q10
3Q10
4Q10
1Q11
2Q11
3Q11
4Q11
1Q12
2Q12
3Q12
4Q12
1Q13
2Q13
3Q13
4Q13
1Q14
2Q14
3Q14
4Q14
1Q15
2Q15
3Q15
% Below
December 2, 2015 7
Strategy Research
Sectors’ out/under performance (vs. Maybank KE’s expectations)
CY
3Q12
CY
4Q12
CY
1Q13
CY
2Q13
CY
3Q13
CY
4Q13
CY
1Q14
CY
2Q14
CY
3Q14
CY
4Q14
CY
1Q15
CY
2Q15
CY
3Q15
Auto Below Mixed Mixed In line In line In line Below Below In line Mixed Mixed Below Below
Banks Above In line In line Below Mixed In line In line Below In line Mixed In line Mixed Mixed
Building Mat Below Mixed Below In line Below Mixed Mixed Mixed Mixed Mixed In line Below Below
Construction Mixed In line Mixed Mixed Below Mixed In line Below Below Mixed Mixed Below Mixed
Consumer Mixed In line In line In line Below In line In line Below Mixed Mixed In line Mixed In line
Gaming Mixed In line Mixed Mixed Mixed Mixed In line Below In line In line Mixed Below Below
Glove In line In line In line In line In line In line In line In line Below In line In line In line In line
Media Below In line In line In line Above In line In line Below Below Above Mixed Above Above
Non-bank financials (1)
Below In line In line Above Mixed In line Mixed In line Mixed Mixed In line Mixed Mixed
Oil & Gas Mixed In line In line In line In line In line In line In line In line In line In line Below Below
Petrochem Below In line Above In line Below Below In line Below In line Below In line In line In line
Plantation Below In line Above Below Below Mixed Mixed Mixed Below Mixed Below Below Below
Property dev Mixed Mixed In line In line In line In line In line In line In line In line In line In line Below
REIT In line In line In line In line In line In line In line
In line In line In line In line In line Mixed
Telco Mixed Below In line In line Mixed Mixed Below In line Below Mixed Mixed Mixed Mixed
Transport (2) Mixed Mixed Mixed Below Below Below Mixed Below Mixed Below Mixed Mixed Above
Technology - - - - - - - - - - - In line In line
Utility (3) In line Mixed Mixed In line Mixed Mixed Above In line In line Above Above Mixed Above
Note: (1) Comprises Bursa, MPHB Cap; (2) Comprises AirAsia, AirAsia X, MAHB, MISC, Westports, NCB, Harbour Link; (3) Comprises Tenaga, YTLP, Malakoff, P Gas, Gas Malaysia; Source: Maybank KE
Stock specific surprises
Among the big caps:
Stocks with earnings that prominently disappointed were FGV (it fell
into a loss), GENM, UEMS, GENP, IOI, Sime, Lafarge, Digi, UMWH,
GENT, TM, HLB, HLFG, Mah Sing, YTLP and AMMB. For FGV, GENT and
GENP, this is also their 10th/4th/3rd consecutive quarter of earnings
shortfall vis-a-vis our expectations, for the respective stocks.
Stocks with earnings surprising on the upside were MAHB, Top Glove,
Malakoff, Nestle, MISC, Westports, PGas, Tenaga and AirAsia (both
Top Glove and Tenaga reported in Oct 2015). For Tenaga, this is also
its 4th consecutive quarter of earnings surprise vs. our expectations.
December 2, 2015 8
Strategy Research
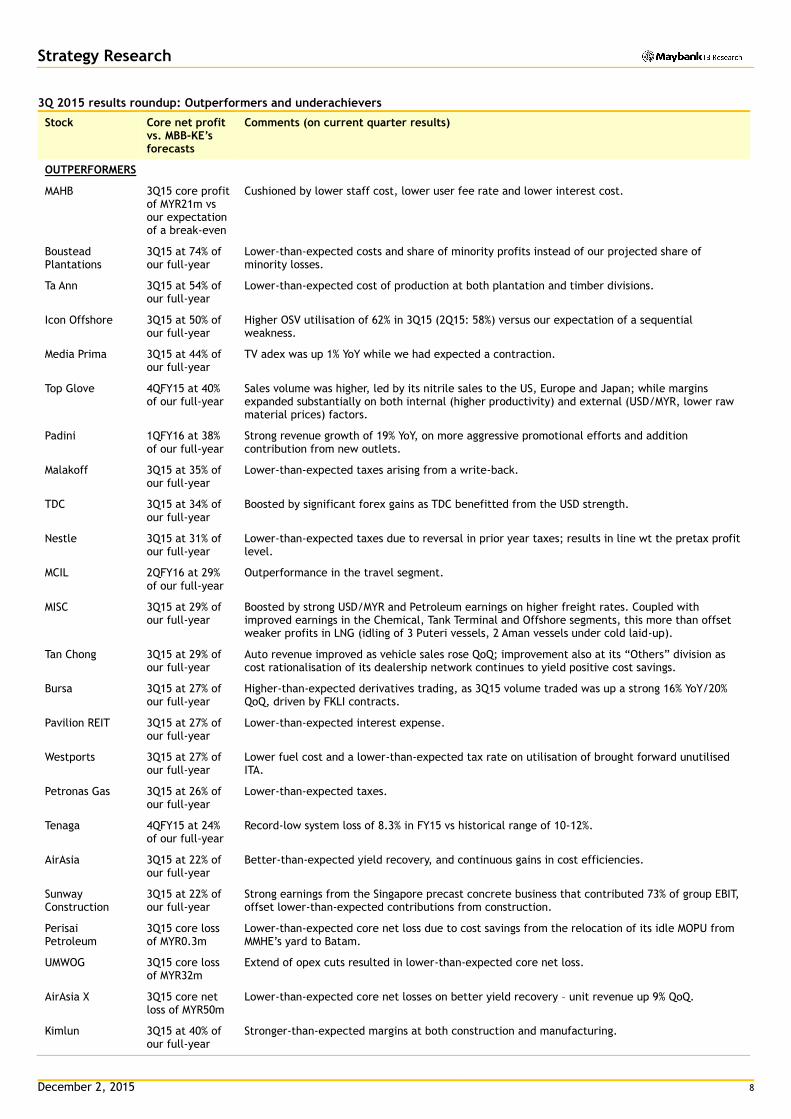
3Q 2015 results roundup: Outperformers and underachievers
Stock Core net profit vs. MBB-KE’s forecasts
Comments (on current quarter results)
OUTPERFORMERS
MAHB 3Q15 core profit of MYR21m vs our expectation of a break-even
Cushioned by lower staff cost, lower user fee rate and lower interest cost.
Boustead Plantations
3Q15 at 74% of our full-year
Lower-than-expected costs and share of minority profits instead of our projected share of minority losses.
Ta Ann 3Q15 at 54% of our full-year
Lower-than-expected cost of production at both plantation and timber divisions.
Icon Offshore 3Q15 at 50% of our full-year
Higher OSV utilisation of 62% in 3Q15 (2Q15: 58%) versus our expectation of a sequential weakness.
Media Prima 3Q15 at 44% of our full-year
TV adex was up 1% YoY while we had expected a contraction.
Top Glove 4QFY15 at 40% of our full-year
Sales volume was higher, led by its nitrile sales to the US, Europe and Japan; while margins expanded substantially on both internal (higher productivity) and external (USD/MYR, lower raw material prices) factors.
Padini 1QFY16 at 38% of our full-year
Strong revenue growth of 19% YoY, on more aggressive promotional efforts and addition contribution from new outlets.
Malakoff 3Q15 at 35% of our full-year
Lower-than-expected taxes arising from a write-back.
TDC 3Q15 at 34% of our full-year
Boosted by significant forex gains as TDC benefitted from the USD strength.
Nestle 3Q15 at 31% of our full-year
Lower-than-expected taxes due to reversal in prior year taxes; results in line wt the pretax profit level.
MCIL 2QFY16 at 29% of our full-year
Outperformance in the travel segment.
MISC 3Q15 at 29% of our full-year
Boosted by strong USD/MYR and Petroleum earnings on higher freight rates. Coupled with improved earnings in the Chemical, Tank Terminal and Offshore segments, this more than offset weaker profits in LNG (idling of 3 Puteri vessels, 2 Aman vessels under cold laid-up).
Tan Chong 3Q15 at 29% of our full-year
Auto revenue improved as vehicle sales rose QoQ; improvement also at its “Others” division as cost rationalisation of its dealership network continues to yield positive cost savings.
Bursa 3Q15 at 27% of our full-year
Higher-than-expected derivatives trading, as 3Q15 volume traded was up a strong 16% YoY/20% QoQ, driven by FKLI contracts.
Pavilion REIT 3Q15 at 27% of our full-year
Lower-than-expected interest expense.
Westports 3Q15 at 27% of our full-year
Lower fuel cost and a lower-than-expected tax rate on utilisation of brought forward unutilised ITA.
Petronas Gas 3Q15 at 26% of our full-year
Lower-than-expected taxes.
Tenaga 4QFY15 at 24% of our full-year
Record-low system loss of 8.3% in FY15 vs historical range of 10-12%.
AirAsia 3Q15 at 22% of our full-year
Better-than-expected yield recovery, and continuous gains in cost efficiencies.
Sunway Construction
3Q15 at 22% of our full-year
Strong earnings from the Singapore precast concrete business that contributed 73% of group EBIT, offset lower-than-expected contributions from construction.
Perisai Petroleum
3Q15 core loss of MYR0.3m
Lower-than-expected core net loss due to cost savings from the relocation of its idle MOPU from MMHE’s yard to Batam.
UMWOG 3Q15 core loss of MYR32m
Extend of opex cuts resulted in lower-than-expected core net loss.
AirAsia X 3Q15 core net loss of MYR50m
Lower-than-expected core net losses on better yield recovery – unit revenue up 9% QoQ.
Kimlun 3Q15 at 40% of our full-year
Stronger-than-expected margins at both construction and manufacturing.
December 2, 2015 9
Strategy Research
3Q 2015 results roundup: Outperformers and underachievers
Stock Core net profit vs. MBB-KE’s forecasts
Comments (on current quarter results)
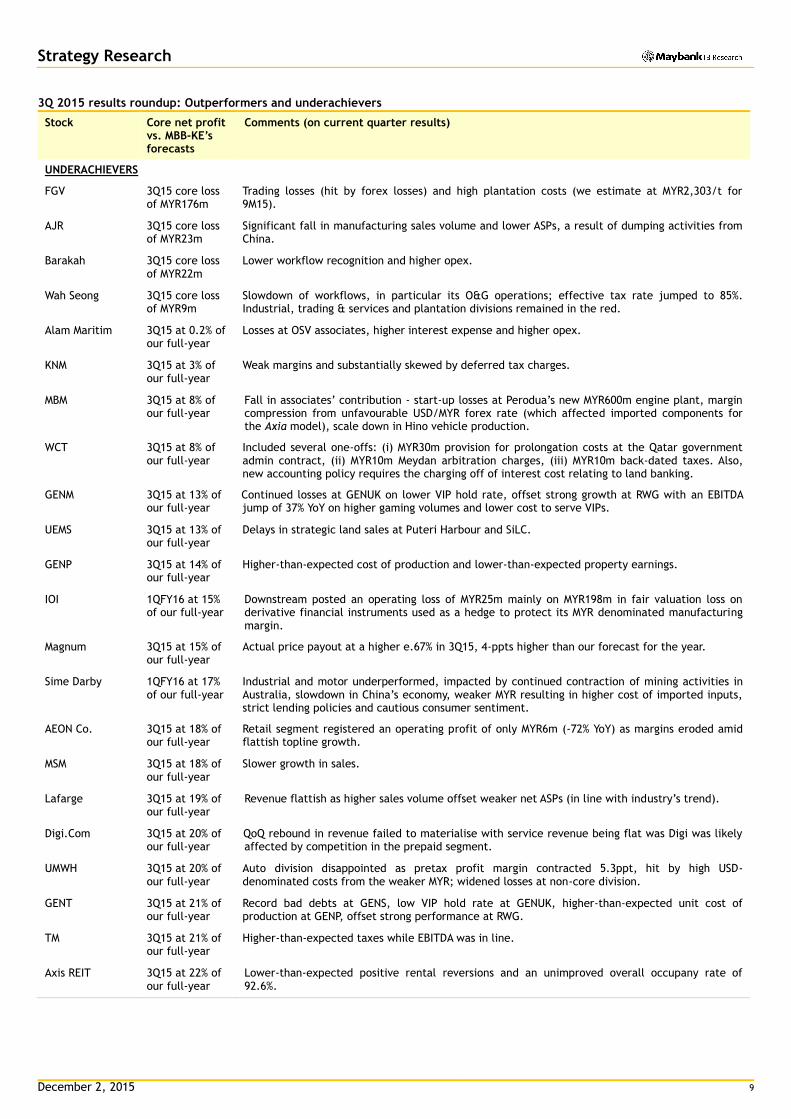
UNDERACHIEVERS
FGV 3Q15 core loss of MYR176m
Trading losses (hit by forex losses) and high plantation costs (we estimate at MYR2,303/t for 9M15).
AJR 3Q15 core loss of MYR23m
Significant fall in manufacturing sales volume and lower ASPs, a result of dumping activities from China.
Barakah 3Q15 core loss of MYR22m
Lower workflow recognition and higher opex.
Wah Seong 3Q15 core loss of MYR9m
Slowdown of workflows, in particular its O&G operations; effective tax rate jumped to 85%. Industrial, trading & services and plantation divisions remained in the red.
Alam Maritim 3Q15 at 0.2% of our full-year
Losses at OSV associates, higher interest expense and higher opex.
KNM 3Q15 at 3% of our full-year
Weak margins and substantially skewed by deferred tax charges.
MBM 3Q15 at 8% of our full-year
Fall in associates’ contribution - start-up losses at Perodua’s new MYR600m engine plant, margin compression from unfavourable USD/MYR forex rate (which affected imported components for the Axia model), scale down in Hino vehicle production.
WCT 3Q15 at 8% of our full-year
Included several one-offs: (i) MYR30m provision for prolongation costs at the Qatar government admin contract, (ii) MYR10m Meydan arbitration charges, (iii) MYR10m back-dated taxes. Also, new accounting policy requires the charging off of interest cost relating to land banking.
GENM 3Q15 at 13% of our full-year
Continued losses at GENUK on lower VIP hold rate, offset strong growth at RWG with an EBITDA jump of 37% YoY on higher gaming volumes and lower cost to serve VIPs.
UEMS 3Q15 at 13% of our full-year
Delays in strategic land sales at Puteri Harbour and SiLC.
GENP 3Q15 at 14% of our full-year
Higher-than-expected cost of production and lower-than-expected property earnings.
IOI 1QFY16 at 15% of our full-year
Downstream posted an operating loss of MYR25m mainly on MYR198m in fair valuation loss on derivative financial instruments used as a hedge to protect its MYR denominated manufacturing margin.
Magnum 3Q15 at 15% of our full-year
Actual price payout at a higher e.67% in 3Q15, 4-ppts higher than our forecast for the year.
Sime Darby 1QFY16 at 17% of our full-year
Industrial and motor underperformed, impacted by continued contraction of mining activities in Australia, slowdown in China’s economy, weaker MYR resulting in higher cost of imported inputs, strict lending policies and cautious consumer sentiment.
AEON Co. 3Q15 at 18% of our full-year
Retail segment registered an operating profit of only MYR6m (-72% YoY) as margins eroded amid flattish topline growth.
MSM 3Q15 at 18% of our full-year
Slower growth in sales.
Lafarge 3Q15 at 19% of our full-year
Revenue flattish as higher sales volume offset weaker net ASPs (in line with industry’s trend).
Digi.Com 3Q15 at 20% of our full-year
QoQ rebound in revenue failed to materialise with service revenue being flat was Digi was likely affected by competition in the prepaid segment.
UMWH 3Q15 at 20% of our full-year
Auto division disappointed as pretax profit margin contracted 5.3ppt, hit by high USD-denominated costs from the weaker MYR; widened losses at non-core division.
GENT 3Q15 at 21% of our full-year
Record bad debts at GENS, low VIP hold rate at GENUK, higher-than-expected unit cost of production at GENP, offset strong performance at RWG.
TM 3Q15 at 21% of our full-year
Higher-than-expected taxes while EBITDA was in line.
Axis REIT 3Q15 at 22% of our full-year
Lower-than-expected positive rental reversions and an unimproved overall occupany rate of 92.6%.
December 2, 2015 10
Strategy Research
3Q 2015 results roundup: Outperformers and underachievers
Stock Core net profit vs. MBB-KE’s forecasts
Comments (on current quarter results)
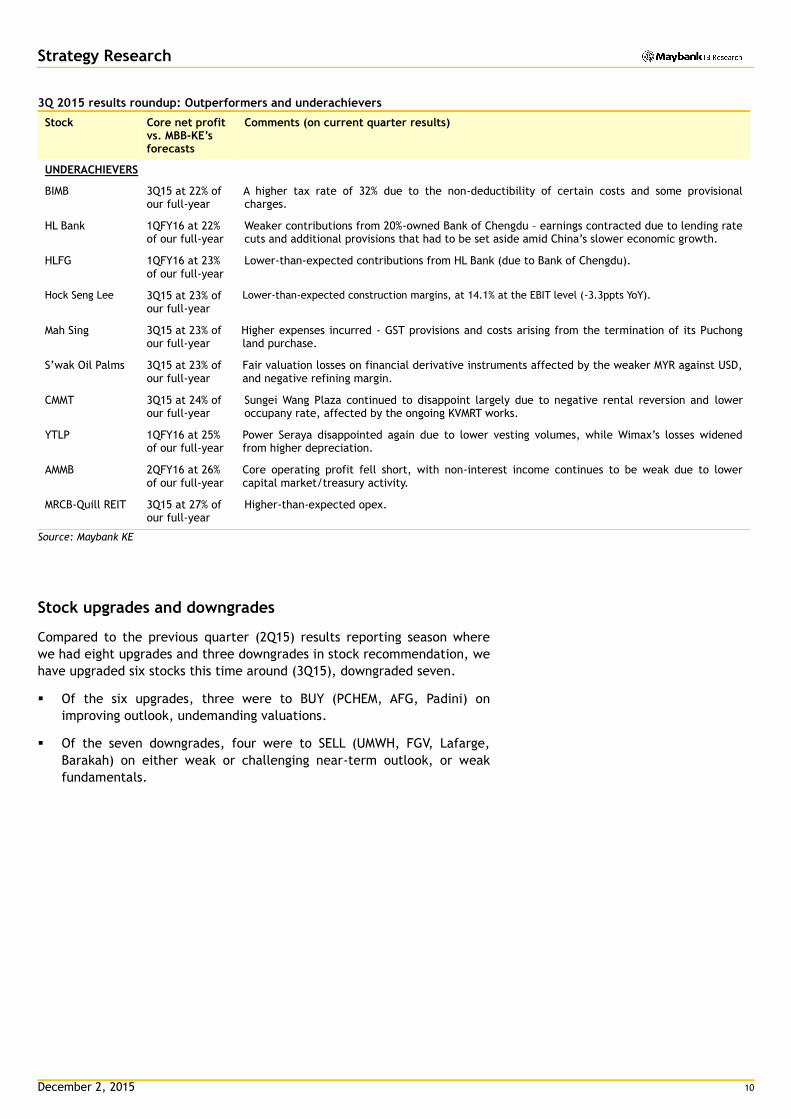
UNDERACHIEVERS
BIMB 3Q15 at 22% of our full-year
A higher tax rate of 32% due to the non-deductibility of certain costs and some provisional charges.
HL Bank 1QFY16 at 22% of our full-year
Weaker contributions from 20%-owned Bank of Chengdu – earnings contracted due to lending rate cuts and additional provisions that had to be set aside amid China’s slower economic growth.
HLFG 1QFY16 at 23% of our full-year
Lower-than-expected contributions from HL Bank (due to Bank of Chengdu).
Hock Seng Lee 3Q15 at 23% of our full-year
Lower-than-expected construction margins, at 14.1% at the EBIT level (-3.3ppts YoY).
Mah Sing 3Q15 at 23% of our full-year
Higher expenses incurred - GST provisions and costs arising from the termination of its Puchong land purchase.
S’wak Oil Palms 3Q15 at 23% of our full-year
Fair valuation losses on financial derivative instruments affected by the weaker MYR against USD, and negative refining margin.
CMMT 3Q15 at 24% of our full-year
Sungei Wang Plaza continued to disappoint largely due to negative rental reversion and lower occupany rate, affected by the ongoing KVMRT works.
YTLP 1QFY16 at 25% of our full-year
Power Seraya disappointed again due to lower vesting volumes, while Wimax’s losses widened from higher depreciation.
AMMB 2QFY16 at 26% of our full-year
Core operating profit fell short, with non-interest income continues to be weak due to lower capital market/treasury activity.
MRCB-Quill REIT 3Q15 at 27% of our full-year
Higher-than-expected opex.
Source: Maybank KE
Stock upgrades and downgrades
Compared to the previous quarter (2Q15) results reporting season where
we had eight upgrades and three downgrades in stock recommendation, we
have upgraded six stocks this time around (3Q15), downgraded seven.
Of the six upgrades, three were to BUY (PCHEM, AFG, Padini) on
improving outlook, undemanding valuations.
Of the seven downgrades, four were to SELL (UMWH, FGV, Lafarge,
Barakah) on either weak or challenging near-term outlook, or weak
fundamentals.

December 2, 2015 11
Strategy Research
3Q 2015 results roundup: Stock upgrades and downgrades
Stock Old Call New Call Old TP New TP Reason for upgrades / downgrades
UPGRADES
Petronas Chemicals Hold Buy 6.60 7.80 Improving outlook on high plant utilisation rates and operational reliability, translating into stronger growth ahead. Valuations undemanding.
AFG Hold Buy 4.00 4.20 Strong capital base (CET1 ratio 11.4%), liquid balance sheet (LDR: 86%) - these are critical qualities in the prevailing challenging environment. Valuations undemanding.
Padini Hold Buy 1.30 1.90 Near-term earnings growth to be supported by existing and new outlets; attractive valuations at just 8.7x FY6/16 PER.
Icon Offshore Sell Hold 0.20 0.37 Improving outlook; OSV sector outlook has stabilised with most of the negatives priced in.
Perisai Petroleum Sell Hold 0.22 0.29 Improving outlook; we now expect its MOPU to secure a contract from 1H16, and it is also negotiating for a contract for its 2nd JU rig by end-2015.
UMWOG Sell Hold 0.80 1.25 Improving outlook; with several tenders for rig charters up for grabs by 1H16 which UMWOG could participate in.
DOWNGRADES
UMWH Hold Sell 7.80 7.15 Weak near-term outlook especially in the Auto division. Pricey valuations.
FGV Hold Sell 1.30 1.30 Poor earnings outlook – plantation cost of production above current CPO price, weaker FFB output in 2016 and new minimum wage from 1 Jul 2016. Also, uncertainties on the PT Eagle High deal. Valuations are pricey.
Lafarge Hold Sell 9.30 7.00 Challenges into 2016, with industry capacity in Peninsular could grow 15%, outstripping demand growth of 4-5%, pressuring ASPs.
Barakah Hold Sell 0.75 0.65 Replenishment target for 2015 unlikely to be met; next 12 months will be challenging. Valuations post earnings revision are more expensive vis-à-vis its peers.
GENP Buy Hold 10.55 10.50 2% downside to our revised SOP-TP after lowering earnings for higher cost of production, lower property sales forecasts.
MBM Buy Hold 3.50 3.00 We see further risk in 2016 vehicle sales, profit margins due to competition. Current valuations fair amid the risks.
MRCB-Quill REIT Buy Hold 1.17 1.15 Reduced total return potential after our earnings downgrade.
Source: Maybank KE
December 2, 2015 12
Strategy Research
Market earnings & valuations
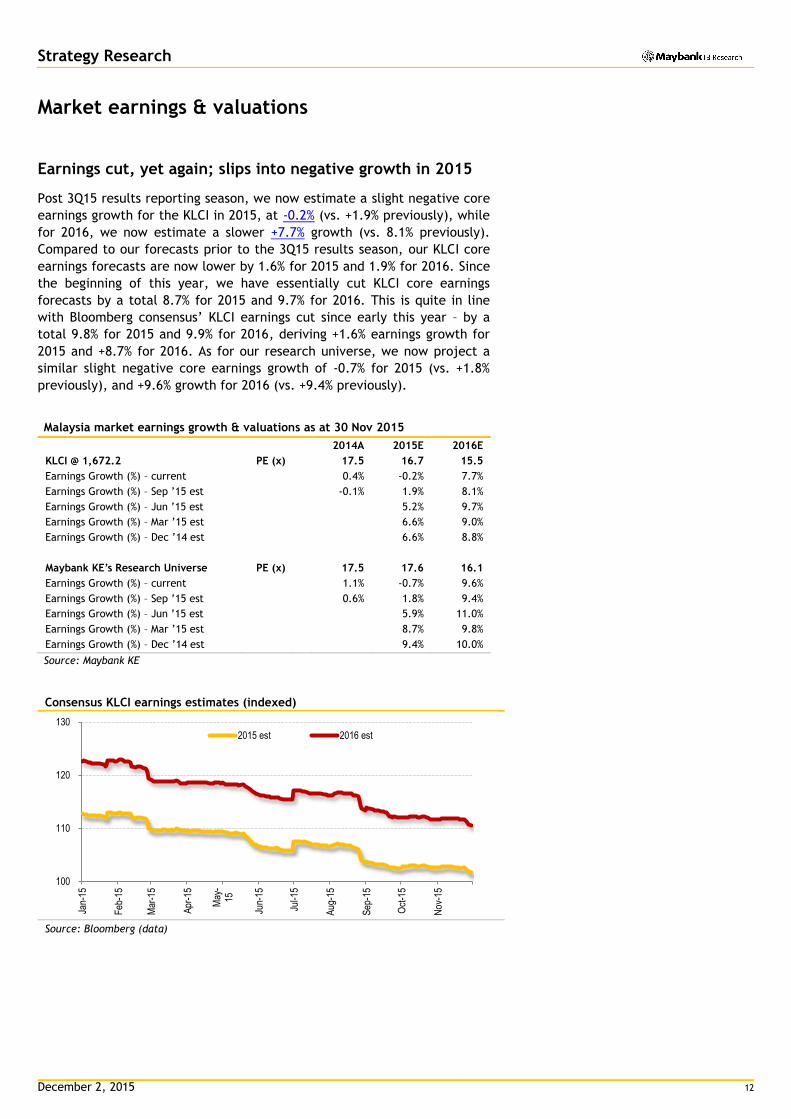
Earnings cut, yet again; slips into negative growth in 2015
Post 3Q15 results reporting season, we now estimate a slight negative core
earnings growth for the KLCI in 2015, at -0.2% (vs. +1.9% previously), while
for 2016, we now estimate a slower +7.7% growth (vs. 8.1% previously).
Compared to our forecasts prior to the 3Q15 results season, our KLCI core
earnings forecasts are now lower by 1.6% for 2015 and 1.9% for 2016. Since
the beginning of this year, we have essentially cut KLCI core earnings
forecasts by a total 8.7% for 2015 and 9.7% for 2016. This is quite in line
with Bloomberg consensus’ KLCI earnings cut since early this year – by a
total 9.8% for 2015 and 9.9% for 2016, deriving +1.6% earnings growth for
2015 and +8.7% for 2016. As for our research universe, we now project a
similar slight negative core earnings growth of -0.7% for 2015 (vs. +1.8%
previously), and +9.6% growth for 2016 (vs. +9.4% previously).
Malaysia market earnings growth & valuations as at 30 Nov 2015
2014A 2015E 2016E
KLCI @ 1,672.2 PE (x) 17.5 16.7 15.5
Earnings Growth (%) – current 0.4% -0.2% 7.7%
Earnings Growth (%) – Sep ’15 est -0.1% 1.9% 8.1%
Earnings Growth (%) – Jun ’15 est 5.2% 9.7%
Earnings Growth (%) – Mar ’15 est 6.6% 9.0%
Earnings Growth (%) – Dec ’14 est 6.6% 8.8%
Maybank KE’s Research Universe PE (x) 17.5 17.6 16.1
Earnings Growth (%) – current 1.1% -0.7% 9.6%
Earnings Growth (%) – Sep ’15 est 0.6% 1.8% 9.4%
Earnings Growth (%) – Jun ’15 est 5.9% 11.0%
Earnings Growth (%) – Mar ’15 est 8.7% 9.8%
Earnings Growth (%) – Dec ’14 est 9.4% 10.0%
Source: Maybank KE
Consensus KLCI earnings estimates (indexed)
Source: Bloomberg (data)
100
110
120
130
Jan-
15
Feb
-15
Mar
-15
Apr
-15
May
-15
Jun-
15
Jul-1
5
Aug
-15
Sep
-15
Oct
-15
Nov
-15
2015 est 2016 est

December 2, 2015 13
Strategy Research
Research Universe: Earnings breakdown by sector – CY15 KLCI 30: Earnings breakdown by sector – CY15
Source: Maybank KE Source: Maybank KE
More sectors with negative growth in 2015
There are now more sectors with projected negative core earnings growth
in 2015 – non-bank financial (due to MPHB Cap), building material, auto,
gaming (NFO and casino), oil & gas, plantation and property development.
In addition, banks and telco earnings are just about flat YoY. With the
exception of gaming (casino), the aforementioned sectors with projected
negative core earnings growth in 2015 are largely domestic oriented/
focused. In contrast, the export (glove, petrochemical, semi-conductor)
and external related sectors (aviation, shipping, ports) are projected to
grow in 2015, helped by the MYR weakness. Meanwhile, the domestic
focused sectors which are expected to record core earnings growth in 2015
are consumer, construction, media, REIT and utility.
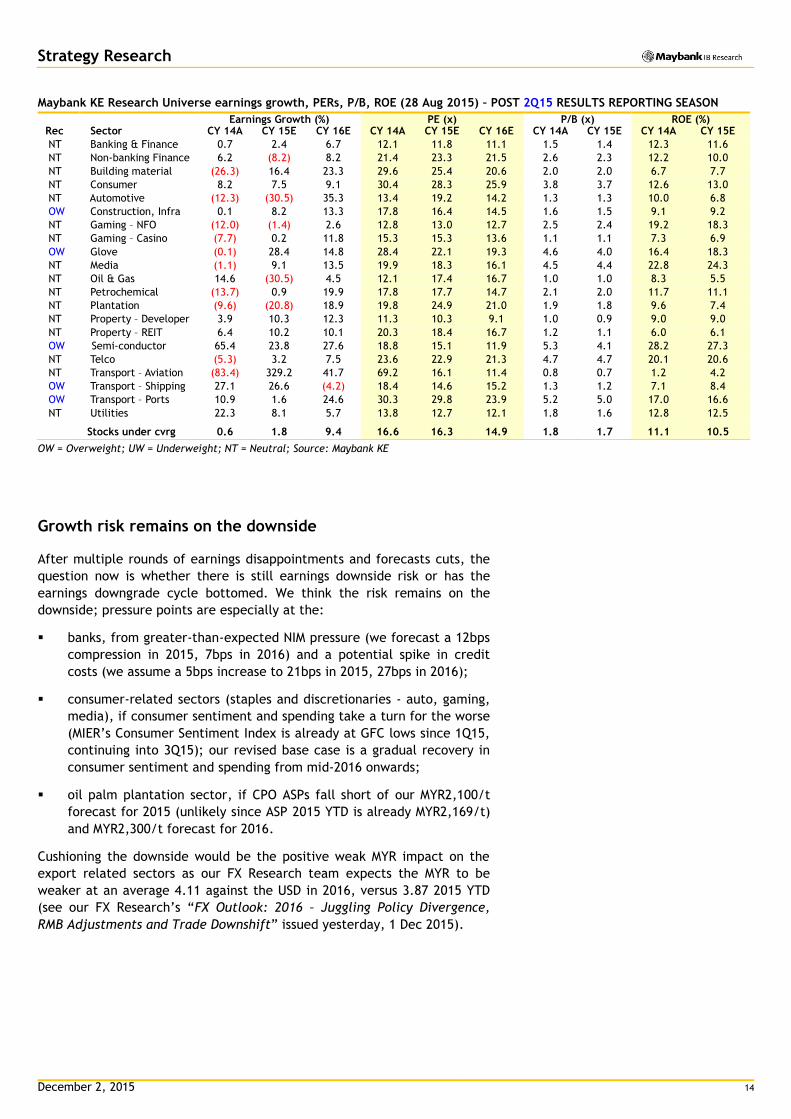
Maybank KE Research Universe earnings growth, PERs, P/B, ROE (30 Nov 2015) – POST 3Q15 RESULTS REPORTING SEASON
Earnings Growth (%) PE (x) P/B (x) ROE (%) Rec Sector CY 14A CY 15E CY 16E CY 14A CY 15E CY 16E CY 14A CY 15E CY 14A CY 15E
NT Banking & Finance 0.7 0.1 5.1 12.1 12.1 11.5 1.5 1.3 12.3 11.1
NT Non-banking Finance 6.2 (5.2) 8.8 22.0 23.2 21.3 2.7 2.4 12.2 10.3
NT Building material (26.3) (17.3) 26.6 28.9 34.9 27.6 1.9 1.9 6.7 5.5
NT Consumer 8.5 7.6 10.1 31.6 29.4 26.7 4.0 3.8 12.6 13.0
NT Automotive (5.2) (38.9) 29.0 12.0 19.6 15.2 1.3 1.3 10.9 6.5
OW Construction, Infra 1.1 6.4 13.7 18.8 17.7 15.6 1.8 1.7 9.5 9.3
NT Gaming – NFO (12.0) (1.4) 0.2 13.1 13.3 13.3 2.5 2.4 19.2 18.3
OW Gaming – Casino (7.7) (20.9) 32.9 16.5 20.9 15.7 1.2 1.2 7.3 5.5
OW Glove 2.1 34.4 16.3 34.9 26.0 22.3 5.8 5.0 16.6 19.1
NT Media (1.1) 9.6 10.1 20.0 18.3 16.6 4.6 4.4 22.8 24.2
NT Oil & Gas 14.0 (34.3) 0.4 13.9 21.1 21.1 1.1 1.1 8.2 5.3
OW Petrochemical (13.7) 3.5 24.3 19.8 19.1 15.4 2.3 2.2 11.7 11.3
NT Plantation (9.5) (20.5) 18.1 21.7 27.3 23.1 2.1 2.0 9.5 7.2
NT Property – Developer 4.4 (1.5) 9.3 12.0 12.2 11.1 1.1 1.0 9.0 8.4
NT Property – REIT 6.2 8.4 8.9 20.9 19.3 17.7 1.2 1.1 6.0 5.9
OW Semi-conductor 64.4 28.0 30.6 23.7 18.5 14.2 6.6 5.2 28.0 27.9
NT Telco (5.3) (0.1) 8.2 23.5 23.5 21.8 4.7 4.7 20.1 19.9
NT Transport – Aviation (83.4) 238.2 93.0 91.5 27.1 14.0 1.1 0.9 1.2 3.4
OW Transport – Shipping 27.1 26.6 (2.5) 21.0 16.6 17.0 1.5 1.4 7.1 8.5
OW Transport – Ports 10.9 2.1 20.3 30.9 30.3 25.2 5.3 5.1 17.0 16.7
OW Utilities 25.0 11.1 3.8 15.3 13.8 13.3 2.0 1.8 13.2 13.2
Stocks under cvrg 1.1 (0.7) 9.6 17.5 17.6 16.1 1.9 1.8 11.1 10.3
OW = Overweight; UW = Underweight; NT = Neutral; Source: Maybank KE
Banking & Finance
33%
Automotive 1%Construction,
Infra 3%
Gaming 5%
Gloves 1% Media
2%
Oil & Gas 3%
Plantation 7%
Property 6%
Consumer5%
Telcos 10%
Transport 6%
Utilities 15%
Banking & Financials
41%Consumer4%
Gaming5%
Oil & Gas5%
Plantations9%
Property1%
Telcos13%
Transport3%
Utilities18% Media
1%
December 2, 2015 14
Strategy Research
Maybank KE Research Universe earnings growth, PERs, P/B, ROE (28 Aug 2015) – POST 2Q15 RESULTS REPORTING SEASON
Earnings Growth (%) PE (x) P/B (x) ROE (%) Rec Sector CY 14A CY 15E CY 16E CY 14A CY 15E CY 16E CY 14A CY 15E CY 14A CY 15E
NT Banking & Finance 0.7 2.4 6.7 12.1 11.8 11.1 1.5 1.4 12.3 11.6
NT Non-banking Finance 6.2 (8.2) 8.2 21.4 23.3 21.5 2.6 2.3 12.2 10.0
NT Building material (26.3) 16.4 23.3 29.6 25.4 20.6 2.0 2.0 6.7 7.7
NT Consumer 8.2 7.5 9.1 30.4 28.3 25.9 3.8 3.7 12.6 13.0
NT Automotive (12.3) (30.5) 35.3 13.4 19.2 14.2 1.3 1.3 10.0 6.8
OW Construction, Infra 0.1 8.2 13.3 17.8 16.4 14.5 1.6 1.5 9.1 9.2
NT Gaming – NFO (12.0) (1.4) 2.6 12.8 13.0 12.7 2.5 2.4 19.2 18.3
NT Gaming – Casino (7.7) 0.2 11.8 15.3 15.3 13.6 1.1 1.1 7.3 6.9
OW Glove (0.1) 28.4 14.8 28.4 22.1 19.3 4.6 4.0 16.4 18.3
NT Media (1.1) 9.1 13.5 19.9 18.3 16.1 4.5 4.4 22.8 24.3
NT Oil & Gas 14.6 (30.5) 4.5 12.1 17.4 16.7 1.0 1.0 8.3 5.5
NT Petrochemical (13.7) 0.9 19.9 17.8 17.7 14.7 2.1 2.0 11.7 11.1
NT Plantation (9.6) (20.8) 18.9 19.8 24.9 21.0 1.9 1.8 9.6 7.4
NT Property – Developer 3.9 10.3 12.3 11.3 10.3 9.1 1.0 0.9 9.0 9.0
NT Property – REIT 6.4 10.2 10.1 20.3 18.4 16.7 1.2 1.1 6.0 6.1
OW Semi-conductor 65.4 23.8 27.6 18.8 15.1 11.9 5.3 4.1 28.2 27.3
NT Telco (5.3) 3.2 7.5 23.6 22.9 21.3 4.7 4.7 20.1 20.6
NT Transport – Aviation (83.4) 329.2 41.7 69.2 16.1 11.4 0.8 0.7 1.2 4.2
OW Transport – Shipping 27.1 26.6 (4.2) 18.4 14.6 15.2 1.3 1.2 7.1 8.4
OW Transport – Ports 10.9 1.6 24.6 30.3 29.8 23.9 5.2 5.0 17.0 16.6
NT Utilities 22.3 8.1 5.7 13.8 12.7 12.1 1.8 1.6 12.8 12.5
Stocks under cvrg 0.6 1.8 9.4 16.6 16.3 14.9 1.8 1.7 11.1 10.5
OW = Overweight; UW = Underweight; NT = Neutral; Source: Maybank KE
Growth risk remains on the downside
After multiple rounds of earnings disappointments and forecasts cuts, the
question now is whether there is still earnings downside risk or has the
earnings downgrade cycle bottomed. We think the risk remains on the
downside; pressure points are especially at the:
banks, from greater-than-expected NIM pressure (we forecast a 12bps
compression in 2015, 7bps in 2016) and a potential spike in credit
costs (we assume a 5bps increase to 21bps in 2015, 27bps in 2016);
consumer-related sectors (staples and discretionaries - auto, gaming,
media), if consumer sentiment and spending take a turn for the worse
(MIER’s Consumer Sentiment Index is already at GFC lows since 1Q15,
continuing into 3Q15); our revised base case is a gradual recovery in
consumer sentiment and spending from mid-2016 onwards;
oil palm plantation sector, if CPO ASPs fall short of our MYR2,100/t
forecast for 2015 (unlikely since ASP 2015 YTD is already MYR2,169/t)
and MYR2,300/t forecast for 2016.
Cushioning the downside would be the positive weak MYR impact on the
export related sectors as our FX Research team expects the MYR to be
weaker at an average 4.11 against the USD in 2016, versus 3.87 2015 YTD
(see our FX Research’s “FX Outlook: 2016 – Juggling Policy Divergence,
RMB Adjustments and Trade Downshift” issued yesterday, 1 Dec 2015).
December 2, 2015 15
Strategy Research
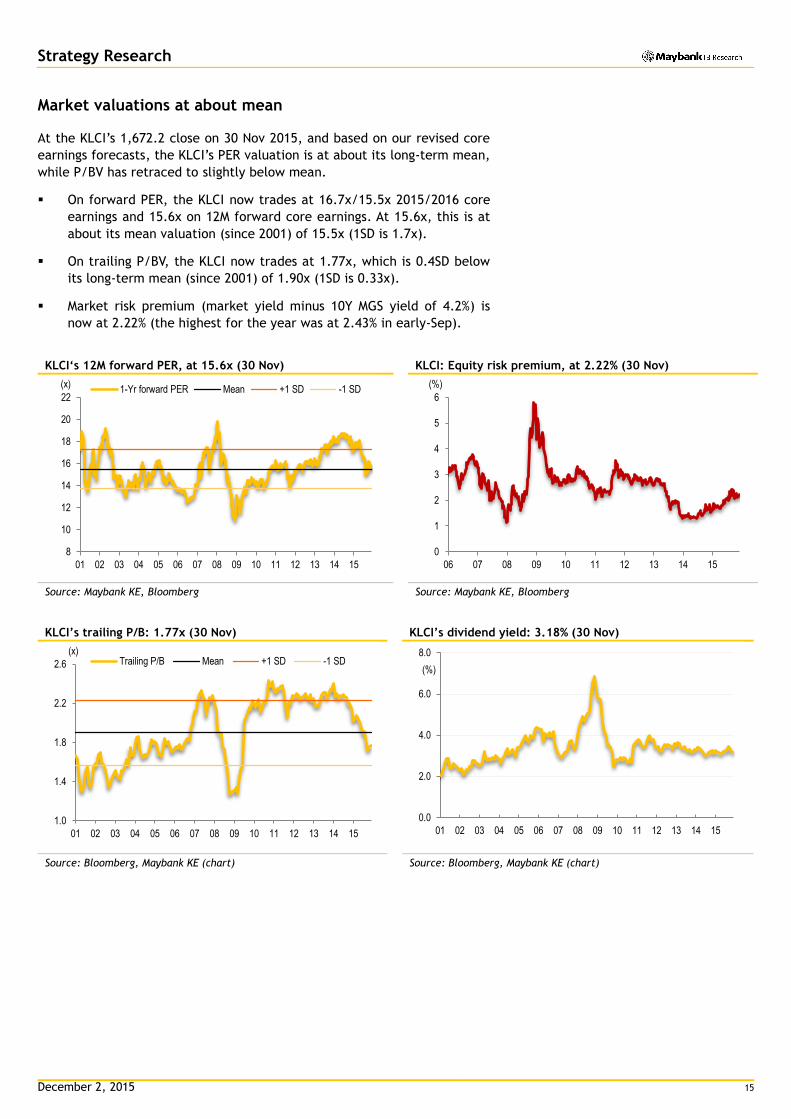
Market valuations at about mean
At the KLCI’s 1,672.2 close on 30 Nov 2015, and based on our revised core
earnings forecasts, the KLCI’s PER valuation is at about its long-term mean,
while P/BV has retraced to slightly below mean.
On forward PER, the KLCI now trades at 16.7x/15.5x 2015/2016 core
earnings and 15.6x on 12M forward core earnings. At 15.6x, this is at
about its mean valuation (since 2001) of 15.5x (1SD is 1.7x).
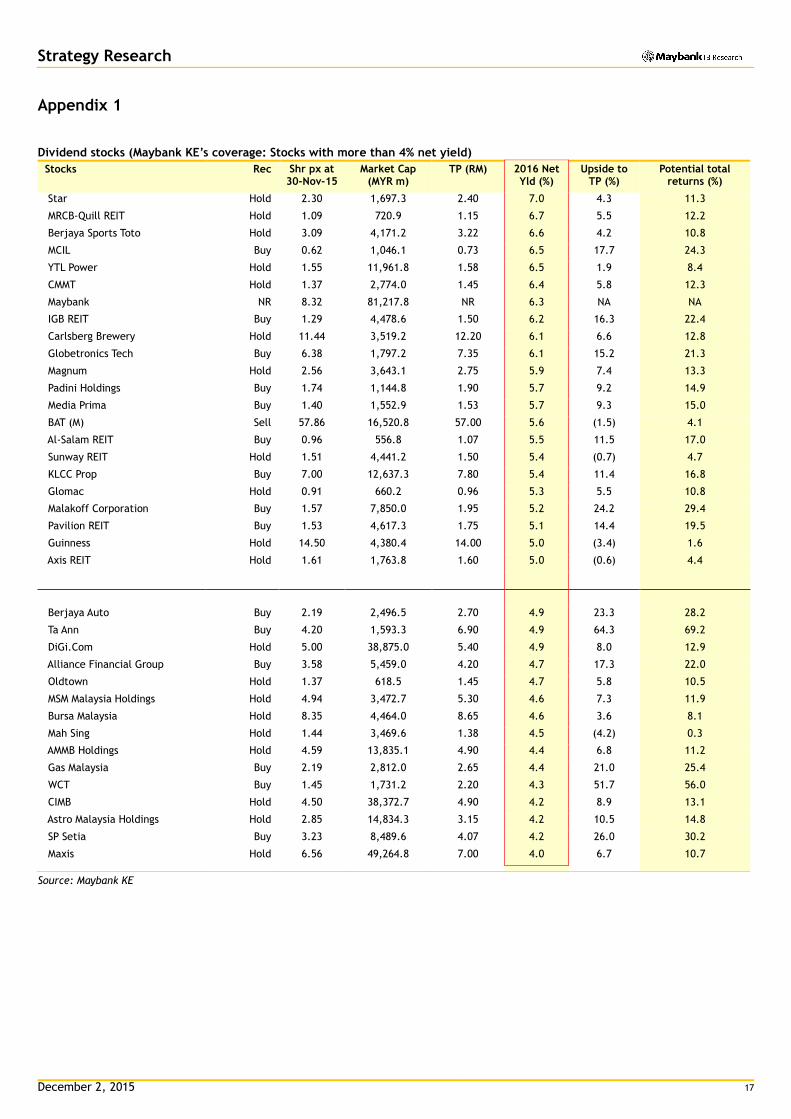
On trailing P/BV, the KLCI now trades at 1.77x, which is 0.4SD below
its long-term mean (since 2001) of 1.90x (1SD is 0.33x).
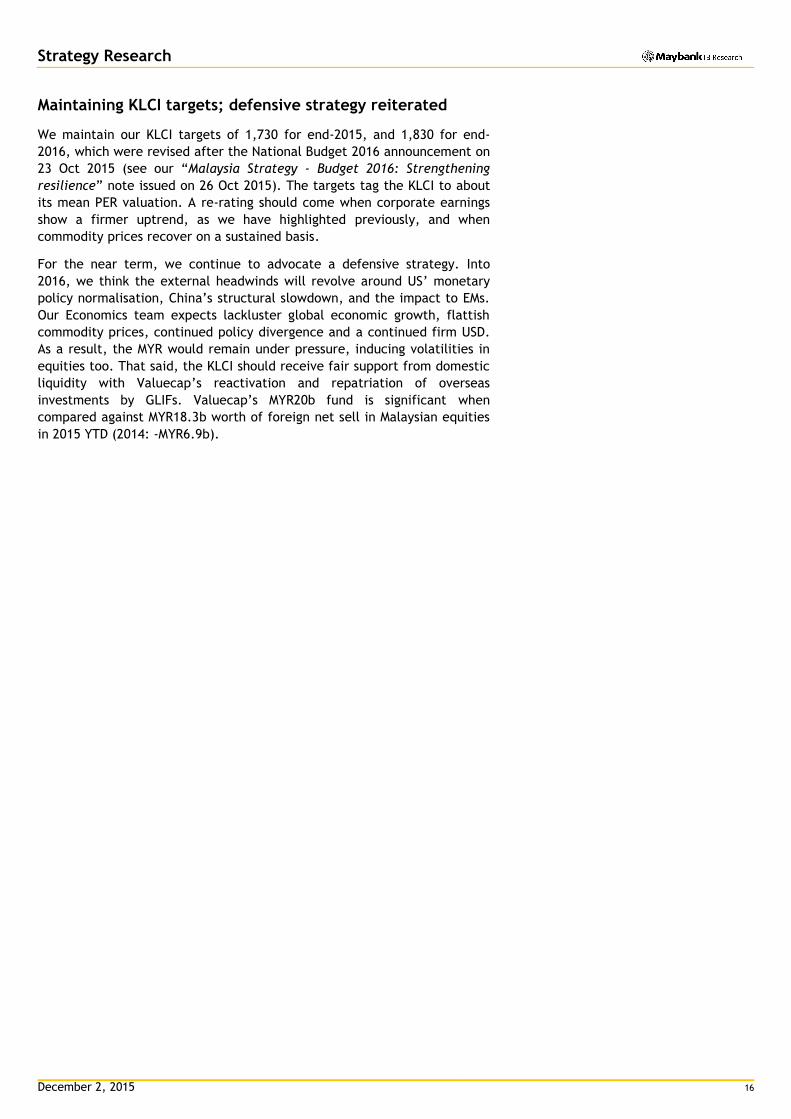
Market risk premium (market yield minus 10Y MGS yield of 4.2%) is
now at 2.22% (the highest for the year was at 2.43% in early-Sep).
KLCI‘s 12M forward PER, at 15.6x (30 Nov) KLCI: Equity risk premium, at 2.22% (30 Nov)
Source: Maybank KE, Bloomberg Source: Maybank KE, Bloomberg
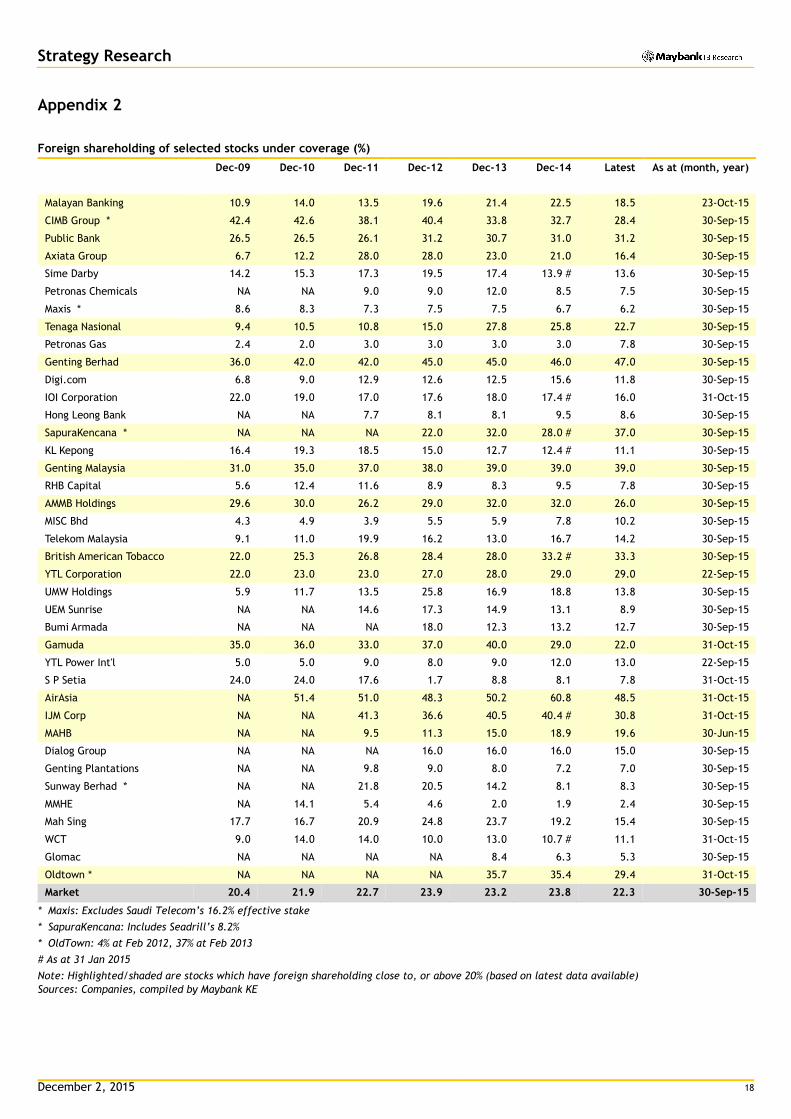
KLCI’s trailing P/B: 1.77x (30 Nov) KLCI’s dividend yield: 3.18% (30 Nov)
Source: Bloomberg, Maybank KE (chart) Source: Bloomberg, Maybank KE (chart)
8
10
12
14
16
18
20
22
01 02 03 04 05 06 07 08 09 10 11 12 13 14 15
(x)1-Yr forward PER Mean +1 SD -1 SD
0
1
2
3
4
5
6
06 07 08 09 10 11 12 13 14 15
(%)
1.0
1.4
1.8
2.2
2.6
01 02 03 04 05 06 07 08 09 10 11 12 13 14 15
(x)Trailing P/B Mean +1 SD -1 SD
0.0
2.0
4.0
6.0
8.0
01 02 03 04 05 06 07 08 09 10 11 12 13 14 15
(%)
December 2, 2015 16
Strategy Research
Maintaining KLCI targets; defensive strategy reiterated
We maintain our KLCI targets of 1,730 for end-2015, and 1,830 for end-
2016, which were revised after the National Budget 2016 announcement on
23 Oct 2015 (see our “Malaysia Strategy - Budget 2016: Strengthening
resilience” note issued on 26 Oct 2015). The targets tag the KLCI to about
its mean PER valuation. A re-rating should come when corporate earnings
show a firmer uptrend, as we have highlighted previously, and when
commodity prices recover on a sustained basis.
For the near term, we continue to advocate a defensive strategy. Into
2016, we think the external headwinds will revolve around US’ monetary
policy normalisation, China’s structural slowdown, and the impact to EMs.
Our Economics team expects lackluster global economic growth, flattish
commodity prices, continued policy divergence and a continued firm USD.
As a result, the MYR would remain under pressure, inducing volatilities in
equities too. That said, the KLCI should receive fair support from domestic
liquidity with Valuecap’s reactivation and repatriation of overseas
investments by GLIFs. Valuecap’s MYR20b fund is significant when
compared against MYR18.3b worth of foreign net sell in Malaysian equities
in 2015 YTD (2014: -MYR6.9b).
December 2, 2015 17
Strategy Research
Appendix 1
Dividend stocks (Maybank KE’s coverage: Stocks with more than 4% net yield)
Stocks Rec Shr px at 30-Nov-15
Market Cap (MYR m)
TP (RM) 2016 Net Yld (%)
Upside to TP (%)
Potential total returns (%)
Star Hold 2.30 1,697.3 2.40 7.0 4.3 11.3
MRCB-Quill REIT Hold 1.09 720.9 1.15 6.7 5.5 12.2
Berjaya Sports Toto Hold 3.09 4,171.2 3.22 6.6 4.2 10.8
MCIL Buy 0.62 1,046.1 0.73 6.5 17.7 24.3
YTL Power Hold 1.55 11,961.8 1.58 6.5 1.9 8.4
CMMT Hold 1.37 2,774.0 1.45 6.4 5.8 12.3
Maybank NR 8.32 81,217.8 NR 6.3 NA NA
IGB REIT Buy 1.29 4,478.6 1.50 6.2 16.3 22.4
Carlsberg Brewery Hold 11.44 3,519.2 12.20 6.1 6.6 12.8
Globetronics Tech Buy 6.38 1,797.2 7.35 6.1 15.2 21.3
Magnum Hold 2.56 3,643.1 2.75 5.9 7.4 13.3
Padini Holdings Buy 1.74 1,144.8 1.90 5.7 9.2 14.9
Media Prima Buy 1.40 1,552.9 1.53 5.7 9.3 15.0
BAT (M) Sell 57.86 16,520.8 57.00 5.6 (1.5) 4.1
Al-Salam REIT Buy 0.96 556.8 1.07 5.5 11.5 17.0
Sunway REIT Hold 1.51 4,441.2 1.50 5.4 (0.7) 4.7
KLCC Prop Buy 7.00 12,637.3 7.80 5.4 11.4 16.8
Glomac Hold 0.91 660.2 0.96 5.3 5.5 10.8
Malakoff Corporation Buy 1.57 7,850.0 1.95 5.2 24.2 29.4
Pavilion REIT Buy 1.53 4,617.3 1.75 5.1 14.4 19.5
Guinness Hold 14.50 4,380.4 14.00 5.0 (3.4) 1.6
Axis REIT Hold 1.61 1,763.8 1.60 5.0 (0.6) 4.4
Berjaya Auto Buy 2.19 2,496.5 2.70 4.9 23.3 28.2
Ta Ann Buy 4.20 1,593.3 6.90 4.9 64.3 69.2
DiGi.Com Hold 5.00 38,875.0 5.40 4.9 8.0 12.9
Alliance Financial Group Buy 3.58 5,459.0 4.20 4.7 17.3 22.0
Oldtown Hold 1.37 618.5 1.45 4.7 5.8 10.5
MSM Malaysia Holdings Hold 4.94 3,472.7 5.30 4.6 7.3 11.9
Bursa Malaysia Hold 8.35 4,464.0 8.65 4.6 3.6 8.1
Mah Sing Hold 1.44 3,469.6 1.38 4.5 (4.2) 0.3
AMMB Holdings Hold 4.59 13,835.1 4.90 4.4 6.8 11.2
Gas Malaysia Buy 2.19 2,812.0 2.65 4.4 21.0 25.4
WCT Buy 1.45 1,731.2 2.20 4.3 51.7 56.0
CIMB Hold 4.50 38,372.7 4.90 4.2 8.9 13.1
Astro Malaysia Holdings Hold 2.85 14,834.3 3.15 4.2 10.5 14.8
SP Setia Buy 3.23 8,489.6 4.07 4.2 26.0 30.2
Maxis Hold 6.56 49,264.8 7.00 4.0 6.7 10.7
Source: Maybank KE
December 2, 2015 18
Strategy Research
Appendix 2
Foreign shareholding of selected stocks under coverage (%)
Dec-09 Dec-10 Dec-11 Dec-12 Dec-13 Dec-14 Latest As at (month, year)
Malayan Banking 10.9 14.0 13.5 19.6 21.4 22.5 18.5 23-Oct-15
CIMB Group * 42.4 42.6 38.1 40.4 33.8 32.7 28.4 30-Sep-15
Public Bank 26.5 26.5 26.1 31.2 30.7 31.0 31.2 30-Sep-15
Axiata Group 6.7 12.2 28.0 28.0 23.0 21.0 16.4 30-Sep-15
Sime Darby 14.2 15.3 17.3 19.5 17.4 13.9 # 13.6 30-Sep-15
Petronas Chemicals NA NA 9.0 9.0 12.0 8.5 7.5 30-Sep-15
Maxis * 8.6 8.3 7.3 7.5 7.5 6.7 6.2 30-Sep-15
Tenaga Nasional 9.4 10.5 10.8 15.0 27.8 25.8 22.7 30-Sep-15
Petronas Gas 2.4 2.0 3.0 3.0 3.0 3.0 7.8 30-Sep-15
Genting Berhad 36.0 42.0 42.0 45.0 45.0 46.0 47.0 30-Sep-15
Digi.com 6.8 9.0 12.9 12.6 12.5 15.6 11.8 30-Sep-15
IOI Corporation 22.0 19.0 17.0 17.6 18.0 17.4 # 16.0 31-Oct-15
Hong Leong Bank NA NA 7.7 8.1 8.1 9.5 8.6 30-Sep-15
SapuraKencana * NA NA NA 22.0 32.0 28.0 # 37.0 30-Sep-15
KL Kepong 16.4 19.3 18.5 15.0 12.7 12.4 # 11.1 30-Sep-15
Genting Malaysia 31.0 35.0 37.0 38.0 39.0 39.0 39.0 30-Sep-15
RHB Capital 5.6 12.4 11.6 8.9 8.3 9.5 7.8 30-Sep-15
AMMB Holdings 29.6 30.0 26.2 29.0 32.0 32.0 26.0 30-Sep-15
MISC Bhd 4.3 4.9 3.9 5.5 5.9 7.8 10.2 30-Sep-15
Telekom Malaysia 9.1 11.0 19.9 16.2 13.0 16.7 14.2 30-Sep-15
British American Tobacco 22.0 25.3 26.8 28.4 28.0 33.2 # 33.3 30-Sep-15
YTL Corporation 22.0 23.0 23.0 27.0 28.0 29.0 29.0 22-Sep-15
UMW Holdings 5.9 11.7 13.5 25.8 16.9 18.8 13.8 30-Sep-15
UEM Sunrise NA NA 14.6 17.3 14.9 13.1 8.9 30-Sep-15
Bumi Armada NA NA NA 18.0 12.3 13.2 12.7 30-Sep-15
Gamuda 35.0 36.0 33.0 37.0 40.0 29.0 22.0 31-Oct-15
YTL Power Int'l 5.0 5.0 9.0 8.0 9.0 12.0 13.0 22-Sep-15
S P Setia 24.0 24.0 17.6 1.7 8.8 8.1 7.8 31-Oct-15
AirAsia NA 51.4 51.0 48.3 50.2 60.8 48.5 31-Oct-15
IJM Corp NA NA 41.3 36.6 40.5 40.4 # 30.8 31-Oct-15
MAHB NA NA 9.5 11.3 15.0 18.9 19.6 30-Jun-15
Dialog Group NA NA NA 16.0 16.0 16.0 15.0 30-Sep-15
Genting Plantations NA NA 9.8 9.0 8.0 7.2 7.0 30-Sep-15
Sunway Berhad * NA NA 21.8 20.5 14.2 8.1 8.3 30-Sep-15
MMHE NA 14.1 5.4 4.6 2.0 1.9 2.4 30-Sep-15
Mah Sing 17.7 16.7 20.9 24.8 23.7 19.2 15.4 30-Sep-15
WCT 9.0 14.0 14.0 10.0 13.0 10.7 # 11.1 31-Oct-15
Glomac NA NA NA NA 8.4 6.3 5.3 30-Sep-15
Oldtown * NA NA NA NA 35.7 35.4 29.4 31-Oct-15
Market 20.4 21.9 22.7 23.9 23.2 23.8 22.3 30-Sep-15
* Maxis: Excludes Saudi Telecom’s 16.2% effective stake
* SapuraKencana: Includes Seadrill’s 8.2%
* OldTown: 4% at Feb 2012, 37% at Feb 2013
# As at 31 Jan 2015
Note: Highlighted/shaded are stocks which have foreign shareholding close to, or above 20% (based on latest data available)
Sources: Companies, compiled by Maybank KE
December 2, 2015 19
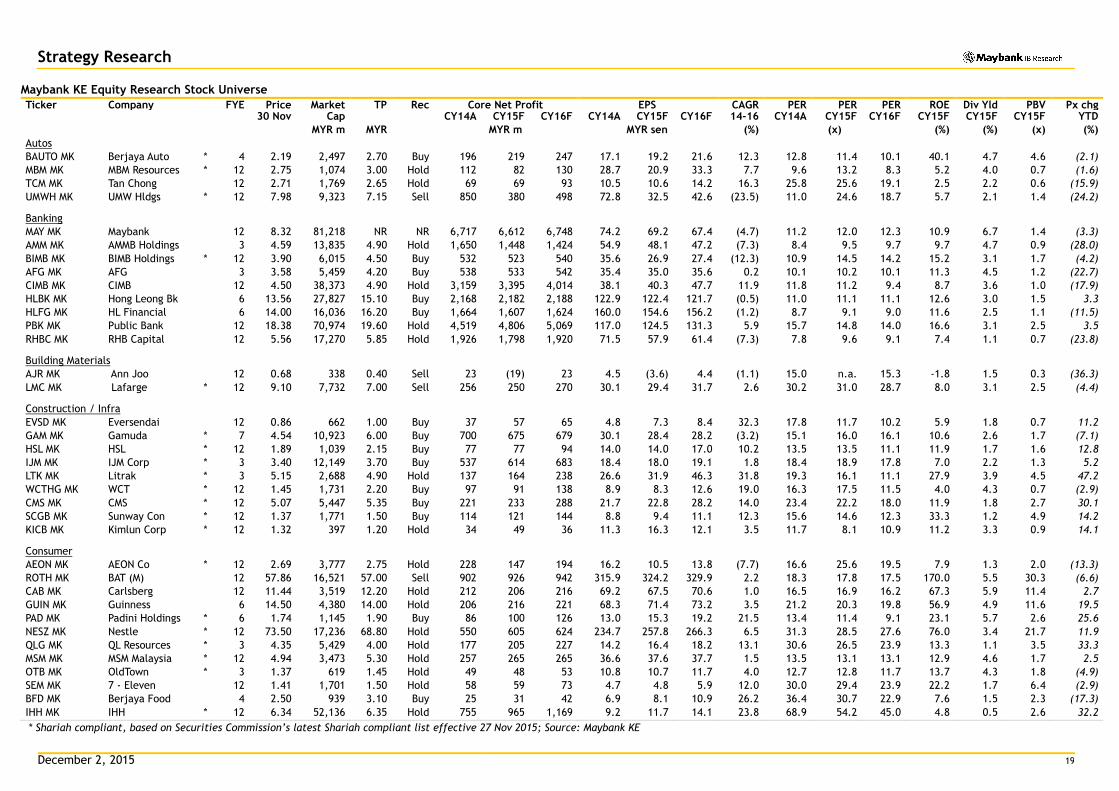
Strategy Research Maybank KE Equity Research Stock Universe
Ticker
Company FYE Price Market TP Rec Core Net Profit EPS CAGR PER PER PER ROE Div Yld PBV Px chg 30 Nov Cap CY14A CY15F CY16F CY14A CY15F CY16F 14-16 CY14A CY15F CY16F CY15F CY15F CY15F YTD
MYR m MYR MYR m MYR sen (%) (x) (%) (%) (x) (%)
Autos
BAUTO MK Berjaya Auto * 4 2.19 2,497 2.70 Buy 196 219 247 17.1 19.2 21.6 12.3 12.8 11.4 10.1 40.1 4.7 4.6 (2.1)
MBM MK MBM Resources * 12 2.75 1,074 3.00 Hold 112 82 130 28.7 20.9 33.3 7.7 9.6 13.2 8.3 5.2 4.0 0.7 (1.6)
TCM MK Tan Chong 12 2.71 1,769 2.65 Hold 69 69 93 10.5 10.6 14.2 16.3 25.8 25.6 19.1 2.5 2.2 0.6 (15.9)
UMWH MK UMW Hldgs * 12 7.98 9,323 7.15 Sell 850 380 498 72.8 32.5 42.6 (23.5) 11.0 24.6 18.7 5.7 2.1 1.4 (24.2)
Banking
MAY MK Maybank 12 8.32 81,218 NR NR 6,717 6,612 6,748 74.2 69.2 67.4 (4.7) 11.2 12.0 12.3 10.9 6.7 1.4 (3.3)
AMM MK AMMB Holdings 3 4.59 13,835 4.90 Hold 1,650 1,448 1,424 54.9 48.1 47.2 (7.3) 8.4 9.5 9.7 9.7 4.7 0.9 (28.0)
BIMB MK BIMB Holdings * 12 3.90 6,015 4.50 Buy 532 523 540 35.6 26.9 27.4 (12.3) 10.9 14.5 14.2 15.2 3.1 1.7 (4.2)
AFG MK AFG 3 3.58 5,459 4.20 Buy 538 533 542 35.4 35.0 35.6 0.2 10.1 10.2 10.1 11.3 4.5 1.2 (22.7)
CIMB MK CIMB 12 4.50 38,373 4.90 Hold 3,159 3,395 4,014 38.1 40.3 47.7 11.9 11.8 11.2 9.4 8.7 3.6 1.0 (17.9)
HLBK MK Hong Leong Bk 6 13.56 27,827 15.10 Buy 2,168 2,182 2,188 122.9 122.4 121.7 (0.5) 11.0 11.1 11.1 12.6 3.0 1.5 3.3
HLFG MK HL Financial 6 14.00 16,036 16.20 Buy 1,664 1,607 1,624 160.0 154.6 156.2 (1.2) 8.7 9.1 9.0 11.6 2.5 1.1 (11.5)
PBK MK Public Bank 12 18.38 70,974 19.60 Hold 4,519 4,806 5,069 117.0 124.5 131.3 5.9 15.7 14.8 14.0 16.6 3.1 2.5 3.5
RHBC MK RHB Capital 12 5.56 17,270 5.85 Hold 1,926 1,798 1,920 71.5 57.9 61.4 (7.3) 7.8 9.6 9.1 7.4 1.1 0.7 (23.8)
Building Materials
AJR MK Ann Joo 12 0.68 338 0.40 Sell 23 (19) 23 4.5 (3.6) 4.4 (1.1) 15.0 n.a. 15.3 -1.8 1.5 0.3 (36.3)
LMC MK Lafarge * 12 9.10 7,732 7.00 Sell 256 250 270 30.1 29.4 31.7 2.6 30.2 31.0 28.7 8.0 3.1 2.5 (4.4)
Construction / Infra
EVSD MK Eversendai 12 0.86 662 1.00 Buy 37 57 65 4.8 7.3 8.4 32.3 17.8 11.7 10.2 5.9 1.8 0.7 11.2
GAM MK Gamuda * 7 4.54 10,923 6.00 Buy 700 675 679 30.1 28.4 28.2 (3.2) 15.1 16.0 16.1 10.6 2.6 1.7 (7.1)
HSL MK HSL * 12 1.89 1,039 2.15 Buy 77 77 94 14.0 14.0 17.0 10.2 13.5 13.5 11.1 11.9 1.7 1.6 12.8
IJM MK IJM Corp * 3 3.40 12,149 3.70 Buy 537 614 683 18.4 18.0 19.1 1.8 18.4 18.9 17.8 7.0 2.2 1.3 5.2
LTK MK Litrak * 3 5.15 2,688 4.90 Hold 137 164 238 26.6 31.9 46.3 31.8 19.3 16.1 11.1 27.9 3.9 4.5 47.2
WCTHG MK WCT * 12 1.45 1,731 2.20 Buy 97 91 138 8.9 8.3 12.6 19.0 16.3 17.5 11.5 4.0 4.3 0.7 (2.9)
CMS MK CMS * 12 5.07 5,447 5.35 Buy 221 233 288 21.7 22.8 28.2 14.0 23.4 22.2 18.0 11.9 1.8 2.7 30.1
SCGB MK Sunway Con * 12 1.37 1,771 1.50 Buy 114 121 144 8.8 9.4 11.1 12.3 15.6 14.6 12.3 33.3 1.2 4.9 14.2
KICB MK Kimlun Corp * 12 1.32 397 1.20 Hold 34 49 36 11.3 16.3 12.1 3.5 11.7 8.1 10.9 11.2 3.3 0.9 14.1
Consumer
AEON MK AEON Co * 12 2.69 3,777 2.75 Hold 228 147 194 16.2 10.5 13.8 (7.7) 16.6 25.6 19.5 7.9 1.3 2.0 (13.3)
ROTH MK BAT (M) 12 57.86 16,521 57.00 Sell 902 926 942 315.9 324.2 329.9 2.2 18.3 17.8 17.5 170.0 5.5 30.3 (6.6)
CAB MK Carlsberg 12 11.44 3,519 12.20 Hold 212 206 216 69.2 67.5 70.6 1.0 16.5 16.9 16.2 67.3 5.9 11.4 2.7
GUIN MK Guinness 6 14.50 4,380 14.00 Hold 206 216 221 68.3 71.4 73.2 3.5 21.2 20.3 19.8 56.9 4.9 11.6 19.5
PAD MK Padini Holdings * 6 1.74 1,145 1.90 Buy 86 100 126 13.0 15.3 19.2 21.5 13.4 11.4 9.1 23.1 5.7 2.6 25.6
NESZ MK Nestle * 12 73.50 17,236 68.80 Hold 550 605 624 234.7 257.8 266.3 6.5 31.3 28.5 27.6 76.0 3.4 21.7 11.9
QLG MK QL Resources * 3 4.35 5,429 4.00 Hold 177 205 227 14.2 16.4 18.2 13.1 30.6 26.5 23.9 13.3 1.1 3.5 33.3
MSM MK MSM Malaysia * 12 4.94 3,473 5.30 Hold 257 265 265 36.6 37.6 37.7 1.5 13.5 13.1 13.1 12.9 4.6 1.7 2.5
OTB MK OldTown * 3 1.37 619 1.45 Hold 49 48 53 10.8 10.7 11.7 4.0 12.7 12.8 11.7 13.7 4.3 1.8 (4.9)
SEM MK 7 - Eleven 12 1.41 1,701 1.50 Hold 58 59 73 4.7 4.8 5.9 12.0 30.0 29.4 23.9 22.2 1.7 6.4 (2.9)
BFD MK Berjaya Food 4 2.50 939 3.10 Buy 25 31 42 6.9 8.1 10.9 26.2 36.4 30.7 22.9 7.6 1.5 2.3 (17.3)
IHH MK IHH * 12 6.34 52,136 6.35 Hold 755 965 1,169 9.2 11.7 14.1 23.8 68.9 54.2 45.0 4.8 0.5 2.6 32.2
* Shariah compliant, based on Securities Commission’s latest Shariah compliant list effective 27 Nov 2015; Source: Maybank KE
December 2, 2015 20
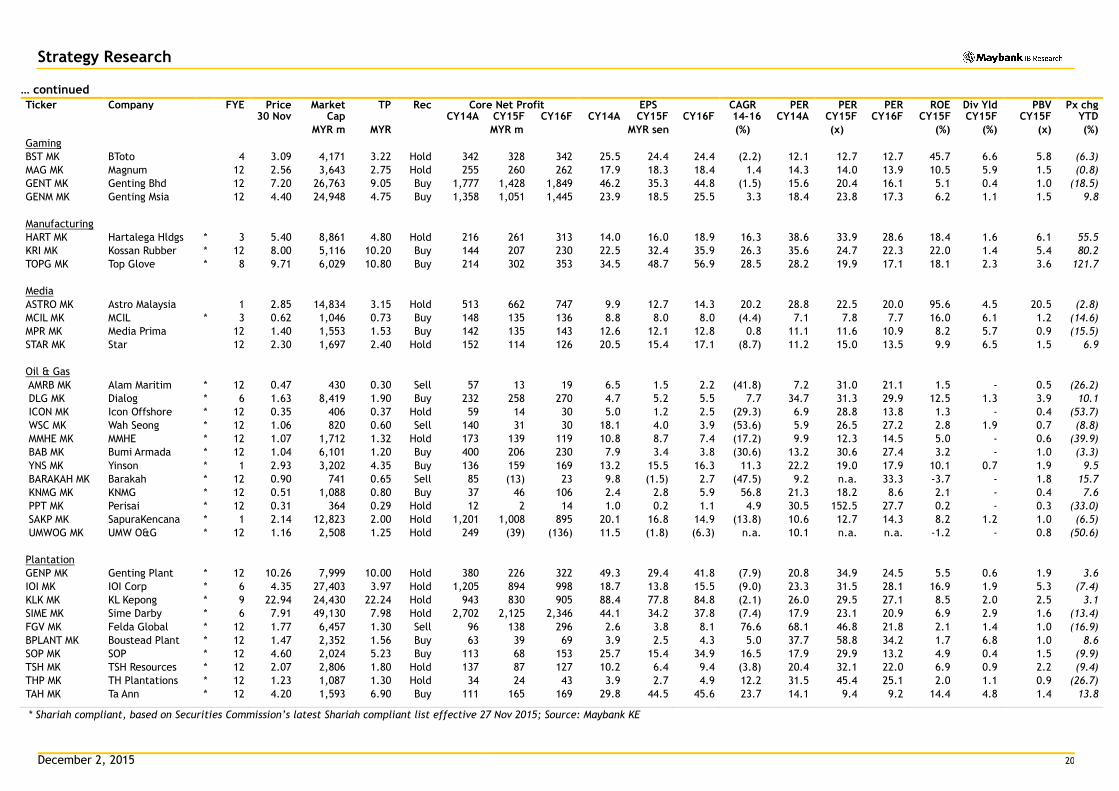
Strategy Research … continued
Ticker
Company FYE Price Market TP Rec Core Net Profit EPS CAGR PER PER PER ROE Div Yld PBV Px chg chg 30 Nov Cap CY14A CY15F CY16F CY14A CY15F CY16F 14-16 CY14A CY15F CY16F CY15F
A CY15F CY15F YTD
MYR m MYR MYR m MYR sen (%) (x) (%) (%) (x) (%)
Gaming
BST MK BToto 4 3.09 4,171 3.22 Hold 342 328 342 25.5 24.4 24.4 (2.2) 12.1 12.7 12.7 45.7 6.6 5.8 (6.3)
MAG MK Magnum 12 2.56 3,643 2.75 Hold 255 260 262 17.9 18.3 18.4 1.4 14.3 14.0 13.9 10.5 5.9 1.5 (0.8)
GENT MK Genting Bhd 12 7.20 26,763 9.05 Buy 1,777 1,428 1,849 46.2 35.3 44.8 (1.5) 15.6 20.4 16.1 5.1 0.4 1.0 (18.5)
GENM MK Genting Msia 12 4.40 24,948 4.75 Buy 1,358 1,051 1,445 23.9 18.5 25.5 3.3 18.4 23.8 17.3 6.2 1.1 1.5 9.8
Manufacturing
HART MK Hartalega Hldgs * 3 5.40 8,861 4.80 Hold 216 261 313 14.0 16.0 18.9 16.3 38.6 33.9 28.6 18.4 1.6 6.1 55.5
KRI MK Kossan Rubber * 12 8.00 5,116 10.20 Buy 144 207 230 22.5 32.4 35.9 26.3 35.6 24.7 22.3 22.0 1.4 5.4 80.2
TOPG MK Top Glove * 8 9.71 6,029 10.80 Buy 214 302 353 34.5 48.7 56.9 28.5 28.2 19.9 17.1 18.1 2.3 3.6 121.7
Media
ASTRO MK Astro Malaysia 1 2.85 14,834 3.15 Hold 513 662 747 9.9 12.7 14.3 20.2 28.8 22.5 20.0 95.6 4.5 20.5 (2.8)
MCIL MK MCIL * 3 0.62 1,046 0.73 Buy 148 135 136 8.8 8.0 8.0 (4.4) 7.1 7.8 7.7 16.0 6.1 1.2 (14.6)
MPR MK Media Prima 12 1.40 1,553 1.53 Buy 142 135 143 12.6 12.1 12.8 0.8 11.1 11.6 10.9 8.2 5.7 0.9 (15.5)
STAR MK Star 12 2.30 1,697 2.40 Hold 152 114 126 20.5 15.4 17.1 (8.7) 11.2 15.0 13.5 9.9 6.5 1.5 6.9
Oil & Gas
AMRB MK Alam Maritim * 12 0.47 430 0.30 Sell 57 13 19 6.5 1.5 2.2 (41.8) 7.2 31.0 21.1 1.5 - 0.5 (26.2)
DLG MK Dialog * 6 1.63 8,419 1.90 Buy 232 258 270 4.7 5.2 5.5 7.7 34.7 31.3 29.9 12.5 1.3 3.9 10.1
ICON MK Icon Offshore * 12 0.35 406 0.37 Hold 59 14 30 5.0 1.2 2.5 (29.3) 6.9 28.8 13.8 1.3 - 0.4 (53.7)
WSC MK Wah Seong * 12 1.06 820 0.60 Sell 140 31 30 18.1 4.0 3.9 (53.6) 5.9 26.5 27.2 2.8 1.9 0.7 (8.8)
MMHE MK MMHE * 12 1.07 1,712 1.32 Hold 173 139 119 10.8 8.7 7.4 (17.2) 9.9 12.3 14.5 5.0 - 0.6 (39.9)
BAB MK Bumi Armada * 12 1.04 6,101 1.20 Buy 400 206 230 7.9 3.4 3.8 (30.6) 13.2 30.6 27.4 3.2 - 1.0 (3.3)
YNS MK Yinson * 1 2.93 3,202 4.35 Buy 136 159 169 13.2 15.5 16.3 11.3 22.2 19.0 17.9 10.1 0.7 1.9 9.5
BARAKAH MK Barakah * 12 0.90 741 0.65 Sell 85 (13) 23 9.8 (1.5) 2.7 (47.5) 9.2 n.a. 33.3 -3.7 - 1.8 15.7
KNMG MK KNMG * 12 0.51 1,088 0.80 Buy 37 46 106 2.4 2.8 5.9 56.8 21.3 18.2 8.6 2.1 - 0.4 7.6
PPT MK Perisai * 12 0.31 364 0.29 Hold 12 2 14 1.0 0.2 1.1 4.9 30.5 152.5 27.7 0.2 - 0.3 (33.0)
SAKP MK SapuraKencana * 1 2.14 12,823 2.00 Hold 1,201 1,008 895 20.1 16.8 14.9 (13.8) 10.6 12.7 14.3 8.2 1.2 1.0 (6.5)
UMWOG MK UMW O&G * 12 1.16 2,508 1.25 Hold 249 (39) (136) 11.5 (1.8) (6.3) n.a. 10.1 n.a. n.a. -1.2 - 0.8 (50.6)
Plantation
GENP MK Genting Plant * 12 10.26 7,999 10.00 Hold 380 226 322 49.3 29.4 41.8 (7.9) 20.8 34.9 24.5 5.5 0.6 1.9 3.6
IOI MK IOI Corp * 6 4.35 27,403 3.97 Hold 1,205 894 998 18.7 13.8 15.5 (9.0) 23.3 31.5 28.1 16.9 1.9 5.3 (7.4)
KLK MK KL Kepong * 9 22.94 24,430 22.24 Hold 943 830 905 88.4 77.8 84.8 (2.1) 26.0 29.5 27.1 8.5 2.0 2.5 3.1
SIME MK Sime Darby * 6 7.91 49,130 7.98 Hold 2,702 2,125 2,346 44.1 34.2 37.8 (7.4) 17.9 23.1 20.9 6.9 2.9 1.6 (13.4)
FGV MK Felda Global * 12 1.77 6,457 1.30 Sell 96 138 296 2.6 3.8 8.1 76.6 68.1 46.8 21.8 2.1 1.4 1.0 (16.9)
BPLANT MK Boustead Plant * 12 1.47 2,352 1.56 Buy 63 39 69 3.9 2.5 4.3 5.0 37.7 58.8 34.2 1.7 6.8 1.0 8.6
SOP MK SOP * 12 4.60 2,024 5.23 Buy 113 68 153 25.7 15.4 34.9 16.5 17.9 29.9 13.2 4.9 0.4 1.5 (9.9)
TSH MK TSH Resources * 12 2.07 2,806 1.80 Hold 137 87 127 10.2 6.4 9.4 (3.8) 20.4 32.1 22.0 6.9 0.9 2.2 (9.4)
THP MK TH Plantations * 12 1.23 1,087 1.30 Hold 34 24 43 3.9 2.7 4.9 12.2 31.5 45.4 25.1 2.0 1.1 0.9 (26.7)
TAH MK Ta Ann * 12 4.20 1,593 6.90 Buy 111 165 169 29.8 44.5 45.6 23.7 14.1 9.4 9.2 14.4 4.8 1.4 13.8
* Shariah compliant, based on Securities Commission’s latest Shariah compliant list effective 27 Nov 2015; Source: Maybank KE
December 2, 2015 21
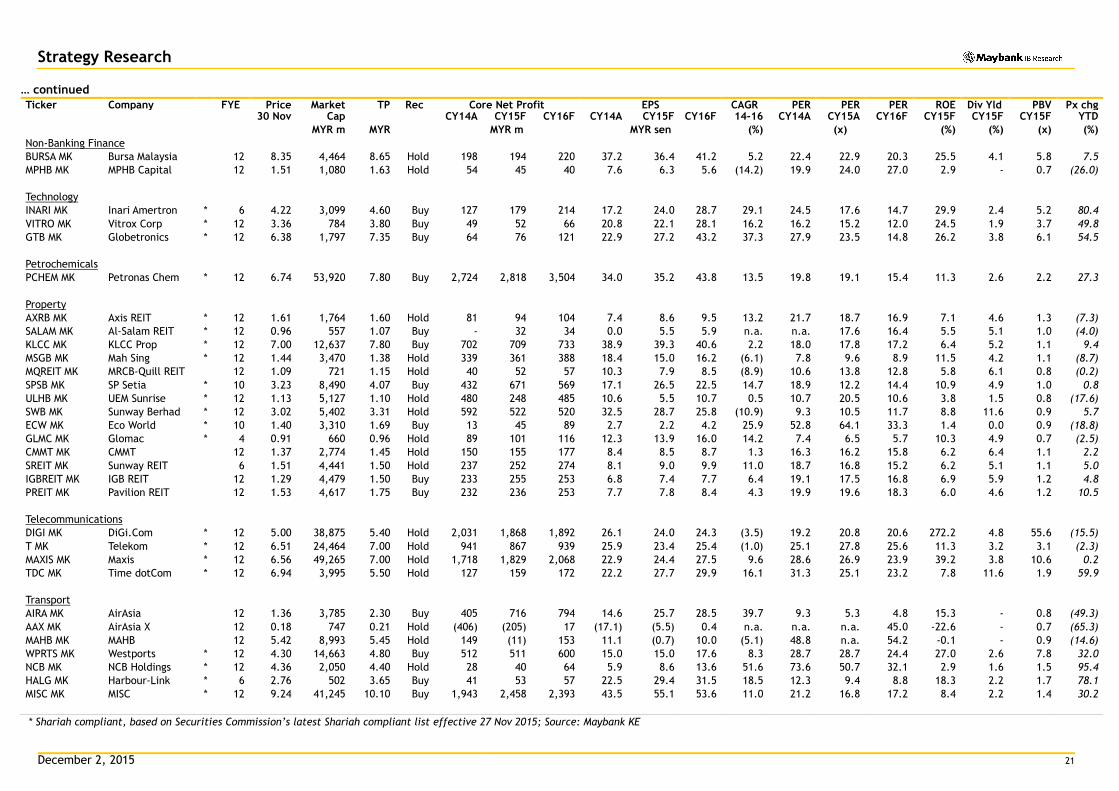
Strategy Research … continued
Ticker
Company FYE Price Market TP Rec Core Net Profit EPS CAGR PER PER PER ROE Div Yld PBV Px chg chg 30 Nov Cap CY14A CY15F CY16F CY14A CY15F CY16F 14-16 CY14A CY15A CY16F CY15F CY15F CY15F YTD
MYR m MYR MYR m MYR sen (%) (x) (%) (%) (x) (%)
Non-Banking Finance
BURSA MK Bursa Malaysia 12 8.35 4,464 8.65 Hold 198 194 220 37.2 36.4 41.2 5.2 22.4 22.9 20.3 25.5 4.1 5.8 7.5
MPHB MK MPHB Capital 12 1.51 1,080 1.63 Hold 54 45 40 7.6 6.3 5.6 (14.2) 19.9 24.0 27.0 2.9 - 0.7 (26.0)
Technology
INARI MK Inari Amertron * 6 4.22 3,099 4.60 Buy 127 179 214 17.2 24.0 28.7 29.1 24.5 17.6 14.7 29.9 2.4 5.2 80.4
VITRO MK Vitrox Corp * 12 3.36 784 3.80 Buy 49 52 66 20.8 22.1 28.1 16.2 16.2 15.2 12.0 24.5 1.9 3.7 49.8
GTB MK Globetronics * 12 6.38 1,797 7.35 Buy 64 76 121 22.9 27.2 43.2 37.3 27.9 23.5 14.8 26.2 3.8 6.1 54.5
Petrochemicals
PCHEM MK Petronas Chem * 12 6.74 53,920 7.80 Buy 2,724 2,818 3,504 34.0 35.2 43.8 13.5 19.8 19.1 15.4 11.3 2.6 2.2 27.3
Property
AXRB MK Axis REIT * 12 1.61 1,764 1.60 Hold 81 94 104 7.4 8.6 9.5 13.2 21.7 18.7 16.9 7.1 4.6 1.3 (7.3)
SALAM MK Al-Salam REIT * 12 0.96 557 1.07 Buy - 32 34 0.0 5.5 5.9 n.a. n.a. 17.6 16.4 5.5 5.1 1.0 (4.0)
KLCC MK KLCC Prop * 12 7.00 12,637 7.80 Buy 702 709 733 38.9 39.3 40.6 2.2 18.0 17.8 17.2 6.4 5.2 1.1 9.4
MSGB MK Mah Sing * 12 1.44 3,470 1.38 Hold 339 361 388 18.4 15.0 16.2 (6.1) 7.8 9.6 8.9 11.5 4.2 1.1 (8.7)
MQREIT MK MRCB-Quill REIT 12 1.09 721 1.15 Hold 40 52 57 10.3 7.9 8.5 (8.9) 10.6 13.8 12.8 5.8 6.1 0.8 (0.2)
SPSB MK SP Setia * 10 3.23 8,490 4.07 Buy 432 671 569 17.1 26.5 22.5 14.7 18.9 12.2 14.4 10.9 4.9 1.0 0.8
ULHB MK UEM Sunrise * 12 1.13 5,127 1.10 Hold 480 248 485 10.6 5.5 10.7 0.5 10.7 20.5 10.6 3.8 1.5 0.8 (17.6)
SWB MK Sunway Berhad * 12 3.02 5,402 3.31 Hold 592 522 520 32.5 28.7 25.8 (10.9) 9.3 10.5 11.7 8.8 11.6 0.9 5.7
ECW MK Eco World * 10 1.40 3,310 1.69 Buy 13 45 89 2.7 2.2 4.2 25.9 52.8 64.1 33.3 1.4 0.0 0.9 (18.8)
GLMC MK Glomac * 4 0.91 660 0.96 Hold 89 101 116 12.3 13.9 16.0 14.2 7.4 6.5 5.7 10.3 4.9 0.7 (2.5)
CMMT MK CMMT 12 1.37 2,774 1.45 Hold 150 155 177 8.4 8.5 8.7 1.3 16.3 16.2 15.8 6.2 6.4 1.1 2.2
SREIT MK Sunway REIT 6 1.51 4,441 1.50 Hold 237 252 274 8.1 9.0 9.9 11.0 18.7 16.8 15.2 6.2 5.1 1.1 5.0
IGBREIT MK IGB REIT 12 1.29 4,479 1.50 Buy 233 255 253 6.8 7.4 7.7 6.4 19.1 17.5 16.8 6.9 5.9 1.2 4.8
PREIT MK Pavilion REIT 12 1.53 4,617 1.75 Buy 232 236 253 7.7 7.8 8.4 4.3 19.9 19.6 18.3 6.0 4.6 1.2 10.5
Telecommunications
DIGI MK DiGi.Com * 12 5.00 38,875 5.40 Hold 2,031 1,868 1,892 26.1 24.0 24.3 (3.5) 19.2 20.8 20.6 272.2 4.8 55.6 (15.5)
T MK Telekom * 12 6.51 24,464 7.00 Hold 941 867 939 25.9 23.4 25.4 (1.0) 25.1 27.8 25.6 11.3 3.2 3.1 (2.3)
MAXIS MK Maxis * 12 6.56 49,265 7.00 Hold 1,718 1,829 2,068 22.9 24.4 27.5 9.6 28.6 26.9 23.9 39.2 3.8 10.6 0.2
TDC MK Time dotCom * 12 6.94 3,995 5.50 Hold 127 159 172 22.2 27.7 29.9 16.1 31.3 25.1 23.2 7.8 11.6 1.9 59.9
Transport
AIRA MK AirAsia 12 1.36 3,785 2.30 Buy 405 716 794 14.6 25.7 28.5 39.7 9.3 5.3 4.8 15.3 - 0.8 (49.3)
AAX MK AirAsia X 12 0.18 747 0.21 Hold (406) (205) 17 (17.1) (5.5) 0.4 n.a. n.a. n.a. 45.0 -22.6 - 0.7 (65.3)
MAHB MK MAHB 12 5.42 8,993 5.45 Hold 149 (11) 153 11.1 (0.7) 10.0 (5.1) 48.8 n.a. 54.2 -0.1 - 0.9 (14.6)
WPRTS MK Westports * 12 4.30 14,663 4.80 Buy 512 511 600 15.0 15.0 17.6 8.3 28.7 28.7 24.4 27.0 2.6 7.8 32.0
NCB MK NCB Holdings * 12 4.36 2,050 4.40 Hold 28 40 64 5.9 8.6 13.6 51.6 73.6 50.7 32.1 2.9 1.6 1.5 95.4
HALG MK Harbour-Link * 6 2.76 502 3.65 Buy 41 53 57 22.5 29.4 31.5 18.5 12.3 9.4 8.8 18.3 2.2 1.7 78.1
MISC MK MISC * 12 9.24 41,245 10.10 Buy 1,943 2,458 2,393 43.5 55.1 53.6 11.0 21.2 16.8 17.2 8.4 2.2 1.4 30.2
* Shariah compliant, based on Securities Commission’s latest Shariah compliant list effective 27 Nov 2015; Source: Maybank KE

December 2, 2015 22
Strategy Research … continued
Ticker
Company FYE Price Market TP Rec Core Net Profit EPS CAGR PER PER PER ROE Div Yld PBV Px chg chg 30 Nov Cap CY14A CY15F CY16F CY14A CY15F CY16F 14-16 CY14A CY15A CY16F CY15F CY15F CY15F YTD
MYR m MYR MYR m MYR sen (%) (x) (%) (%) (x) (%)
Utilities
TNB MK Tenaga * 8 13.36 75,399 16.00 Buy 5,969 7,101 7,287 105.8 125.8 129.1 10.5 12.6 10.6 10.3 14.5 2.3 1.5 (2.5)
PTG MK Petronas Gas * 12 22.92 45,353 24.00 Hold 1,785 1,830 1,854 90.2 92.5 93.7 1.9 25.4 24.8 24.5 16.5 2.8 4.1 6.2
GMB MK Gas Msia * 12 2.19 2,812 2.65 Buy 168 123 124 13.1 9.6 9.6 (14.4) 16.7 22.8 22.8 12.2 4.4 2.8 (28.7)
MLK MK Malakoff Corp * 12 1.57 7,850 1.95 Buy 342 449 585 9.7 9.0 11.7 9.8 16.2 17.4 13.4 7.6 4.3 1.3 (12.8)
YTLP MK YTL Power 6 1.55 11,962 1.58 Hold 1,080 872 920 16.1 12.4 13.1 (9.8) 9.7 12.5 11.9 7.6 6.5 1.0 11.6
* Shariah compliant, based on Securities Commission’s latest Shariah compliant list effective 27 Nov 2015; Source: Maybank KE
December 2, 2015 23
Strategy Research
Research Offices
REGIONAL
Sadiq CURRIMBHOY
Regional Head, Research & Economics
(65) 6231 5836 [email protected]
WONG Chew Hann, CA
Regional Head of Institutional Research
(603) 2297 8686 [email protected]
ONG Seng Yeow
Regional Head of Retail Research
(65) 6231 5839 [email protected]
TAN Sin Mui
Director of Research
(65) 6231 5849 [email protected]
ECONOMICS
Suhaimi ILIAS Chief Economist Singapore | Malaysia (603) 2297 8682 [email protected]
Luz LORENZO Philippines
(63) 2 849 8836 [email protected]
Tim LEELAHAPHAN Thailand (66) 2658 6300 ext 1420 [email protected]
JUNIMAN Chief Economist, BII Indonesia (62) 21 29228888 ext 29682
STRATEGY
Sadiq CURRIMBHOY
Global Strategist
(65) 6231 5836 [email protected]
Willie CHAN
Hong Kong / Regional
(852) 2268 0631 [email protected]
MALAYSIA
WONG Chew Hann, CA Head of Research (603) 2297 8686 [email protected] • Strategy
Desmond CH’NG, ACA (603) 2297 8680 [email protected] • Banking & Finance
LIAW Thong Jung (603) 2297 8688 [email protected] • Oil & Gas Services- Regional
ONG Chee Ting, CA (603) 2297 8678 [email protected] • Plantations - Regional
Mohshin AZIZ (603) 2297 8692 [email protected] • Aviation - Regional • Petrochem
YIN Shao Yang, CPA (603) 2297 8916 [email protected] • Gaming – Regional • Media
TAN Chi Wei, CFA (603) 2297 8690 [email protected] • Power • Telcos
WONG Wei Sum, CFA (603) 2297 8679 [email protected] • Property
LEE Yen Ling (603) 2297 8691 [email protected] • Building Materials • Glove • Ports • Shipping
CHAI Li Shin, CFA (603) 2297 8684 [email protected] • Plantation • Construction & Infrastructure
Ivan YAP (603) 2297 8612 [email protected] • Automotive • Semiconductor • Technology
Kevin WONG (603) 2082 6824 [email protected] • REITs • Consumer Discretionary
LIEW Wei Han
(603) 2297 8676 [email protected] • Consumer Staples
LEE Cheng Hooi Regional Chartist (603) 2297 8694 [email protected]
Tee Sze Chiah Head of Retail Research (603) 2297 6858 [email protected]
Cheah Chong Ling (603) 2297 8767 [email protected]
HONG KONG / CHINA
Howard WONG Head of Research (852) 2268 0648 [email protected] • Oil & Gas - Regional
Benjamin HO (852) 2268 0632 [email protected] • Consumer & Auto
Jacqueline KO, CFA (852) 2268 0633 [email protected] • Consumer Staples & Durables
Ka Leong LO, CFA (852) 2268 0630 [email protected] • Consumer Discretionary & Auto
Mitchell KIM (852) 2268 0634 [email protected] • Internet & Telcos
Osbert TANG, CFA (86) 21 5096 8370 [email protected] • Transport & Industrials
Stefan CHANG, CFA (852) 2268 0675 [email protected] • Technology
Steven ST CHAN (852) 2268 0645 [email protected] • Banking & Financials - Regional
Warren LAU (852) 2268 0644 [email protected] • Technology – Regional
INDIA
Jigar SHAH Head of Research
(91) 22 6623 2632 [email protected]
• Oil & Gas • Automobile • Cement
Anubhav GUPTA
(91) 22 6623 2605 [email protected]
• Metal & Mining • Capital Goods • Property
Vishal MODI
(91) 22 6623 2607 [email protected]
• Banking & Financials
Abhijeet KUNDU
(91) 22 6623 2628 [email protected]
• Consumer
Neerav DALAL
(91) 22 6623 2606 [email protected]
• Software Technology • Telcos
SINGAPORE
Gregory YAP (65) 6231 5848 [email protected] • SMID Caps • Technology & Manufacturing • Telcos
YEAK Chee Keong, CFA (65) 6231 5842 [email protected] • Offshore & Marine
Derrick HENG, CFA (65) 6231 5843 [email protected] • Transport • Property • REITs (Office)
Joshua TAN (65) 6231 5850 [email protected] • REITs (Retail, Industrial)
John CHEONG, CFA (65) 6231 5845 [email protected] • Small & Mid Caps • Healthcare
TRUONG Thanh Hang (65) 6231 5847 [email protected] • Small & Mid Caps
INDONESIA
Isnaputra ISKANDAR Head of Research (62) 21 2557 1129 [email protected] • Strategy • Metals & Mining • Cement
Rahmi MARINA (62) 21 2557 1128 [email protected] • Banking & Finance
Aurellia SETIABUDI (62) 21 2953 0785 [email protected] • Property
Pandu ANUGRAH (62) 21 2557 1137 [email protected] • Infra • Construction • Transport• Telcos
Janni ASMAN (62) 21 2953 0784 [email protected] • Cigarette • Healthcare • Retail
Adhi TASMIN (62) 21 2557 1209 [email protected] • Plantations
Anthony LUKMAWIJAYA (62) 21 2557 1126 [email protected] • Aviation
PHILIPPINES
Luz LORENZO Head of Research (63) 2 849 8836 [email protected] • Strategy • Utilities • Conglomerates • Telcos
Lovell SARREAL (63) 2 849 8841 [email protected] • Consumer • Media • Cement
Rommel RODRIGO (63) 2 849 8839 [email protected] • Conglomerates • Property • Gaming • Ports/ Logistics
Katherine TAN (63) 2 849 8843 [email protected] • Banks • Construction
Michael BENGSON (63) 2 849 8840 [email protected] • Conglomerates
Jaclyn JIMENEZ (63) 2 849 8842 [email protected] • Consumer
Arabelle MAGHIRANG (63) 2 849 8838 [email protected] • Banks
THAILAND
Maria LAPIZ Head of Institutional Research Dir (66) 2257 0250 | (66) 2658 6300 ext 1399 [email protected] • Consumer • Materials • Ind. Estates
Sittichai DUANGRATTANACHAYA (66) 2658 6300 ext 1393 [email protected]
• Services Sector • Transport
Yupapan POLPORNPRASERT (66) 2658 6300 ext 1395 [email protected] • Oil & Gas
Sukit UDOMSIRIKUL Head of Retail Research (66) 2658 6300 ext 5090 [email protected]
Mayuree CHOWVIKRAN (66) 2658 6300 ext 1440 [email protected] • Strategy
Padon VANNARAT (66) 2658 6300 ext 1450 [email protected] • Strategy
Surachai PRAMUALCHAROENKIT (66) 2658 6300 ext 1470 [email protected] • Auto • Conmat • Contractor • Steel
Suttatip PEERASUB (66) 2658 6300 ext 1430 [email protected] • Media • Commerce
Sutthichai KUMWORACHAI (66) 2658 6300 ext 1400 [email protected] • Energy • Petrochem
Termporn TANTIVIVAT (66) 2658 6300 ext 1520 [email protected] • Property
Jaroonpan WATTANAWONG (66) 2658 6300 ext 1404 [email protected] • Transportation • Small cap
VIETNAM
LE Hong Lien, ACCA Head of Institutional Research (84) 8 44 555 888 x 8181 [email protected] • Strategy • Consumer • Diversified • Utilities
THAI Quang Trung, CFA, Deputy Manager, Institutional Research (84) 8 44 555 888 x 8180 [email protected] • Real Estate • Construction • Materials
Le Nguyen Nhat Chuyen (84) 8 44 555 888 x 8082 [email protected] • Oil & Gas
NGUYEN Thi Ngan Tuyen, Head of Retail Research (84) 8 44 555 888 x 8081 [email protected] • Food & Beverage • Oil&Gas • Banking
TRINH Thi Ngoc Diep (84) 4 44 555 888 x 8208 [email protected] • Technology • Utilities • Construction
PHAM Nhat Bich (84) 8 44 555 888 x 8083 [email protected] • Consumer • Manufacturing • Fishery
NGUYEN Thi Sony Tra Mi (84) 8 44 555 888 x 8084 [email protected] • Port operation • Pharmaceutical • Food & Beverage
TRUONG Quang Binh (84) 4 44 555 888 x 8087 [email protected] • Rubber plantation • Tyres and Tubes • Oil&Gas
December 2, 2015 24
Strategy Research
APPENDIX I: TERMS FOR PROVISION OF REPORT, DISCLAIMERS AND DISCLOSURES
DISCLAIMERS
This research report is prepared for general circulation and for information purposes only and under no circumstances should it be considered or intended as an offer to sell or a solicitation of an offer to buy the securities referred to herein. Investors should note that values of such securities, if any, may fluctuate and that each security’s price or value may rise or fall. Opinions or recommendations contained herein are in form of technical ratings and fundamental ratings. Technical ratings may differ from fundamental ratings as technical valuations apply different methodologies and are purely based on price and volume-related information extracted from the relevant jurisdiction’s stock exchange in the equity analysis. Accordingly, investors’ returns may be less than the original sum invested. Past performance is not necessarily a guide to future performance. This report is not intended to provide personal investment advice and does not take into account the specific investment objectives, the financial situation and the particular needs of persons who may receive or read this report. Investors should therefore seek financial, legal and other advice regarding the appropriateness of investing in any securities or the investment strategies discussed or recommended in this report.
The information contained herein has been obtained from sources believed to be reliable but such sources have not been independently verified by Maybank Investment Bank Berhad, its subsidiary and affiliates (collectively, “MKE”) and consequently no representation is made as to the accuracy or completeness of this report by MKE and it should not be relied upon as such. Accordingly, MKE and its officers, directors, associates, connected parties and/or employees (collectively, “Representatives”) shall not be liable for any direct, indirect or consequential losses or damages that may arise from the use or reliance of this report. Any information, opinions or recommendations contained herein are subject to change at any time, without prior notice.
This report may contain forward looking statements which are often but not always identified by the use of words such as “anticipate”, “believe”, “estimate”, “intend”, “plan”, “expect”, “forecast”, “predict” and “project” and statements that an event or result “may”, “will”, “can”, “should”, “could” or “might” occur or be achieved and other similar expressions. Such forward looking statements are based on assumptions made and information currently available to us and are subject to certain risks and uncertainties that could cause the actual results to differ materially from those expressed in any forward looking statements. Readers are cautioned not to place undue relevance on these forward-looking statements. MKE expressly disclaims any obligation to update or revise any such forward looking statements to reflect new information, events or circumstances after the date of this publication or to reflect the occurrence of unanticipated events.
MKE and its officers, directors and employees, including persons involved in the preparation or issuance of this report, may, to the extent permitted by law, from time to time participate or invest in financing transactions with the issuer(s) of the securities mentioned in this report, perform services for or solicit business from such issuers, and/or have a position or holding, or other material interest, or effect transactions, in such securities or options thereon, or other investments related thereto. In addition, it may make markets in the securities mentioned in the material presented in this report. MKE may, to the extent permitted by law, act upon or use the information presented herein, or the research or analysis on which they are based, before the material is published. One or more directors, officers and/or employees of MKE may be a director of the issuers of the securities mentioned in this report.
This report is prepared for the use of MKE’s clients and may not be reproduced, altered in any way, transmitted to, copied or distributed to any other party in whole or in part in any form or manner without the prior express written consent of MKE and MKE and its Representatives accepts no liability whatsoever for the actions of third parties in this respect.
This report is not directed to or intended for distribution to or use by any person or entity who is a citizen or resident of or located in any locality, state, country or other jurisdiction where such distribution, publication, availability or use would be contrary to law or regulation. This report is for distribution only under such circumstances as may be permitted by applicable law. The securities described herein may not be eligible for sale in all jurisdictions or to certain categories of investors. Without prejudice to the foregoing, the reader is to note that additional disclaimers, warnings or qualifications may apply based on geographical location of the person or entity receiving this report.
Malaysia
Opinions or recommendations contained herein are in the form of technical ratings and fundamental ratings. Technical ratings may differ from fundamental ratings as technical valuations apply different methodologies and are purely based on price and volume-related information extracted from Bursa Malaysia Securities Berhad in the equity analysis.
Singapore
This report has been produced as of the date hereof and the information herein may be subject to change. Maybank Kim Eng Research Pte. Ltd. (“Maybank KERPL”) in Singapore has no obligation to update such information for any recipient. For distribution in Singapore, recipients of this report are to contact Maybank KERPL in Singapore in respect of any matters arising from, or in connection with, this report. If the recipient of this report is not an accredited investor, expert investor or institutional investor (as defined under Section 4A of the Singapore Securities and Futures Act), Maybank KERPL shall be legally liable for the contents of this report, with such liability being limited to the extent (if any) as permitted by law.
Thailand
The disclosure of the survey result of the Thai Institute of Directors Association (“IOD”) regarding corporate governance is made pursuant to the policy of the Office of the Securities and Exchange Commission. The survey of the IOD is based on the information of a company listed on the Stock Exchange of Thailand and the market for Alternative Investment disclosed to the public and able to be accessed by a general public investor. The result, therefore, is from the perspective of a third party. It is not an evaluation of operation and is not based on inside information. The survey result is as of the date appearing in the Corporate Governance Report of Thai Listed Companies. As a result, the survey may be changed after that date. Maybank Kim Eng Securities (Thailand) Public Company Limited (“MBKET”) does not confirm nor certify the accuracy of such survey result.
Except as specifically permitted, no part of this presentation may be reproduced or distributed in any manner without the prior written permission of MBKET. MBKET accepts no liability whatsoever for the actions of third parties in this respect.
US
This research report prepared by MKE is distributed in the United States (“US”) to Major US Institutional Investors (as defined in Rule 15a-6 under the Securities Exchange Act of 1934, as amended) only by Maybank Kim Eng Securities USA Inc (“Maybank KESUSA”), a broker-dealer registered in the US (registered under Section 15 of the Securities Exchange Act of 1934, as amended). All responsibility for the distribution of this report by Maybank KESUSA in the US shall be borne by Maybank KESUSA. All resulting transactions by a US person or entity should be effected through a registered broker-dealer in the US. This report is not directed at you if MKE is prohibited or restricted by any legislation or regulation in any jurisdiction from making it available to you. You should satisfy yourself before reading it that Maybank KESUSA is permitted to provide research material concerning investments to you under relevant legislation and regulations.
UK
This document is being distributed by Maybank Kim Eng Securities (London) Ltd (“Maybank KESL”) which is authorized and regulated, by the Financial Services Authority and is for Informational Purposes only. This document is not intended for distribution to anyone defined as a Retail Client under the Financial Services and Markets Act 2000 within the UK. Any inclusion of a third party link is for the recipients convenience only, and that the firm does not take any responsibility for its comments or accuracy, and that access to such links is at the individuals own risk. Nothing in this report should be considered as constituting legal, accounting or tax advice, and that for accurate guidance recipients should consult with their own independent tax advisers.

December 2, 2015 25
Strategy Research
Disclosure of Interest
Malaysia: MKE and its Representatives may from time to time have positions or be materially interested in the securities referred to herein and may further act as market maker or may have assumed an underwriting commitment or deal with such securities and may also perform or seek to perform investment banking services, advisory and other services for or relating to those companies.
Singapore: As of 2 December 2015, Maybank KERPL and the covering analyst do not have any interest in any companies recommended in this research report.
Thailand: MBKET may have a business relationship with or may possibly be an issuer of derivative warrants on the securities /companies mentioned in the research report. Therefore, Investors should exercise their own judgment before making any investment decisions. MBKET, its associates, directors, connected parties and/or employees may from time to time have interests and/or underwriting commitments in the securities mentioned in this report.
Hong Kong: KESHK may have financial interests in relation to an issuer or a new listing applicant referred to as defined by the requirements under Paragraph 16.5(a) of the Hong Kong Code of Conduct for Persons Licensed by or Registered with the Securities and Futures Commission.
As of 2 December 2015, KESHK and the authoring analyst do not have any interest in any companies recommended in this research report.
MKE may have, within the last three years, served as manager or co-manager of a public offering of securities for, or currently may make a primary market in issues of, any or all of the entities mentioned in this report or may be providing, or have provided within the previous 12 months, significant advice or investment services in relation to the investment concerned or a related investment and may receive compensation for the services provided from the companies covered in this report.
OTHERS
Analyst Certification of Independence
The views expressed in this research report accurately reflect the analyst’s personal views about any and all of the subject securities or issuers; and no part of the research analyst’s compensation was, is or will be, directly or indirectly, related to the specific recommendations or views expressed in the report.
Reminder
Structured securities are complex instruments, typically involve a high degree of risk and are intended for sale only to sophisticated investors who are capable of understanding and assuming the risks involved. The market value of any structured security may be affected by changes in economic, financial and political factors (including, but not limited to, spot and forward interest and exchange rates), time to maturity, market conditions and volatility and the credit quality of any issuer or reference issuer. Any investor interested in purchasing a structured product should conduct its own analysis of the product and consult with its own professional advisers as to the risks involved in making such a purchase.
No part of this material may be copied, photocopied or duplicated in any form by any means or redistributed without the prior consent of MKE.
Definition of Ratings
Maybank Kim Eng Research uses the following rating system
BUY Return is expected to be above 10% in the next 12 months (excluding dividends)
HOLD Return is expected to be between - 10% to +10% in the next 12 months (excluding dividends)
SELL Return is expected to be below -10% in the next 12 months (excluding dividends)
Applicability of Ratings
The respective analyst maintains a coverage universe of stocks, the list of which may be adjusted according to needs. Investment ratings are only applicable to the stocks which form part of the coverage universe. Reports on companies which are not part of the coverage do not carry investment ratings as we do not actively follow developments in these companies.
DISCLOSURES
Legal Entities Disclosures
Malaysia: This report is issued and distributed in Malaysia by Maybank Investment Bank Berhad (15938-H) which is a Participating Organization of Bursa Malaysia Berhad and a holder of Capital Markets and Services License issued by the Securities Commission in Malaysia. Singapore: This material is issued and distributed in Singapore by Maybank KERPL (Co. Reg No 197201256N) which is regulated by the Monetary Authority of Singapore. Indonesia: PT Kim Eng Securities (“PTKES”) (Reg. No. KEP-251/PM/1992) is a member of the Indonesia Stock Exchange and is regulated by the BAPEPAM LK. Thailand: MBKET (Reg. No.0107545000314) is a member of the Stock Exchange of Thailand and is regulated by the Ministry of Finance and the Securities and Exchange Commission. Philippines: Maybank ATRKES (Reg. No.01-2004-00019) is a member of the Philippines Stock Exchange and is regulated by the Securities and Exchange Commission. Vietnam: Maybank Kim Eng Securities JSC (License Number: 71/UBCK-GP) is licensed under the State Securities Commission of Vietnam.Hong Kong: KESHK (Central Entity No AAD284) is regulated by the Securities and Futures Commission. India: Kim Eng Securities India Private Limited (“KESI”) is a participant of the National Stock Exchange of India Limited (Reg No: INF/INB 231452435) and the Bombay Stock Exchange (Reg. No. INF/INB 011452431) and is regulated by Securities and Exchange Board of India. KESI is also registered with SEBI as Category 1 Merchant Banker (Reg. No. INM 000011708) US: Maybank KESUSA is a member of/ and is authorized and regulated by the FINRA – Broker ID 27861. UK: Maybank KESL (Reg No 2377538) is authorized and regulated by the Financial Services Authority.
December 2, 2015 26
Strategy Research
Malaysia Maybank Investment Bank Berhad
(A Participating Organisation of
Bursa Malaysia Securities Berhad)
33rd Floor, Menara Maybank,
100 Jalan Tun Perak,
50050 Kuala Lumpur
Tel: (603) 2059 1888;
Fax: (603) 2078 4194
Singapore Maybank Kim Eng Securities Pte Ltd
Maybank Kim Eng Research Pte Ltd
50 North Canal Road
Singapore 059304
Tel: (65) 6336 9090
London Maybank Kim Eng Securities
(London) Ltd
5th Floor, Aldermary House
10-15 Queen Street
London EC4N 1TX, UK
Tel: (44) 20 7332 0221
Fax: (44) 20 7332 0302
New York Maybank Kim Eng Securities USA
Inc
777 Third Avenue, 21st Floor
New York, NY 10017, U.S.A.
Tel: (212) 688 8886
Fax: (212) 688 3500
Stockbroking Business:
Level 8, Tower C, Dataran Maybank,
No.1, Jalan Maarof
59000 Kuala Lumpur
Tel: (603) 2297 8888
Fax: (603) 2282 5136
Hong Kong Kim Eng Securities (HK) Ltd
Level 30,
Three Pacific Place,
1 Queen’s Road East,
Hong Kong
Tel: (852) 2268 0800
Fax: (852) 2877 0104
Indonesia PT Maybank Kim Eng Securities
Plaza Bapindo
Citibank Tower 17th Floor
Jl Jend. Sudirman Kav. 54-55
Jakarta 12190, Indonesia
Tel: (62) 21 2557 1188
Fax: (62) 21 2557 1189
India Kim Eng Securities India Pvt Ltd
2nd Floor, The International 16,
Maharishi Karve Road,
Churchgate Station,
Mumbai City - 400 020, India
Tel: (91) 22 6623 2600
Fax: (91) 22 6623 2604
Philippines Maybank ATR Kim Eng Securities Inc.
17/F, Tower One & Exchange Plaza
Ayala Triangle, Ayala Avenue
Makati City, Philippines 1200
Tel: (63) 2 849 8888
Fax: (63) 2 848 5738
Thailand Maybank Kim Eng Securities
(Thailand) Public Company Limited
999/9 The Offices at Central World,
20th - 21st Floor,
Rama 1 Road Pathumwan,
Bangkok 10330, Thailand
Tel: (66) 2 658 6817 (sales)
Tel: (66) 2 658 6801 (research)
Vietnam Maybank Kim Eng Securities Limited
4A-15+16 Floor Vincom Center Dong
Khoi, 72 Le Thanh Ton St. District 1
Ho Chi Minh City, Vietnam
Tel : (84) 844 555 888
Fax : (84) 8 38 271 030
Saudi Arabia In association with
Anfaal Capital
Villa 47, Tujjar Jeddah
Prince Mohammed bin Abdulaziz
Street P.O. Box 126575
Jeddah 21352
Tel: (966) 2 6068686
Fax: (966) 26068787
South Asia Sales Trading Kevin Foy
Regional Head Sales Trading
Tel: (65) 6336-5157
US Toll Free: 1-866-406-7447
North Asia Sales Trading Andrew Lee
Tel: (852) 2268 0283
US Toll Free: 1 877 837 7635
Malaysia Rommel Jacob [email protected] Tel: (603) 2717 5152
Thailand Tanasak Krishnasreni [email protected] Tel: (66)2 658 6820
Indonesia Harianto Liong [email protected] Tel: (62) 21 2557 1177
New York Andrew Dacey [email protected] Tel: (212) 688 2956
India Manish Modi [email protected] Tel: (91)-22-6623-2601
Vietnam Tien Nguyen [email protected]
Tel: (84) 44 555 888 x8079
Philippines Keith Roy [email protected] Tel: (63) 2 848-5288
www.maybank-ke.com | www.maybank-keresearch.com