malaya of university - um students' repositorystudentsrepo.um.edu.my/6328/1/mahdi.pdf · 2019....
TRANSCRIPT

PHYSIOLOGICAL CONTROL OF AN
IMPLANTABLE ROTARY BLOOD PUMP
MAHDI MANSOURI
THESIS SUBMITTED IN FULFILMENT OF THE
REQUIREMENTS FOR THE DEGREE OF DOCTOR
OF PHILOSOPHY
FACULTY OF ENGINEERING
UNIVERSITY OF MALAYA
KUALA LUMPUR
2016
Univers
ity of
Mala
ya

ii
UNIVERSITY OF MALAYA
ORIGINAL LITERARY WORK DECLARATION
Name of Candidate: Mahdi Mansouri
Matric No: KHA120148
Name of Degree: Doctor of Philosophy
Title of Thesis: Physiological control of an implantable rotary blood
pump
Field of Study: Electrical Control Engineering-Rotary Blood Pumps
I do solemnly and sincerely declare that:
(1) I am the sole author/writer of this Work;
(2) This Work is original;
(3) Any use of any work in which copyright exists was done by way of fair dealing
and for permitted purposes and any excerpt or extract from, or reference to or
reproduction of any copyright work has been disclosed expressly and
sufficiently and the title of the Work and its authorship have been
acknowledged in this Work;
(4) I do not have any actual knowledge nor do I ought reasonably to know that the
making of this work constitutes an infringement of any copyright work;
(5) I hereby assign all and every rights in the copyright to this Work to the
University of Malaya (“UM”), who henceforth shall be owner of the copyright
in this Work and that any reproduction or use in any form or by any means
whatsoever is prohibited without the written consent of UM having been first
had and obtained;
(6) I am fully aware that if in the course of making this Work I have infringed any
copyright whether intentionally or otherwise, I may be subject to legal action
or any other action as may be determined by UM.
Candidate’s Signature Date: 16/03/2016
Subscribed and solemnly declared before,
Witness’s Signature Date: 16/03/2016
Name:
Designation:
Univers
ity of
Mala
ya

iii
ABSTRACT
Left ventricular assist devices (LVADs) are mechanical pumps that their usage expanded
from bridging to recovery to bridging to decision, and destination therapy. A
physiologically responsive pump control strategy, which automatically adjusts variations
in the metabolic demands, is tremendously needed to maximize the quality of the implant
recipients’ life. The aim of this dissertation is providing a robust physiological based
controller, which could resist against all possible distortion during its working life.
At the first step, the performance of a number of previously proposed physiologically
responsive controllers were comparably evaluated. The study proved applying a constant
(static) controlling method could not provide the pump best controlling performance
level, and indicates the demand of an adaptive (dynamic) controller, which will satisfy all
physiological requisites. The results also suggested putting the focus on preload
sensitivity of the ventricular myocardium. Such issue is an essential requirement for the
Frank-Starling mechanism by which the left ventricular end-diastolic pressure (PLVED)
controls the force of contraction of the left ventricle (LV) in proportion to the blood flow
received from the right heart and pulmonary circulation.
At the next step a preload-based Starling-like controller for Implantable rotary blood
pumps (IRBPs) using PLVED as the feedback variable was evaluated in a validated
numerical model. The controller emulated the response of the natural LV to changes in
PLVED. It was reported the performance of the preload-based Starling-like controller in
comparison with recently designed pulsatility controller and constant speed operation. In
handling the transition from a baseline state to test states, which included vigorous
exercise, blood loss and a major reduction in the LV contractility (LVC), the preload
controller outperformed pulsatility control and constant speed operation in all three test
scenarios.
Univers
ity of
Mala
ya
iv
The study third objection was realizing preload-based using a controlling technique that
reinforced the system to rapidly reach the target pump flow within eight heartbeats, else
suction might occur. The technique must be also robust against noises contaminated the
feedback signal. Accordingly, this study also attentively examined the transient and
steady state response of two different preload-based control implementations in the
numerical model. The implementations were tested under both ideal (noise free) and noisy
conditions at baseline to vigorous exercise as well as blood loss transitions. Proportional-
integral-derivative (PID) and sliding mode controller (SMC) were the chosen controlling
techniques, selected due to their popularity and robustness reputation. While at the noise
free condition system measured PLVED was directly fed to the controller, the author
contaminated the feedback signal with different levels of Gaussian white noises to realize
the noisy condition. The results showed no significant difference between the two
preload-based control implementations under ideal condition during all testing scenarios.
Proceeding the tests showed that both PID and SMC delivered almost comparable
performance at signal to noise ratio (SNR) of 15dB, although by increasing the noise level
to 7dB PID finally failed at blood loss scenario and severely penetrated in the suction,
indicated by persistent negative PLVED. On the contrary, SMC is the control strategy
that not only could tolerate all the noise levels and never fell into the suction region, but
also could maintain a reasonable level of hemodynamic parameters deviations
comparably.
The last objective of this study was to develop an in-vitro evaluation protocol for control
system utilizing a mock circulation loop (MCL) exploiting the same scenarios used in the
second objective. The test showed that the devised scenarios were useful for evaluation
of preload-based control. Observing the results showed the preload controller could again
outperform the constant speed operational in all three scenarios, provided the impetus for
further animal trials.
Univers
ity of
Mala
ya

v
ABSTRAK
Peranti pembantu ventrikel kiri (LVADs) merupakan pam mekanikal yang
penggunaannya berkembang daripada merapatkan pemulihan kepada merapatkan
keputusan,. Satu strategi kawalan pam responsif amat fisiologi, yang menyesuaikan
perubahan sekara automatik permintaan metabolik, adalah diperlukan untuk
memaksimumkan kualiti hidup penerima inplan. Tujuan kajian ini adalah menyediakan
satu pengawal berasaskan fisiologi yang kukuh, yang dapat menahan terhadap semua
penyelewengan yang mungkin berlaku sepanjang penggunaannya.
Sebagai langkah pertama, prestasi dalam beberapa pengawal fisiologi responsif yang
dicadangkan sebelum ini telah dibanding nilai. Perbezaan dari segi prestasi jelas
menunjukkan bahawa pelaksanaan pengawalan kaedah tetap (statik) tidak dapat memberi
tahap prestasi pengawalan yang terbaik kepada pam dan menunjukkan kepentingan
pengawal adaptif (dinamik) amat diperlukan untuk memenuhi segala syarat fisiologi.
Juga daripada keputusan yang dikumpulkan, sensitiviti prabeban terhadap miokardium
ventrikle haruslah diberikan tumpuan utama. Hal ini berkenaan dengan mekanisme
Frank-Starling yang menyatakan daya pengecutan ventrikle kiri (LV) adalah bergatungan
kepada tekanan ventrikle kiri akhir diastolic (PLVED) supaya keseimbangan aliran darah
antara sistem pulmonary dan sistem sistemic dapat dicapai.
Pada langkah seterusnya pengawal Starling berasaskan perabeban-untuk pam darah
berputar implan (IRBPs) menggunakan PLVED sebagai pembolehubah maklum balas
yang telah dinilai dalam model pengiraan yang disahkan. Pengawal ini mencontahi
tindakbalas LV semula jadi kepada perubahan dalam PLVED. Dilaporkan prestasi
pengawal Starling seperti berasaskan prabeban-berbanding dengan pengawal pulsatility
direka baru-baru ini dan operasi kelajuan tetap. Dalam mengendalikan peralihan dari
keadaan asas untuk menguji keadaan, termasuk sukan berat, kehilangan darah dan
Univers
ity of
Mala
ya

vi
keutanaan pengurangan dalam contractility LV (LVC), pengawal prabeban yang
mengatasi kawalan pulsatility dan operasi kelajuan tetap dalam ketiga-tiga senario ujian.
Kajian bantahan ketiga menggunakan teknik kawalan yang mengukuhkan sistem untuk
mencapai aliran pam sasaran lagi dengan pesat dalam tempoh lapan degupan jantung,
kalau sedutan tidak mungkin berlaku memeriksa dengan teliti. Teknik ini mesti juga teguh
terhadap hingar yang mencemarkan isyarat maklum balas. Oleh itu, kajian ini juga
memeriksa dengan teliti keadaan fana dan mantap dalam dua aplikasi kawalan berasaskan
prabeban-berbeza dalam model berangka. Pelaksanaan yang telah diuji di bawah keadaan
ideal (hingar bebas) dan keadaan bising pada garis dasar untuk latihal fisikan berat serta
peralihan kehilangan darah. Proportional-Integral-Derivative (PID) dan Sliding Mode
Controller (SMC) adalah teknik pengawalan yang dipilih, dipilih kerana kepopularan dan
reputasi keteguhan. Manakala dalam sistem keadaan hingarbebas PLVED yang diukur
telah disuapkan terus pengawal, pengarang mencemarkan isyarat maklum balas dengan
hingar putih Gauss bertabah untuk merealisasikan keadaan bising. Keputusan kajian
menunjukkan tiada perbezaan yang ketara antara kedua-dua implentasi kawalan
berasaskan prabeban di bawah keadaan yang ideal semasa semua senario ujian.
Prosiding ujian menunjukkan bahawa kedua-dua PID dan SMC mencapai prestasi yang
setanding dengan nisbah isyarat hingar (SNR) sebanyak 15dB, walaupun dengan
meningkatkan tahap hingar kepada 7dB PID akhirnya gagal dengan senario kehilangan
darah dan menembusi dalam sedutan, tertunjuk dengan PLVED negative yang berteruan.
Sebaliknya, SMC adalah strategi kawalan yang bukan sahaja boleh bertolak ansur dengan
semua peringkat bunyi dan tidak pernah jatuh ke rantau sedutan, tetapi juga boleh
mengekalkan penyisihan parameter hemodinamik tahap yang padah munasabah.
Objektif terakhir kajian ini adalah untuk maeciptakan satu penilaian protokol in-vitro
untuk sistem kawalan menggunakan gelung peredaran olok-olok (MCL) menggunakan
Univers
ity of
Mala
ya

vii
senario yang sama digunakan dalam objektif kedua. Keputusan tersebut tertakluk kepada
prabeban dan afterload perubahan sama seperti yang diperhatikan dalam model berangka.
Keputusan menunjukkan pengawal prabeban boleh mengatasi kelajuan malar operasi
dalam semua tiga senario, dengan syarat dorongan untuk ujian haiwan selanjutnya.
Univers
ity of
Mala
ya

viii
ACKNOWLEDGEMENT
I would like to express my sincere gratitude to my beloved wife, Elham, for her
continuous support. I appreciate all the motivation and enthusiasm she has given to me. I
would not have accomplished this thesis without her help and encouragement.
I thank my supervisors, Dr. Lim Einly and Prof. Dr. Rini Akmeliawati, for their immense
knowledge. I also thank my advisors, Prof. Robert F. Salamonsen and Dr. Shaun D.
Gregory, for their kind support. Their guidance helped me throughout my research, and I
could not have imagined having better advisors and mentors for my PhD study. I would
like to thank Prof. Nigel H. Lovell for his encouragement and insightful comments.
I thank my fellow lab-mates in the Asian Cardiac Engineering Lab, Faculty of
Engineering, University of Malaya, and Innovative Cardiovascular Engineering and
Technology Lab, The Prince Charles Hospital, Brisbane, Queensland, Australia, for the
stimulating discussions and all the fun we have had in the last three years.
Univers
ity of
Mala
ya

ix
TABLE OF CONTENTS
ABSTRACT .................................................................................................................... iii
ABSTRAK ....................................................................................................................... v
ACKNOWLEDGEMENT ........................................................................................... viii
TABLE OF CONTENTS ............................................................................................... ix
LIST OF FIGURES ..................................................................................................... xiii
LIST OF TABLES ...................................................................................................... xvii
LIST OF SYMBOLS AND ABBREVIATIONS ....................................................... xix
CHAPTER 1: INTRODUCTION ............................................................................. 1
1.1 Research Motivation ........................................................................................... 1
1.2 Objectives ........................................................................................................... 3
1.3 Thesis layout ....................................................................................................... 4
CHAPTER 2: LITERATURE REVIEW ................................................................. 6
2.1 Introduction ........................................................................................................ 6
2.2 The Human Circulatory System, Anatomy and Physiology .............................. 6
2.3 Cardiac Cycle ..................................................................................................... 8
2.4 The Frank-Starling Law ................................................................................... 10
2.5 Heart Failure ..................................................................................................... 11
2.6 Heart Failure Mechanical Therapy ................................................................... 12
2.6.1 Generations of VADs ................................................................................ 12
2.6.2 Physiological Control of VADs ................................................................ 13
CHAPTER 3: FIXED SET POINT BLOOD PUMP CONTROLLERS ............. 17
Univers
ity of
Mala
ya

x
3.1 Introduction ...................................................................................................... 17
3.2 Materials and Methods ..................................................................................... 20
3.2.1 Model Description ..................................................................................... 20
3.2.2 Exercise Model.......................................................................................... 22
3.2.3 HUT Model ............................................................................................... 22
3.2.4 Simulation Protocols ................................................................................. 23
3.3 Results .............................................................................................................. 28
3.3.1 Comparison with Published Experimental Observations .......................... 28
3.3.2 Sensitivity Analysis: Effects of Individual Parameters on Exercise ......... 29
3.3.3 Sensitivity Analysis: Effects of Individual Parameters on HUT
Response ................................................................................................................. 31
3.3.4 Comparison of Various Control Strategies ............................................... 34
3.4 Discussion ........................................................................................................ 36
3.5 Limitations ........................................................................................................ 41
3.6 Conclusion ........................................................................................................ 42
CHAPTER 4: PRELOAD-BASED STARLING-LIKE CONTROL FOR
ROTARY BLOOD PUMPS ......................................................................................... 44
4.1 Introduction ...................................................................................................... 44
4.2 Methods ............................................................................................................ 46
4.2.1 Description of the Heart-Pump Interaction Model.................................... 46
4.2.2 Description of the Control Systems .......................................................... 46
4.2.3 Simulation Protocols ................................................................................. 49
4.3 Results .............................................................................................................. 53
4.4 Discussion ........................................................................................................ 60
4.4.1 Physiological Mechanisms ........................................................................ 60
4.4.2 Nature of Preload-Based Starling-Like Control ........................................ 62
4.4.3 Deficiencies of the Preload-Based Starling-Like Control ......................... 65
4.4.4 Inadequacies of the Study and Future Work ............................................. 66
Univers
ity of
Mala
ya

xi
4.5 Conclusion ........................................................................................................ 66
CHAPTER 5: THE ROBUST PRELOAD-BASED CONTROL ......................... 67
5.1 Introduction ...................................................................................................... 67
5.2 Methodology .................................................................................................... 69
5.2.1 Model Description ..................................................................................... 69
5.2.2 Preload-Based Control .............................................................................. 72
5.2.3 Sliding Mode Controller ........................................................................... 74
5.2.4 Simulation Protocol ................................................................................... 77
5.2.5 Performance Evaluation ............................................................................ 78
5.3 Results .............................................................................................................. 81
5.3.1 Dynamic Cardiovascular Response to Exercise and Blood Loss under
Constant Speed Mode ............................................................................................. 81
5.3.2 Controllers Comparison ............................................................................ 83
5.4 Discussion ........................................................................................................ 87
5.4.1 Preload-Based Frank-Starling-Like Control ............................................. 88
5.4.2 Comparison between SMC and PID controllers ....................................... 89
5.5 Limitations and Future Works .......................................................................... 92
5.6 Conclusion ........................................................................................................ 92
CHAPTER 6: THE IN-VITRO EVALUATION OF THE PRELOAD-BASED
CONTROL ........................................................................................................... 94
6.1 Introduction ...................................................................................................... 94
6.2 Methodology .................................................................................................... 96
6.2.1 Description of the Mock Circulation Loop ............................................... 96
6.2.2 Preload-Based Control .............................................................................. 97
6.2.3 System Lines ........................................................................................... 100
6.2.4 Controller Implementation ...................................................................... 102
6.2.5 Experimental Protocol ............................................................................. 103
6.2.6 Performance Evaluation .......................................................................... 105
Univers
ity of
Mala
ya

xii
6.3 Results ............................................................................................................ 105
6.4 Discussion ...................................................................................................... 111
6.5 Limitations and Future Work ......................................................................... 114
6.6 Conclusion ...................................................................................................... 114
CHAPTER 7: CONCLUSIONS AND RECOMMENDATIONS ...................... 115
7.1 Conclusions .................................................................................................... 115
7.2 Suggestions for Future Work ......................................................................... 117
7.2.1 Noninvasive estimation of PLVED ......................................................... 117
7.2.2 Adjustments of the scaling factor for the Frank-Starling curves ............ 117
7.2.3 In vivo evaluation of the preload-based controller ................................. 118
7.2.4 Alternative control strategies .................................................................. 118
REFERENCES ............................................................................................................ 119
LIST OF PUBLICATIONS ........................................................................................ 129
Univers
ity of
Mala
ya

xiii
LIST OF FIGURES
Figure 2.1: Anatomy of the human heart (A C Guyton & Hall, 2005). ............................ 6
Figure 2.2: Human Circulatory System (RevisionWorld, 2015). ..................................... 7
Figure 2.3: Aortic, left atrial and left ventricular pressure waveforms during a cardiac
cycle (A C Guyton & Hall, 2005). .................................................................................... 8
Figure 2.4: (A) Cardiac output curves, which show the relationship between left and right
ventricular output and preload because of the Frank-Starling mechanism. (B) The
sensitivity of cardiac output to preload and the maximum cardiac output increases with
sympathetic nervous stimulation of the heart, and decrease with heart failure (A C Guyton
& Hall, 2005). ................................................................................................................. 10
Figure 2.5: Examples of first, second and third generation ventricular assist devices. (A)
PVAD (Thoratec Corporation, Pleasanton, CA, USA). (B) HeartMate II (Thoratec
Corporation, Pleasanton, CA, USA). (C) HVAD (HeartWare Inc., Massachusetts, USA)
(M. C. Stevens, 2014). .................................................................................................... 12
Figure 3.1: The lumped parameter model of VentrassistTM LVAD and the cardiovascular
system (Einly Lim et al., 2010). ...................................................................................... 21
Figure 3.2: Block diagram of the PID controller for closed loop studies ....................... 26
Figure 3.3: Comparison among the controllers rest to exercise ...................................... 34
Figure 3.4: Comparison among the controllers from supine to 700 HUT. ...................... 35
Figure 4.1: (A) and (B): Schematic describing the preload-based Starling-like control.
White circle, position of operating point (current combination of PLVED and QP ) before
a change of state; Grey circles, position of operating points after changes in states; Black
circles, position of operating points upon arriving at the new steady state located at the
intersection between the control line and the new system line. The controller drives the
changes in the operating points along the path indicated by the arrows along the new
system line. ...................................................................................................................... 48
Univers
ity of
Mala
ya

xiv
Figure 4.2: System response to variations in mean pump flow for baseline and three test
conditions. Figure also shows the superimposed control line (CLn), where the minimum
scaling factor (K) that allows the aortic valve to be closed in the baseline condition was
chosen. Arrows indicate points where the aortic valve starts to open. ........................... 51
Figure 4.3: Block diagram of the PID controller for closed loop studies. ...................... 52
Figure 4.4: Comparison of preload controller vs. pulsatility and constant speed modes
from baseline to exercise (absolute value changes). ....................................................... 54
Figure 4.5: Comparison of preload controller vs. pulsatility and constant speed modes
from baseline to hemorrhage (absolute value changes). ................................................. 55
Figure 4.6: Comparison of preload controller vs. pulsatility and constant speed modes
from baseline to reduced left ventricular contractility scenario (absolute value changes).
......................................................................................................................................... 56
Figure 5.1: Block diagram of control system .................................................................. 73
Figure 5.2: Poles-zeros of the model estimator. .............................................................. 75
Figure 5.3: Arterial pressure and pump flow from baseline to (A) exercise and (B) blood
loss, at the constant speed mode. Mean arterial pressure and mean pump flow from
baseline to (C) exercise and (D) blood loos at no noise condition, preload-based control
methods. P1, transient phase 1; P2, transient phase 2; P3, transient phase 3. ................... 82
Figure 5.4: Average pump flow and PLVED from baseline to (A) exercise and (B) of
preload-based control methods, SNR of 15dB. Average pump flow and PLVED from
baseline to (C) exercise and (D) blood loss of preload-based control methods, SNR of
7dB. ................................................................................................................................. 91
Figure 6.1: (A) Schematic of the dual circuit Mock Circulation Loop, and (B) Photograph
of the MCL. LA, left atrium; MV, mitral valve; LV, left ventricle; AoV, aortic valve;
AoC, systemic arterial compliance; SQ, systemic flow meter; SVR, systemic venous
resistance; SVC, systemic venous compliance; RA, right atrium; TV, tricuspid valve; RV,
Univers
ity of
Mala
ya

xv
right ventricle; PV, pulmonary valve; PAC, pulmonary arterial compliance; PQ,
pulmonary flow meter; PVR, pulmonary venous resistance; PVC pulmonary venous
compliance; LVAD left ventricular assist device. .......................................................... 97
Figure 6.2: Block diagram of the control system. Grey circles, position of operating points
after changes in states; White circle, position of operating point (current combination of
PLVED and QP ) before a change of state; Black circles, position of operating points upon
arriving at the new steady state located at the intersection between the control line and
the new system line. The controller drives the changes in the operating points along the
path indicated by the arrows along the new system line; PLVEDm serves as the input to
the preload controller; ∑, 1-second moving average. ..................................................... 99
Figure 6.3: System response to variations in mean pump flow (QP) for baseline and three
test conditions. Figure also shows the superimposed control line (CLn), where the
minimum scaling factor (K) that allows the aortic valve to be closed in the baseline
condition was chosen. Arrows indicate points where the aortic valve starts to open. .. 101
Figure 6.4: (A) Transient and steady state response of the mean arterial pressure and pump
flow, and (B) the relationship between mean pump flow and mean PLVED while
transitioning from baseline to exercise, for the constant speed mode and preload-based
control. P1, transient phase 1; P2, transient phase 2; P3, transient phase 3. The transition
started at t=120 s. .......................................................................................................... 107
Figure 6.5: (A) Transient and steady state response of mean arterial pressure and pump
flow, and (B) the relationship between mean pump flows and mean PLVED while
transitioning from baseline to 700 HUT, for the constant speed mode and preload-based
control. P1, transient phase 1; P2, transient phase 2; P3, transient phase 3.The transition
started at t=120 s. .......................................................................................................... 109
Figure 6.6: (A) Transient and steady state response of mean arterial pressure and pump
flow, and (B) the relationship between mean pump flow, and mean PLVED while
Univers
ity of
Mala
ya

xvi
transitioning from baseline to reduced LV contractility scenario, for the constant speed
mode and preload-based control. P1, transient phase 1; P2, transient phase 2; P3, transient
phase 3. The transition started at t=120 s. ..................................................................... 110
Univers
ity of
Mala
ya

xvii
LIST OF TABLES
Table 3.1: Model simulated and published hemodynamic data during rest and exercise
......................................................................................................................................... 27
Table 3.2: Model simulated and published hemodynamic data during supine and 700 HUT
......................................................................................................................................... 28
Table 3.3: Effect of individual parameter on key hemodynamic variables during rest and
exercise ............................................................................................................................ 30
Table 3.4: Effect of individual parameter on key hemodynamic variables during supine
and 70° HUT ................................................................................................................... 33
Table 4.1: Gradients for return lines (ratio of mean pump flow to PLVED) for baseline
and three test scenarios, i.e. exercise, blood loss, and reduced LV contractility scenario.
......................................................................................................................................... 51
Table 4.2: PID gains used for both preload and pulsatility controlling methods. ........... 53
Table 4.3: Model simulated hemodynamic data at baseline (rest) and exercise with
different controllers. ........................................................................................................ 57
Table 4.4: Model simulated hemodynamic data at baseline (rest) and with blood-loss for
different controllers. ........................................................................................................ 59
Table 4.5: Model simulated hemodynamic data at baseline (rest) and fall in left ventricular
contractility. .................................................................................................................... 60
Table 5.1: Hemodynamic data for the normal and heart failure conditions.................... 70
Table 5.2: Upper and lower limits for three key hemodynamics variables. ................... 80
Table 5.3: Model simulated hemodynamic data at baseline (rest), exercise, and blood loss
with constant speed and preload-based controllers. ........................................................ 84
Table 5.4: Mean absolute error (MAE), root mean squared hemodynamic deviation
(RMSHD), suction duration and suction depth for mean QP (pump flow) in each control
Univers
ity of
Mala
ya

xviii
strategy subject for Constant speed, PID preload-based and SMC preload-based testing
protocol at noise free and noisy conditions. .................................................................... 86
Table 6.1: Gradients for return lines (ratio of mean pump flow to PLVED) for baseline
and three test scenarios, i.e. exercise, HUT and reduced LV contractility scenario. During
exercise, the aortic valve (AV) remained open throughout the range of speed tested, while
in reduced LV contractility scenario (Low LVC), the AV remained close. ................. 102
Table 6.2: Key MCL parameters for mimicking different hemodynamic conditions. Clv,
LV end systolic elastance. ............................................................................................. 104
Table 6.3: In-vitro hemodynamic data at baseline (rest) and exercise for constant speed
mode and preload-based controllers.............................................................................. 108
Table 6.4: In-vitro hemodynamic data at baseline (rest) and 70o head up tilt (HUT) for
constant speed mode and preload-based controllers ..................................................... 110
Table 6.5: In-vitro hemodynamic data at baseline (rest) and reduced LV contractility
scenario (LVC) for constant speed mode and preload-based controllers. .................... 111
Univers
ity of
Mala
ya

xix
LIST OF SYMBOLS AND ABBREVIATIONS
A(t) Target value in mean absolute error
AO Aorta
ARX Autoregressive exogenous
at After transition
AV Aortic valve
bt Before transition
CF Continuous flow
CLn Control line
CLv (mmHg/s) LV end systolic elastance
CO (L/min) Cardiac output
CO (L/min) Mean cardiac output
CP Cardiopulmonary
CV Cardiovascular
CVP (mmHg) Mean central venous pressure
CVS Cardiovascular system
D Diode
DSMC Discrete sliding mode control
Univers
ity of
Mala
ya

xx
dP (mmHg)
Constant average pressure difference between the aorta and
the left atrium
dPpump (mmHg) Constant average differential pump pressure
E (mmHg/mL) Elastance
e[k] The model noise components
el(t) Time varying elastance function
EDPVR End-diastolic pressure-volume relationship
Ei Elastance in compartment i
Elv (mmHg/mL) Left ventricular elastance
Emax,lv (mmHg/mL) Left ventricular end systolic elastance
Erv (mmHg/mL) Right ventricular contractility
ESPVR End-systolic pressure-volume relationship
FSLC Frank-Starling-like control
GPI Gradient of pulsatility index
HCVS (mmHg) Differential pressure between the left ventricle and the aorta
HF Heart failure
HIP Hydrostatic indifference point
H-Q Pump differential pressure versus pump flow
Univers
ity of
Mala
ya

xxi
HR (bmp) Heart rate
HUT Head-up tilt
IRBP Implantable Rotary Blood Pump
Is
Number of intervals over which the actual pump speed
exceeds the suction speed
K Preload-based equation scaling factor
Kcl Tracking control state-feedback gain matrix
KI Integral gain
KD Derivative gain
KP Proportional gain
L (Kg.m−4) Inertance
LA Left atrium
LAP (mmHg) Left atrial pressure
Lin (Kg.m-4) Inlet cannula inertance
LLx Lower limit bound of variable x
Lout (Kg.m-4) Outlet cannula inertance
LTI Linear time varying
LVP (mmHg) Left ventricular pressure
Univers
ity of
Mala
ya

xxii
LV Left ventricle
LVAD Left ventricle assist device
MAE Mean absolute error
MAP (mmHg) Mean arterial pressure
MCL Mock circulation loop
NM Numerical model
NSD Normalized square deviation
NSDx(t) Normalized square deviation of variable of x(t)
P (mmHg) Pressure
PA Pulmonary peripheral vessels
PI (L/min) pulsatility index
PID Proportional-integral and derivative
PIQP (L/min) Pump flow pulsatility index
Pla (mmHg) Left atrial pressure
Pla (mmHg) Mean left atrial pressure
PLVED (mmHg) Left ventricle end diastolic pressure
PLVED (mmHg) Mean left ventricle end diastolic pressure
PLVED (mmHg) Estimated left ventricle end diastolic pressure
Univers
ity of
Mala
ya

xxiii
PLVEDm (mmHg)
Mean left ventricle end diastolic pressure, used in in-vitro
section
Ppa (mmHg) Pulmonary arterial pressure
PPa (mmHg) Mean pulmonary arterial pressure
PS (L/min/mmHg) Preload sensitivity
Psa (mmHg) Systemic arterial pressure
Psa (mmHg) Mean systemic arterial pressure
Pthor,1 (mmHg) Intrathoracic pressure 1
Pthor,1 (mmHg) Intrathoracic pressure 2
Pu (mmHg) Pulmonary veins
PV (mmHg) Valve pressure
PWM (V) Pulse width modulation
PWM (V) Mean pulse width modulation
Qav (L/min) Aortic valve flow
Qav (L/min) Mena aortic valve flow
Qi (L/min) Blood flow in compartment i
QP (L/min) Pump flow
QP (L/min) Mean pump flow
Univers
ity of
Mala
ya

xxiv
QP (L/min) Estimated averaged pump flow
QPRef (L/min) Desired mean pump flow
Qv (L/min) Blood flow through the valve
R (mmHg.s/mL) Resistance
RA Right atrium
RAP (mmHg) Right atrial pressure
ratioPI
Constant ratio between mean pump flow and pump flow
pulsatility
Rin (mmHg.s/mL) Inlet cannula resistance
RMSHD Root mean squared hemodynamic deviation
Rout (mmHg.s/mL) Outlet cannula resistance
Rsuc (mmHg.s/mL) Suction resistance
RV Right ventricle
S Constant switching vector of sliding mode control
s[k] Sliding mode control switching function
SA Systemic peripheral vessels
Sl Complex number frequency
SHD Squared hemodynamic deviation
Univers
ity of
Mala
ya

xxv
SMC Sliding mode control
SNR (dB) Signal-to-noise ratio
SV Systemic veins
SVC Systemic venous compliance
SVR (mmHg.s/mL) Systemic vascular resistance
T (s) Sampling period
Td (s) Simulation duration
u[k] Sliding mode control output
ufi[k] Final controller output, fed to sliding mode control
ULx Upper limit value of variable x
usf[k] State feed-back control output
VAD Ventricular assist device
VC Vena cava
Vi (mL) Blood volume in compartment i
Vt (mL) Total blood volume
WHO World health organization
Y(t) Actual value in mean absolute error
yx Actual value of variable x
Univers
ity of
Mala
ya

xxvi
yx(t) Actual value of variable x(t)
Β Desensitized reflex response
βs Sliding mode control disturbance bound
βHR Desensitized effector response (except heart rate)
∆ti
The ith interval over which the actual pump speed exceeds the
suction speed
δA System parameter variation
ϵ Sliding mode control reaching velocity
η
Measure shows how deep, on average, the pump speed
progresses into the suction region
ρ
Percentage of total simulation time during which suction
occurs
τ Sliding mode control converging exponential
τi (s) Broreflex model time constants
ω (rpm) Blood pump speed
ω (rpm) Mean blood pump speed
ωs (rpm) The speed at which suction occurs
ωSP (rpm) Mean blood pump speed set-point
Univers
ity of
Mala
ya

1
CHAPTER 1: INTRODUCTION
1.1 Research Motivation
The latest world health organization (WHO) report disclosed that heart failure (HF) is the
leading cause of death in Malaysia, killing 22,700 people, or 22% of total deaths in 2011
only (World Health Organization, 2015). This disease affects a wide range of population,
including the youngsters and the elderly. The severity of the disease ranges from mild to
severe, which requires immediate surgery and transplantation in many instances. In
addition, it also devours a huge portion of public health budget annually.
Left ventricular assist devices (LVADs) are mechanical pumps that now enjoy a clinically
accepted role in supporting the failing heart in a number of scenarios, including
destination therapy, bridge to recovery and bridge to transplantation. Implantable rotary
blood pumps (IRBPs) are continuous flow ventricular assist devices (VADs) that have
become increasingly popular due to the negligible blood trauma along with their light
weight and small size, which facilitate their usage for in-home patient care (D. Timms,
2011). Currently, most commercially available IRBPs still function at a fixed speed
predetermined by the physicians, which is insensitive to changes in the metabolic
requirements of the patients and preload (the end diastolic volume that stretches the right
or left ventricle of the heart to its greatest dimensions) (Salamonsen, Mason, & Ayre,
2011). Such insensitivity increases the risk of over-pumping, causing left ventricular (LV)
suction, or under-pumping, which can cause pulmonary congestion, renal insufficiency
and other problems (Salamonsen et al., 2013).
These deficiencies have driven the development of more than 30 different physiological
control methods to match pump output to physiological requirements (A.-H. H. AlOmari
et al., 2013). Despite the extensive efforts, none of these controllers have gained clinical
acceptance in commercial devices due to their lack of confidence by clinicians
Univers
ity of
Mala
ya

2
(Salamonsen et al., 2012). For example, Choi, Boston, and Antaki (2007) proposed a
fuzzy logic controller that utilized the pulsatility ratio of the pump flow and (dppump) a
control index. The controller regulated the pump speed regarding a reference pulsatility
ratio under different operational states. The major limitation of Choi and any other
controller that is based on pump pulsatility is a strong dependency established on the
controller and pump operating point. Pump pulsatility (flow, current, pressure gradient,
or speed) is a consequence of left ventricular (LV) contraction whereas LV preload is one
of the determinants of LV contraction. With severe LV failure, as is the case for all LVAD
recipients, the LV does not have the ability to induce major changes in pulsatility.
Therefore, the dynamic range of the pulsatility index is small, and consequently its ability
as a control input is limited. In the extreme case where LV contractility is zero, pulsatility
control is not feasible
Preload sensitivity of the ventricular myocardium is an essential requirement for the
Frank-Starling mechanism by which the left ventricular end-diastolic pressure (PLVED)
controls the force of contraction of the left ventricle (LV) in proportion to the blood flow
received from the right heart and pulmonary circulation. Therefore, it would seem logical
that LV preload be selected as the feedback variable of choice in physiological control
systems designed for IRBPs. However, this has not happened seemingly because
developing a controller with fast response that can reach the pump flow set point within
ten seconds (Salamonsen et al., 2012) is a real challenge in any physiological control
system, considering a slow response may result in suction after hemorrhage or changes
in posture. Additionally, one of the main concerns relating to preload control
implementation regards measuring LV pressure. Currently available implantable pressure
transducers are rendered virtually unusable due to a range of problems; particularly, the
noise (disturbance) that generally affects the signal measured in ventricular pulsatility
waveform (Lin, Lowe, & Al-Jumaily, 2014). Therefore, the purpose of this dissertation
Univers
ity of
Mala
ya

3
is to propose a robust preload-based physiological controller that could adapt to the body
requirement during various hemodynamic perturbations in the presence of external noise,
and without falling into critical conditions such as suction or pulmonary congestion.
1.2 Objectives
The objectives of this dissertation are as follows:
i. The first objective of this dissertation is to evaluate the performance of a number
of previous proposed physiologically responsive controllers based on constant set-
point controlling methods using a validated numerical model. This includes
constant speed, constant flow PI, constant average pressure difference between
the aorta and the left atrium (dP ), constant average differential pump pressure
(dPpump ), constant ratio between mean pump flow and pump flow pulsatility
(ratioPI ) or linear Starling-like control, and constant left atrial pressure (Pla)
control.
ii. The second objective of this dissertation is to develop a preload-based Frank-
Starling control method, which emulates the Frank-Starling mechanism of the
native heart. The preload-based control regulates pump flow using left ventricular
end diastolic pressure (PLVED) as the feedback signal. The performance of the
proposed preload-based control was assessed in comparison with the constant
speed operation and the pulsatility index control. The study was carried out using
a sophisticated and experimentally validated computer model of the human
circulation and the VentrAssistTM LVAD.
Univers
ity of
Mala
ya

4
iii. The third objective of this dissertation is to develop a sliding mode controller
(SMC) to drive the preload-based control method through various hemodynamic
transitions, and compared the transient and steady state performance of the SMC
with a proportional-integral-derivative (PID) controller using the dynamic
cardiovascular (CV) numerical model. The hypothesis is that the preload-based
SMC is superior to the PID controller with regards to speed of response and
robustness to noisy feedback signals.
iv. The final objective of this dissertation is to implement the preload-based
controller in vitro using a mock circulatory loop (MCL) to characterize the flow
sensitivity of the controllers to preload, and to compare its performance with the
constant speed controller. Three different test scenarios were implemented, which
include moderate exercise, 700 head-up-tilt (HUT), and a major reduction in LV
contractility (LVC).
1.3 Thesis layout
This thesis is organized as follows. Following the introduction, the second chapter
reviews the relevance of this study within the current literatures. Chapter 3 investigates
the response of the IRBP-assisted patients to exercise and head-up tilt (HUT), as well as
the effect of alterations in the model parameter values on this response, using validated
numerical models. Furthermore, we comparatively evaluated the performance of a
number of previously proposed physiologically responsive controllers with regard to their
ability to increase cardiac output during exercise while maintaining circulatory stability
upon head up tilt (HUT). Chapter 4 outlines the functionality and performance of the
preload-based Frank-Starling controller using a validated numerical model. All tests
showed that the preload-based controller outperformed previously designed Starling-like
controller based on pulsatility and constant speed operation. Chapter 5 discusses a sliding
mode implementation of the preload-based control that could warrants a fast response and
Univers
ity of
Mala
ya

5
robustness of the controller in the presence of noisy feedback signal. In chapter 6, the
performance of the preload-based control and fixed speed mode undergoing various
physiological changes was compared in vitro using a MCL. The preload flow sensitivity
of these controllers was also investigated. Finally, Chapter 7 concludes the present
dissertation with suggestions for future work.
Univers
ity of
Mala
ya

6
CHAPTER 2: LITERATURE REVIEW
2.1 Introduction
The successful implementation of a physiological LVAD control system requires
sufficient knowledge of the CV system (CVS), and therefore this chapter delivers the
reader essential information to understanding the topic. It includes a brief but concrete
description of the physiology and anatomy of the human heart and CVS, HF, its
occurrence and coverage, and treatment of HF using LVADs.
2.2 The Human Circulatory System, Anatomy and Physiology
The CVS includes the heart, the blood, and the lymphatic vessels. A C Guyton and Hall
(2005) explains that the heart is composed of the left and right sides (Figure 2.1). The left
side undertakes the duty of delivering oxygenated blood to all tissues in the body through
the systemic circulation. On the other hand, the right side carries deoxygenated blood to
the lungs through the pulmonary circulation. Each side of the heart consists of an atrium
and a ventricle that connects with a one-way valve. The ventricles produced most force
required to push blood via the circulatory system. The atria, on the other hand, functions
as a primer pump to help ventricular filling.
Figure 2.1: Anatomy of the human heart (A C Guyton & Hall, 2005).
Univers
ity of
Mala
ya

7
Figure 2.2 shows the human circulatory system. Deoxygenated blood travels from the
systemic venous circulation (SVC) into the right atrium (RA) through the superior and
inferior vena cava. During diastole, which involves relaxation of the ventricular muscle,
the deoxygenated blood flows into the right ventricle (RV) via the tricuspid valve. As the
RV muscle contracts, it pumps the deoxygenized blood into the pulmonary artery via the
pulmonary valve. While passing through the pulmonary circulation in the lung, the blood
is oxygenated. The oxygenated blood travels into the left atrium (LA), where it then
moves into the LV during the diastolic phase via the mitral valve. During systole, which
involves contraction of the ventricular muscle, the oxygenated blood is pumped into the
aorta through the aortic valve, and travels along the systemic circulation. The blood then
returns to the RA through the vena cava and the cycle repeats again.
Figure 2.2: Human Circulatory System (RevisionWorld, 2015).
Univers
ity of
Mala
ya

8
2.3 Cardiac Cycle
In each heartbeat, the cardiac muscles perform a period of contraction (systole) and
relaxation (diastole). During diastole, the ventricles are filled with blood, whilst this blood
is then ejected during systole. One cardiac cycle includes one contraction and one
relaxation period. Typical healthy LV, LA, and aortic pressures during different cardiac
phases in a cardiac cycle are shown in Figure 2.3.
Figure 2.3: Aortic, left atrial and left ventricular pressure waveforms during a cardiac cycle (A C Guyton
& Hall, 2005).
The cardiac cycle is divided into four distinctive phases (A C Guyton & Hall, 2005).
Phase I begins with ventricular filling. During this phase, venous blood continuously
flows from the atria into the ventricles through the atrioventricular valves, until the
intraventricular pressure exceeds that of the atrial pressure. The ventricular filling phase
is composed of three distinct stages. At the beginning (rapid filling), the pressure
difference between the atrium and the ventricle causes the ventricles to be rapidly filled
with blood. As this pressure difference gradually decreases, the heart enters into the next
stage (diastasis), where the returning venous blood fills the ventricle at a much lower
pace. Near the end of the ventricular diastolic phase, atrial systole occurs, where the atria
contracts to pump more blood into the ventricle despite a near zero pressure difference
Univers
ity of
Mala
ya
9
between the atria and the ventricles. The ventricular muscle relaxation in the first phase
results in an increment in the ventricular volume and a small increase in the
intraventricular pressure. The end-diastolic pressure-volume relationship (EDPVR) is
commonly used to describe the relationship between the intraventricular volume and
pressure during end diastole.
Isovolumetric contraction forms the beginning of the systolic phase. During this stage,
the contraction of the ventricular muscle results in a drastic increment in the intravascular
pressure. However, the ventricular volume remains unchanged as the one-way
atrioventricular valves are closed, preventing backflow into the atria. Meanwhile, the
aortic and pulmonary (semilunar) valves remain closed as the intraventricular pressure is
less than the aortic pressure. Although this phase lasts only about 0.02 s to 0.03 s, it builds
up enough pressure energy to open the semilunar valves.
The ejection stage commences when the intraventricular pressure exceeds that of the
arterial pressure, allowing blood to be ejected from the LV into the aorta, and from the
RV into the pulmonary artery. Upon opening of the semilunar valves, the intraventricular
pressure continues to increase as the ventricles are still contracting. Eventually, the
intraventricular pressures start to decrease as more blood is ejected from the ventricle.
When the intraventricular pressure falls below that of the aortic pressure, the ejection
phase ends. The end-systolic pressure-volume relationship (ESPVR) is typically used to
describe the relationship between the intraventricular pressure and volume during end
systole.
This is followed by the isovolumic relaxation phase, where the ventricular muscle relaxes,
causing the intraventricular pressure to drop rapidly despite a constant volume. As the
intraventricular pressure drops below that of the aortic pressure, the pulmonary and aortic
Univers
ity of
Mala
ya

10
valves close. By the end of this phase, the intraventricular pressure falls below that of the
atria, causing rapid filling of the blood into the ventricle, and the cardiac cycle repeats.
2.4 The Frank-Starling Law
According to the Frank-Starling mechanism (A C Guyton & Hall, 2005), the strength of
the ventricular muscle contraction during systole is proportional to the volume of the
blood (preload) returning to the ventricle during diastole. This mechanism indicates that
an increment in the end diastolic volume resulting from an increase in the venous return
causes the cardiac muscle fibers to pump stronger than normal. In the cellular level, this
indicates that a higher stretching level of the myosin and actin filaments during end
diastole results in an optimal force generation capability.
The Frank-Starling mechanism ascertains that the heart pumps all blood it receives from
the veins (A C Guyton & Hall, 2005). Relying on this mechanism, the cardiac output
(CO) is dependent on the interventricular end-diastolic pressure (preload), as shown in
Figure2.4, referred to as preload sensitivity.
Figure 2.4: (A) Cardiac output curves, which show the relationship between left and right ventricular
output and preload because of the Frank-Starling mechanism. (B) The sensitivity of cardiac output to
preload and the maximum cardiac output increases with sympathetic nervous stimulation of the heart, and
decrease with heart failure (A C Guyton & Hall, 2005).
(A) (B)
Univers
ity of
Mala
ya

11
It is worth noting that no single curve could demonstrate the relationship between CO and
the preload across various physiological conditions. Instead, as shown in Figure 2.4, the
sensitivity of CO to preload and the maximum cardiac output increases with sympathetic
nervous stimulation of the heart, and decreases with heart failure.
2.5 Heart Failure
Heart failure (HF) is referred to as a condition that thwarts the heart from pumping
sufficient amount of blood into the peripheral tissues and organs, preventing them from
getting adequate oxygen (A C Guyton & Hall, 2005). Myocardial infarction, coronary
artery disease, chronic hypertension, valve disease, and idiopathic cardiomyopathy are
some common causes of HF (Klabunde, 2011). HF affects the pumping ability of the
heart, resulting in a degraded preload sensitivity, pulmonary congestion, and a
deteriorated maximum cardiac output.
Insufficient CO indicates that the oxygen supply to vital organs such as kidney, liver, and
brain reduces. Consequently, the body activates the sympathetic nervous stimulation
system in an attempt to maintain cardiac output above 5 L/min. This involves an increase
in heart rate and contractility, as well as an increase in the venous tone to increase LV
preload, which would subsequently increase CO via the Frank-Starling mechanism (A C
Guyton & Hall, 2005).
This compensatory mechanism, though aimed to increase cardiac output, leads to a
substantial increment in the preload. Although the patients may not exhibit symptoms of
HF other than an increase in left atrial (LA) pressure (LAP) and right atrial (RA) pressure
(RAP) at rest, they experience degradation in maximum cardiac output and thus exercise
capacity, which affects their quality of life. Therefore, appropriate treatment is essential
to increase the quality of life for these patients. HF can be treated by surgery, or using
Univers
ity of
Mala
ya

12
pharmacological treatment. In addition, implantable rotary blood pumps are a practical,
long-term option for supporting heart failure patients awaiting donor hearts.
2.6 Heart Failure Mechanical Therapy
Due to the limited availability of donor organs and limitations in drug therapies, various
types of VADs have been developed, including the pulsatile VADs and the continuous
flow VADs. With the advancement of the VAD technology, they can now be used as a
bridge to recovery, bridge to transplant or permanent support (A.-H. H. AlOmari et al.,
2013).
2.6.1 Generations of VADs
To date, three VAD generations have been developed and are classified according to their
mode of operation (Yamane, 2002). Figure 2.5 shows examples of these three different
generations.
Figure 2.5: Examples of first, second and third generation ventricular assist devices. (A) PVAD
(Thoratec Corporation, Pleasanton, CA, USA). (B) HeartMate II (Thoratec Corporation, Pleasanton, CA,
USA). (C) HVAD (HeartWare Inc., Massachusetts, USA) (M. C. Stevens, 2014).
The first generation, referred to as the pulsatile pumps, have unidirectional artificial
valves and diaphragms surrounding the blood chambers. They eject flows at rates
typically between 80 and 100 beats per minute, producing pulsatile flow like the natural
heart (D. Timms, 2011). Although the pulsatile VADs have been the main emphasis for
research in artificial heart pumps from 1960s to 1980s (Yamane, 2002), they provide
limited support duration in spite of the improvement in survival rates. The mechanical
(A) (B) (C)
Univers
ity of
Mala
ya

13
properties of their artificial valves and diaphragm limited their working life to 3~4 years.
Furthermore, pulsatile VADs were large because the pulsation require driving elements
in the pump (D. Timms, 2011).
The continuous flow pumps are the second generation VADs, improved to cover
aforementioned shortage of the pulsatile pumps. These pumps are either centrifugal or
axial pumps, which pump blood continuously. DeBakey pump (MicroMed Inc.) and
HeartMate II (Thoratec Corp.) are the most commonly used continuous flow pumps. The
impellers of these pumps are supported by mechanical bearings of several different
designs. The drawback of these VADs are their vulnerability to bearing wearing and
thrombosis around the bearing seal (Koh, Chan, Ng, & Li, 1999).
The magnetically levitated continuous flow pumps form the latest generation of the
VADs. Incor VAD (Berlin Heart AG, Germany), VentrAssist (Ventracor Ltd., Sydney,
Australia), and HeartQuest VAD (Medquest Inc.) are few magnetically suspended
continuous flow pumps which have gone through clinical trials and animal tests (Lee et
al., 2011). Compared to the second generation, the impeller is levitated by magnetic forces
without any mechanical contact. Without the presence of the bearing, thrombosis around
the bearing seal can be avoided. Moreover, their mechanical durability enables them to
be used as long-term destination therapy.
2.6.2 Physiological Control of VADs
To date, most LVADs operate using constant speed control (Akimoto et al., 1999), which
is insensitive to changes in the metabolic requirements of patients in their daily life
course. Low preload sensitivity of rotary LVADs under constant speed operational mode
increases the over-pumping (suction) or under-pumping risk, which can cause pulmonary
congestion, renal insufficiency and other problems (Salamonsen et al., 2013). Therefore,
Univers
ity of
Mala
ya

14
physiological control of LVAD is one of the most important concerns in providing a long-
term support.
Over the years, many researches have been conducted to develop physiological control
methods that could accommodate to the body demand. Any physiological LVAD control
should fulfill three criteria (Boston, Antaki, & Simaan, 2003) as follows: (i) provide
sufficient cardiac output to meet metabolic requirements, (ii) maintain systemic arterial
pressure within a physiological range to maintain sufficient liver/kidney perfusion and to
avoid over-perfusion or under-perfusion, and (iii) maintain left atrial pressure within a
normal physiological range to avoid pulmonary congestion and suction (Boston et al.,
2003). In addition, it is advisable to maintain positive left ventricular outflow for a portion
of the cardiac cycle (during systole) and to avoid regurgitated blood from the aorta to the
left ventricle in diastole (Wu, Allaire, Tao, & Olsen, 2007).
To date, more than 30 different pump control algorithms have been designed (A.-H. H.
AlOmari et al., 2013), aiming to dynamically adapt to varying metabolic demand of the
HF patients. These method include differential pressure control (G. Giridharan, Pantalos,
Koenig, Gillars, & Skliar, 2005; Waters et al., 1999), flow control (Smith, Goodin, Fu, &
Xu, 1999), pulsatility index (Choi, Antaki, Boston, & Thomas, 2001), and pulsatility ratio
control (Salamonsen et al., 2012).
Waters et al. (1999) proposed a controller that used the pump head differential pressure
as a feedback signal. Although the results of their numerical simulation demonstrated that
the developed controller was able to maintain the head pressure, the pump flow and pump
speed went beyond the normal operating levels whenever the systemic resistance
changed. G. Giridharan et al. (2005) proposed another control that maintained a constant
average pressure difference between the left ventricle and the aorta. Their hypothesis was
that this provided sufficient physiological perfusion to the body over a wide range of
Univers
ity of
Mala
ya

15
physical activities and clinical cardiac conditions. However, a prominent drawback of
their controllers was that the estimation accuracy of the feedback signal (i.e. differential
pressure) was only assessed under a steady state condition but not during transient
changes. Furthermore, maintaining a constant pump differential pressure may increase
the risk of suction under low systemic vascular resistance or blood volume conditions,
while producing lower than optimal cardiac output under higher blood volume conditions
(Einly Lim et al., 2012a).
Smith et al. (1999) suggested that pump flow is a more relevant physiological parameter
for the control of an IRBP as compared to pump differential pressure. The main
disadvantage of this control strategy is the difficulty in selecting an optimal pump flow
level, as this varies with different hemodynamic conditions.
Fu and Xu (2000) developed a sensor-less fuzzy logic IRBP controller that regulated the
LVAD flow to track a set value by applying the fuzzy to adjust the motor input. They
estimated the motor flow using the electrical motor current and speed whilst the desired
flow set point was set regarding the heart rate. The major limitation of their study was
that the assumed pump flow is proportional to the heart rate besides they ignored the heart
contractility and peripheral circulation on the desired flow rate effects (Arthur C Guyton
& Hall, 1996).
Another commonly used control strategy is the constant pulsatility index control,
developed based on the close relationship between the pump flow or differential pressure
pulsatility (PI) and LV filling pressure (Choi et al., 2001). However, due to the
dependency of PI on the heart contractility, afterload (the pressure in the wall of the left
ventricle during ejection), and preload, controlling PI to a fixed set point may fail to avoid
adverse pumping states such as suction during sudden perturbations of the circulatory
system (Arndt, Nüsser, Graichen, Müller, & Lampe, 2008).
Univers
ity of
Mala
ya

16
Salamonsen et al. (2012) proposed a linear Starling-like controller, which emulates the
response of the natural LV to changes in preload. However, the use of pump flow
pulsatility as the feedback variable to reflect changes in preload suffers from its
dependency on pump characteristics, causing it to fail during various circumstances
(Mansouri, Salamonsen, Lim, Akmeliawati, & Lovell, 2015).
In summary, most of the previously proposed controllers have shown various functional
limitations. Therefore, the development of an adaptive and robust controller that could
emulate the Frank-Starling mechanism of the heart is required.
Univers
ity of
Mala
ya

17
CHAPTER 3: FIXED SET POINT BLOOD PUMP CONTROLLERS
3.1 Introduction
With the rapid advancement of IRBP technology, there is increasing evidence of
successful experience for prolonged periods of implantation in patients (Park et al., 2005).
In a long-term unsupervised environment, as patients go through different activity levels
from sleep to exercise, under-pumping or over-pumping may occur, leading to inefficient
operating conditions as well as unacceptable risks such as impairment of right heart
function or collapse of the left ventricle (Vollkron et al., 2005). This is further
complicated by the severely reduced sensitivity of IRBPs to preload as compared to the
native heart (Mason, Hilton, & Salamonsen, 2008), as well as the residual ventricular
function.
The native exercise response of an IRBP-assisted patient, as well as the inherent
adaptability of an IRBP to exercise, has attracted considerable attention from researchers
over the years (Akimoto et al., 1999; Brassard et al., 2011; Jacquet et al., 2011; Mancini
et al., 1998; Salamonsen et al., 2013). Although it has been well established that there is
a spontaneous increase in cardiac output in these patients during exercise under constant
pump speed (Akimoto et al., 1999; Jacquet et al., 2011; Salamonsen et al., 2013), the
underlying mechanisms remain unclear. Based on the separate analysis of experimentally
obtained pump flow during systole and diastole, Akimoto et al. (1999) proposed that
increases in heart rate and subsequently time spent in systole are the dominant mechanism
leading to an increase in mean pump flow during exercise.
However, contradictory data by K Muthiah et al. (2012) indicated that pacemaker-induced
increases in heart rate in resting patients did not significantly alter pump flow. Similarly,
in a study conducted on ten IRBP-implanted patients undergoing bicycle exercise, Jacquet
et al. (2011) could not correlate the change in pump flow with either heart rate or changes
in heart rate. To the contrary, they demonstrated that the native heart plays a significant
Univers
ity of
Mala
ya

18
role in flow adaptation, with total rise observed in the cardiac output during exercise
mainly contributed by flow through the aortic valve. Using multiple linear regression of
pump flow on factors considered to underlie the spontaneous increases in pump flow
during exercise, Salamonsen et al. (2013) revealed that this was associated with increases
in heart rate, pressure gradient across the left ventricle and right atrial pressure.
While exercise leads to an increase in venous return and consequently cardiac output,
transition from lying to standing imposes an opposite effect, with anecdotal reports
suggest some patients feeling faint during a change in posture. Despite the concern of
suction risk, limited studies have looked into the effect of postural change on
hemodynamics in patients assisted with an IRBP. To date, we are only aware of one
clinical study by K. Muthiah et al. (2013), which demonstrated a 10% reduction in pump
flow with 600 head up tilt, without any occurrence of suction events. Although both
clinical and experimental studies have been very useful in providing insights into
mechanisms underlying the observed responses in IRBP-assisted patients to exercise and
postural changes, they are inconclusive at present due to various potentially confounding
factors. Furthermore, limited measurements could be obtained from the patients due to
the complexity of the experimental procedures. For instance, most studies have not
measured native cardiac output (Akimoto et al., 1999; Mancini et al., 1998) and left
ventricular end diastolic pressure (Akimoto et al., 1999; Mancini et al., 1998), which
reflects venous return.
In order to maximize the quality of life of the implant recipients in a-long term
unsupervised environment, various physiological control strategies which attempt to
immediately adapt to varying cardiac demand and clinical states of the heart have been
proposed (Arndt et al., 2008; M. A. Bakouri et al., 2014; Choi et al., 2001; Nicholas R.
Gaddum et al., 2014; G. A. Giridharan, Pantalos, Gillars, Koenig, & Skliar, 2004; G. A.
Giridharan & Skliar, 2006; Wu et al., 2003; Wu et al., 2004). These include the pulsatility
Univers
ity of
Mala
ya

19
index (PI) (Choi et al., 2001; Schima et al., 2006), gradient of PI with respect to pump
speed (GPI) (Arndt et al., 2008), differential pump pressure (G. A. Giridharan et al.,
2004), aortic pressure (Wu et al., 2003; Wu et al., 2004), and the more recently proposed
linear Starling-like controller (M. A. Bakouri et al., 2014; Nicholas R. Gaddum et al.,
2014; Salamonsen et al., 2013). Despite the extensive efforts, none of these controllers
have gained clinical acceptance in commercial devices due to their lack of confidence by
clinicians (Salamonsen et al., 2012).
Moreover, with the possible exception of the automatic closed-loop controller proposed
by Vollkron and Schima et al. (Schima et al., 2006; Vollkron et al., 2005), the
performance of these controllers have not been evaluated in patients. Most controllers
were evaluated using either a numerical model (Arndt et al., 2008; M. A. Bakouri et al.,
2014; Choi et al., 2001; G. A. Giridharan & Skliar, 2006; Wu et al., 2003) or an in vitro
mock circulatory loop (Choi et al., 2001; Nicholas R. Gaddum et al., 2014; G. A.
Giridharan et al., 2004; Wu et al., 2004), with their performance compared against a
constant speed controller. The major drawback of these studies is that the simulation
environment was oversimplified and therefore could not accurately reflect physiological
responses in the IRBP-assisted patients during various perturbations. For example, reflex
mechanisms, which play a major role in determining the response of patients to exercise
and postural changes, were not included in the simulation models (Arndt et al., 2008; M.
A. Bakouri et al., 2014; Choi et al., 2001; Nicholas R. Gaddum et al., 2014; G. A.
Giridharan et al., 2004; G. A. Giridharan & Skliar, 2006; Wu et al., 2003; Wu et al., 2004).
The major motivation for the present study was to investigate the response of the IRBP-
assisted patients to exercise and HUT, using validated heart pump interaction models
which takes into account various important features such as the arterial and
cardiopulmonary reflexes, local metabolic vasodilation in the active muscles, the auto-
regulation mechanism in the lower body, the muscle pump, as well as diastolic ventricular
Univers
ity of
Mala
ya
20
interaction through the pericardium. Furthermore, the individual effect of parameters
associated with heart failure, including LV and right ventricular contractility, baseline
total blood volume, reflex sensitivity, heart rate, as well as pump speed on exercise
capacity and HUT response in these patients were also assessed.
Using the numerical models, we comparatively evaluate the performance of a number of
previously proposed physiologically responsive controllers, including constant speed,
constant flow pulsatility index (PI) (Choi et al., 2001; Schima et al., 2006), constant
average pressure difference between the aorta and the left atrium (dP ), constant average
differential pump pressure ( dPpump ) (G. A. Giridharan et al., 2004), constant ratio
between mean pump flow and pump flow pulsatility (ratioPI ) or linear Starling-like
control (M. A. Bakouri et al., 2014; Nicholas R. Gaddum et al., 2014; Salamonsen et al.,
2012), and constant mean left atrial pressure (Pla ) control.
3.2 Materials and Methods
3.2.1 Model Description
The basic structure of the heart-pump interaction model was adapted from our previous
model (Einly Lim, 2009; Einly Lim et al., 2010; Einly Lim et al., 2012a, 2012b), which
consists of the left and right sides of the heart, direct ventricular interaction via the inter-
ventricular septum and pericardium, the pulmonary and systemic circulations as well as
the left ventricular assist device (Figure 3.1). The LVAD component includes the
description of the IRBPblue (VentrAssistTM, which operates between 1600 and 3000 rpm),
as well as the inlet and outlet cannula. The duration of the systolic periods were assumed
to vary linearly with heart rate (Ursino, 1998). A detailed description of the model can be
obtained from (Einly Lim et al., 2012a, 2012b).
Univers
ity of
Mala
ya

21
Figure 3.1: The lumped parameter model of VentrassistTM LVAD and the cardiovascular system (Einly Lim et al., 2010).
P, pressures; R, resistances; E, elastances (=1/compliances); L, inertances; D, diodes. The model consists of two main components: (1) the CVS, which is further divided into ten
compartments (la, left atrium; lv, left ventricle, ao, aorta; sa, systemic peripheral vessels, including the arteries and capillaries; sv, systemic veins, including small and large veins; vc,
vena cava; ra, right atrium; rv, right ventricle; pa, pulmonary peripheral vessels, including pulmonary arteries and capillaries; pu, pulmonary veins and (2) the LVAD, which includes
the rotary blood pump and the cannula (Rin and Rout , inlet and outlet cannula resistances; Lin and Lout , inlet and outlet cannula inertances; Rsuc , suction resistance). The intrathoracic
pressure, Pthor,1 and Pthor,2 were assigned the same values (–4 mmHg) during closed-chest simulated conditions.
Univers
ity of
Mala
ya

22
3.2.2 Exercise Model
A model previously developed and validated by E Magosso and Ursino (2002), able to
simulate both the steady state and transient cardiorespiratory response of healthy subjects
at various levels of aerobic exercise intensities, was integrated into our heart-pump
interaction model. Among features adopted included: (i) a division of the systemic
circulation into 6 compartments, i.e. splanchnic, extrasplanchnic, resting muscles, active
muscles, cerebral and coronary circulations; (ii) a functional description of the local
metabolic vasodilation in active muscles; (iii) effect of the muscle pump on venous return;
(iv) the arterial baroreflex and the lung inflation reflex, which consist of the afferent
pathways, the efferent sympathetic and parasympathetic activities, and the responses of
several distinct effectors, including the heart contractilities, peripheral resistances,
unstressed volumes and heart rate; and (v) the action of the central command on the
efferent sympathetic and parasympathetic activities.
The only input for the model is the relative intensity of the aerobic exercise, which has a
direct effect on the vasodilatory mechanism as well as the sympathetic/parasympathetic
systems through the direct action of the central command. In the present study, relative
intensity of 0.6 was chosen to reproduce experimentally observed changes in the
hemodynamic variables in IRBP-assisted patients during maximal exercise (Brassard et
al., 2011; Jacquet et al., 2011; Mancini et al., 1998; Salamonsen et al., 2013).
3.2.3 HUT Model
To investigate the response of the IRBP-assisted patients to HUT, a cardiovascular system
model previously developed by our research group (Einly Lim et al., 2013) was integrated
into our heart-pump interaction model. The systemic circulation was divided into several
parallel branches, i.e. cerebral, upper body, coronary, splanchnic, renal, and lower body,
to account for the differences in heights of each compartment from the hydrostatic
Univers
ity of
Mala
ya

23
indifference point (HIP) located at the heart level, as well as different impacts of
regulatory mechanisms on these compartments. Furthermore, a number of important
features were included: (i) separate effects of arterial and cardiopulmonary reflexes; and
(ii) the autoregulation mechanism in the lower body. The fitted model has been shown to
compare favorably with our experimental measurements and published literature at a
range of tilt angles, in terms of both global and regional hemodynamic variables, under
both healthy and congestive heart failure conditions.
3.2.4 Simulation Protocols
The models were implemented using the Simulink toolbox in MATLAB (The
Mathworks, Inc., Natick, MA, USA). Initial software simulations were performed with
the LVAD removed from the model in order to demonstrate the validity of the CVS model
alone during exercise and HUT. As described in a previous study (Einly Lim et al., 2013),
we simulated a heart failure scenario (NYHA Class II & III) by carefully modifying the
parameters associated with heart failure to ensure that realistic simulation in terms of
mean systemic arterial pressure, mean left atrial pressure, mean pulmonary arterial
pressure, mean central venous pressure, heart rate, stroke volume and cardiac output was
achieved. The baroreflex response was attenuated in both simulations by modifying the
static characteristics of the effectors (Elisa Magosso, Cavalcanti, & Ursino, 2002), as
congestive heart failure patients were known to have markedly depressed baroreflex
function (Eckberg & Sleight, 1992). Subsequent simulations were performed with the
LVAD model included, and these were used to investigate the response of the IRBP-
assisted patients to exercise and HUT.
The resulting simulated key haemodynamic variables at rest and supine position, as well
as their changes with respect to exercise and 700 HUT at a constant pump operating speed
(i.e. 2100 rpm) are listed in Table 3.1 and Table 3.2, where the values are seen to agree
Univers
ity of
Mala
ya
24
with the published data, except for a minor deviation in the mean pump flow. Considering
the strong dependency of pump flow with pump operating speed, and the fact that most
studies based their reported values on estimations rather than real measurements, we have
allowed a 15% tolerance in the simulated pump flow value at baseline (both rest and
supine) from that reported in the published literature during our model fitting process.
Furthermore, in a study comparing the accuracy of the HeartMate II flow estimator with
that measured by an ultrasonic flow probe, a difference of 15-20% has been reported
(Markham et al., 2013).
Next, we varied parameters associated with heart failure, including LV and RV
contractility (50% decrease), baseline total blood volume (600 mL increase), reflex
sensitivity (by removing the reflex control mechanism), as well as pump speed (400 rpm
increase), one at a time, and observed the resulting changes in the hemodynamic
variables, to evaluate the individual effect of these parameters on the exercise capacity
and HUT response in the IRBP-assisted patients. Furthermore, six separate control
strategies were compared in the present study: constant speed, constant average PI (3.1),
constant average pump head pressure (3.2), constant average pressure difference between
the aorta and the left atrium (3.3), constant average ratioPI controller (3.4), and constant
average left atrial pressure controller.
PI = (QPMAX− QPMIN
) (3.1)
dPpump = (PPIN
− PPOUT) (3.2)
dP = (PSA − PLA ) (3.3)
ratioPI = θ =QP
PI (3.4)
To compare these control strategies, the target values for all controllers were chosen to
coincide with the corresponding values obtained at a fixed operating pump speed of 2100
Univers
ity of
Mala
ya

25
rpm during the resting stage. This particular operating condition was selected as it most
closely reproduced clinically reported values for key hemodynamic variables in IRBP-
assisted patients under normal resting condition (Brassard et al., 2011; Jacquet et al.,
2011; Mancini et al., 1998; Salamonsen et al., 2013). All the control modes were then
implemented separately with a proportional-integral-derivative controller (Figure 3.2),
which adjusted the pulse-width-modulation (PWM) signal to generate the desired set
point. The proportional gains (KP) and time constants (τi) for the proportional-integral
type controllers were selected to yield minimal overshoot and rise time in the target
variables for the respective controllers. Since the present study focuses on the steady state
response of the various controllers to exercise and HUT rather than transient changes, the
values chosen for KP and τi has no effect on the simulation results at steady state.
Univers
ity of
Mala
ya

26
Figure 3.2: Block diagram of the PID controller for closed loop studies
Univers
ity of
Mala
ya
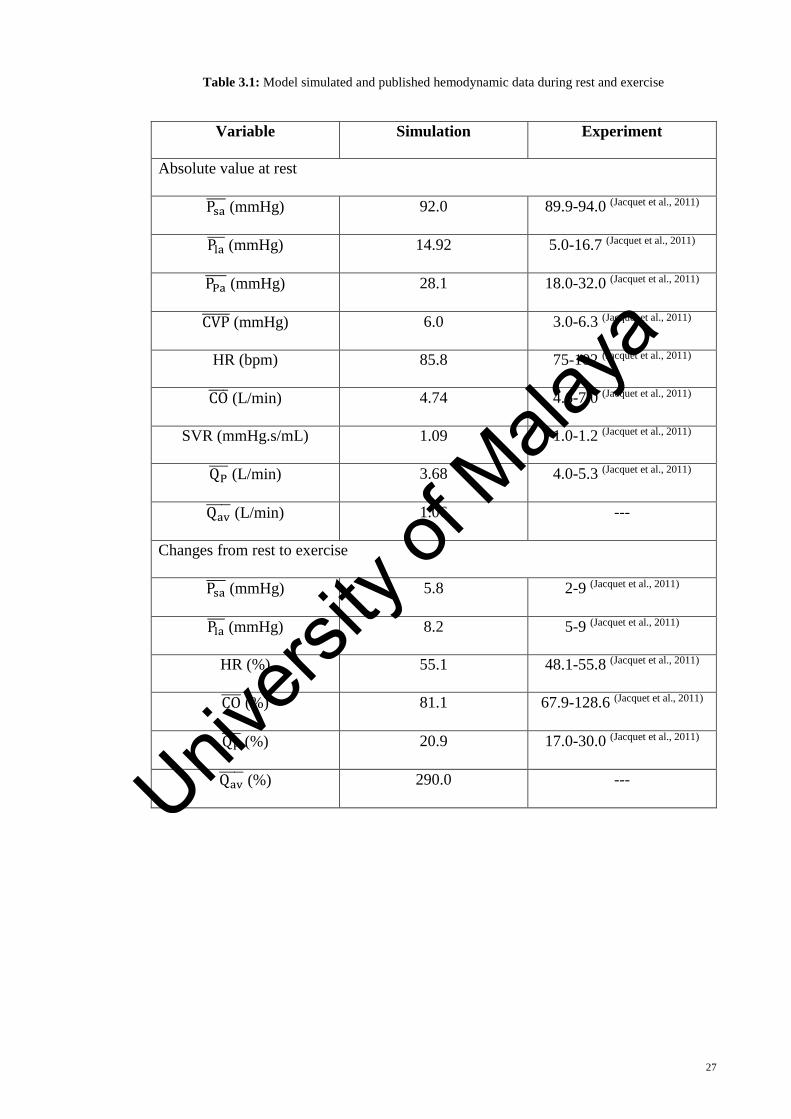
27
Table 3.1: Model simulated and published hemodynamic data during rest and exercise
Variable Simulation Experiment
Absolute value at rest
Psa (mmHg) 92.0 89.9-94.0 (Jacquet et al., 2011)
Pla (mmHg) 14.92 5.0-16.7 (Jacquet et al., 2011)
PPa (mmHg) 28.1 18.0-32.0 (Jacquet et al., 2011)
CVP (mmHg) 6.0 3.0-6.3 (Jacquet et al., 2011)
HR (bpm) 85.8 75-102 (Jacquet et al., 2011)
CO (L/min) 4.74 4.6-7.0 (Jacquet et al., 2011)
SVR (mmHg.s/mL) 1.09 1.0-1.2 (Jacquet et al., 2011)
QP (L/min) 3.68 4.0-5.3 (Jacquet et al., 2011)
Qav (L/min) 1.06 ---
Changes from rest to exercise
Psa (mmHg) 5.8 2-9 (Jacquet et al., 2011)
Pla (mmHg) 8.2 5-9 (Jacquet et al., 2011)
HR (%) 55.1 48.1-55.8 (Jacquet et al., 2011)
CO (%) 81.1 67.9-128.6 (Jacquet et al., 2011)
QP (%) 20.9 17.0-30.0 (Jacquet et al., 2011)
Qav (%) 290.0 ---
Univers
ity of
Mala
ya

28
Table 3.2: Model simulated and published hemodynamic data during supine and 700 HUT
Variable Simulation Experiment
Absolute value at supine positions
Psa (mmHg) 91.8 93.0-94.0 (Jacquet et al., 2011)
Pla (mmHg) 14.8 13.0-16.7 (Jacquet et al., 2011)
PPa (mmHg) 27.7 20.0-27.3 (Jacquet et al., 2011)
CVP (mmHg) 6.7 6.0-6.3 (Jacquet et al., 2011)
HR (bpm) 85.5 75-91 (Jacquet et al., 2011)
CO (L/min) 4.6 4.6-5.3 (Jacquet et al., 2011)
SVR (mmHg.s/mL) 1.11 1.0-1.2 (Jacquet et al., 2011)
QP (L/min) 3.94 4.5-5.3 (Jacquet et al., 2011)
Qav (L/min) 0.66 ---
Changes from rest to 700 HUT
Psa (mmHg) 1.6 0-9 (K Muthiah et al., 2012)
Pla (mmHg) -4.5 ---
HR (%) 9.0 5.8 (Markham et al., 2013)
CO (%) -17.2 ---
QP (%) -11.2 -12.0(K Muthiah et al., 2012)
Qav (%) -60.0 ---
3.3 Results
3.3.1 Comparison with Published Experimental Observations
Comparison between simulation results and published findings concerning exercise and
HUT response at a constant operating speed of 2100 rpm were presented in Table 3.1 and
Table 3.2. There was a high degree of correlation between the model and experimental
Univers
ity of
Mala
ya

29
data about their absolute values at rest and supine position, as well as their respective
changes during exercise and 700 HUT. As observed experimentally (Brassard et al., 2011;
Jacquet et al., 2011; Mancini et al., 1998; Salamonsen et al., 2013), mean systemic arterial
pressure, mean left atrial pressure, heart rate, mean cardiac output, mean pump flow and
mean aortic valve flow increased spontaneously during exercise without variations in
pump speed. The increase in mean cardiac output during exercise was mainly contributed
by an increase in mean aortic valve flow through an increase in the LV end diastolic
volume, i.e. LV preload. Consistent with published findings (Akimoto et al., 1999;
Jacquet et al., 2011; Salamonsen et al., 2013), an increase in mean pump flow was also
observed, however at a much lesser percentage change compared to that of the mean
aortic valve flow. To the contrary, mean cardiac output, mean pump flow, and mean aortic
valve flow showed a reduction during HUT, with their percentage changes comparable to
that reported clinically (K Muthiah et al., 2012). Despite a decrease in mean left atrial
pressure, mean systemic arterial pressure showed a minor increase during HUT.
3.3.2 Sensitivity Analysis: Effects of Individual Parameters on Exercise
Table 3.3 shows the effects of modifying individual factors associated with heart failure,
including LV contractility (Elv), RV contractility (Erv), total blood volume (Vt) and
desensitized reflex response (β), as well as pump speed (ω) on key variables during rest
and exercise, using model settings described previously as baseline condition. In order to
investigate the effect of increasing heart rate alone during exercise, an additional
simulation was performed by removing the response of all effectors except that involving
heart rate (βHR).
Univers
ity of
Mala
ya

30
Table 3.3: Effect of individual parameter on key hemodynamic variables during rest and exercise
Variable Baseline Elv Erv Vt ω β βHR
Psa (mmHg) 92.0 83.1 89.2 95.6 100.1 92.0 92.0
Pla (mmHg) 14.9 19.3 10.5 20.5 10.8 14.9 14.9
CO (L/min) 4.7 4.1 4.4 4.9 5.3 4.7 4.7
QP (L/min) 1.1 0.0 0.9 1.1 0.0 1.1 1.1
Qav (L/min) 3.7 4.1 3.6 3.8 5.3 3.7 3.7
dP (mmHg) 54.2 51.8 55.2 53.3 69.5 54.2 54.2
dPpump
(mmHg)
84.8 85.7 84.9 84.7 118.8 84.8 84.8
PIQp (L/min) 3.9 2.1 4.0 3.7 3.1 3.9 3.9
ratioPI 0.95 1.9 0.9 1.0 1.7 1.0 1.0
Changes from rest to exercise
Psa (mmHg) 5.8 -0.8 5.4 5.1 0.4 -24.0 -12.5
Pla (mmHg) 8.2 13.0 6.5 7.7 10.4 -4.5 -0.3
CO (%) 81.1 71.7 81.0 79.2 66.2 38.5 63.5
Qav (%) 289.87 N/A 334.4 290.9 N/A 68.7 176.8
QP (%) 20.9 29.2 21.3 19.1 19.6 29.84 30.7
dP (%) -18.6 -38.4 -17.6 -18.6 -29.6 -26.6 -28.2
dPpump (%) -2.47 -6.4 -2.2 -2.5 -5.8 -3.0 -3.5
PIQp (%) -10.88 -0.1 -9.7 9.7 -2.6 -20.7 -25.0
ratioPI (%) 35.64 29.3 34.2 31.9 22.7 87.4 74.1
Columns 3 to 8 refer to the simulation repeated (using baseline parameters) by individually modifying the
following quantities to that used for the baseline scenario.
Univers
ity of
Mala
ya
31
Decreasing LV and RV contractility caused a fall in resting mean systemic arterial
pressure, mean cardiac output and mean aortic valve flow, but produced directionally
opposite changes in mean left atrial pressure and mean pump flow. On the other hand,
resting mean systemic arterial pressure, mean cardiac output and mean pump flow
increased substantially with increasing total blood volume and mean pump speed. Due to
a significant rise in mean pump flow with increasing mean pump speed, mean aortic valve
flow fell to 0 L/min and as a result, IRBP contributed completely to the total cardiac
output. Out of all six simulated conditions, mean pump speed has the most significant
effect on resting dP and dPpump followed by LV contractility, while RV contractility and
total blood volume contributed to a lesser degree of changes in these variables.
Directionally opposite changes were observed between resting flow pulsatility index
(PIQp) and ratioPI, with decreasing LV contractility, increasing total blood volume and
increasing mean pump speed reduced PIQp but increased ratioPI.
3.3.3 Sensitivity Analysis: Effects of Individual Parameters on HUT Response
Table 3.4 shows the effects of modifying LV contractility, RV contractility, total blood
volume, desensitized reflex response, as well as pump speed on key variables during
supine and 700 HUT, using model settings described previously as baseline condition. As
observed from the simulation results, effects of these parameters on all hemodynamic
variables at the supine position were similar to that obtained during the resting condition.
Concerning the changes from supine to 700 HUT, mean systemic arterial pressure and
mean left atrial pressure showed directionally opposite changes in all simulated
conditions except that in the case of desensitized reflex response. Decreasing LV
contractility and increasing mean pump speed augmented the rise in mean systemic
arterial pressure and the reduction in mean left atrial pressure at 700 HUT, leading to an
increase in dP and dPpump , while opposite observations were obtained with decreasing
Univers
ity of
Mala
ya

32
RV contractility and increasing total blood volume. To the contrary, desensitized reflex
response led to a substantial decrease in mean systemic arterial pressure and mean left
atrial pressure at 700 HUT. In terms of blood flow, increasing total blood volume imposed
the most significant effect among all simulated conditions, where it substantially lessened
the decrease in mean cardiac output, mean aortic valve flow and mean pump flow.
Similarly, decreasing LV contractility, increasing mean pump speed and desensitized
reflex response also reduced the percentage reduction in mean cardiac output at 700 HUT.
With respect to PIQp, increasing LV contractility augmented the percentage increase in
PIQp at 700 HUT, while opposite and lesser degree of changes were observed with
decreasing RV contractility and increasing total blood volume. As opposed to other
simulated conditions, increasing mean pump speed and desensitized reflex response
produced a drop in PIQp at 700 HUT.
Univers
ity of
Mala
ya

33
Table 3.4: Effect of individual parameter on key hemodynamic variables during supine and 70° HUT
Variable Baseline Elv Erv Vt ω β
Psa (mmHg) 91.8 85.1 89.5 96.3 100.3 91.8
Pla (mmHg) 14.8 17.5 13.0 20.3 11.0 14.8
CO (L/min) 4.6 4.1 4.4 4.9 5.4 4.6
QP (L/min) 0.7 0.0 0.5 0.9 0.0 0.7
Qav (L/min) 3.9 4.1 4.0 4.0 5.4 3.9
dP (mmHg) 50.8 51.9 50.8 50.0 69.2 50.8
dPpump
(mmHg)
84.0 85.6 84.1 83.8 118.8 84.0
PIQp (L/min) 3.9 2.2 3.8 3.8 2.9 3.9
ratioPI 1.0 1.8 1.1 1.1 1.8 1.0
Changes from rest to exercise
Psa (mmHg) 2.1 3.9 2.5 1.3 4.0 -8.6
Pla (mmHg) -4.7 -5.7 -3.9 -4.6 -4.9 -6.0
CO (%) -17.2 -14.6 -15.1 -8.6 -12.7 -10.0
Qav (%) -60.0 N/A -68.4 -16.1 N/A -75.5
QP (%) -10.1 -14.6 -9.0 -6.9 -12.7 1.0
dP (%) 8.5 14.2 7.6 5.7 16.5 0.6
dPpump (%) 0.9 1.4 0.9 0.5 2.5 0.4
PIQp (%) 15.1 19.8 13.3 13.3 -6.9 -6.5
ratioPI (%) -21.9 -28.7 -19.6 -17.9 -6.2 8.0
Columns 3 to 7 refer to the simulation repeated (using baseline parameters) by individually modifying the
following quantities to that used for the baseline scenario.
Univers
ity of
Mala
ya
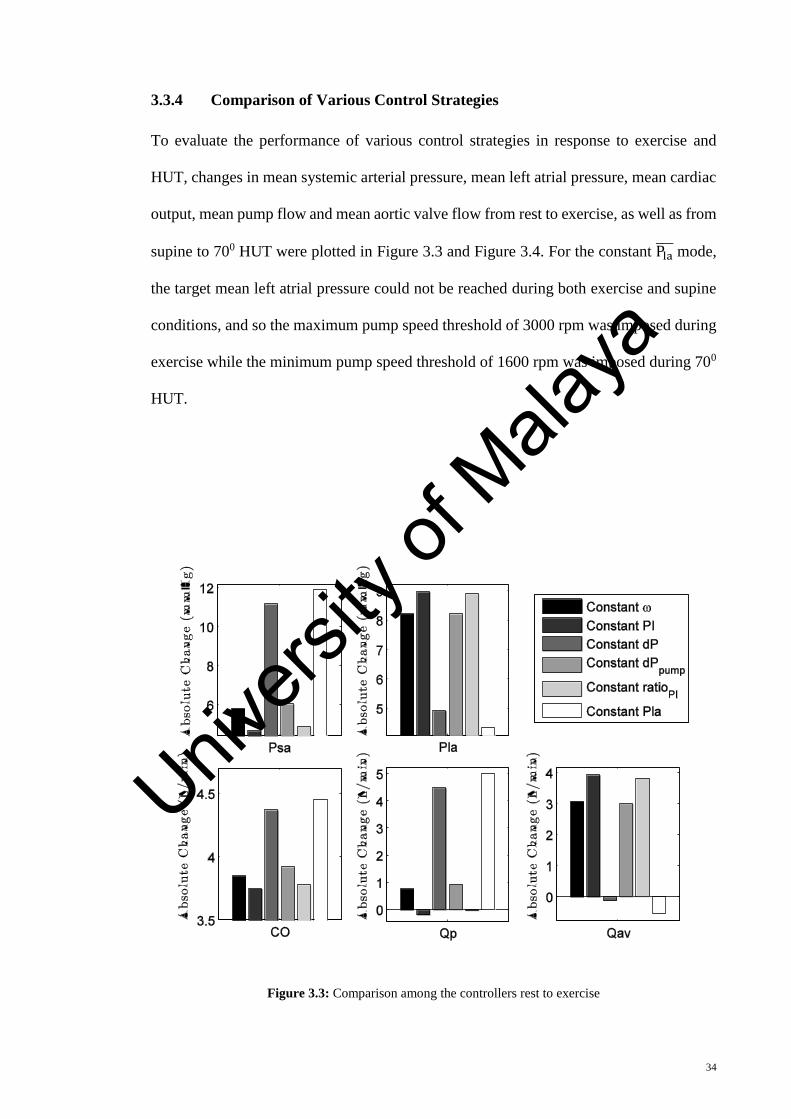
34
3.3.4 Comparison of Various Control Strategies
To evaluate the performance of various control strategies in response to exercise and
HUT, changes in mean systemic arterial pressure, mean left atrial pressure, mean cardiac
output, mean pump flow and mean aortic valve flow from rest to exercise, as well as from
supine to 700 HUT were plotted in Figure 3.3 and Figure 3.4. For the constant Pla mode,
the target mean left atrial pressure could not be reached during both exercise and supine
conditions, and so the maximum pump speed threshold of 3000 rpm was imposed during
exercise while the minimum pump speed threshold of 1600 rpm was imposed during 700
HUT.
Figure 3.3: Comparison among the controllers rest to exercise
Univers
ity of
Mala
ya

35
Figure 3.4: Comparison among the controllers from supine to 700 HUT.
With regards to the ability of the controllers to increase mean cardiac output during
exercise, constant Pla mode yielded the best performance, with an increase of 4.45 L/min
(ω = 3000 rpm), followed by constant dP (4.37 L/min, ω = 2891 rpm), constant dPpump
(3.92 L/min, ω = 2130 rpm), constant ω (3.85 L/min, ω = 2100 rpm), constant ratioPI (3.78
L/min, ω = 1953 rpm) and constant PIQp (3.75 L/min, ω = 1932 rpm), respectively. While
same trend was observed for mean systemic arterial pressure (constant Pla : 11.91 mmHg,
constant dP : 11.16 mmHg, constant dPpump : 6.04 mmHg, constant ω: 5.81 mmHg,
constant ratioPI : 4.88 mmHg, constant PI: 4.67 mmHg), opposite order was obtained for
mean left atrial pressure (constant PI: 8.97 mmHg, constant ratioPI : 8.90 mmHg, constant
ω: 8.23 mmHg, constant dPpump : 8.21 mmHg, constant dP : 4.92 mmHg, constant Pla
:
4.33 mmHg). Since the model produced a fall in PIQp and a rise in ratioPI from rest to
exercise at a constant target speed, it follows that average pump speed must be reduced
in these two controllers to maintain the target set point value. Consequently, a reduction
Univers
ity of
Mala
ya
36
in mean pump flow was observed during exercise despite an overall increase in mean
cardiac output (contributed by the native heart).
The avoidance of ventricular suction during a change in posture is mainly determined by
the change in LV preload, which is reflected by the level of mean left atrial pressure. In
this regard, constant Pla mode showed the least decrease in mean left atrial pressure at 700
HUT (-2.28 mmHg, ω = 1600 rpm), followed by constant dP (-3.90 mmHg, ω = 1963
rpm), constant dPpump (-4.67 mmHg, ω = 2090 rpm), constant ω (-4.72 mmHg, ω = 2100
rpm), constant ratioPI (-5.90 mmHg, ω = 2231 rpm), and constant PI (-5.94 mmHg, ω =
2233 rpm), respectively. Nevertheless, compared to other controllers, constant Pla control
produced the largest drop in mean cardiac output (-1.20 L/min) and mean systemic arterial
pressure (-5.33 mmHg) at 700 HUT, which may cause circulatory instability. To the
contrary, constant PI attained the greatest increase in mean systemic arterial pressure
(5.14 mmHg) and the least fall in mean cardiac output (-0.54 L/min) at 700 HUT.
3.4 Discussion
Clinical observations under pump assistance showed an increase in cardiac output during
exercise without variations in the pump control parameters (Akimoto et al., 1999; Jacquet
et al., 2011; Salamonsen et al., 2013; Slaughter et al., 2009). Akimoto et al. (1999)
observed an increase in pump flow during exercise under partial LVAD assist and
hypothesized that this was caused by an increase in heart rate, which increased the ratio
between systolic and diastolic period. However, we have demonstrated in our simulation
results (Table 3.3) that since varying heart rate has not significantly altered differential
pump pressure, mean pump flow remained relatively constant regardless of heart rate.
Furthermore, we observed from our model simulations that exercise leads to an increase
in mean cardiac output through greater contribution from the native heart compared to
the assist device. Our observations are consistent with findings inpatients and in vivo
animal experiments (Jacquet et al., 2011; Slaughter et al., 2009), which revealed that the
Univers
ity of
Mala
ya

37
increase in total cardiac output during exercise was dominated by an increase in the aortic
valve flow (contribution from the native heart) rather than the pump output. Factors
contributing to an enhanced venous return and thus aortic valve flow during exercise
include vasodilation mediated by production of local metabolites as well as the autonomic
reflex response causing venoconstriction, increases in heart rate and left/right ventricular
contractilities (Elisa Magosso et al., 2002).
The efficiency of the LVAD in improving exercise capacity in a heart failure patient has
gained considerable interest in the field of rotary blood pumps. Since LV output
contributes to a large percentage of increase in cardiac output during exercise, reduced
cardiac reserve (i.e. reduced ability to augment LV end diastolic volume) caused by
deterioration in the LV contractility severely affects the ability of the patient to increase
cardiac output in response to exercise. Moreover, as observed clinically (Schima et al.,
2006), the inherent flow adaptation to exercise was achieved at a cost of an elevated LV
filling pressure, thereby imposing a considerable load on the lung. Apart from LV
contractility, our simulation results (Table 3.3) also revealed that the autonomic reflex
mechanism has a significant influence on the response of the IRBP-assisted patients to
exercise. Desensitized effector response not only reduced the percentage increase in total
cardiac output significantly, but also led to a marked reduction in the mean arterial
pressure. Although total cardiac output increases automatically during exercise, we found
that increasing mean pump speed has the ability to improve total cardiac output. This
concurs with previous studies (Brassard et al., 2011; Salamonsen et al., 2013; Schima et
al., 2006), which led to the development of automatic speed adaptation modes (Schima et
al., 2006) aimed to further increase cardiac output and alleviate elevated filling pressures
during strenuous exercise.
Sudden upright posture is associated with a redistribution of blood volume to the lower
portion of the body, leading to a rapid fall in the central venous pressure, marked
Univers
ity of
Mala
ya

38
reduction in the ventricular filling pressure and subsequently a decrease in the stroke
volume (Einly Lim et al., 2013). Despite the concern regarding the possibility of
ventricular suction occurring with reduced venous return, (K. Muthiah et al., 2013) has
not observed suction events in their passive HUT studies performed on 9 IRBP-assisted
patients. Similarly, even though our simulation results demonstrated a decrease in the left
atrial pressure at 700 HUT (Table 3.4), the pressure was within an acceptable range and
did not induce any suction event, partly due to the slightly elevated LV filling pressure in
the supine position. As proposed by Pepi, Guazzi, Maltagliati, Berna, and Tamborini
(2000), gradual preload reduction in congestive heart failure patients with elevated filling
pressure enhances ventricular relaxation and diminishes the constraining effect of the
pericardium, therefore yielding a much smaller decrease in the LV end diastolic volume,
stroke volume, and cardiac output as compared to a normal subject. Our simulation results
also revealed that desensitized reflex function imposed deleterious effects on the IRBP-
assisted patients through a marked reduction in the mean arterial pressure upon HUT.
Comparing various control strategies, left atrial pressure control, having an infinite
preload sensitivity, outperformed other control modes in its ability to increase cardiac
output during exercise and minimize the fall in LV filling pressure during a reduction in
preload (i.e. HUT). However, it is worth noting that while left atrial pressure control mode
minimizes the risk of suction with upright posture, patients may experience a sharp
reduction in arterial pressure, thus unable to maintain circulatory stability and prevent the
clinical syndrome of orthostatic hypotension. This is further aggravated in patients with
severe baroreflex impairment, considering the important role reflex mechanism plays in
regulating arterial pressure during HUT. Furthermore, as proposed by (Nicholas Richard
Gaddum et al., 2012), signal drift in currently available implantable pressure transducers
hampers the applicability of left atrial pressure in long-term control systems.
Univers
ity of
Mala
ya

39
In view of this, researchers have looked into ways to indirectly estimate preload (Arndt
et al., 2008; Choi et al., 2001; Nicholas Richard Gaddum et al., 2012; Schima et al., 2006).
One of the most popular noninvasive preload-based control strategies is PI control, based
on the close relationship between pump flow or differential pressure pulsatility and LV
filling pressure (Choi et al., 2001; Schima et al., 2006). In a study performed on five
patients who underwent bicycle ergometry, Schima et al. (2006) demonstrated that
exercise increased pulmonary venous return and thus pump flow pulsatility, with a
simultaneous increase in pump flow (28%) at a constant target operating speed with an
axial flow pump. An automatic, closed loop speed controller, which maintains the flow
pulsatility, further increased pump flow but produced negligible change in the total
cardiac output. Nevertheless, contradictory findings were observed in a multicenter study
involving nine patients implanted with a centrifugal blood pump (Salamonsen et al.,
2013), where pump speed pulsatility fell significantly during each maximal exercise study
despite an increase in LV preload. Similarly, our simulation results revealed that pump
flow pulsatility decreased during exercise despite an increase in the left atrial pressure,
and increased at 700 HUT in spite of a reduction in the left atrial pressure. (Salamonsen
et al., 2013) suggested that the reduction in pump speed pulsatility during exercise at a
fixed speed setting might be due to a substantial increase in the pump flow. The difference
in findings between these studies may be attributed to the difference in the pump
characteristics (i.e. axial vs. centrifugal), where pump flow pulsatility has been shown to
not only depend on venous return, but also on the slope of the pump differential pressure
versus pump flow (H-Q) curve at which it is operating (Choi et al., 2007). Furthermore,
pump flow pulsatility has demonstrated more correspondence with changes in LV filling
during the aortic valve non-opening phase, and lack sensitivities during aortic valve
opening (Salamonsen et al., 2012). Coincidentally, our model simulations revealed that
directionally opposite changes in pump flow pulsatility occurred at a high pump speed
Univers
ity of
Mala
ya

40
when the aortic valve is mostly closed, with an increase during exercise and a decrease
with HUT, which follows that of the LV filling pressure (reflected by left atrial pressure).
On the other hand, ratioPI controller, previously proposed by Salamonsen et al. (2012),
showed very similar performance with PI control. This is as expected since ratioPI
controller operates by relating pump flow output to pump flow pulsatility values.
Furthermore, our simulation results revealed a close correlation between PIQp and ratioPI
in all simulated conditions. As suggested by Salamonsen et al. (2013), both PI and ratioPI
controller would respond to the increase in pump flow and associated fall in pump flow
pulsatility during exercise by reducing pump speed, thus leading to an undesirable
reduction in the increase of total cardiac output.
Maintaining a constant average pressure difference between the left ventricle and the
aorta demonstrated superior performance over PI, ratioPI and constant speed controller,
where it substantially increases total cardiac output while reducing LV filling pressure
during exercise, and minimizes the reduction in LV filling pressure during upright
posture. Compared to the left atrial pressure control mode which requires excessive
variation in pump speed to achieve a target set point, constant dP controller, which takes
into account the level of the mean arterial pressure, is more stable as it does not produce
a substantial fall in the mean arterial pressure as that occurring in the left atrial pressure
control mode upon upright posture. Meanwhile, maintaining a constant average
differential pump pressure performs similarly to constant speed control, mainly due to the
relatively flat H-Q curve for a centrifugal blood pump. The observed significant
differences in performance between the dP and the dPpump controllers can be explained
by the substantial pressure drop across the cannula, especially under the higher pump flow
conditions.
Univers
ity of
Mala
ya

41
To date, most commercially available IRBPs operate at a constant speed level determined
by the physician. As demonstrated in the present study and reported in the published
literature (Jacquet et al., 2011; Salamonsen et al., 2013; Schima et al., 2006), although
there is an inherent adaptation of pump flow and native cardiac output to physiologic
demand at constant pump speed, this occurs at an expense of increased loading on the
lung and the left ventricle. Among the six controllers we evaluated, our simulation results
revealed that maintaining a constant average pressure difference between the aorta and
the left atrium appears to be the most robust. However, it is worth noting that except for
the constant speed controller, successful clinical implementation of the other controllers
relies heavily on the estimation accuracies of pressures and flow, due to the issues of
signal drift and thrombus occlusion associated with currently available implantable flow
and pressure transducers. Blood viscosity as well as native heart interaction has been
reported as potential factors, which affect the accuracy of the flow and head estimation
models (Tagusari et al., 1998). Apart from that, previous study has also revealed a large
difference between dP and pump differential pressure at end systole, especially under
high pump flow conditions, due to the dependency of the pressure drop across the cannula
with pump flow. Therefore, in constant dP control, a reliable model describing cannula
pressure drop has to be developed to derive dP from the estimated pump differential
pressure.
3.5 Limitations
Comparison results of the various controllers concerning their response to exercise and
HUT were based on a moderate heart failure condition (NYHA Class II & III) rather than
a more severe heart failure scenario, where the aortic valve is closed most of the time at
rest. Since pump flow pulsatility demonstrated more correspondences with changes in LV
filling during the aortic valve non-opening phase (Salamonsen et al., 2012), slight
improvement is to be expected for the constant PI controller under this condition. This is
Univers
ity of
Mala
ya
42
confirmed by our additional simulations (not shown) assessing the performance of the
controllers at lower LV contractility and higher pump speed, which demonstrated that the
rankings of the individual controller were not substantially affected by this new set of
model parameters, except for a minor improvement in the constant PI controller. In terms
of exercise response, the constant PI controller climbed to the forth position in its ability
to increase pump flow and cardiac output, surpassing the constant speed controller.
However, it is worth noting that even in patients with severe heart failure condition,
opening of the aortic valve can frequently be observed, thus affecting the sensitivities of
the flow pulsatility to LV filling (Brassard et al., 2011; Mancini et al., 1998; Salamonsen
et al., 2013). Since the present study focused on the steady state response of the IRBP-
assisted patients to exercise and HUT, evaluation results comparing the performance of
the previously proposed controllers were based on steady state results. The
responsiveness of the various controllers in the face of sudden physiological perturbations
has not been taken into consideration. Future studies should also look into the transient
changes of the important hemodynamic variables from rest to exercise, as well as from
supine to HUT.
3.6 Conclusion
We have investigated the response of the IRBP-assisted patients to exercise and HUT, as
well as the effect of alterations in the model parameter values on this response, using
validated heart pump interaction models. Furthermore, the performance of a number of
previously proposed controllers were evaluated with regards to their ability to increase
cardiac output during exercise and maintaining circulatory stability upon HUT. It was
observed that the increase in cardiac output during exercise was dominated by an increase
in the aortic valve flow rather than pump flow. Increasing pump speed further improves
total cardiac output and reduces elevated filling pressures, thus improving exercise
capacity in the IRBP-assisted patients. On the other hand, due to elevated supine filling
Univers
ity of
Mala
ya

43
pressure, reduced venous return associated with upright posture has not shown to induce
LV suction. Among various control strategies, LAP control outperformed other control
modes in its ability to increase cardiac output during exercise. However, it causes a fall
in the mean arterial pressure upon HUT, which may lead to cases of orthostatic
hypotension and affect circulatory stability. To the contrary, constant dP control, which
takes into account both, left atrial and arterial pressure, demonstrated superior
performance under both exercise and HUT scenarios, potentially due to the preload and
afterload sensitivity of IRBPs. PI and ratioPI control, on the other hand, performed poorly
during exercise and HUT, due to their strong dependency on the pump operating point.
In particular, pump flow pulsatility lacks sensitivity to venous return (reflected by mean
left atrial pressure) during the aortic valve-opening phase. The importance of the reflex
mechanism in determining the response of the IRBP-assisted patients to exercise and
postural changes is highlighted by our simulation results where the desensitized reflex
response attenuates the percentage increase in cardiac output during exercise and
substantially reduces arterial pressure upon HUT.
Univers
ity of
Mala
ya
44
CHAPTER 4: PRELOAD-BASED STARLING-LIKE CONTROL FOR
ROTARY BLOOD PUMPS
4.1 Introduction
Preload sensitivity of the ventricular myocardium is an essential requirement for the
Frank-Starling mechanism by which the left ventricular end-diastolic pressure controls
the force of contraction of the left ventricle in proportion to the blood flow received from
the right heart and pulmonary circulation. Unfortunately, implantable rotary blood pumps
which are currently the preferred technology for assisting the failing LV do not have
sufficient preload sensitivity to perform this task automatically (Salamonsen et al., 2011).
It would seem logical therefore, that LV preload be selected as the feedback variable of
choice in physiological control systems designed for IRBPs. However, this has not
happened seemingly because LV preload is not easily estimated nor measured. In a
comprehensive review conducted recently, A.-H. H. AlOmari et al. (2013) reported few
instances of physiological control based on invasive pressure measurements (Bullister,
Reich, & Sluetz, 2002; G. A. Giridharan & Skliar, 2002; Saito et al., 2010; Wu et al.,
2003).
On the other hand, there is a widespread view that currently available implantable
pressure transducers are rendered virtually unusable due to a range of problems. These
include limited reliability, drifts in transducers’ response over time, and the anatomical
distortion they present to pump inlet cannula, resulting in unwanted flow turbulence and
associated clotting disorders. As an alternative, there has been much interest in non-
invasive estimation of pump pulsatility measures derived from various pump parameters,
either as a display to aid manual adjustment of pump speed (Esmore et al., 2008; Farrar,
Bourque, Dague, Cotter, & Poirier, 2007; Letsou, Reverdin, & Frazier, 2013; Slaughter
et al., 2009), or as a feedback variable for physiological controllers (Arndt, Nüsser, &
Lampe, 2010; M. A. Bakouri et al., 2014; Choi et al., 2007; Endo et al., 2002; Salamonsen
Univers
ity of
Mala
ya

45
et al., 2012). The theoretical link between pulsatility (the difference between maximum
and minimum points on a waveform measured over a cardiac cycle) and PLVED is via
the effect of PLVED on the left ventricular stroke work, which in turn affects pulsatility.
Pulsatility measures reported include pump flow pulsatility, pressure head pulsatility,
speed pulsatility, and motor current pulsatility.
New technology in blood pressure measurement however brings with it the promise of
greater biocompatibility and stability over time. In a multicenter study, Troughton et al.
(2011) reported that in the Heart Pod pressure transducer, after an initial ‘bedding in’
process in the left atrium, the pressure response was essentially stable over the study
period of four years. In addition, they reported an overall 95% freedom from failure over
two years, 88% over four years and 100% freedom from failure in the last 41 consecutive
patients. More recently, pressure transducers based on optical fibers have been described
(Konieczny et al., 2010; Zhou, Yang, Liu, Cysyk, & Zheng, 2012), which may achieve
the required stability in the constant temperature environment of the heart and are small
enough to be embedded in the walls of the pump inlet and outlet cannulae without
anatomical distortion.
It is therefore of interest to examine the performance of preload control in comparison
with PIQp control and constant speed operation (prevalent in the majority of IRBPs
currently implanted clinically). If preload control was shown to be functionally superior
to both PIQp and constant speed modes, this might provide the impetus for further
development of preload-based Starling-like control. We report such a study using a
sophisticated and experimentally validated computer model of the human circulation and
the VentrAssistTM left ventricular assist device.
Univers
ity of
Mala
ya

46
4.2 Methods
4.2.1 Description of the Heart-Pump Interaction Model
The heart-pump interaction model used in the present study has recently been developed
and validated to investigate the response of IRBP-assisted patients to exercise and head
up tilt (Einly Lim et al., 2015). The basic structure of the model consists of the left and
right sides of the heart, the pulmonary and systemic circulations, as well as the LVAD.
The LVAD component includes the description of the VentrAssistTM LVAD operating
between 1600 and 3000 rpm, as well as the inlet and outlet cannula. Furthermore, the
model takes into account various important items such as the arterial and
cardiopulmonary reflexes, local metabolic vasodilatation in the active muscles, the auto-
regulation mechanism in the lower body, as well as the muscle pump. The model was
implemented using the SIMULINK toolbox in MATLAB (The Math Works, Inc., Natick,
MA, USA). A detailed description of the model validation procedures together with the
optimized model parameter values can be obtained from (Einly Lim et al., 2013; Einly
Lim et al., 2010; Einly Lim et al., 2012a, 2012b; Einly Lim et al., 2015).
4.2.2 Description of the Control Systems
4.2.2.1 Preload-Based Starling-Like Controller
The immediate response of the preload controller emulates the Frank-Starling control
mechanism of the natural heart, which was first identified by Starling and Visscher
Starling and Visscher (1927) as a sigmoid relationship between LV stroke work and
PLVED. This was subsequently modified by A.C. Guyton (1963) to give a similar
sigmoid relationship between LV flow and PLVED.
The Frank-Starling curve forms the basis of the control line (CLn), as illustrated in
Figure 4.1 (A). In the proposed preload controller, CLn is generated by a third order
polynomial function (4.1) fitted directly to Guyton’s data (A.C. Guyton, 1963), which
Univers
ity of
Mala
ya

47
relates desired mean pump flow to PLVED. A scaling factor (K) is also added to provide
a means of altering sensitivity of the pump to changes in PLVED, which makes (4.1)
adaptive with different patients’ preload sensitivity (Nicholas R. Gaddum et al., 2014; A
C Guyton & Hall, 2005).
QPref = (0.0003 ∗ PLVED3 − 0.0276 ∗ PLVED2 + 0.9315 ∗ PLVED − 0.0928) ∗ K (4.1)
where PLVED represents the LV end diastolic pressure provided by the numerical CVS
model. In our study, PLVED is automatically sampled at end diastole of each heart cycle
by the model and then fed to the controller. Although the full controller is able to adapt
to longer term changes in the circulation by adjustment of the scaling factor, this
communication deals only with the immediate response of the controller in which changes
in PLVED cause migration of the operating point to different positions on CLn.
Figure 4.1 (A) gives an overall view of how the preload controller functions in a
diagrammatic form. As changes in state of the subject evolve (transition from state S1 to
states S2 or S3 ), these changes are tracked by the controller which then returns the
operating point back to the control line. For example, the white circle in Figure 4.1 (A)
gives the position of the original operating point, while the grey circles give its position
after a deviation from the control line, induced by changes in the system state from 𝑆1 to
𝑆2 or 𝑆3. Figure 4.1 (B) presents details on how the controller returns the operating point
back to CLn along a linear path in a series of steps (indicated by the small arrows), until it
settles to a new position located at the intersections between CLn and the altered system
states (indicated by black circles). Thus, deviations of the operating point from CLn either
to the right or to left side of the control line move the operating point upwards or
downwards along CLn.
Univers
ity of
Mala
ya

48
Figure 4.1: (A) and (B): Schematic describing the preload-based Starling-like control. White circle, position of operating point (current combination of PLVED and QP ) before a
change of state; Grey circles, position of operating points after changes in states; Black circles, position of operating points upon arriving at the new steady state located at the
intersection between the control line and the new system line. The controller drives the changes in the operating points along the path indicated by the arrows along the new system
line.
(A) (B)
Univers
ity of
Mala
ya

49
4.2.2.2 Pulsatility Controller
The pulsatility controller, on the other hand, relates the desired mean pump flow with
pump flow pulsatility (PIQP), defined as the absolute difference between the maximum
and the minimum pump flow (Nicholas R. Gaddum et al., 2014) over a heartbeat. Instead
of being curvilinear, the control line for the pulsatility controller is linear (4.2) as derived
by Salamonsen et al., with the gradient defined by the tangent of the angle (θ) it makes
with the pulsatility axis in radians. Similar to preload control, reference changes are
applied by movements of the operating point up or down CLn. However, since CLn is
linear, the controller is able to force the deviated operating point back to the appropriate
position on CLn along a circular path, as defined by (4.2) (Salamonsen et al., 2012).
QPref = (√(QP
)2 + (PIQP)2
) ∗ sin(θ) (4.2)
where QP represents the desired average pump flow, QP
is the mean pump flow provided
by the model, and PIQP is the pump flow pulsatility. More detailed descriptions of the
pulsatility controller can be obtained from (Salamonsen et al., 2012) and (M. A. Bakouri
et al., 2014).
4.2.3 Simulation Protocols
In order to determine the gradient for the return path to the control line, model simulations
were performed for the baseline, exercise, blood loss and reduced LV contractility
conditions, in which mean pump speed (ω) was increased from 1600 rpm to 3000 rpm in
100 rpm increments. Mean flow through the aortic valve and pump as well as PLVED
were obtained from the model, with the relationship between QP and PLVED plotted in
Figure 4.2. System gradients with aortic valve (AV) open and AV closed were calculated
separately for each test scenario, and the mean value for each AV state was then selected
as the gradients of the return path.
Univers
ity of
Mala
ya

50
It can be shown from Table 4.1 that although system lines for the different test scenarios
showed wide displacements among each other, their gradients grouped according to
whether the aortic valve was opening or closing were similar.
In normal clinical practice, RBP speed is set to stop the aortic valve from opening in order
to provide full assist to the patients (Arndt et al., 2008). The aortic valve opening
condition is only used while attempting to wean a patient from the pump or used
intermittently to prevent inappropriate sealing of the aortic valve cups. In order to
determine the optimal scaling factor (K) for CLn, another set of simulations was conducted
in the baseline state, where K was increased from a basal value of 0.2 to the maximal
value of 2.3 in 0.1 increments. Blood flow through the aortic valve was obtained from the
model to indicate whether the aortic valve was opening or closing. The optimal scaling
factor was identified as the minimum value of K that allowed the aortic valve to be closed
in the baseline condition. In the present study, K value was set to 1.0, while the
corresponding control line of the pulsatility controller had a gradient (angle),θ of 620.
Both pulsatility and preload-based Starling-like control modes were then implemented
separately with a proportional-integral-derivative controller (Figure 4.3), which adjusted
the pulse-width-modulation (PWM) signal to generate the desired QP . The transfer
function of the PID controller is defined in (4.3), and was discretized automatically by
MATLAB/SIMULINK using a sampling period of 0.002 s.
G(Sl) = KP +KI
Sl+ KDSl (4.3)
Sl stands for complex number frequency, KP, KI and KD represent the proportional,
integral and derivative gains of the controller, respectively (Table 4.2). The values of
these constant gains were tuned manually to achieve a 5% settling time of 10 s with
minimal overshoot (i.e. a maximum overshoot within 10 % of the final value)
Univers
ity of
Mala
ya

51
(Salamonsen et al., 2012). In each iteration, the PID controller compared the mean pump
flow obtained from the model with the desired mean pump flow, and moved the operating
point back to the control line following the selected return path.
Table 4.1: Gradients for return lines (ratio of mean pump flow to PLVED) for baseline and three test
scenarios, i.e. exercise, blood loss, and reduced LV contractility scenario.
System States
Gradient with AV Open
(L/min/mmHg)
Gradient with AV Closed
(L/min/mmHg)
Baseline -0.64 -0.13
Exercise -0.92 ---
Blood Loss -0.94 -0.19
Low LVC --- -0.14
Mean -0.83 -0.15
Figure 4.2: System response to variations in mean pump flow for baseline and three test conditions.
Figure also shows the superimposed control line (CLn), where the minimum scaling factor (K) that allows
the aortic valve to be closed in the baseline condition was chosen. Arrows indicate points where the aortic
valve starts to open for Baseline and HUT scenarios.
BaselinHUT
Univers
ity of
Mala
ya
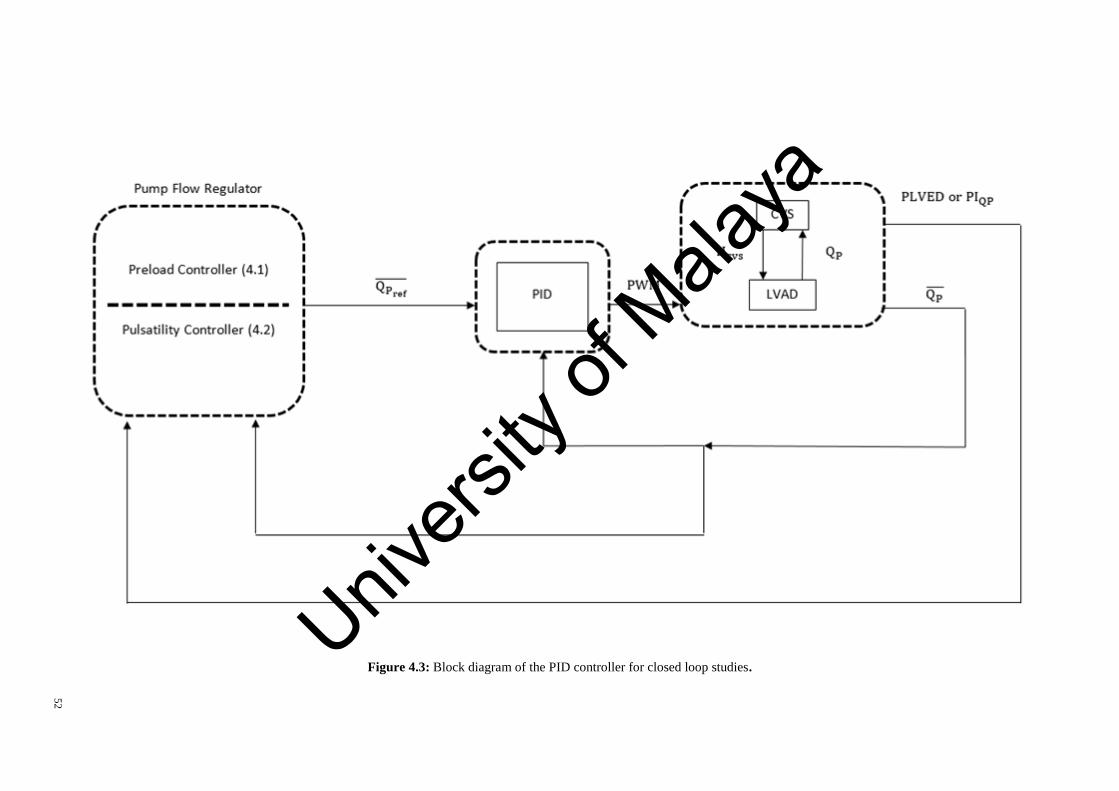
52
Figure 4.3: Block diagram of the PID controller for closed loop studies.Univ
ersity
of M
alaya

53
Table 4.2: PID gains used for both preload and pulsatility controlling methods.
Control constants Gains
KP 0.28
KI 0.22
KD 0.05
KP, Proportional gain; KI, Integral Gain; KD, Derivative Gain.
In addition to the baseline state at rest, three other scenarios, including exercise, blood
loss and reduced LV contractility were simulated. For the exercise simulation, a relative
intensity of 0.55 was chosen to represent the maximal exercise condition as defined by
Lim et al. (Einly Lim et al., 2015). To simulate blood loss and reduced LV contractility
conditions, total blood volume (Vt) and maximum LV end systolic elastance (Emax,lv) were
reduced by 1000 mL and 78%, respectively. The steady-state performance of both preload
and pulsatility control were compared to each other as well as with the constant speed
mode. For all simulations, we waited for the hemodynamic variables to settle to a steady
state condition before transitioning from the baseline into one of the three test conditions.
The simulation was then continued for a sufficient period to allow the control modes to
achieve a post transition steady state.
4.3 Results
The performance of the three control methods was compared by observing the changes in
mean pump flow, mean cardiac output, mean aortic valve flow, mean systemic arterial
pressure (MAP), and mean left atrial pressure from baseline to exercise (Figure 4.4),
hemorrhage (Figure 4.5) and reduced left cardiac contractility (Figure 4.6) scenario.
Univers
ity of
Mala
ya

54
Figure 4.4: Comparison of preload controller vs. pulsatility and constant speed modes from baseline to exercise (absolute value changes).
Univers
ity of
Mala
ya

55
Figure 4.5: Comparison of preload controller vs. pulsatility and constant speed modes from baseline to hemorrhage (absolute value changes).
Univers
ity of
Mala
ya

56
Figure 4.6: Comparison of preload controller vs. pulsatility and constant speed modes from baseline to reduced left ventricular contractility scenario (absolute value changes).
Univers
ity of
Mala
ya
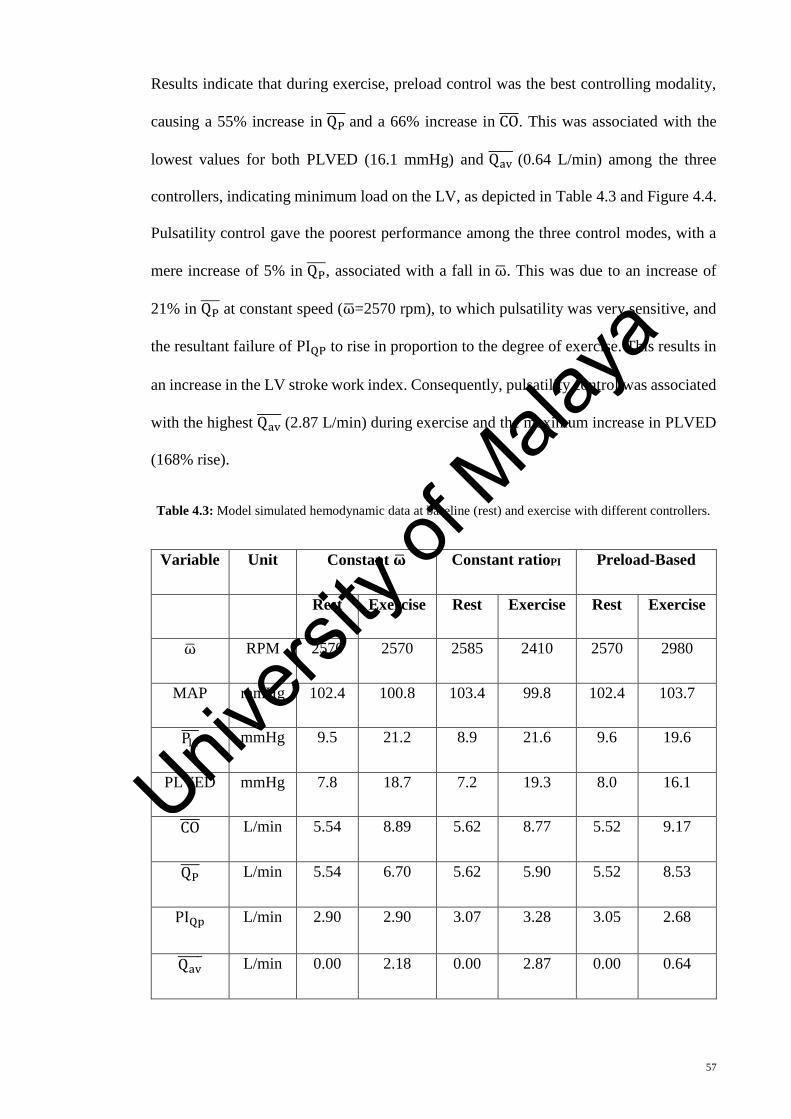
57
Results indicate that during exercise, preload control was the best controlling modality,
causing a 55% increase in QP and a 66% increase in CO . This was associated with the
lowest values for both PLVED (16.1 mmHg) and Qav (0.64 L/min) among the three
controllers, indicating minimum load on the LV, as depicted in Table 4.3 and Figure 4.4.
Pulsatility control gave the poorest performance among the three control modes, with a
mere increase of 5% in QP , associated with a fall in ω. This was due to an increase of
21% in QP at constant speed (ω=2570 rpm), to which pulsatility was very sensitive, and
the resultant failure of PIQP to rise in proportion to the degree of exercise. This results in
an increase in the LV stroke work index. Consequently, pulsatility control was associated
with the highest Qav (2.87 L/min) during exercise and the maximum increase in PLVED
(168% rise).
Table 4.3: Model simulated hemodynamic data at baseline (rest) and exercise with different controllers.
Variable Unit Constant �� Constant ratioPI Preload-Based
Rest Exercise Rest Exercise Rest Exercise
ω RPM 2570 2570 2585 2410 2570 2980
MAP mmHg 102.4 100.8 103.4 99.8 102.4 103.7
Pla mmHg 9.5 21.2 8.9 21.6 9.6 19.6
PLVED mmHg 7.8 18.7 7.2 19.3 8.0 16.1
CO L/min 5.54 8.89 5.62 8.77 5.52 9.17
QP L/min 5.54 6.70 5.62 5.90 5.52 8.53
PIQp L/min 2.90 2.90 3.07 3.28 3.05 2.68
Qav L/min 0.00 2.18 0.00 2.87 0.00 0.64
Univers
ity of
Mala
ya
58
The challenge for an LVAD during a blood loss scenario is to avoid LV suction by
reducing its flow output sufficiently to match a substantial reduction in the right
ventricular preload and subsequent reduction in the delivery from the RV. In our model
simulation, LV suction was indicated by a negative PLVED (i.e. PLVED ≤ 0 ). As
observed in our previous animal experimental studies (E Lim, Alomari, Savkin, & Lovell,
2009), LV suction involves obstruction of the pump inlet cannula due to suction of the
LV walls at relatively high pump speeds. In this state, LV volume is low, resulting in
steady near zero LV pressure and negative pump inlet pressure throughout the cardiac
cycle. Our observations were consistent with Karantonis, Lovell, Ayre, Mason, and
Cloherty (2006) and Boston et al. (2003), who suggested that LV suction caused a
negative pressure in the LV, and thus it is imperative to maintain left atrial pressure
(substitute of PLVED) above 0 mmHg to avoid LV suction. Based on this suction
indicator and results in Table 4.4 and Figure 4.5, preload control was the only modality
that was able to reduce flow sufficiently to maintain an adequate safety margin against
LV suction. PLVED was 4.9 mmHg for preload control after a reduction in the total blood
volume, in contrast to near zero PLVEDs for constant speed mode (0.2 mmHg) and
pulsatility control mode (0.4 mmHg). Baroreceptor reflexes, which the model was
equipped with, were sufficient to avoid abrupt falls in the mean arterial pressure, even
though this particular parameter was not specifically addressed in the controlling policy.
MAP was reduced from 102 mmHg to 84 mmHg upon blood loss, which is more than
sufficient to maintain auto-regulation of flow by the body tissues (minimum threshold =
60 mmHg) (Berne, 1981).
Univers
ity of
Mala
ya
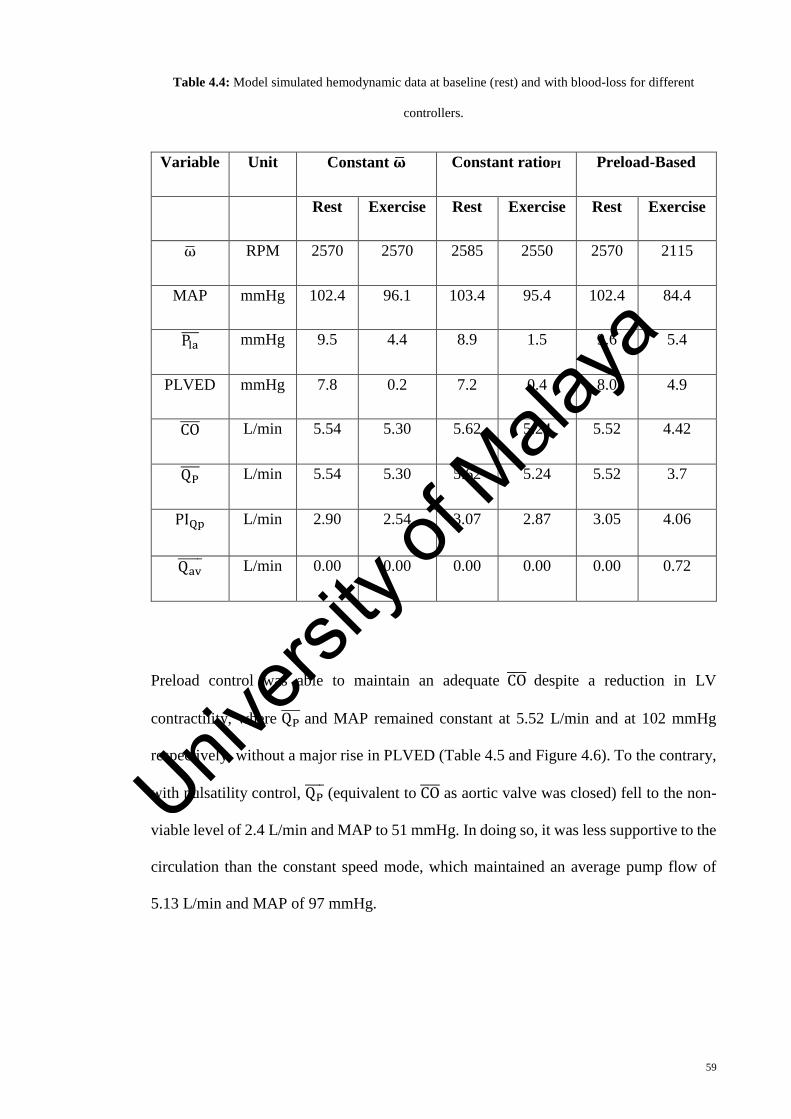
59
Table 4.4: Model simulated hemodynamic data at baseline (rest) and with blood-loss for different
controllers.
Variable Unit Constant �� Constant ratioPI Preload-Based
Rest Exercise Rest Exercise Rest Exercise
ω RPM 2570 2570 2585 2550 2570 2115
MAP mmHg 102.4 96.1 103.4 95.4 102.4 84.4
Pla mmHg 9.5 4.4 8.9 1.5 9.6 5.4
PLVED mmHg 7.8 0.2 7.2 0.4 8.0 4.9
CO L/min 5.54 5.30 5.62 5.24 5.52 4.42
QP L/min 5.54 5.30 5.62 5.24 5.52 3.7
PIQp L/min 2.90 2.54 3.07 2.87 3.05 4.06
Qav L/min 0.00 0.00 0.00 0.00 0.00 0.72
Preload control was able to maintain an adequate CO despite a reduction in LV
contractility, where QP and MAP remained constant at 5.52 L/min and at 102 mmHg
respectively, without a major rise in PLVED (Table 4.5 and Figure 4.6). To the contrary,
with pulsatility control, QP (equivalent to CO as aortic valve was closed) fell to the non-
viable level of 2.4 L/min and MAP to 51 mmHg. In doing so, it was less supportive to the
circulation than the constant speed mode, which maintained an average pump flow of
5.13 L/min and MAP of 97 mmHg.
Univers
ity of
Mala
ya

60
Table 4.5: Model simulated hemodynamic data at baseline (rest) and fall in left ventricular contractility.
Variable Unit Constant �� Constant ratioPI Preload-Based
Rest Exercise Rest Exercise Rest Exercise
ω RPM 2570 2570 2585 1575 2570 2700
MAP mmHg 102.4 97.4 103.4 54.5 102.4 102.2
Pla mmHg 9.5 12.6 8.9 16.2 9.6 9.8
PLVED mmHg 7.8 11.0 7.2 15.7 8.0 8.0
CO L/min 5.54 5.13 5.62 2.40 5.52 5.52
QP L/min 5.54 5.13 5.62 2.40 5.52 5.52
PIQp L/min 2.90 0.52 3.07 0.80 3.05 0.57
Qav L/min 0.00 0.00 0.00 0.00 0.00 0.00
4.4 Discussion
This numerical simulation study clearly establishes the utility of a single preload-based
Starling-like control line to control QP appropriately in the transition from rest to three
simulated scenarios: vigorous exercise, severe blood loss and a major fall in LV
contractility. It consistently outperformed the pulsatility controller, whose performance
was inferior even to the fixed speed mode. These results agree with a recent study reported
by Lim et al. (Einly Lim et al., 2015), which highlighted the deficiencies of the pulsatility
control in exercise and 700 head-up-tilt.
4.4.1 Physiological Mechanisms
On a theoretical basis, there are sound physiological mechanisms underlying these results.
Pump pulsatility (flow, current, pressure gradient, or speed) is a consequence of LV
Univers
ity of
Mala
ya

61
contraction whereas LV preload is one of the determinants of LV contraction. With severe
LV failure, as is the case for all LVAD recipients, the LV does not have the ability to
induce major changes in pulsatility. Therefore, the dynamic range of the pulsatility index
is small, and consequently its ability as a control input is limited. In the extreme case
where LV contractility is zero, pulsatility control is not feasible. By contrast, LV preload
increases as LV failure progresses and its dynamic range is wide in the presence of
LVAD.
These fundamental characteristics account for the superiority of the preload control in all
three test simulations. In addition, other mechanisms come into play with each of the three
test states. With exercise, the natural increase in QP during exercise at constant speed
severely reduces PIQp. Consequently, when the operating point is returned to the control
line in pulsatility control, there is an actual decrease in mean pump speed as reported by
Salamonsen et al. (2013). Preload is much less sensitive to this effect and progressively
rises with increasing exercise intensity, thus accounting for the observed superiority of
preload control.
In blood loss, because of the low dynamic range of the pulsatility index, the ability of the
pulsatility control to reduce QP effectively is limited and thus the risk of LV suction is
greater. Another major problem with pulsatility control is that PIQp, being a consequence
of the LV stroke work, is unable to distinguish between blood volume loss and a fall in
LV contractility since PIQp falls in both occasions. This is a major disadvantage as the
role of the LVAD in the two conditions should be very different. By contrast, preload
control responds to both conditions effectively, with a loss of blood volume causing a
reduction in QP to avoid LV suction while a reduction in LV contractility causing an
opposite effect to provide sufficient flow to the systemic circulation.
Univers
ity of
Mala
ya

62
By emulating the Frank-Starling control mechanism of the natural heart, preload-based
Starling-like control is able to synchronize LV and right ventricular outputs irrespective
of variations in venous return (Salamonsen et al., 2012). Compared to constant pulsatility
and constant speed modes (Table 4.3 and Table 4.5), preload control produced the least
increase in PLVED during exercise and reduced LV contractility scenarios, thus reducing
the chances of pulmonary congestion, which may lead to right-sided circulatory failure in
the long term (Haddad, Doyle, Murphy, & Hunt, 2008). In addition, preload control was
able to maintain an adequate safety margin against LV suction with a reduction in the
total blood volume. LV suction may cause a significant reduction in the right ventricular
performance through endocardia damage and septal shift (Salamonsen et al., 2012).
Depending on the status of the pulmonary vascular resistance, right ventricular
contractility and volume status, sustained suction-induced hemodynamic collapse lasting
for more than 15 min may occur in serious circumstances, causing unfavorable conditions
for effective LVAD unloading (Reesink et al., 2007).
4.4.2 Nature of Preload-Based Starling-Like Control
To date, most control methods are based on a fixed set point, such as constant speed
(Akimoto et al., 1999), preload (Bullister et al., 2002), differential pressure (G. Giridharan
et al., 2005) or pulsatility (Choi, Boston, & Antaki, 2005; Schima et al., 2006). Although
Bullister et al. Bullister et al. (2002) also made use of PLVED as their main input variable,
they adopted a completely different approach from the preload-based Starling-like
controller proposed in the present study. In Bullister’s method, a set point for PLVED
which lies within a physician-programmable range was chosen based on the desired range
for mean arterial pressure. Apart from this, a Level 2 control algorithm was activated
when the heart rate increased above a resting threshold value, which continuously
modified PLVED to achieve the new target value for MAP determined based on the
measured heart rate. There are several limitations associated with Bullister’s method. As
Univers
ity of
Mala
ya
63
demonstrated in previous clinical (Jacquet et al., 2011; Mancini et al., 1998; Salamonsen
et al., 2013) and simulation studies (Einly Lim et al., 2015), the level of resting PLVED
varies significantly among individuals (5 – 16.7 mmHg (Jacquet et al., 2011; Mancini et
al., 1998; Salamonsen et al., 2013)), and in the face of various physiological perturbations
in the circulatory system (5 – 9 mmHg during exercise (Jacquet et al., 2011; Mancini et
al., 1998; Salamonsen et al., 2013) and -4.5 mmHg during 700HUT (Einly Lim et al.,
2015)). Maintaining PLVED at a fixed set point in the presence of various physiological
perturbations, therefore, would require excessive variation in the pump speed. We have
shown from our previous simulation studies that constant left atrial pressure control
(equivalent to constant PLVED) caused a drastic fall in MAP upon 700HUT (Einly Lim
et al., 2015), which may lead to cases of orthostatic hypertension and subsequently affect
circulatory stability. Although Bullister et al. attempted to maintain the MAP within a
physician-programmable range, this control loop is reacting much slower, and thus may
not be able to cater for sudden circulatory stability caused by abrupt changes in the mean
pump speed. Furthermore, heart rate dependency was built into Bullister et al.’s algorithm
to increase MAP during exercise, in an attempt to further increase cardiac output. As
shown from our simulation results which integrated the reflex mechanism and previous
clinical findings (Jacquet et al., 2011; Mancini et al., 1998; Salamonsen et al., 2013), the
level of MAP is mostly determined by the circulatory system (e.g. through a change in
the venous unstressed volume and systemic vascular resistance) as well as the sensitivity
of the reflex mechanism. In addition, especially in heart failure patients, increasing
venous return produced a substantial increase in PLVED during exercise, and in most
cases more than the amount of increase in MAP. In view of this, building a MAP-heart
rate dependency into the model is redundant in most circumstances, as this may actually
slow down the response of the controller to a change in PLVED due to the slower reacting
MAP control loop.
Univers
ity of
Mala
ya

64
To the contrary, our preload-based Starling like controller emulates the Frank-Starling
control mechanism of the natural heart, which regulates stroke volume in proportion to
the level of venous return (reflected by PLVED) only. Instead of fixing a set point for
PLVED which is expected to vary significantly with different physiological
perturbations, we regulated mean pump flow in accordance to the measured PLVED using
a predefined control line (4.1), which indicates the state of the circulation and the degree
to which it is meeting the physiological requirements of the body at each instant. Apart
from that, as described in Section 4.2.2, preload sensitivity for individual patients could
be modified by changing the scaling factor (K in (4.1)) which provides a means of altering
sensitivity of the pump to changes in PLVED. In addition, we did not induce an explicit
MAP control, but instead relies on the regulation of MAP by the baroreceptors and other
circulatory reflexes (Berne, 1981). Consequently preload controller is more robust in
providing the appropriate level of blood flow to the systemic circulation under various
clinical circumstances (Einly Lim et al., 2015).
This study also indicates that due to its unique shape, a single preload control line (Frank-
Starling curve) is able to provide a major decrease in flow at low LV preloads to avoid
LV suction and to limit increases at high preloads to avoid over-pumping. Although this
study evaluates a single control line, the full controller is able to adapt to longer term
changes in the LV function and circulation by adjustment of the scaling factor for the
control line to yield different Frank-Starling curves. Having different curves with varying
gradients not only provides inherent protection against LV suction, but also determines
the degree of LV unloading. Consequently, apart from controlling the level of cardiac
output, the preload controller would be able to determine the amount of work performed
by the ventricle. Particularly, in the early postoperative phase, it is important that the
scaling factor of the control line be selected and modified accordingly by the attending
medical staff based on additional clinical requirements, besides the provision of adequate
Univers
ity of
Mala
ya

65
blood flow to the tissues. Later after implantation, the use of upper and lower limits for
PLVED and QP would enable the controller to adapt the degree of pump assistance
automatically by modifying the scaling factor of the control line (Salamonsen et al.,
2012). It is noteworthy that the upper and lower limits for PLVED and QP can be adjusted
by the clinicians to accommodate for changes in the patients’ condition over time.
4.4.3 Deficiencies of the Preload-Based Starling-Like Control
The Frank-Starling mechanism in the native heart, being a property of the myocardium,
effectively eliminates complications like LV suction, as the ventricle does not pump when
it is empty. In addition, the adjustment of the contractile force following an increase in
the myocyte length is virtually immediate, being mediated by an adjustment of the
number of myofilament cross bridges that interact, as well as by an alteration in the
calcium sensitivity of the myofilaments (Berne, 1981). In order to avoid suction in the
presence of an IRBP with low preload sensitivity, the controller must be able to
implement reference changes in QP as soon as a change in PLVED is sensed. This is a
challenge to most control methods particularly if they require an estimation of QP or
pressure head across the pump. While most published methods took two to three
heartbeats to estimate the average values of the flow (A.-H. H. AlOmari et al., 2013), only
one report estimated instantaneous flow in a pulsatile environment (A. AlOmari, A.
Savkin, D. Karantonis, E. Lim, & N. Lovell, 2009). Similarly, estimation of PLVED
presents difficulties, with only one report existing for non-invasive estimation of the mean
diastolic pressure, which is closely related to PLVED (A.-H. AlOmari et al., 2011).
Therefore, PLVED measurement by pressure transducers is clearly superior because the
response is instantaneous.
The approach described herein involves direct LV preload adjustment, but does not
induce an explicit MAP control. In contrast to a previous study, which implemented MAP
Univers
ity of
Mala
ya

66
control (Bullister et al., 2002), the preload controller relies on the regulation of MAP by
the baroreceptors and other circulatory reflexes (Berne, 1981). Attending medical staffs
usually provide additional pharmacological control of systemic blood pressure if
required. This usually takes the form of vasodilators rather than vasoconstrictors due to
the over action of the sympathetic nervous system in response to the low cardiac output
seen in most heart failure patients.
4.4.4 Inadequacies of the Study and Future Work
The model used in this study has been well validated against animal studies conducted by
our group and reported in the scientific literature (Einly Lim et al., 2012b; Einly Lim et
al., 2015). In our study, the PLVED was obtained from the model at end diastole of each
heartbeat. However, in reality, it may need to be averaged over two or three heartbeats
due to the presence of measurement noise (Maeda, Tsutamoto, Wada, Hisanaga, &
Kinoshita, 1998), especially if there are abnormalities in the cardiac rhythm. Similarly,
new values for QP will also take at least one or two heartbeats to be measured. It thus
remains to be tested if the controller is able to adjust QP quickly enough to avoid suction
during changes in posture, protracted abdominal straining, or coughing in the implanted
subject, where the fall in PLVED may be rapid. These points will be addressed in future
work.
4.5 Conclusion
This study establishes the clear superiority of the preload control over both constant speed
and pulsatility control modes. It provides safe and effective adjustments of QP despite the
widely varying states of exercise, blood loss and a fall in LV contractility. This provides
impetus for continued efforts to develop miniaturized pressure transducers that are stable
over time and small enough to be embedded into the inlet and outlet pump cannula
without distortion to their normal shape, thus avoiding flow disturbance and consequent
formation of blood clots.
Univers
ity of
Mala
ya
67
CHAPTER 5: THE ROBUST PRELOAD-BASED CONTROL
5.1 Introduction
Left ventricular assist devices are mechanical pumps that now enjoy a clinically accepted
role in supporting the failing heart in a number of scenarios, including destination therapy,
bridge to recovery and bridge to transplantation. Implantable rotary blood pumps are
continuous flow ventricular assist devices that have become increasingly popular due to
the negligible blood trauma along with their light weight and small size, which facilitate
their usage for in-home patient care (D. Timms, 2011). Currently, most commercially
available IRBPs still function at a fixed speed predetermined by physicians, which is
insensitive to changes in the metabolic requirements of the patients (Salamonsen et al.,
2011). Such insensitivity increases the risk of over-pumping, causing left ventricular
suction, or under-pumping, which can cause pulmonary congestion, renal insufficiency
and other problems (Salamonsen et al., 2013).
Moreover, many of so-called physiological control methods were developed based on the
pulsatility index (M. A. Bakouri et al., 2013; Nicholas R. Gaddum et al., 2014;
Salamonsen et al., 2012; Schima et al., 2006). Pump pulsatility (flow, current, pressure
gradient, or speed) is a consequence of LV contraction whereas LV preload is one of the
determinants of LV contraction. With severe LV failure, as is the case for all LVAD
recipients, the LV does not have the ability to induce major changes in pulsatility.
Therefore, the dynamic range of the pulsatility index is small, and therefore its ability as
a control input is limited. In the extreme case where LV contractility is zero, pulsatility
control is not feasible. By contrast, LV preload increases as LV failure progresses, and its
dynamic range is wide in the presence of LVAD (Mansouri et al., 2015).
These deficiencies have driven the development of physiological control methods to
match pump output to physiological requirements. Recently, researchers have proposed
a number of studies using a novel technique called Frank-Starling-like control (FSLC)
Univers
ity of
Mala
ya

68
(Bullister et al., 2002; Mansouri et al., 2015). A preload-based controller (Mansouri et al.,
2015) was developed based on a modification of the Frank-Starling response first
proposed by Guyton (Arthur C Guyton, 1965). The controller adjusts IRBP speed to relate
total cardiac output to LV preload as represented by left ventricular end-diastolic pressure
using a Frank-Starling curve representative of a healthy human.
Developing a controller with fast response that can reach the pump flow set point within
ten seconds (Salamonsen et al., 2012) is a real challenge in any physiological control
system, because a slow response may result in suction after hemorrhage or changes in
posture. Additionally, one of the main concerns relating to preload control
implementation regards measuring LV pressure. Currently available implantable pressure
transducers are rendered virtually unusable due to a range of problems; particularly, the
noise (disturbance) that generally affects the signal measured in ventricular pulsatility
waveform (Lin et al., 2014).
PID is a standard controlling method widely used in biomedical field. Two main
approaches to tune the PID controller that is either a) tight control that makes the fastest
possible response , or b) smooth control that tunes the PID how to achieve acceptable
disturbance rejection (Skogestad, 2006). The cited matters signified the importance of
providing a controller that not only could react to the changes swiftly, but also could
function robustly under noisy operational conditions, the tasks PID could not perform
properly. On the contrary, there are publications have demonstrated sliding mode control
(SMC) is robust in various applications (M. Bakouri, Savkin, & Alomari, 2015; M. A.
Bakouri et al., 2013; Elsayed, Hassan, & Mekhilef, 2013; Shahnazi, Shanechi, & Pariz,
2008) and in delivering swift system response, minimal overshoot and high tolerance to
noisy sensor signals (Shahnazi et al., 2008). Herein, an experimentally validated
mathematical model of the cardiovascular system (CVS) and VentrAssist LVAD (Einly
Lim et al., 2015) enriched with a baroreflex module was employed to compare preload-
Univers
ity of
Mala
ya

69
based and fixed speed operational mode. We advanced the hypothesis that the preload-
based SMC is superior to the preload-based proportional-integral-derivative (PID)
(Bubnicki, 2005) control in terms of speed of response and handling noisy feedback
signals.
This chapter is organized as follows. Section 5.2 presents the study methodology, which
provides a detailed description of the heart chamber and circulatory model with emphasis
on the ventricles’ pressure-volume relationship. The regulatory reflex mechanism is also
explained in detail. Moreover, the methodology section includes the LVAD component,
preload-based control, sliding mode design and implementation, and simulation
protocols. The methodology section concludes by describing the performance evaluation
criteria, and controller performance assessment from a clinical and engineering
perspective. Section 5.3 presents the effect of adding a baroreflex module on the temporal
behavior of the CVS key parameters during hemodynamic transition, a comparison of
fixed speed and preload-based methods under ideal conditions, and a robustness
assessment of the different preload-based methods with noisy feedback signals. Section
5.4 comprises an extensive discussion of the results attained, presents the clinical and
control implications, and a comparison of the results with the literature. Finally,
inadequacies of this study and future works as well as concluding remarks are given in
Sections 5.5 and 6.6 respectively.
5.2 Methodology
5.2.1 Model Description
The numerical model consists of two main components: the CVS and the LVAD. The
model has been extensively validated using both in vivo and in-vitro experiments, and
has proven to be able to replicate the response of the LVAD-assisted patients to exercise
and head up tilt (Einly Lim et al., 2010; Einly Lim et al., 2015). A heart failure scenario
(NYHA Class II & III) was simulated by carefully modifying the parameters associated
Univers
ity of
Mala
ya

70
with heart failure to ensure that realistic hemodynamics was achieved (Table 5.1). A
detailed description of the CVS model integrated with an IRBP for different heart failure
scenarios is given in (Einly Lim et al., 2015; Mansouri et al., 2015).
Table 5.1: Hemodynamic data for the normal and heart failure conditions.
Variable (unit) Normal
Heart
Failure
Mean arterial pressure (mmHg) 88.4 87.9
Mean left atrial pressure (mmHg) 6.7 24.4
Mean pulmonary arterial pressure (mmHg) 15.3 34.1
Heart rate (bmp) 68.8 82.3
Mean cardiac output (L/min) 4.84 3.51
Systemic vascular resistance (mmHg.s.mL-1) 1.04 1.34
Left ventricular end diastolic volume (mL) 122.7 185.8
5.2.1.1 CVS Component
The lumped CVS model consists of ten compartments including the left and right sides
of the heart as well as pulmonary and systemic circulations.
i. Heart Chambers: The chambers’ states vary from exponential during diastole to
linear during systole, depending on the time-varying elastance function (el(t))
(Sagawa, Maughan, Suga, & Sunagawa, 1988). A linear end systolic pressure–
volume relationship (Sagawa et al., 1988) is adopted for both the left and right atria
and also to describe the left and right ventricles. Moreover, the systolic period
duration is assumed to change linearly with heart rate (Ursino, 1998). A detailed
description of the heart chambers is provided in (Einly Lim et al., 2010; Einly Lim
et al., 2012b). The heart valves are modeled in this study using resistance (R) in
Univers
ity of
Mala
ya
71
series with a diode, permitting flow to pass only when the pressure gradient across
them is positive. The flow through a valve is formulated as follows:
Qv = {
Pv1−Pv2
R, Pv1
> Pv2
0, Pv1≤ Pv2
(5.1)
where Pv1 and Pv2 are the upstream and downstream valve pressure respectively,
and Qv represents the blood flow through the valve.
ii. Circulatory Model: The circulatory model consists of both systemic and pulmonary
circulations. The systemic circulation is partitioned into six parallel vascular
compartments (Einly Lim et al., 2015). In accordance with Einly Lim et al. (2013),
the net volume change for each compartment is:
Vi = Qi − Qi+1 (5.2)
where Qi and Qi+1 are the inflow and outflow respectively. Based on the linear PV
relationship, the pressure in the ith compartment, Pi, is given by:
Pi = Ei(Vi − V0,i) + Pe,i (5.3)
where Pe,i stands for the extravascular pressure, Vi and V0,i represent the volume
and unstressed volume of the compartment, and Ei is the compartment elastance.
iii. The Regulatory Reflex Mechanism: The regulatory model comprising both arterial
and cardiopulmonary (CP) baroreceptors was adopted from Ursino (1998) and E
Magosso and Ursino (2002). The model incorporates the afferent pathways from
the baroreceptors together with the associated efferent sympathetic and
parasympathetic activities. The afferent arterial baroreflex pathway is formulated
as a function of the arterial pressure, while the afferent CP baroreflex pathway is
modeled as a function of the central venous pressure. The model describes the
response of several distinct effectors including heart contractility, peripheral
resistance, unstressed volumes, and heart rate (Einly Lim et al., 2013; Einly Lim et
al., 2015). A detailed description of the regulatory model is given in (Einly Lim et
Univers
ity of
Mala
ya

72
al., 2013; E Magosso & Ursino, 2002; Ursino, 1998).
5.2.1.2 LVAD Component
VentrAssist LVAD is a centrifugal blood pump with hydrodynamic bearings. Three
differential equations are applied to model each pump component: the motor winding
electrical equation, electromagnetic torque transfer equation, and pump hydraulic
equation. A detailed description and validation procedure of the LVAD model are
available in (Einly Lim et al., 2012b).
5.2.2 Preload-Based Control
The immediate response of the preload-based control emulates the Frank-Starling control
mechanism of the natural heart. The Frank-Starling curve forms the basis of the control
line, which defines the target pump flow for any specific PLVED. The control line is
generated by a third-order polynomial function (4.1) fitted directly to Guyton’s data
(Arthur C Guyton, 1965).
In our study, the model automatically samples PLVED at end diastole of each heart cycle
and supplies it to the controller. Although the full controller is able to adapt to longer term
changes in the circulation by adjustment of the scaling factor (K), this communication
deals only with the immediate response of the controller in which changes in PLVED
cause migration of the operating point to different positions on CL.
Any changes in state (Figure 5.1) cause deviations of the system operating point from the
original position on the control line to system-line S2 or S3. The controller then forces the
operating point back to the control line along a linear path, which conforms closely to the
trajectories of the linearized system lines, as described previously by Mansouri et al.
(2015). Changes in state are thus countered by moving the target operating point up or
down the control line. The pump flow defined by each new location of the operating point
on the control line is the set-point value to be attained for the next iteration.
Univers
ity of
Mala
ya

73
Figure 5.1: Block diagram of control systemUnivers
ity of
Mala
ya

74
5.2.3 Sliding Mode Controller
5.2.3.1 Estimator
In this study, two autoregressive exogenous (ARX) dynamic linear time-variant models
were employed to estimate the mean pump flow. The first ARX model was established to
model the relation between PLVED and mean pulse-width modulation signal (PWM ), and
the second ARX model was developed to model the relation between estimated averaged
pump flow (QP ) and estimated PLVED (PLVED ) as follows:
x1[k + 1] + a[k]x1[k] = b[k]u[k] + e1[k], (5.4)
x2[k + 1] + c[k]x2[k] = d[k]x1[k] + e2[k], (5.5)
where x1[k] is the estimated PLVED, x2[k] is the estimated QP , u[k] is the mean PWM,
a[k], b[k], c[k] and d[k] are time-varying model parameters, and e1[k] and e2[k] are the
noise components. For the SMC controller design, the system defined in (5.4) and (5.5)
was reformatted as a linear time-varying (LTV) state space system in the following form:
{��[k + 1] = 𝐀[k]��[k] + 𝐁[k]u[k] + e[k],
y[k] = 𝐂 x[k], (5.6)
where 𝐀[k] = [−a[k] 0
d[k] −c[k]] , 𝐁[k] = [
b[k]0
] , 𝐂 = [0 1] , ��[k] = [x1[k] x2[k]]T ,
e[k] = [e1[k] e2[k]]T and y[k] are the system output. Model parameters a[k], b[k], c[k]
and d[k] were estimated using the ARX recursive least square algorithm. With this model,
the experimental results showed that a[k], c[k] and d[k] are bounded and parameter b[k]
is close to a constant value. Therefore, the state space model in (5.7) can be reformulated
as:
{��[k + 1] = (𝐀 + δ𝐀)��[k] + 𝐁u[k] + e[k],
y[k] = 𝐂 x[k], (5.7)
where δA is the system parameter variation and e[k] is the system disturbance. Figure 5.2
shows that all system poles and zeros resides within the unit circle, thus guaranteeing the
system’s stability criteria (Levine, 1996).
Univers
ity of
Mala
ya

75
Figure 5.2: Poles-zeros of the model estimator.
5.2.3.2 Sliding Mode Control Design
Discrete sliding mode control (DSMC) is normally defined based on the state-space
model (Monsees, 2002). In this case, the design is divided into two steps, a) choosing an
appropriate switching function, and b) establishing a control law. The switching function
for the system (5.7) is defined as:
s[k] = S��[k] (5.8)
where S is a constant vector designed based on the pole placement technique to assure
that ��[k] is asymptotically stable on s[k] = 0 (Gao, Wang, & Homaifa, 1995).
So far, multiple control techniques with different reaching laws have been proposed for
SMC (Bartolini, Ferrara, & Utkin, 1995; Gao et al., 1995). Gao’s reaching law explains
the ideal conditions to guarantee robust reachability and perfect sliding motion as follows
(Gao et al., 1995):
s[k + 1] = (1 − τT)s[k] − ϵTsgn(s[k]), {
sgn(r) = 1, r > 0
sgn(r) = 0, r = 0
sgn(r) = −1, r < 0
(5.9)
The following conditions must be satisfied in the equation above:
0 < 1 − τT < 1 (5.10)
0 < ϵT < 1 (5.11)
Univers
ity of
Mala
ya

76
T > 0, ϵ > 0, 𝜏 > 0 (5.12)
where T stands for the sampling period, ϵ is the reaching velocity and τ represents the
converging exponential.
To satisfy the reaching law in (5.8), we have:
s[k + 1] = S��[k + 1] (5.13)
Then from (5.9) and (5.13), the following is obtained:
s[k + 1] = S��[k + 1] = S(𝐀x[k] + δ𝐀x[k] + 𝐁u[k] + e[k]) (5.14)
Equating (5.9) and (5.14) results in:
S𝐀��[k] + Sδ𝐀��[k] + S𝐁u[k] + Se[k] = (1 − τT)s[k] − ϵsgn(s[k]) (5.15)
Solving the equation above for u[k] results in:
u[k] = −(S𝐁)−1 (S𝐀��[k] − (1 − τT)S��[k] + ϵTsgn(s[k])) −
(SB)−1(Sδ𝐀��[k] + Se[k]) (5.16)
The equation above can be used if (Sδ𝐀��[k] + Se[k]) is bounded (M. Bakouri et al.,
2015):
−βs < (Sδ𝐀��[k] + Se[k]) < βs (5.17)
Thus, the final control algorithm could be reformulated as:
u[k] = −(SB)−1(S𝐀��[k] − (1 − τT)S��[k] + (ϵT + βs)sgn(s[k])) (5.18)
where βs stands for the maximum system variation (M. Bakouri et al., 2015), as
determined as follows:
(βs < (Sδ𝐀��[k] + Se[k])) < βs ≡ (βssgn(s[k])) (5.19)
It should be noted that high frequency chattering does not exist in discrete variable
structure controller in general, especially when the system sampling period is low (Gao
et al., 1995). However, chattering-like phenomena that may arise in system with high
sapling frequency could be alleviated using chattering placement techniques (Hung,
1993).
Univers
ity of
Mala
ya

77
5.2.3.3 Tracking Design
We simplified our dynamic ARX system identifier for the sliding mode control design
and implementation; however, it reduced the controller’s sensitivity and estimation
accuracy; thus, a pole-placement tracking module added to counter the deficiencies of
such simplification. In our controller design, the tracking performance is achieved by the
modified state feedback control as follows:
usf[k] = −Kcl [QP [k] PLVED [k]]T + QPRef
[k] (5.20)
where usf is the pole-placement output fed to sliding and Kcl stands for the state-feedback
gain matrix. As a result, the final sliding mode control input signal, ufi[k], can be written
as:
ufi[k] = usf[k] + u[k] = −Kcl [QP [k] PLVED [k]]T + QPRef
[k] + u[k] (5.21)
5.2.3.4 System Design Results
The design parameters of the sliding controller were given as 𝐀 = [0.78 00.06 0.94
] , 𝐁 =
[0.50
], ϵ=2.5, 𝜏= 5.0, and S = [−2.0 1.0] for (5.18), while the state-feedback gain
matrix, Kcl was given as [1.5 1.0]. A block diagram of the control system is illustrated in
Figure 5.1.
5.2.4 Simulation Protocol
The models were implemented using the Simulink toolbox in MATLAB (The
Mathworks, Inc., Natick, MA, USA) with a sampling period of 0.005 s. Simulations of
the baseline state at rest, exercise, and after blood loss were conducted in the ideal
condition (no noise) and in the presence of disturbance. A relative intensity of 0.55 was
selected for the exercise simulation to represent the maximal exercise condition as defined
by Einly Lim et al. (2015), whilst the total blood volume was reduced by 1000 mL to
mimic the hemorrhage condition (Mansouri et al., 2015). For all simulations, an
Univers
ity of
Mala
ya
78
immediate transition from the baseline to the respective test scenario was performed after
the hemodynamic variables reached steady state conditions. The simulation was then
sustained for a sufficient length of time to allow the system to achieve post-transition
steady state.
In order to determine the optimal scaling factor (K) for CL, another set of simulations was
conducted in the baseline state, where K was increased from a basal value of 0.2 to the
maximal value of 2.3 in 0.1 increments. Blood flow through the aortic valve (Qav ) was
obtained from the model to indicate whether the aortic valve was opening or closing. The
optimal scaling factor was identified as the minimum value of K that allowed the aortic
valve to be closed in the baseline condition. In the present study, K value was set to 1.0.
Both PID and SMC methods were initially tuned to (i) provide a 5% settling time within
10 s, and (ii) generate a maximum of 10% overshoot of the final value under no noise
condition (Mansouri et al., 2015). In this study, the PID gains were chosen using the
standard Ziegler-Nichols(Ziegler & Nichols, 1942) method how KP, KI and KD, to be
0.28, 0.22 and 0.05 respectively, while the SMC parameters were given in section 5.2.3.
The current study progressed with assessing the robustness of the preload-based control
implementations against external disturbances. The two levels of normal Gaussian noise
employed in this study were signal-to-noise ratios of 15 dB (corresponding to unified
white noise with ±3.0 mmHg amplitude -- the upper bound of a non-invasive estimator
error reported by A.-H. AlOmari et al. (2011)) and 7 dB (corresponding to unified white
noise with ±6.0 mmHg amplitude).
5.2.5 Performance Evaluation
Four performance metrics, with each assessing a different aspect of performance, were
used to provide a quantitative comparison among the different control methods. First, the
set-point tracking performance of each strategy was evaluated by calculating the mean
Univers
ity of
Mala
ya

79
absolute error (MAE) between the set point and the actual value of the average pump
flow. MAE is the average absolute set-point deviation per second, expressed as a
percentage of the target value (5.22) (M. C. Stevens, 2014).
MAE =1
Td∫ |
A(t)−Y(t)
A(t)|
Td
0 (5.22)
where Td stands for the whole simulation length, A is for the target value and Y is the
actual value.
Secondly, the root mean squared hemodynamic deviation (RMSHD) (Michael C Stevens
et al., 2014), which measures the average deviation per second of the mean arterial
pressure, PLVED, and mean cardiac output from their respective predefined
physiological limits, was evaluated. These variables were selected because physicians are
typically concerned with more than just cardiac output when setting the pump speed
(Boston et al., 2003). During LVAD support, mean arterial pressure should be kept within
physiological limits and PLVED must not be reduced (otherwise it may lead to increased
suction risk) or elevated (as it may lead to pulmonary edema) beyond the thresholds.
Moreover, cardiac output must remain within a safe range to guarantee end-organ
perfusion. The upper and lower limits for the three hemodynamic parameters shown in
Table 5.2 were selected based on discussions with the clinicians. RMSHD is important
because it delivers a clinical context for identifying controller performance (Michael C
Stevens et al., 2014). For example, there might be a controller with a good set-point
tracking performance (i.e. low MAE), but which results in high cardiac output and
reduced PLVED. While low MAE means the control system exhibits acceptable tracking
performance, low RMSHD promises good physiological performance.
For calculating RMSHD, let yx stands for any of the three previously mentioned
hemodynamic variables, and let LLx and ULx define the lower and upper limits of a safe
operating bound for that variable, respectively. The normalized square deviation
(NSDx(t)) of yx(t) outside of LLx and ULx is calculated as follows:
Univers
ity of
Mala
ya

80
NSDx(t) = (vx(t)
LLx+ULx2
)
2
(5.23)
where
vx(t) = {
yx(t) − ULx; yx(t) > 𝑈Lx
0; LLx < yx(t) < 𝑈Lx
LLx − yx(t); yx(t) < 𝐿Lx
(5.24)
Table 5.2: Upper and lower limits for three key hemodynamics variables.
Variable (unit) Lower Limit Upper Limit
Mean arterial pressure (mmHg) 65 105
Left ventricular end diastolic pressure (mmHg) 2 15
Cardiac output: Rest and hemorrhage (L/min) 4 7
Cardiac output: Exercise (L/min) 7 11
Equation (5.25) formulates the squared hemodynamic deviation (SHD) of variable yx:
SHDx = ∫ NSDx(t)Td
0 (5.25)
Finally, RMSHD is calculated as (5.26):
RMSHD = (1
Td) √(SHDPao
2 + SHDPLVED2 + SHDCO
2 ) (5.26)
It should be noted that comparable weightings were chosen for the SHD variables in
(5.26) because physicians consider all these variables equally when setting pump speed
(Boston et al., 2003). When comparing physiological control systems, a system with the
lowest RMSHD is considered best at maintaining key hemodynamic variables.
Additionally, the length of time that LV spends in suction for each control strategy was
measured and calculated. In the proposed model, LV suction is represented by a negative
PLVED (i.e. PLVED<0 mmHg) (Mansouri et al., 2015). Index ρ is expressed as a
percentage of total simulation time during which suction occurs (5.27):
ρ =∑ ∆ti
i=Isi=1
T× 100 (5.27)
where ∆ti is the ith interval over which the actual pump speed exceeds the suction speed
and Is is the number of such intervals. Finally, η serves as a measure of how deep, on
Univers
ity of
Mala
ya

81
average, the pump speed progresses into the suction region.
η =ωs −ωs
ωs× 100 (5.28)
where ωs is the speed at which suction occurs (3200 rpm and 2600 rpm for exercise and
blood loss scenarios, respectively) and ωs is defined by:
ωs =∑ ∫ ω(t)dt∆ti
Ii=1
∑ ∆tiIi=1
(5.29)
5.3 Results
5.3.1 Dynamic Cardiovascular Response to Exercise and Blood Loss under
Constant Speed Mode
The temporal patterns of the arterial pressure and pump flow while transitioning from rest
to exercise and blood loss are shown in Figure 5.3. In line with E Magosso and Ursino
(2002), the simulated transient patterns for exercise displayed three distinct phases: i)
initial phase lasting approximately 5 s, ii) middle phase lasting around 25 s, and iii) steady
state phase. In the early phase of transition to exercise, heart rate and cardiac output
delivery increased immediately with relatively unchanged peripheral resistance, leading
to an immediate rise in PSA. Entering the second phase, the total peripheral resistance
smoothly reduced with a slower dynamic, resulting in a significant drop in PSA.
Consequently, the baroreceptor acted to restore the PSA by increasing systemic venous
tone, heart rate, and cardiac contractility. In contrary to PSA, pump flow was observed to
increment gradually from rest to exercise. Immediately after blood loss, reduction in
cardiac output led to a substantial drop in PSA (Figure 5.3 (B)). On the contrary, QP
demonstrated a transient rise initially due to a reduction in the pump differential pressure
(caused by a drop in PSA). The reflex mechanism then reacted to increase PSA by
constricting the vessels, increasing heart rate, cardiac contractility and venous tone.
Consequently, PSA increased gradually while QP fell, leading to a lower value as compared
to the original levels.
Univers
ity of
Mala
ya

82
Figure 5.3: Arterial pressure and pump flow from baseline to (A) exercise and (B) blood loss, at the constant speed mode. Mean arterial pressure and mean pump flow from baseline
to (C) exercise and (D) blood loos at no noise condition, preload-based control methods. Univ
ersity
of M
alaya

83
5.3.2 Controllers Comparison
5.3.2.1 Noise Free Condition
The performance of the fixed speed mode and the two preload-based implementations
(i.e. PID and SMC) was compared by observing the changes in QP , CO , and MAP from
baseline to exercise and from baseline to a blood loss state. There was no significant
difference between the two preload implementation methods (Figure 5.3 (C) and
Figure 5.3 (D)). A comparison with the constant speed operational mode indicated that
the preload-based control was the better modality, as it provided a 51% increase in QP
and 64% increase in CO during transition to exercise. The flow increments were
associated with a lower PLVED value of 15.6 mmHg, indicating less load on the LV
(Table 5.3). On the contrary, the constant speed mode increased mean pump flow by 20%
only, corresponding to a higher load on LV (PLVED of 18.9 mmHg).
Univers
ity of
Mala
ya

84
Table 5.3: Model simulated hemodynamic data at baseline (rest), exercise, and blood loss with constant speed and preload-based controllers.
Variable (unit) Rest Exercise Blood Loss
Constant Speed/
Preload
Constant Speed Preload Constant Speed Preload
ω (rpm) 2600 2600 2980 2600 2115
MAP(mmHg) 103 101 104 96 84
Pla (mmHg) 9 21 19 4 5.4
PLVED (mmHg) 7.4 18.9 15.6 -0.4 4.9
CO (L/min) 5.6 8.9 9.2 5.3 4.4
QP (L/min) 5.6 6.7 8.5 5.3 3.7
Qav 0.0 2.2 0.6 0.0 0.7
LVEDV 147 170 161 120 146
Univers
ity of
Mala
ya

85
Suction is the challenge faced in automated LVAD control during a blood loss scenario.
During hemorrhage, a preload-based LVAD control system can avoid this crucial state
by reducing its flow output sufficiently to match an ample volume reduction in the right
ventricle. During the transition from baseline to blood loss, the preload-based controller
was able to maintain PLVED at 4.9 mmHg compared with -0.4 mmHg for the constant
speed control system. A negative value for PLVED indicates a suction event when using
the constant speed system (Mansouri et al., 2015).
Analytical data (in Table 5.4) shows that the incidence of suction under constant speed
mode lasted for 8.8% of the entire blood loss simulation, although the suction depth was
only 0.1%. The results also illustrate the fixed speed mode’s deficiency in maintaining
hemodynamic variables within clinically acceptable limits. While RMSHD was nearly
zero for both preload-based methods, a major hemodynamic deviation of 13.0% was
recorded for the fixed speed mode.
Univers
ity of
Mala
ya

86
Table 5.4: Mean absolute error (MAE), root mean squared hemodynamic deviation (RMSHD), suction duration and suction depth for mean QP (pump flow) in each control strategy
subject for Constant speed, PID preload-based and SMC preload-based testing protocol at noise free and noisy conditions.
SNR
(dB)
Control
strategy
Rest Exercise Blood Loss Summation
M ρ R M ρ R M ρ R M ρ η R
no noise
Constant Speed --- 0.0 0.0 --- 0.0 11.2 --- 8.8 1.8 --- 8.8 0.1 13.0
Preload-PID 1.9 0.0 0.0 2.3 0.0 0.6 4.7 0.0 0.0 8.9 0.0 0.0 0.6
Preload-SMC 1.8 0.0 0.0 2.2 0.0 0.3 4.3 0.0 0.0 8.3 0.0 0.0 0.3
15
Preload-PID 9.8 0.0 0.0 5.2 0.0 0.7 16.5 0.0 0.0 31.5 0.0 0.0 0.7
Preload-SMC 7.1 0.0 0.0 4.4 0.0 0.4 13.5 0.0 0.0 25.0 0.0 0.0 0.4
7
Preload-PID 19.9 0.0 0.0 10.4 0.0 1.0 134.2 26.1 18.7 164.5 26.1 19.2 19.7
Preload-SMC 10.6 0.0 0.0 7.7 0.0 0.8 20.4 0.0 0.4 38.7 0.0 0.0 1.2
Univers
ity of
Mala
ya

87
5.3.2.2 Noisy Condition
The results in Table 5.4 indicate that SMC delivered better control and physiological
performance than PID under noisy conditions. With an SNR of 15 dB, PID tracking
performance dropped to 31.5% whilst the SMC controller improved the system
performance by 6.5% and maintained MAE of 25%. The results also portrayed no
significant degradation in hemodynamic performance in either method, as reflected by
the low RMSHD values. At a higher noise level (SNR = 7 dB), the SMC controller led to
a final MAE of 38.7%, demonstrating a superiority over the PID system with a MAE of
164.5%. During blood loss, the PID could not tolerate the noisy preload feedback signal
and failed. The failure resulted in a dramatic pump flow increment, and a persistent
negative PLVED was observed for the remaining simulation (26.1% of the entire
simulation). The suction penetration was reportedly very deep (19.2%), which led to a
vast hemodynamic deviation (RMSHD) of 19.7% compared with the RMSHD value of
1.2% when using the SMC system.
5.4 Discussion
Herein we initially developed a baroreflex model and integrating with the original
cardiovascular system (CVS) that could properly replicate the dynamic CVS response to
exercise and hemorrhage variations. Such completion realize to study the dynamic
behavior of CVS whist transferring from the baseline condition to exercise and blood loss
under both constant speed and Preload-based controller. Moreover, this article is within
the first studies utilizing sliding mode controller for IRBP control. We could claim that it
is the first publication demonstrating a robust physiological LVAD control that could
tolerate different levels of noisy feedback signals in the transition from baseline to
different hemodynamic alternations. The SMC consistently outperformed the PID
control, whose hemodynamic maintenance performance was inferior even to the constant
speed mode in the presence of a noisy feedback signal. These results are in agreement
Univers
ity of
Mala
ya

88
with recent studies (M. Bakouri et al., 2015; Gwak, Kim, Lee, Park, & Kim, 2015), which
highlighted the superiority of the SMC.
5.4.1 Preload-Based Frank-Starling-Like Control
Deficiencies in the fixed speed operational mode have motivated researchers to develop
various physiological responsive controllers. Bullister et al. (2002) established a
controller that uses PLVED as its main input variable, where its set point was chosen to
lie within a physician-programmable range based on the desired range for MAP. One
limitation of this method was that maintaining PLVED at a fixed set point in the presence
of various physiological perturbations would require excessive variation in the pump
speed, as the level of resting PLVED varies significantly among individuals and in the
face of different perturbations in the circulatory system.
On the other hand, the current preload-based control method emulates the Frank-Starling
mechanism of the natural heart, where the stroke volume is regulated in proportion to the
level of the venous return (reflected by PLVED) using a predefined control line (4.1). In
addition, modifying the scaling factor (K) provides a means of altering pump sensitivity
to the change in PLVED. As shown in our simulation results (Figure 5.3, Table 5.3, and
Table 5.4), the preload-based controller outperforms the conventional fixed speed
operational modes during exercise and blood loss. With exercise, although mean pump
flow naturally increases at a constant speed mode (Salamonsen et al., 2013), preload-
based control, upon sensing a simultaneous increase in the preload (PLVED), further
enhances the increment of the average pump flow. On the other hand, the preload-based
control responds to a preload reduction in blood loss by reducing QP to avoid LV suction
(Mansouri et al., 2015). Consequently, the preload-based control generates a lower MAP
than constant speed during the steady state for blood loss scenario (Figure 5.3 (B) and
Figure 5.3 (D)). However, during the occurrence of severe blood loss event, the PLVED
will keep reducing and eventually compromising the cardiac output, in which case an
Univers
ity of
Mala
ya

89
alarm should be raised to alert the clinician or caregiver that the patient needs volume
treatment.
5.4.2 Comparison between SMC and PID controllers
This is the first study which demonstrates the proper functionality of SMC with the
recently proposed preload-based method (Mansouri et al., 2015) for physiological control
of an LVAD. The present data analysis signified that employing SMC consistently results
in superior tracking performance and less hemodynamic deviation as compared to the
PID controller, which is in agreement with previous research works (M. Bakouri et al.,
2015; M. A. Bakouri et al., 2014; Gwak et al., 2015).
Under an ideal (noise free) condition, the SMC delivered a marginally better set-point
tracking performance and respectively less hemodynamic deviation as compared to the
PID controller. This issue originates from the SMC adaptive rule (5.21). The
cardiovascular system is uncertain and time-varying, thus a physiologic control system
must maintain stability and deliver fast responses in such a dynamic system. Most
conservative control systems, which are vulnerable to oscillations, fail to provide a fast
enough response to preload changes, thus increasing the suction risk. While utilizing the
SMC provides a flexible controlling law, a rapid response provided by setting a high KP
gain for the PID results in an underdamped transient response, overshooting and pump
oscillations (Goodwin, Graebe, & Salgado, 2001).
The derivative component in the PID system (KD) was added to compensate for the
unwanted effect of having a high KP gain. However, this comes at a cost of amplifying
the process noise, resulting in huge output alternation. Consequently, although the noise
added to the preload feedback signal affected both methods by degrading the tracking
performance, the influence was more deleterious to the PID system (Figure 5.4 and
Table 5.4). The results showed that both PID and SMC could tolerate a lower noise level
(SNR = 15 dB) at the cost of increasing MAE; however, their hemodynamic indices
Univers
ity of
Mala
ya

90
(RMSHD) were relatively unaffected. At higher noise level (SNR = 7 dB), the PID system
collapsed and the system penetrated deeply into the suction zone during blood loss. This
was associated with a large MAE (165%) and a dramatic RMSHD increment (19.7%).
On the contrary, the SMC tracking performance dropped 39% only with a minor (1.2%)
deviation of the hemodynamic indices, indicated by RMSHD. In particular, the derivative
component of the PID controller responded to the substantial drop in PLVED with larger
amounts of change in the output. At a high noise level with a SNR of 7 dB, such large
output oscillations rendered the system unstable and finally caused an abrupt speed
increment, exceeding the suction threshold of 2600 rpm. On the other hand, the SMC
inherently provided robustness in facing large perturbations or model uncertainties
(Utkin, 2013) besides delivering a fast, zero steady state error as reflected in the smaller
MAE. The system stability prevented the sliding mode from hemodynamic instability as
marked by a negligible RMSHD value. It is noteworthy that the Gaussian noise generator
module was set automatically off as the system entered the suction zone.
Univers
ity of
Mala
ya
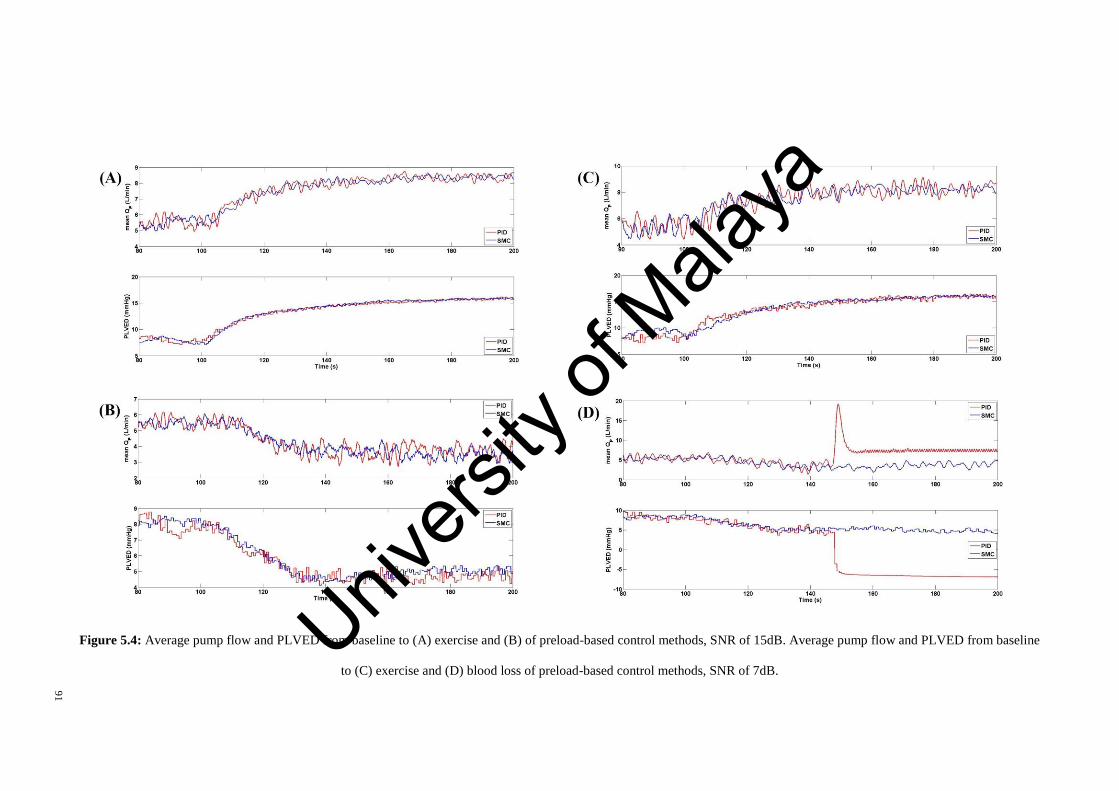
91
Figure 5.4: Average pump flow and PLVED from baseline to (A) exercise and (B) of preload-based control methods, SNR of 15dB. Average pump flow and PLVED from baseline
to (C) exercise and (D) blood loss of preload-based control methods, SNR of 7dB. Univ
ersity
of M
alaya

92
5.5 Limitations and Future Works
Although we used a numerical model in this study, it should be considered that we the
model used is a well-validated model against in-vivo data (Einly Lim et al., 2012b; Einly
Lim et al., 2015). Moreover, the numerical model developed herein could properly
replicate the dynamic CVS response to exercise and hemorrhage variations. Additionally,
a preload-based control system with a single control line was evaluated in this study, but
the full controller should be able to adapt to longer-term changes in the LV function and
circulation by adjusting the scaling factor for the control line.
Furthermore, the cardiovascular LVAD system was initially modeled using a dynamic
ARX system identifier, after which a linear time invariant system was simplified. This
simplification eased control design and implementation, although it degraded the
controller’s high activity and estimation accuracy, which was compensated by the
addition of a pole-placement tracking module. All disturbances were also assumed to be
normally distributed, where the PLVED noise was introduced using a
MATLAB/SIMULINK unified (Gaussian) white noise block. In addition, in our study,
the model automatically samples PLVED at end diastole of each heart cycle and supplies
it to the controller. Whereas in reality, PLVED has to be extracted out of the measurement
of the sensors. It is noteworthy that the detection algorithm of PLVED from sensor
measurement is beyond this study context.
5.6 Conclusion
The robustness of the physiological controller against noise is an important subject,
particularly when utilizing an implanted LVAD. A quick response to hemodynamic
change was also required because poor tracking performance may result in suction. In
this study, we compared two preload-based implementation methods (i.e. PID and SMC)
from an engineering and clinical perspective under both noise-free and noisy preload
feedback signal conditions, using a dynamic CVS-LVAD model. Four performance
metrics were used to provide a quantitative comparison between the controllers, which
Univers
ity of
Mala
ya

93
include the set-point tracking performance, hemodynamic stability, and suction
avoidance indices. The results showed no prominent difference in performance between
the PID and SMC methods in the noise-free condition. While both controllers could
tolerate a relatively lower noise level, the PID system faced system instability, substantial
hemodynamic deviation, and LV suction during blood loss. In contrast, the response of
the SMC was sufficiently rapid and robust against the noisy feedback signals.
Univers
ity of
Mala
ya

94
CHAPTER 6: THE IN-VITRO EVALUATION OF THE PRELOAD-BASED
CONTROL
6.1 Introduction
Left ventricular assist devices are the first choice in medical management for supporting
end-stage heart failure patients awaiting heart implantation. In spite of the development
of more than 30 different control methods, most LVADs are operated at fixed speeds,
adjusted manually by the physicians. The constant speed operational mode is insensitive
to changes in the metabolic requirements of the body (Salamonsen et al., 2011).
The left ventricular end-diastolic pressure naturally controls the force of LV contraction
in proportion to the blood flow it receives from the right heart and pulmonary circulation,
a mechanism commonly referred to as the Frank-Starling mechanism (Mansouri et al.,
2015). As reported by previous publications, the natural heart output control can be
emulated by providing accurate measurements of both flow and preload during VAD
support (Nicholas Richard Gaddum et al., 2012). In real instances, LVAD flow is
measured either using a flow sensor integrated in the LVAD cannula (Noon & Loebe,
2010) or estimated by non-invasive methods that use LVAD power and speed signals (A.-
H. H. AlOmari, A. V. Savkin, D. M. Karantonis, E. Lim, & N. H. Lovell, 2009). In
contrast, LV preload is not easily estimated or measured. In a recent comprehensive
review, A.-H. H. AlOmari et al. (2013) reported few instances of physiological control
based on non-invasive pressure measurements (A.-H. AlOmari et al., 2011). Although
there is a prevalent view that currently available implantable pressure transducers are
rendered virtually unusable due to a range of problems, new technology in blood pressure
measurement promises greater biocompatibility and stability over time. Troughton et al.
(2011) reported a pressure sensor with stable responses over a study period of four years.
Moreover, another publication described optical fibers that could achieve the required
stability in a constant-temperature environment of the heart and that is sufficiently small
Univers
ity of
Mala
ya

95
to be embedded in the walls of the pump inlet and outlet cannulas (Konieczny et al., 2010;
Zhou et al., 2012).
Mansouri et al. (2015) proposed a preload-based LVAD control that imitates the native
flow sensitivity to preload, but this control mode has not been validated experimentally
in an in vitro mock circulatory setting. It is therefore of interest to evaluate the
performance of the preload-based control in comparison with a constant speed operation
mode using a validated, mock circulation loop. In this work, the response of the preload-
based controller to three different test scenarios, including moderate exercise, 700 head-
up-tilt (HUT) and a major reduction in LV contractility (LVC) was assessed and
compared with the constant speed operational mode. Both steady state and transient
responses to these testing scenarios were investigated.
This chapter is organized as follows. The study methodology is presented in Section 6.2
along with a detailed description of the MCL and the preload-based control mechanism.
In addition, the methodology section includes a broad description of the simulation
protocols, which provide an accurate and repeatable hemodynamic transition from the
baseline state to exercise, HUT and LVC reduction. The methodology section concludes
with the criteria for performance evaluation. In Section 6.3, the temporal and steady state
behavior of the key parameters for the cardiovascular system (CVS) during these
hemodynamic transitions are reported. The preload sensitivity of each controller is also
assessed. Section 6.4 comprises an extensive discussion on the results attained, clinical
implications, and a comparison of the results with the literature. Finally, inadequacies of
this study and future works, as well as concluding remarks, are included in Sections 6.5
and 6.6, respectively.
Univers
ity of
Mala
ya

96
6.2 Methodology
6.2.1 Description of the Mock Circulation Loop
A physical mock circulation loop (Figure 6.1) including the systemic and pulmonary
circulations was used for this study (D. L. Timms et al., 2011). Four independent
Windkessel chambers were employed to represent the lumped systemic and pulmonary
arterial and venous compliance. The systemic and pulmonary vascular resistances were
easily manipulated by socket valves (VMP025.03X.71, AKO Alb. Klein Ohio LLC,
USA). A series of electro-pneumatic regulators (ITV2030-012BS5, SMC Pneumatics,
Tokyo, Japan) and 3/2 way solenoid valves (VT325-035DLS, SMC Pneumatics, Tokyo,
Japan) were instrumented to control ventricular systole (i.e. contractility, heart rate and
systolic interval) and passively fill the heart chambers. A Frank-Starling mechanism was
implemented for both the left and right ventricles to actively control the ventricular
pressure through the electro-pneumatic regulatory supply current based on ventricular
preload. The mitral, aortic, tricuspid, and pulmonary valves were simulated using the
mechanical check valves. The Bainbridge reflex mechanism was implemented to regulate
the heart rate in response to hemodynamic changes (Gregory, Stevens, Timms, & Pearcy,
2011). In this study, a mixture of water and glycerol (60% water/40% glycerol by mass)
was used as the working fluid to deliver asymptotic viscosity (3.5 mPa.s) and density
(1100 kg/m3) similar to that of blood at 37°C.
A VentrAssist LVAD (VentraCor, Sydney, Australia) was used to support the simulated
failing heart in the loop. The LVAD was cannulated with inflow connected to the LV and
outflow to the aorta. The left and right atrial, left and right ventricular, systemic arterial,
pulmonary arterial and LVAD inlet/outlet pressures were measured using the silicon-
based transducers (PX181B-015C5V, OMEGA Engineering, Connecticut, USA). The
systemic, pulmonary and LVAD flow rates were monitored by ultrasonic flowmeters
Univers
ity of
Mala
ya
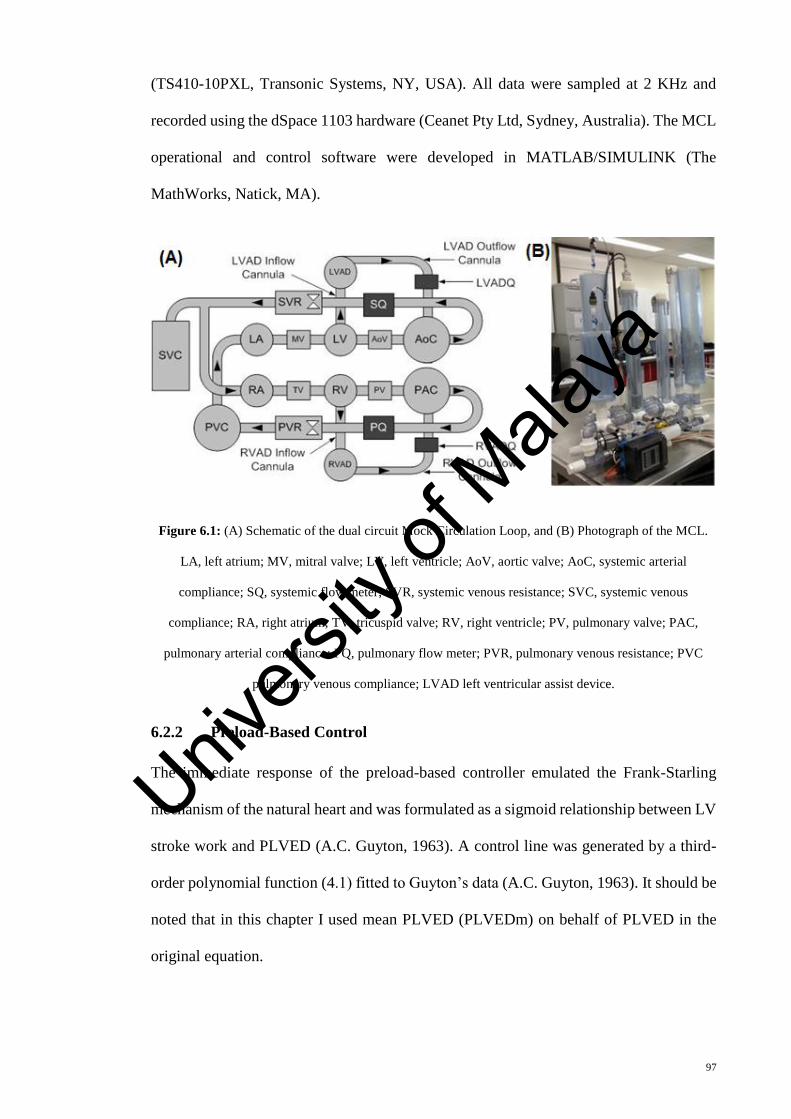
97
(TS410-10PXL, Transonic Systems, NY, USA). All data were sampled at 2 KHz and
recorded using the dSpace 1103 hardware (Ceanet Pty Ltd, Sydney, Australia). The MCL
operational and control software were developed in MATLAB/SIMULINK (The
MathWorks, Natick, MA).
Figure 6.1: (A) Schematic of the dual circuit Mock Circulation Loop, and (B) Photograph of the MCL.
LA, left atrium; MV, mitral valve; LV, left ventricle; AoV, aortic valve; AoC, systemic arterial
compliance; SQ, systemic flow meter; SVR, systemic venous resistance; SVC, systemic venous
compliance; RA, right atrium; TV, tricuspid valve; RV, right ventricle; PV, pulmonary valve; PAC,
pulmonary arterial compliance; PQ, pulmonary flow meter; PVR, pulmonary venous resistance; PVC
pulmonary venous compliance; LVAD left ventricular assist device.
6.2.2 Preload-Based Control
The immediate response of the preload-based controller emulated the Frank-Starling
mechanism of the natural heart and was formulated as a sigmoid relationship between LV
stroke work and PLVED (A.C. Guyton, 1963). A control line was generated by a third-
order polynomial function (4.1) fitted to Guyton’s data (A.C. Guyton, 1963). It should be
noted that in this chapter I used mean PLVED (PLVEDm) on behalf of PLVED in the
original equation.
Univers
ity of
Mala
ya

98
Any change in state (Figure 6.2) causes a deviation in the operating point from its original
position on the control line to other system lines (detailed descriptions provided in section
6.2.3). The controller then forces the operating point back to the control line (CLn) along
a linear path, which conforms closely to the trajectories of the linearized system lines.
Changes in state are thus countered by moving the operating point up or down the control
line. The pump speed was controlled to maintain the operating point at its intersection
between the control line and the system line.
Univers
ity of
Mala
ya

99
Figure 6.2: Block diagram of the control system. Grey circles, position of operating points after changes in states; White circle, position of operating point (current combination of
PLVED and QP ) before a change of state; Black circles, position of operating points upon arriving at the new steady state located at the intersection between the control line and the
new system line. The controller drives the changes in the operating points along the path indicated by the arrows along the new system line; PLVEDm serves as the input to the
preload controller; ∑, 1-second moving average.
Univers
ity of
Mala
ya
100
6.2.3 System Lines
In order to understand how the CVS responds to various system perturbations, the first
test was designed to define the characteristic system lines, which represent the paths
undergone by the cardiovascular system over a range of LVAD speeds. The system lines
for the baseline, exercise, HUT, and reduced LV contractility conditions during LVAD
support were obtained by increasing the mean pump speed (ω) from 1800 rpm to 2800
rpm in increments of 100 rpm. The average flow through the pump (QP ) and the aortic
valve (Qav ) as well as PLVEDm were recorded. The orientation of the system lines, which
describe the relationship between QP and PLVEDm during various hemodynamic
conditions are depicted in Figure 6.3. As shown in Figure 6.3, in spite of the wide
displacement among the system lines with varying test scenarios, the gradient of the
system lines were similar regardless of the testing scenarios, and only changed while
transitioning from AV open to AV close. For each scenario, the system gradients with
respect to the closed and open aortic valve (AV) were calculated, and the average values
were selected and tabulated in Table 6.1.
Univers
ity of
Mala
ya

101
Figure 6.3: System response to variations in mean pump flow (𝐐𝐏 ) for baseline and three test conditions. Figure also shows the superimposed control line (CLn), where the minimum
scaling factor (K) that allows the aortic valve to be closed in the baseline condition was chosen. Arrows indicate points where the aortic valve starts to open for baseline and HUT
scenarios.
Baseline
HUT
Univers
ity of
Mala
ya

102
Table 6.1: Gradients for return lines (ratio of mean pump flow to PLVED) for baseline and three test
scenarios, i.e. exercise, HUT and reduced LV contractility scenario. During exercise, the aortic valve
(AV) remained open throughout the range of speed tested, while in reduced LV contractility scenario
(Low LVC), the AV remained close.
System States
Gradient with AV Open
(L/min/mmHg)
Gradient with AV Closed
(L/min/mmHg)
Baseline -0.24 -0.32
Exercise -1.08 ---
HUT -0.62 -0.36
Low LVC --- -0.14
Mean -0.65 -0.27
6.2.4 Controller Implementation
Pump speed was measured based on the back electromotive force of the VentrAssistTM
motor coils. A proportional-integral and derivative (PID) controller was developed to
track the desired pump flow, QPRef , by adjusting the average pump speed. Equation (6.1)
defines the PID controller transfer function for tracking, automatically discretized by
MATLAB/SIMULINK using a sampling period of 0.0005 seconds.
{PID(S) = (KP +
KI
S+ KDSl) e(Sl) + ω(Sl)
e(S) = QPRef (Sl) − QP
(Sl) (6.1)
where ω stands for mean pump rotational speed and Sl is the complex number frequency.
The PID gains were tuned based on Ziegler–Nichols method (Zinober, 1990) to achieve
a 5% settling time of 10 s and a 10% maximum overshoot of the final value, in response
Univers
ity of
Mala
ya

103
to a step change in the mean pump flow set point from 1.80 L/min (corresponding to a
pump speed of 1800 rpm, i.e. the minimum operational speed) to the baseline value of
5.15 L/min. The resultant PID controller gains, KP, KI and KD were set to 130, 162.5 and
58.5, respectively, which provided settling and response times of 2.0 s and 4.5 s, with no
overshooting.
The speed, pump flow, and PLVED feedback signals were passed through a first-order
transfer function to obtain their average values. This filter was selected owing to the
simplicity of implementing it in dSpace. The cutoff frequency of the filter was empirically
set to 0.25 Hz to abate the short-term variability of the feedback signals without
compromising the system bandwidth. To minimize the tracking signal noise, a 1 s moving
average filter was also designed and placed after QPRef and before feeding it to the
controller. The moving average filter was selected for its ease and efficiency in removing
Gaussian noise. The selected window width was 1 s, based on the normal heart beat of an
adult (i.e. 60~100 bpm, corresponds to 1 ~ 1.7 Hz).
6.2.5 Experimental Protocol
Both constant speed operational mode and preload-based controller were subjected to the
same assessment protocol. The scaling factor (K) was set to 1.0 for the preload-based
controller, while the corresponding speed of the fixed speed control mode was set to 2100
rpm. Each experiment started with the baseline LV failure condition at rest for 120 s to
allow the system to settle down, before performing a step change to one of the three test
scenarios (exercise, HUT and reduced LVC). Upon transitioning to the new states, the
experiments were continued for another 120 s to achieve the post-transition steady state.
To simulate an exercise scenario, 700 mL fluid was shifted from the systemic venous
compliance (SVC) chamber into the circulation, emulating the action of the muscle pump
in increasing venous return. Heart rate was increased from 60 to 90 bpm, while LVC was
Univers
ity of
Mala
ya

104
increased from 1040 to 1880 mmHg/s. On the other hand, the systemic vascular resistance
(SVR) and pulmonary vascular resistance (PVR) were decreased from 1300 to 600
dynes.s.cm-5 and from 110 to 40 dynes.s.cm-5 respectively.
To simulate HUT, 300 mL fluid was shifted from the circulation into the systemic venous
compliance chamber to emulate blood-pooling effect. The systemic vascular resistance
(SVR) and pulmonary vascular resistance (PVR) were increased from 1300 to 1635
dynes.s.cm-5 and from 110 to 210 dynes.s.cm-5 respectively, to simulate vasoconstriction.
Meanwhile, a major reduction in LVC was reproduced by reducing the LV contractility
to 2% of its baseline value using the LV electro-pneumatic regulators.
Fluid shifting in the MCL was controlled by adjusting the air pressure in the SVC
chamber, where fluid is allowed to move into the SVC by reducing air pressure, while
increasing air pressure shifts fluid out of the SVC. The fluid shift was facilitated using
manual ball valves. The key MCL parameters used to mimic baseline, exercise, HUT and
reduced LVC conditions were listed in Table 6.2.
Table 6.2: Key MCL parameters for mimicking different hemodynamic conditions. Clv, LV end systolic
elastance.
Variable Baseline Exercise HUT
LVC
Reduction
Heart Rate (bpm) 60 90 65 60
SVR (Dynes.s/cm5) 1300 600 1635 1300
PVR (Dynes.s/cm5) 110 40 210 110
Circulation fluid shift ---
SVC → RV
(700mL)
RV → SVC
(300mL)
---
Clv (mmHg/s) 1040 1880 1040 25
Univers
ity of
Mala
ya

105
For the exercise simulation and LVC scenarios, the change of parameters was immediate
and simultaneous. For HUT scenario, changing of all parameters but fluid shifting was
performed immediate and concurrently. Although for the posture change, the fluid
shifting begun at the same time with other parameter alternation, because of the low
dynamic of the mixture, the completion was lengthy but took no more than 20 seconds.
For all simulations, we waited for the hemodynamic variables to settle to a steady state
condition before transitioning from the baseline into one of the three test conditions. The
simulation was then continued for a sufficient period to allow the control modes to
achieve a post transition steady state.
6.2.6 Performance Evaluation
The performance of the preload-based and constant speed control methods was compared
by observing the changes in mean pump flow, mean cardiac output, mean systemic
arterial pressure, and mean left atrial pressure while transitioning from the baseline state
to exercise, HUT and reduced LVC scenarios. The preload sensitivity of each controller
was also investigated using the formula suggested by Khalil et al. (Khalil, Cohn, Metcalfe,
& Frazier, 2008), as shown below:
PS =QP
at−QP bt
Pla
at−Pla
bt
(6.2)
where PS is preload sensitivity (L/min/mmHg), QP represents the mean pump flow, Pla
is
the mean left atrial pressure, “at” represents ‘after transition’ and “bt” stands for ‘before
transition’.
6.3 Results
Figure 6.4, Figure 6.5, and Figure 6.6 show the temporal and steady state behaviors of the
MAP and QP to exercise, HUT and reduced LVC respectively, for both controllers. In
Univers
ity of
Mala
ya

106
addition, the plots also illustrate the relationship between QP and PLVEDm while going
through different perturbations.
As demonstrated in Figure 6.4, three distinct phases were shown while transitioning from
the baseline state to exercise: i) an initial phase lasting approximately 5 s, ii) a middle
phase lasting around 25 s, and iii) a steady state phase. At the onset of exercise, a drop in
SVR and PVR resulted in an initial fall in MAP and rise in QP despite an increase in heart
rate. After a few seconds, fluid was shifted from the systemic venous compliance into the
RV, which subsequently activated the Frank-Starling mechanism, causing both left and
right ventricular contractility to increase simultaneously. Consequently, MAP and QP
increased gradually before settling to a level higher than their baseline values. Both
controllers demonstrated similar hemodynamic transition pattern, with the preload-based
controller showing larger fluctuations in the hemodynamic variables, especially QP .
Concerning steady state results (Table 6.3), the preload-based controller achieved a higher
increase in QP (7.1 L/min) as compared to the constant speed mode (6.1 L/min). In
addition, lower PLVEDm (13.8 mmHg vs. 15.1 mmHg for the constant speed mode) was
achieved, indicating less load on the LV. Apart from that, the preload-based controller
obtained a higher preload sensitivity (0.56 L/min/mmHg) when compared to the constant
speed (0.18 L/min/mmHg).
Univers
ity of
Mala
ya

107
Figure 6.4: (A) Transient and steady state response of the mean arterial pressure and pump flow, and (B)
the relationship between mean pump flow and mean PLVED while transitioning from baseline to
exercise, for the constant speed mode and preload-based control. P1, transient phase 1; P2, transient phase
2; P3, transient phase 3. The transition started at t=120 s. Univers
ity of
Mala
ya

108
Table 6.3: In-vitro hemodynamic data at baseline (rest) and exercise for constant speed mode and
preload-based controllers.
Constant Speed Preload
Variable Unit Baseline Exercise Baseline Exercise
ω rpm 2100±13 2100±15 2103±18 2295±18
MAP mmHg 89±0.2 95±0.3 89±0.3 96±0.2
PLA mmHg 10.9±0.1 16.3±0.1 10.8±0.1 14.2±0.1
PLVEDm mmHg 9.5±0.1 15.3±0.2 9.3±0.1 13.8±0.4
CO L/min 5.2±0.1 10.1±0.1 5.2±0.1 10.4±0.1
QP L/min 5.2±0.1 6.2±0.1 5.2±0.1 7.1±0.2
Preload-
sensitivity
L/min/mmHg 0.18 0.56
At the onset of HUT, SVR and PVR increased, leading to a rise in MAP and a reduction
in QP (Figure 6.5). As the fluid shifting process was lengthy (around 20 s), the circulation
volume was almost constant during the initial stage. As the vacuuming process continued,
blood was shifted from the circulation into the SVC, thus reducing the mean circulatory
filling pressure, MAP and QP . In terms of steady state results (Table 6.4), mean pump
flow was reduced to 3.6 L/min while PLVED fell to 2.7 mmHg for the preload-based
control during HUT, in comparison to 4.1 L/min and -0.1 mmHg for the constant speed
controller. Thus, it can be concluded that preload-based control was able to reduce QP
adequately to maintain an adequate safety margin against LV suction while constant
speed controller could not. Apart from that, the preload-based controller obtained a higher
preload sensitivity (0.45 L/min/mmHg) when compared to the constant speed (0.18
L/min/mmHg).
Univers
ity of
Mala
ya

109
Meanwhile, as illustrated in Figure 6.6, a major reduction in LVC caused a sudden drop
in both MAP and QP . As the experiments continued, the preload-based controller was
able to gradually increase the MAP and QP back to its original level by increasing mean
pump speed, without a major change in PLVEDm. On the contrary, QP fell to 4.8 L/min
while MAP dropped to 86 mmHg for the constant speed operational mode (Table 6.5).
Figure 6.5: (A) Transient and steady state response of mean arterial pressure and pump flow, and (B) the
relationship between mean pump flows and mean PLVED while transitioning from baseline to 700 HUT,
for the constant speed mode and preload-based control. P1, transient phase 1; P2, transient phase 2; P3,
transient phase 3.The transition started at t=120 s.
Univers
ity of
Mala
ya

110
Table 6.4: In-vitro hemodynamic data at baseline (rest) and 70o head up tilt (HUT) for constant speed
mode and preload-based controllers
Constant Speed Preload
Variable Unit Baseline HUT Baseline HUT
ω rpm 2100±13 2100±20 2096±19 1793±25
MAP mmHg 91±0.2 92±0.2 92±0.3 81±0.3
PLA mmHg 9.2±0.1 1.4±0.0 10.0±0.1 3.2±0.1
PLVEDm mmHg 7.1±0.1 -0.1±0.2 8.3±0.1 2.7±0.1
CO L/min 5.2±0.1 4.1±0.1 5.3±0.1 3.6±0.1
QP L/min 5.1±0.1 3.7±0.2 5.1±0.1 2.0±0.1
Preload-
sensitivity
L/min/mmHg 0.18 0.45
Figure 6.6: (A) Transient and steady state response of mean arterial pressure and pump flow, and (B) the
relationship between mean pump flow, and mean PLVED while transitioning from baseline to reduced
LV contractility scenario, for the constant speed mode and preload-based control. P1, transient phase 1;
P2, transient phase 2; P3, transient phase 3. The transition started at t=120 s.
Univers
ity of
Mala
ya

111
Table 6.5: In-vitro hemodynamic data at baseline (rest) and reduced LV contractility scenario (LVC) for
constant speed mode and preload-based controllers.
Constant Speed Preload
Variable Unit Baseline LVC Baseline LVC
ω rpm 2100±13 2100±1 2096±17 2210±10
MAP mmHg 92±0.1 86±0.1 92±0.3 92±0.2
PLA mmHg 9.2±0.1 9.8±0.1 9.7±0.1 8.6±0.1
PLVEDm mmHg 7.7±0.1 9.2±0.1 8.0±0.1 7.9±0.1
CO L/min 5.2±0.1 4.8±0.1 5.3±0.1 5.2±0.1
QP L/min 5.1±0.1 4.8±0.1 5.1±0.1 5.1±0.1
Preload
sensitivity
L/min/mmHg 0.50 0.00
6.4 Discussion
Apparent deficiencies observed in the fixed-speed operational mode have motivated
researchers to develop various physiological responsive controllers. Nicholas R. Gaddum
et al. (2014) utilized an adaptive pulsatile control based on the linear relationship between
flow and remnant flow pulsatility to imitate the native Starling flow sensitivity
(Salamonsen et al., 2012). Although their results demonstrated the strength of pulsatility
control over the constant speed mode, there are several limitations associated with their
controller. The main issue with the proposed pulsatility controller was that pump
pulsatility (flow, current, pressure gradient, or speed) is a consequence of LV contraction
while LV preload is one of the determinants of LV contraction. In cases of severe LV
failure, LV does not sufficient ability to influence pulsatility and thus the dynamic range
of pulsatility indexes is small. More importantly, pulsatility control is not feasible in cases
with zero LV contractility.
Univers
ity of
Mala
ya

112
Schima et al. (2006) described a so-called physiological control for an implantable rotary
blood pump. The control proposed controller consists of two main functions. The first
function is responsible to ascertain sufficient venous return whilst the second function
undertakes controlling the pump. The system gets the pumps speed, motor current, and
pump flow that the latter is measured invasively using ultrasound flow probe. The control
section then tries to maintain a “desired flow” that already set by the user. Such
maintenance is valid until the venous return is sufficient. Cases the venous return is not
sufficient the system tries to adjust the speed depending on the pump flow pulsatility and
suction. Although the “desired flow” could be set based on the patient's heart rate,
however Schima set the flow to high levels that exceeded the patient's demands, the issue
highlights the over pumping and draws the patient on the verge of suction. Moreover,
Schima derived the venous return based of the pup pulsatility, which could be problematic
in cases of severe heart failure(M. A. Bakouri et al., 2014). One limitation of this study is
that the method is dependent on a moderate degree of residual LV contractility and will
not work in the cases where LV shows low or no contractility at all.
On the contract, Mansouri et al. (2015) proposed a preload-based Starling-like control for
implantable rotary blood pumps (IRBPs) using PLVED as the feedback variable.
Simulations were conducted using a validated mathematical model. The controller
emulates the response of the natural left ventricle to changes in PLVED. He also showed
the proposed Starling-like controller outperformed a flow-based pulsatility control in
avoiding suction in three common testing scenarios including vigorous exercise, blood
loss and a major reduction in the LV contractility.
Compared to constant speed, the Starling-like control was able to synchronize the LV and
RV outputs irrespective of variations in venous return (Salamonsen et al., 2012) by
emulating the Frank-Starling control mechanism of the natural heart. The preload-based
method produced less increase in PLVED during exercise and reduced LV contractility
Univers
ity of
Mala
ya

113
scenarios (Table 6.3). Thus, utilizing this preload-based method lessens the chances of
pulmonary congestion -- an incident that may otherwise lead to long-term right-side
circulatory failure (Haddad et al., 2008). With physiological conditions involving a
reduction in LV preload such as HUT, the preload-based method was able to maintain
adequate distance against LV suction (Table 6.4). There has been evidence that LV
suction may cause a significant reduction in RV performance through endocardial
damage and septal shift (Salamonsen et al., 2012; Salamonsen, Lim, Moloney, Lovell, &
Rosenfeldt, 2015). In cases involving a major reduction in LVC, we observed a preload
increment with constant speed mode whilst MAP dropped. The preload-based control
responded to such rise in preload by increasing the pump speed and flow, which
subsequently returned the preload to its previous value (Table 6.5).
Another aim of this in-vitro study was to characterize the flow sensitivity of the proposed
controller to preload and compare it with the conventional constant speed controller. In
line with Nicholas R. Gaddum et al. (2014), employing the Frank-Starling controller
generated preload sensitivity that is dependent on the body requirements, similar to that
for the native heart. Whilst any increase in preload resulted in an increment in the preload
sensitivity, preload reduction lowered the sensitivity. This was illustrated in our
experimental results (Figure 6.4 (B) vs. Figure 6.5 (B), Table 6.3 vs. Table 6.4), where
preloads of 13.8 and 2.7 mmHg during exercise and HUT resulted in sensitivities of 0.56
and 0.45 L/min/mmHg respectively for the preload-based controller. Meanwhile, much
lower preload sensitivity 0.18 L/min/mmHg was achieved for the constant speed
controller during both scenarios.
Published studies have indicated that employing a fixed-speed operational mode confines
the flow sensitivity to preload with the inherent sensitivity of the connecting cannula
configuration and resistance (N. R. Gaddum, D. L. Timms, et al., 2012), as well as the
LVAD curve gradient (N. R. Gaddum, Fraser, & Timms, 2012). Thus, in case of a major
Univers
ity of
Mala
ya

114
LVC reduction, substantial flow reduction was observed for the constant speed mode,
marked by a preload sensitivity of 0.5 L/min/mmHg (Table 6.5). On the other hand, the
preload-based control perfectly maintained QP and MAP at its baseline level, as reflected
by a zero preload sensitivity.
6.5 Limitations and Future Work
The process of adapting curves and changing the scaling factor was initially introduced
by Salamonsen et al. (2012) and evaluated by Nicholas R. Gaddum et al. (2014). Although
this study focused on using a single preload control line, it is believed that a full controller
will be capable of adapting to longer-term changes in the LV function by adjusting the
scaling factor. This adjustment to different Frank-Starling curves not only provides
inherent protection against LV suction, but also determines the degree of LV unloading.
In cases of low preload sensitivity, a fast-acting controller is ultimately required to apply
a change in flow as soon as PLVED changes. In cases the pump flow and/or the head
pressure across the pump is estimated an adaptive rule controller as Sliding Mode (M. A.
Bakouri et al., 2014) could be used to realize an optimal adaptive control.
6.6 Conclusion
This experimental study clearly established the superiority of the preload-based control
over the fixed speed operational mode while transitioning from the baseline state to
exercise, HUT, and a major reduction in LVC. The preload-based controller was able to
provide a greater flow and cardiac output during exercise as compared to the conventional
constant speed controller, with less loading on the heart. In addition, it maintained a better
safety margin against LV suction during HUT and MAP during a major reduction in LVC.
The preload-based controller achieved a much higher preload-flow sensitivity as
compared to the constant speed mode.
Univers
ity of
Mala
ya

115
CHAPTER 7: CONCLUSIONS AND RECOMMENDATIONS
7.1 Conclusions
Despite extensive efforts in the area of IRBP control, most commercially available IRBPs
still operate at a constant speed operational mode adjusted by the physicians, which
resulted in a poor sensitivity to changes in the metabolic requirements of the patients.
This dissertation attempted to develop and implement a robust preload-based
physiological controller that could adapt to the body requirement during various
hemodynamic perturbations in the presence of external noise, and without falling into
adverse conditions such as suction or pulmonary congestion.
Chapter 3 presented a comparative evaluation of a number of well-established
physiologically responsive controllers based on constant set point controlling methods
using a validated numerical model, in response to exercise and HUT. Simulation results
showed that while an increase in cardiac output during exercise was mainly dominated
by an increase in the aortic valve flow, increasing pump speed could further improves
total cardiac output through an increase in pump flow, thus reducing elevated filling
pressures. Concerning the ability to increase cardiac output during exercise, constant Pla
control outperformed other control modes. However, a fall in MAP was observed upon
HUT, which may lead to circulatory instability. Constant dP control demonstrated
superior performance under both exercise and HUT scenarios, potentially due to the
preload and afterload sensitivity of IRBPs. Due to their strong dependency on the pump
operating point, PI and ratioPI control performed poorly during exercise and HUT.
In view of the poor performance of the fixed set-point controllers, we have proposed a
preload-based Frank-Starling control method, which emulates the Frank-Starling
mechanism of the native heart. In this control method, pump flow was regulated using
left ventricular end diastolic pressure as the feedback signal. In Chapter 4, the
performance of the proposed preload-based control was assessed in comparison with the
Univers
ity of
Mala
ya

116
constant speed operation and the pulsatility index control using an extensively validated
numerical model. Simulation results showed that the preload-based control outperformed
both constant speed and pulsatility control modes in handling the transition from a
baseline state to exercise, blood loss, and a major reduction in LV contractility. In
particular, preload-based control achieved the greatest increase in mean pump flow with
minimum loading on the LV during exercise, and maintained the greatest safety margin
against LV suction during blood loss. Meanwhile, mean pump flow and PLVED remained
relatively constant with a major reduction in LV contractility for the preload-based
control, as opposed to the pulsatility control, which demonstrated a substantial drop in
mean pump flow and mean arterial pressure.
Chapter 5 describes the implementation of the preload-based controller in vitro using a
mock circulatory loop. The flow sensitivity of the preload-based and fixed speed
controllers to preload, as well as their steady state and transient response to moderate
exercise, 700 head-up-tilt, and a major reduction in LV contractility were characterized.
Experimental results showed that the preload-based controller was able to provide a
greater flow and cardiac output during exercise as compared to the fixed speed controller,
with less loading on the heart. In addition, it maintained a better safety margin against LV
suction during HUT and MAP during a major reduction in LVC. Concerning preload-
flow sensitivity, the preload-based controller achieved a much better preload-flow
sensitivity as compared to the fixed speed operational mode.
In the final chapter, a sliding mode controller was developed for the preload-based
controller. The transient and steady state performance of the SMC to exercise and blood
loss was compared with a proportional-integral-derivative controller using the dynamic
cardiovascular numerical model. In addition to the noise-free scenario, the performance
of these methods was also evaluated in the presence of noise, where the feedback signal
was contaminated with two different levels of Gaussian white noise. Although no
Univers
ity of
Mala
ya

117
prominent difference in performance existed between the PID and SMC methods in the
noise-free condition and at a relatively lower noise level, the PID system faced system
instability, substantial hemodynamic deviation, and LV suction during blood loss. In
contrast, the response of the SMC was sufficiently rapid and robust against the noisy
feedback signals.
7.2 Suggestions for Future Work
7.2.1 Noninvasive estimation of PLVED
In the numerical and experimental studies, the PLVED was obtained directly from the
model and measured using a pressure transducer in the MCL at end diastole of each
heartbeat. In reality, there is a widespread view that currently available implantable
pressure transducers are rendered virtually unusable due to a range of problems. These
include limited reliability, drifts in transducers’ response over time, and the anatomical
distortion they present to pump inlet cannula, resulting in unwanted flow turbulence and
associated clotting disorders. For LVAD control purposes, it would be worthwhile to
study the correlation between the PLVED and the noninvasive measurements such as
speed current and PWM, which would provide a noninvasive and accurate estimation of
PLVED. This information can be easily obtained using both the experimental results and
the mathematical model.
7.2.2 Adjustments of the scaling factor for the Frank-Starling curves
In this thesis, a single control line was utilized for the preload-based control system. In
order to accommodate to longer-term changes in the LV function and metabolic demand,
the scaling factor of the control line, which represents the sensitivity of the Frank Starling
relationship should be adjusted. This adjustment to different Frank-Starling curves not
only provides inherent protection against LV suction, but also determines the degree of
LV unloading.
Univers
ity of
Mala
ya

118
7.2.3 In vivo evaluation of the preload-based controller
The performance of the preload-based controller has been evaluated using both numerical
simulations and in vitro mock circulatory experiments. It would be interesting to evaluate
the performance of the preload-based control method using in vivo animal experiments,
which more closely resembles the human cardiovascular system.
7.2.4 Alternative control strategies
In the present thesis, the performance of both PID and SMC implementation methods has
been evaluated for the proposed preload-based controller. More robust control strategies,
such as H-infinity control and model predictive control may be explored. In regards to
the control objectives, future studies may look into the combination of various control
strategies (multi-objective control), as a single control objective may be insufficient for
the safe operation of an LVAD.
Univers
ity of
Mala
ya
119
REFERENCES
Akimoto, T., Yamazaki, K., Litwak, P., Litwak, K. N., Tagusari, O., Mori, T., . . . Umezu,
M. (1999). Rotary blood pump flow spontaneously increases during exercise
under constant pump speed: Results of a chronic study. Artificial organs, 23(8),
797-801.
AlOmari, A.-H., Savkin, A., Ayre, P., Lim, E., Mason, D., Salamonsen, R., . . . Lovell,
N. (2011). Non-invasive estimation and control of inlet pressure in an implantable
rotary blood pump for heart failure patients. Physiological measurement, 32(8),
1035.
AlOmari, A.-H. H., Savkin, A. V., Karantonis, D. M., Lim, E., & Lovell, N. H. (2009). A
dynamical model for pulsatile flow estimation in a left ventricular assist device.
Paper presented at the BIOSIGNALS.
AlOmari, A.-H. H., Savkin, A. V., Stevens, M., Mason, D. G., Timms, D. L., Salamonsen,
R. F., & Lovell, N. H. (2013). Developments in control systems for rotary left
ventricular assist devices for heart failure patients: A review. Physiological
measurement, 34(1), R1.
AlOmari, A., Savkin, A., Karantonis, D., Lim, E., & Lovell, N. (2009). Non-invasive
estimation of pulsatile flow and differential pressure in an implantable rotary
blood pump for heart failure patients. Physiological measurement, 30(4), 371.
Arndt, A., Nüsser, P., Graichen, K., Müller, J., & Lampe, B. (2008). Physiological control
of a rotary blood pump with selectable therapeutic options: Control of pulsatility
gradient. Artificial organs, 32(10), 761-771.
Arndt, A., Nüsser, P., & Lampe, B. (2010). Fully autonomous preload‐sensitive control
of implantable rotary blood pumps. Artificial organs, 34(9), 726-735.
Bakouri, M., Savkin, A., & Alomari, A. (2015). Nonlinear modelling and control of left
ventricular assist device. Electronics Letters, 51(8), 613-615.
Bakouri, M. A., Salamonsen, R. F., Savkin, A. V., AlOmari, A. H. H., Lim, E., & Lovell,
N. H. (2013). A sliding mode‐based starling‐like controller for implantable
rotary blood pumps. Artificial organs.
Bakouri, M. A., Salamonsen, R. F., Savkin, A. V., AlOmari, A. H. H., Lim, E., & Lovell,
N. H. (2014). A sliding mode‐based Starling‐Like controller for implantable
rotary blood pumps. Artificial organs, 38(7), 587-593.
Univers
ity of
Mala
ya

120
Bartolini, G., Ferrara, A., & Utkin, V. I. (1995). Adaptive sliding mode control in
discrete-time systems. Automatica, 31(5), 769-773.
Berne, R. M. (1981). Cardiovascular physiology. Annual Review of Physiology, 43(1),
357-358.
Boston, J., Antaki, J., & Simaan, M. (2003). Hierarchical control of heart-assist devices.
Robotics & Automation Magazine, IEEE, 10(1), 54-64.
Brassard, P., Jensen, A. S., Nordsborg, N., Gustafsson, F., Møller, J. E., Hassager, C., . .
. Sander, K. (2011). Central and peripheral blood flow during exercise with a
continuous-flow left ventricular assist deviceclinical perspective constant versus
increasing pump speed: A pilot study. Circulation: Heart Failure, 4(5), 554-560.
Bubnicki, Z. (2005). Modern Control Theory: Springer.
Bullister, E., Reich, S., & Sluetz, J. (2002). Physiologic control algorithms for rotary
blood pumps using pressure sensor input. Artificial organs, 26(11), 931-938. doi:
10.1046/j.1525-1594.2002.07126.x
Choi, S., Antaki, J., Boston, R., & Thomas, D. (2001). A sensorless approach to control
of a turbodynamic left ventricular assist system. Control Systems Technology,
IEEE Transactions on, 9(3), 473-482.
Choi, S., Boston, J. R., & Antaki, J. F. (2005). An investigation of the pump operating
characteristics as a novel control index for LVAD control. Int. J. Control Autom.
Syst, 3, 100-108.
Choi, S., Boston, J. R., & Antaki, J. F. (2007). Hemodynamic controller for left
ventricular assist device based on pulsatility ratio. Artificial organs, 31(2), 114-
125.
Eckberg, D. L., & Sleight, P. (1992). Human baroreflexes in health and disease: Oxford
University Press.
Elsayed, B. A., Hassan, M., & Mekhilef, S. (2013). Decoupled third-order fuzzy sliding
model control for cart-inverted pendulum system. Appl. Math, 7(1), 193-201.
Endo, G., Araki, K., Oshikawa, M., Kojima, K., Nakamura, K., Matsuzaki, Y., &
Onitsuka, T. (2002). A safe automatic driving method for a continuous flow
ventricular assist device based on motor current pulsatility: In-vitro evaluation.
ASAIO Journal, 48(1), 83-89.
Univers
ity of
Mala
ya

121
Esmore, D. S., Kaye, D., Salamonsen, R., Buckland, M., Begg, J. R., Negri, J., . . .
Rosenfeldt, F. L. (2008). Initial clinical experience with the VentrAssist left
ventricular assist device: The pilot trial. The Journal of heart and lung
transplantation, 27(5), 479-485.
Farrar, D. J., Bourque, K., Dague, C. P., Cotter, C. J., & Poirier, V. L. (2007). Design
features, developmental status, and experimental results with the Heartmate III
centrifugal left ventricular assist system with a magnetically levitated rotor.
ASAIO Journal, 53(3), 310-315.
Fu, M., & Xu, L. (2000). Computer simulation of sensorless fuzzy control of a rotary
blood pump to assure normal physiology. ASAIO Journal, 46(3), 273-278.
Gaddum, N. R., Fraser, J. F., & Timms, D. L. (2012). Increasing the transmitted flow
pulse in a rotary left ventricular assist device. Artif Organs, 36(10), 859-867. doi:
10.1111/j.1525-1594.2012.01485.x
Gaddum, N. R., Stevens, M., Lim, E., Fraser, J., Lovell, N., Mason, D., . . . Salamonsen,
R. (2014). Starling-like flow control of a left ventricular assist device: In-vitro
validation. Artificial organs, 38(3), E46-E56. doi: 10.1111/aor.12221
Gaddum, N. R., Timms, D. L., Stevens, M., Mason, D., Lovell, N., & Fraser, J. F. (2012).
Comparison of preload-sensitive pressure and flow controller strategies for a dual
device biventricular support system. Artif Organs, 36(3), 256-265. doi:
10.1111/j.1525-1594.2011.01344.x
Gaddum, N. R., Timms, D. L., Stevens, M., Mason, D., Lovell, N., & Fraser, J. F. (2012).
Comparison of preload‐sensitive pressure and flow controller strategies for a
dual device biventricular support system. Artificial organs, 36(3), 256-265.
Gao, W., Wang, Y., & Homaifa, A. (1995). Discrete-time variable structure control
systems. Industrial Electronics, IEEE Transactions on, 42(2), 117-122.
Giridharan, G., Pantalos, G., Koenig, S., Gillars, K., & Skliar, M. (2005). Achieving
physiologic perfusion with ventricular assist devices: comparison of control
strategies. Paper presented at the American Control Conference, 2005.
Proceedings of the 2005.
Giridharan, G. A., Pantalos, G. M., Gillars, K. J., Koenig, S. C., & Skliar, M. (2004).
Physiologic control of rotary blood pumps: an in vitro study. ASAIO Journal,
50(5), 403-409.
Giridharan, G. A., & Skliar, M. (2002). Nonlinear controller for ventricular assist devices.
Artificial organs, 26(11), 980-984.
Univers
ity of
Mala
ya

122
Giridharan, G. A., & Skliar, M. (2006). Physiological control of blood pumps using
intrinsic pump parameters: A computer simulation study. Artificial organs, 30(4),
301-307.
Goodwin, G. C., Graebe, S. F., & Salgado, M. E. (2001). Design via optimal control
techniques Control system design (pp. 240): Prentice Hall New Jersey.
Gregory, S. D., Stevens, M., Timms, D., & Pearcy, M. (2011). Replication of the Frank-
Starling response in a mock circulation loop. Paper presented at the Engineering
in Medicine and Biology Society, EMBC, 2011 Annual International Conference
of the IEEE.
Guyton, A. C. (1963). Circulatory physiology: Cardiac output and its regulation (pp. 237–
239). Philadelphia and London: W.B. Saunders Company.
Guyton, A. C. (1965). Circulatory physiology: Cardiac output and its regulation. The
American Journal of the Medical Sciences, 219(1), 122.
Guyton, A. C., & Hall, J. (1996). Textbook of medical physiology. Philadelphia:
Saunders Company.
Guyton, A. C., & Hall, J. E. (2005). Textbook of medical physiology. Philadelphia: PA:
W.B. Saunders Company.
Gwak, K.-W., Kim, H. D., Lee, S.-G., Park, S., & Kim, C.-W. (2015). Sliding mode
control for the Frank–Starling response of a piston pump mock ventricle. Journal
of Process Control, 25(0), 70-77.
Haddad, F., Doyle, R., Murphy, D. J., & Hunt, S. A. (2008). Right ventricular function in
cardiovascular disease, part ii pathophysiology, clinical importance, and
management of right ventricular failure. Circulation, 117(13), 1717-1731.
Hung, J. (1993). Chattering handling for variable structure control systems. Paper
presented at the Industrial Electronics, Control, and Instrumentation, 1993.
Proceedings of the IECON'93., International Conference on.
Jacquet, L., Vancaenegem, O., Pasquet, A., Matte, P., Poncelet, A., Price, J., . . .
Noirhomme, P. (2011). Exercise capacity in patients supported with rotary blood
pumps is improved by a spontaneous increase of pump flow at constant pump
speed and by a rise in native cardiac output. Artificial organs, 35(7), 682-690.
Karantonis, D. M., Lovell, N. H., Ayre, P. J., Mason, D. G., & Cloherty, S. L. (2006).
Identification and classification of physiologically significant pumping states in
an implantable rotary blood pump. Artificial organs, 30(9), 671-679.
Univers
ity of
Mala
ya

123
Khalil, H. A., Cohn, W. E., Metcalfe, R. W., & Frazier, O. H. (2008). Preload sensitivity
of the Jarvik 2000 and HeartMate II left ventricular assist devices. ASAIO Journal,
54(3), 245-248.
Klabunde, R. (2011). Cardiovascular physiology concepts: Lippincott Williams &
Wilkins.
Koh, C., Chan, W., Ng, B., & Li, H. (1999). Design and investigation of flow field in a
centrifugal blood pump. ASME-PUBLICATIONS-BED, 42, 167-168.
Konieczny, G., Opilski, Z., Pustelny, T., Gacek, A., Gibinski, P., & Kustosz, R. (2010).
Results of experiments with fiber pressure sensor applied in the polish artificial
heart prosthesis. Acta Physica Polonica, A., 118(6), 1183.
Lee, J. J., Ahn, C. B., Choi, J., Park, J. W., Song, S. J., & Sun, K. (2011). Development
of magnetic bearing system for a new third‐generation blood pump. Artificial
organs, 35(11), 1082-1094.
Letsou, G. V., Reverdin, S., & Frazier, O. (2013). Thyrotoxicosis-facilitated bridge to
recovery with a continuous-flow left ventricular assist device. European Journal
of Cardio-Thoracic Surgery, ezt106.
Levine, W. S. (1996). The control handbook: CRC press.
Lim, E. (2009). Characterisation of cardiovascular-rotary blood pump interaction.
(Doctor of Philosophy), The University of New South Wales, Sydney, Australia.
Lim, E., Alomari, A., Savkin, A., & Lovell, N. (2009). Noninvasive deadbeat control of
an implantable rotary blood pump: A simulation study. Paper presented at the
Engineering in Medicine and Biology Society, 2009. EMBC 2009. Annual
International Conference of the IEEE.
Lim, E., Chan, G. S., Dokos, S., Ng, S. C., Latif, L. A., Vandenberghe, S., . . . Lovell, N.
H. (2013). A cardiovascular mathematical model of graded head-up tilt. PLoS
ONE, 8(10), e77357.
Lim, E., Dokos, S., Cloherty, S. L., Salamonsen, R. F., Mason, D. G., Reizes, J. A., &
Lovell, N. H. (2010). Parameter-optimized model of cardiovascular–rotary blood
pump interactions. Biomedical Engineering, IEEE Transactions on, 57(2), 254-
266.
Lim, E., Dokos, S., Salamonsen, R. F., Rosenfeldt, F. L., Ayre, P. J., & Lovell, N. H.
(2012a). Effect of parameter variations on the hemodynamic response under
rotary blood pump assistance. Artificial organs, 36(5), E125-E137.
Univers
ity of
Mala
ya
124
Lim, E., Dokos, S., Salamonsen, R. F., Rosenfeldt, F. L., Ayre, P. J., & Lovell, N. H.
(2012b). Numerical optimization studies of cardiovascular–rotary blood pump
interaction. Artificial organs, 36(5), E110-E124.
Lim, E., Salamonsen, R. F., Mansouri, M., Gaddum, N., Mason, D. G., Timms, D. L., . .
. Lovell, N. H. (2015). Hemodynamic response to exercise and head-up tilt of
patients implanted with a rotary blood pump: A computational modeling study.
Artificial organs, 39(2), E24-E35. doi: 10.1111/aor.12370
Lin, H. C., Lowe, A., & Al-Jumaily, A. (2014). Non-invasive blood pressure
measurement algorithm using neural networks. Artificial Intelligence Research,
3(2), p16.
Maeda, K., Tsutamoto, T., Wada, A., Hisanaga, T., & Kinoshita, M. (1998). Plasma brain
natriuretic peptide as a biochemical marker of high left ventricular end-diastolic
pressure in patients with symptomatic left ventricular dysfunction. American
heart journal, 135(5), 825-832.
Magosso, E., Cavalcanti, S., & Ursino, M. (2002). Theoretical analysis of rest and
exercise hemodynamics in patients with total cavopulmonary connection.
American Journal of Physiology-Heart and Circulatory Physiology, 282(3),
H1018-H1034.
Magosso, E., & Ursino, M. (2002). Cardiovascular response to dynamic aerobic exercise:
A methematical model. Medical and Biological Engineering and Computing,
40(6), 660-674.
Mancini, D., Goldsmith, R., Levin, H., Beniaminovitz, A., Rose, E., Catanese, K., . . . Oz,
M. (1998). Comparison of exercise performance in patients with chronic severe
heart failure versus left ventricular assist devices. Circulation, 98(12), 1178-1183.
Mansouri, M., Salamonsen, R. F., Lim, E., Akmeliawati, R., & Lovell, N. H. (2015).
Preload-based Starling-like control for rotary blood pumps: Numerical
comparison with pulsatility control and constant speed operation. PLoS ONE,
10(4), e0121413. doi: 10.1371/journal.pone.0121413
Markham, D. W., Fu, Q., Palmer, M. D., Drazner, M. H., Meyer, D. M., Bethea, B. T., .
. . Levine, B. D. (2013). Sympathetic neural and hemodynamic responses to
upright tilt in patients with pulsatile and nonpulsatile left ventricular assist
devices. Circulation: Heart Failure, 6(2), 293-299.
Mason, D. G., Hilton, A. K., & Salamonsen, R. F. (2008). Reliable suction detection for
patients with rotary blood pumps. ASAIO Journal, 54(4), 359-366.
Univers
ity of
Mala
ya

125
Monsees, G. (2002). Discrete-time sliding mode control: TU Delft, Delft University of
Technology.
Muthiah, K., Gupta, S., Robson, D., Walker, R., Macdonald, P. S., Jansz, P., & Hayward,
C. S. (2013). Effect of body position on continuous flow left ventricular assist
device flow dynamics. The Journal of heart and lung transplantation : the official
publication of the International Society for Heart Transplantation, 32(4), S233.
Muthiah, K., Robson, D., Walker, R., Otton, J., Macdonald, P., Keogh, A., . . . Granger,
E. (2012). Relationship between heart rate and pump flow in patients implanted
with continuous flow left ventricular assist devices (LVAD). Heart, Lung and
Circulation, 21, S91.
Noon, G. P., & Loebe, M. (2010). Current status of the MicroMed DeBakey Noon
ventricular assist device. Texas Heart Institute Journal, 37(6), 652.
Park, S. J., Tector, A., Piccioni, W., Raines, E., Gelijns, A., Moskowitz, A., . . . Frazier,
O. H. (2005). Left ventricular assist devices as destination therapy: a new look at
survival. The Journal of thoracic and cardiovascular surgery, 129(1), 9-17.
Pepi, M., Guazzi, M., Maltagliati, A., Berna, G., & Tamborini, G. (2000). Diastolic
ventricular interaction in normal and dilated heart during head‐up tilting.
Clinical cardiology, 23(9), 665-672.
Reesink, K., Dekker, A., Van der Nagel, T., Beghi, C., Leonardi, F., Botti, P., . . .
Maessen, J. (2007). Suction due to left ventricular assist: implications for device
control and management. Artificial organs, 31(7), 542-549.
RevisionWorld. (2015). Human circulatory system. 2015, from
http://www.revisionworld.com/a2-level-level-revision/biology/physiology-
transport/human-circulatory-system
Sagawa, K., Maughan, L., Suga, H., & Sunagawa, K. (1988). Cardiac contraction and
the pressure-volume relationship (Vol. 480): Oxford University Press New York.
Saito, I., Ishii, K., Isoyama, T., Ono, T., Nakagawa, H., Shi, W., . . . Abe, Y. (2010).
Preliminary study of physiological control for the undulation pump ventricular
assist device. Paper presented at the Proc. 32nd Annu. Int. Conf. of the IEEE Eng.
Med. Biol. Soc.
Salamonsen, R. F., Lim, E., Gaddum, N., AlOmari, A. H. H., Gregory, S. D., Stevens,
M., . . . Karunanithi, M. K. (2012). Theoretical foundations of a Starling‐like
controller for rotary blood pumps. Artificial organs, 36(9), 787-796.
Univers
ity of
Mala
ya

126
Salamonsen, R. F., Lim, E., Moloney, J., Lovell, N. H., & Rosenfeldt, F. L. (2015).
Anatomy and physiology of left ventricular suction induced by rotary blood
pumps. Artificial organs, 39(8), 681-690.
Salamonsen, R. F., Mason, D. G., & Ayre, P. J. (2011). Response of rotary blood pumps
to changes in preload and afterload at a fixed speed setting are unphysiological
when compared with the natural heart. Artificial organs, 35(3), E47-E53.
Salamonsen, R. F., Pellegrino, V., Fraser, J. F., Hayes, K., Timms, D., Lovell, N. H., &
Hayward, C. (2013). Exercise studies in patients with rotary blood pumps: Cause,
effects, and implications for starling‐like control of changes in pump flow.
Artificial organs, 37(8), 695-703.
Schima, H., Vollkron, M., Jantsch, U., Crevenna, R., Roethy, W., Benkowski, R., . . .
Wieselthaler, G. (2006). First clinical experience with an automatic control
system for rotary blood pumps during ergometry and right-heart catheterization.
The Journal of heart and lung transplantation, 25(2), 167-173.
Shahnazi, R., Shanechi, H. M., & Pariz, N. (2008). Position control of induction and DC
servomotors: a novel adaptive fuzzy PI sliding mode control. Energy Conversion,
IEEE Transactions on, 23(1), 138-147.
Skogestad, S. (2006). Tuning for smooth PID control with acceptable disturbance
rejection. Industrial & engineering chemistry research, 45(23), 7817-7822.
Slaughter, M. S., Bartoli, C. R., Sobieski, M. A., Pantalos, G. M., Giridharan, G. A.,
Dowling, R. D., . . . Koenig, S. C. (2009). Intraoperative evaluation of the
HeartMate II flow estimator. The Journal of heart and lung transplantation, 28(1),
39-43.
Smith, W. A., Goodin, M., Fu, M., & Xu, L. (1999). System analysis of the flow/pressure
response of rotodynamic blood pumps. Artificial organs, 23(10), 947-955.
Starling, E., & Visscher, M. (1927). The regulation of the energy output of the heart. The
Journal of physiology, 62(3), 243-261.
Stevens, M. C. (2014). Automatic control of dual LVADs as a BiVADs. (Doctor of
Philosophy), The University of Queensland, Brisbane, QLD, AUSTRALIA.
Stevens, M. C., Mason, D. G., Bradley, A. P., Wilson, S., Fraser, J. F., & Timms, D.
(2014). Comparison of linear and non-linear control of flow and pressure in a
rotary left ventricular assist device. Medical and Biological Engineering and
Computing (Submitted).
Univers
ity of
Mala
ya

127
Tagusari, O., Yamazaki, K., Litwak, P., Antaki, J. F., Watach, M., Gordon, L. M., . . .
Griffith, B. P. (1998). Effect of pressure‐flow relationship of centrifugal pump
on in vivo hemodynamics: A consideration for design. Artificial organs, 22(5),
399-404.
Timms, D. (2011). A review of clinical ventricular assist devices. Medical engineering &
physics, 33(9), 1041-1047.
Timms, D. L., Gregory, S. D., Greatrex, N. A., Pearcy, M. J., Fraser, J. F., & Steinseifer,
U. (2011). A compact mock circulation loop for the in vitro testing of
cardiovascular devices. Artificial organs, 35(4), 384-391.
Troughton, R. W., Ritzema, J., Eigler, N. L., Melton, I. C., Krum, H., Adamson, P. B., . .
. Heywood, J. T. (2011). Direct left atrial pressure monitoring in severe heart
failure: long-term sensor performance. Journal of cardiovascular translational
research, 4(1), 3-13.
Ursino, M. (1998). Interaction between carotid baroregulation and the pulsating heart: a
mathematical model. American Journal of Physiology-Heart and Circulatory
Physiology, 275(5), H1733-H1747.
Utkin, V. I. (2013). Sliding modes in control and optimization: Springer Science &
Business Media.
Vollkron, M., Schima, H., Huber, L., Benkowski, R., Morello, G., & Wieselthaler, G.
(2005). Development of a reliable automatic speed control system for rotary blood
pumps. The Journal of heart and lung transplantation, 24(11), 1878-1885.
Waters, T., Allaire, P., Tao, G., Adams, M., Bearnson, G., Wei, N., . . . Khanwilkar, P.
(1999). Motor feedback physiological control for a continuous flow ventricular
assist device. Artificial organs, 23(6), 480-486.
World Health Organization, W. (2015, January 2015). Malaysia: WHO statistical profile.
Retrieved August 02, 2015, from http://www.worldlifeexpectancy.com/malaysia-
coronary-heart-disease
Wu, Y., Allaire, P., Tao, G., Wood, H., Olsen, D., & Tribble, C. (2003). An advanced
physiological controller design for a left ventricular assist device to prevent left
ventricular collapse. Artificial organs, 27(10), 926-930.
Wu, Y., Allaire, P. E., Tao, G., Adams, M., Liu, Y., Wood, H., & Olsen, D. B. (2004). A
bridge from short‐term to long‐term left ventricular assist device-experimental
verification of a physiological controller. Artificial organs, 28(10), 927-932.
Univers
ity of
Mala
ya

128
Wu, Y., Allaire, P. E., Tao, G., & Olsen, D. (2007). Modeling, estimation, and control of
human circulatory system with a left ventricular assist device. Control Systems
Technology, IEEE Transactions on, 15(4), 754-767.
Yamane, T. (2002). The present and future state of nonpulsatile artificial heart
technology. Journal of Artificial Organs, 5(3), 0149-0155.
Zhou, M.-D., Yang, C., Liu, Z., Cysyk, J. P., & Zheng, S.-Y. (2012). An implantable
Fabry-Pérot pressure sensor fabricated on left ventricular assist device for heart
failure. Biomedical microdevices, 14(1), 235-245.
Ziegler, J. G., & Nichols, N. B. (1942). Optimum settings for automatic controllers. trans.
ASME, 64(11).
Zinober, A. S. (1990). Deterministic Nonlinear Control of Uncertain Systems (Vol. 40):
IET.
Univers
ity of
Mala
ya

129
LIST OF PUBLICATIONS
Lim, E., Salamonsen, R. F., Mansouri, M., Gaddum, N., Mason, D. G., Timms, D. L., . . . Lovell,
N. H. (2015). Hemodynamic response to exercise and head-up tilt of patients implanted
with a rotary blood pump: A computational modeling study. Artificial Organs, 39(2),
E24-E35.
Mansouri, M., Salamonsen, R. F., Lim, E., Akmeliawati, R., & Lovell, N. H. (2015). Preload-
based Starling-like control for rotary blood pumps: Numerical comparison with pulsatility
control and constant speed operation. PLoS ONE, 10(14).
Mansouri, M., Salamonsen, R., Gregory, S. D., Lim, E., Ng, B. C., Akmeliawati, R., & Lovell,
N. H. (2015). Physiological control of rotary blood pumps–speed of response and
resistance to noisy feedback signals. Annals of biomedical engineering (submitted).
Mansouri, M., Salamonsen, R., Gregory, S. D., Stevens, M., Lim, E., & Akmeliawati, R. (2015).
A preload-based Frank-Starling control of rotary blood pumps: An in-vitro validation.
ASAIO Journal (submitted).
Ng, B. C., Lim, E., Salamonsen, R., Gregory, S. D., Stevens, M., Mansouri, M., . . . Wu, Y.
(2015). Multiobjective neural predictive control for BiVAD. Artificial
Organs(Submitted).
Univers
ity of
Mala
ya