malaya of university -...
TRANSCRIPT
THE EFFECTS OF ENERGY DENSITY ON THE MECHANICAL PROPERTIES OF SS316L PRODUCED BY
SELECTIVE LASER MELTING
NUR AQILAH BINTI DERAHMAN
DEPARTMENT OF MECHANICAL FACULTY OF ENGINEERING
UNIVERSITY OF MALAYA KUALA LUMPUR
SEPTEMBER 2018Univ
ersity
of M
alaya

THE EFFECTS OF ENERGY DENSITY ON THE MECHANICAL PROPERTIES OF SS316L PRODUCED BY
SELECTIVE LASER MELTING
NUR AQILAH BINTI DERAHMAN
DISSERTATION SUBMITTED IN FULFILMENT OF THE
REQUIREMENTS FOR THE DEGREE OF MASTER OF
ENGINEERING SCIENCE
DEPARTMENT OF MECHANICAL
FACULTY OF ENGINEERING
UNIVERSITY OF MALAYA
KUALA LUMPUR
SEPTEMBER 2018 Univ
ersity
of M
alaya

UNIVERSITY OF MALAYA
ORIGINAL LITERARY WORK DECLARATION
Name of Candidate: Nur Aqilah Binti Derahman
Matric No: KGA150065
Name of Degree: Master of Engineering Science
Title of Project Paper/Research Report/Dissertation/Thesis (“this Work”):
Investigation into The Effects of Parameters on The Properties of Part Produced
by Selective Laser Melting
Field of Study: Advanced Manufacturing Technology
I do solemnly and sincerely declare that:
(1) I am the sole author/writer of this Work;
(2) This Work is original;
(3) Any use of any work in which copyright exists was done by way of fair dealing
and for permitted purposes and any excerpt or extract from, or reference to or
reproduction of any copyright work has been disclosed expressly and
sufficiently and the title of the Work and its authorship have been
acknowledged in this Work;
(4) I do not have any actual knowledge nor do I ought reasonably to know that the
making of this work constitutes an infringement of any copyright work;
(5) I hereby assign all and every rights in the copyright to this Work to the
University of Malaya (“UM”), who henceforth shall be owner of the copyright
in this Work and that any reproduction or use in any form or by any means
whatsoever is prohibited without the written consent of UM having been first
had and obtained;
(6) I am fully aware that if in the course of making this Work I have infringed any
copyright whether intentionally or otherwise, I may be subject to legal action
or any other action as may be determined by UM.
Candidate’s Signature Date:
Subscribed and solemnly declared before,
Witness’s Signature Date:
Name:
Designation:
Univers
ity of
Malaya

ii
ABSTRACT
Selective laser melting (SLM) is an additive manufacturing (AM) method of fabricating
different types of complex components using a layer-by-layer approach. The parts are
produced directly from 3D computer-aided design (CAD) data by melting the powdered
material layer-by-layer assisted by laser power. In this work, an experimental investigation
was conducted into the SLM method process parameters using stainless steel 316L powder.
The energy density which are the influence of laser power, scanning speed and hatching
distance on the physic-mechanical properties such as surface roughness, dimensional
accuracy, tensile strength, and hardness of the manufactured parts were investigated. The
design of experiments was conducted using Taguchi’s L16 orthogonal array. Furthermore,
statistical analysis with signal-to-noise response and analysis of variance were applied to
obtain the optimal SLM parameter combinations. The experimental results indicated that
laser power has the greatest effect on surface roughness, dimensional accuracy and hardness.
However, scanning speed exhibited the greatest influence on the tensile strength of
manufactured parts, followed by laser power and hatching distance. Next, the optimal
parameters obtained were used in regression analysis to predict the mechanical properties.
Subsequently, a confirmation experiment was carried out by using the optimal parameters
determined. The confirmation experiment results were then compared with the predicted
values during experiment validation. Lastly, the shot peening technique was used to improve
the quality of the manufactured parts. Based on the results, shot peening improved the quality
of the manufactured parts by about 33.28% for surface roughness, 58.33% for dimensional
accuracy and 34.24% for hardness.
Keywords: Selective Laser Melting, Additive Manufacturing, Taguchi
Univers
ityof
Malaya

iii
ABSTRAK
Pemilihan laser selektif (SLM) adalah kaedah pembuatan tambahan (AM) yang digunakan
untuk menghasilkan pelbagai jenis komponen kompleks dengan menggunakan pendekatan
lapisan demi lapisan. Bahagian-bahagian itu dihasilkan secara langsung dari data reka bentuk
komputer (CAD) 3D, dengan mencairkan bahan serbuk dari satu lapisan demi lapisan dengan
bantuan laser. Dalam kerja ini, siasatan eksperimen mengenai parameter proses bagi mesin
SLM dengan menggunakan serbuk keluli tahan karat 316L telah dijalankan. Pengaruh kuasa
laser, kelajuan pengimbasan dan jarak penetasan terhadap sifat-sifat mekanik bahan yang
dihasilkan telah disiasat. Reka bentuk percubaan dijalankan dengan menggunakan susunan
ortogon L16 Taguchi. Tambahan pula, analisis statistik menggunakan respon isyarat-pada-
bunyi dan analisis varians digunakan untuk mendapatkan kombinasi parameter yang
optimum bagi proses SLM. Dari hasil penyiasatan, didapati bahawa kuasa laser mempunyai
kesan terbesar pada kekasaran permukaan, ketepatan dimensi dan kekerasan berbanding
kelajuan pengimbasan dan jarak penetasan. Walau bagaimanapun, kelajuan pengimbasan
merupakan pengaruh terbesar pada kekuatan tegangan bahan diikuti dengan kuasa laser dan
kemudian jarak penetasan. Seterusnya, analisis regresi telah dijalankan untuk meramalkan
nilai sifat mekanik dengan menggunakan parameter optimum yang diperolehi. Selanjutnya,
eksperimen pengesahan dilakukan dengan menggunakan parameter optimum yang diperolehi
bagi setiap penemuan. Hasil daripada itu dibandingkan dengan nilai yang diramalkan. Akhir
sekali, teknik pukulan digunakan untuk meningkatkan kualiti bahan. Berdasarkan hasilnya,
proses ini dapat meningkatkan kualiti bahagian pembuatan sekitar 33.28% dalam kekasaran
permukaan, 58.33% dalam ketepatan dimensi dan 34.24% dalam kekerasan.
Kata Kunci: Pemilihan Laser Selektif, Pembuatan Tambahan, Taguchi
Univers
ity of
Mala
ya

iv
ACKNOWLEDGEMENTS
First and foremost, I would like to convey my deepest gratitude to Allah SWT for giving me
strength and patience to complete this research study despite the many difficulties
experienced in the process of experimenting and also writing the dissertation. Without His
consent, I would not have any of this.
I am deeply indebted to my project supervisor Dr. Mohd Sayuti Bin Ab. Karim from the
University of Malaya, Kuala Lumpur, who has assisted, guided and encouraged me
throughout all my research and dissertation writing. He has guided me in this project with
essential theoretical information, especially on the rapid prototyping process. My
supervisor’s mentorship has been tremendously helpful in completing this research.
I greatly appreciate Contraves Advanced Devices Sdn. Bhd. for allowing me to prepare the
samples at the facility with the necessary manpower, equipment and data support. Without
these, this research study would not have been possible. I would also like to express my
gratitude to the technicians at the Faculty of Engineering, UM, for assisting me in many ways
to complete the experiments.
Last but not least, thanks to my family members for loving me and pushing me to succeed.
Dad, thank you for supporting me the whole time and Mom, thank you for all your efforts
towards my education. I will never forget your help and I cannot imagine this life without
you. Univ
ersity
of M
alaya

v
TABLE OF CONTENTS
ABSTRACT ........................................................................................................................... ii
ABSTRAK ............................................................................................................................ iii
ACKNOWLEDGEMENTS .................................................................................................. iv
TABLE OF CONTENTS ....................................................................................................... v
LIST OF FIGURES .............................................................................................................. ix
LIST OF TABLES ................................................................................................................ xi
LIST OF SYMBOLS AND ABBREVIATIONS ................................................................ xii
CHAPTER 1 : INTRODUCTION ......................................................................................... 1
1.1 Background .................................................................................................................. 1
1.2 Objectives ..................................................................................................................... 3
1.3 Problem Statement ....................................................................................................... 3
1.4 Significance of The Study ............................................................................................ 4
1.5 Scope of The Study ...................................................................................................... 4
1.6 Organization of The Dissertation ................................................................................. 4
CHAPTER 2 : LITERATURE REVIEW .............................................................................. 6
2.1 Background .................................................................................................................. 6
2.3 Selective Laser Melting Process ................................................................................... 7
2.4 Materials ....................................................................................................................... 9
2.5 Process Parameters ..................................................................................................... 10
2.5.1 Laser Power ......................................................................................................... 11
Univers
ity of
Mala
ya

vi
2.5.2 Scanning Speed .................................................................................................... 13
2.5.3 Hatching Distance ................................................................................................ 15
2.5.4 Building Direction ............................................................................................... 17
2.5.5 Layer Thickness ................................................................................................... 18
2.6 Design of Experiments ............................................................................................... 19
2.6.1 Taguchi Method ................................................................................................... 19
2.7 Shot Peening ............................................................................................................... 20
2.8 Summary of Literature Review .................................................................................. 20
CHAPTER 3 : METHODOLOGY ...................................................................................... 21
3.1 Introduction ................................................................................................................ 21
3.2 Materials and Sample Preparation .............................................................................. 22
3.3 Design of Experiments ............................................................................................... 24
3.4 Testing ........................................................................................................................ 26
3.4.1 Surface roughness ................................................................................................ 26
3.4.2 Dimensional accuracy .......................................................................................... 27
3.4.3 Tensile testing ...................................................................................................... 28
3.4.4 Hardness............................................................................................................... 29
3.4.5 Porosity ................................................................................................................ 30
3.5 Shot Peening ............................................................................................................... 30
3.7 Data Analysis ............................................................................................................. 31
CHAPTER 4 : RESULTS AND DISCUSSION .................................................................. 32
Univers
ity of
Mala
ya

vii
4.1 Powder Analysis ......................................................................................................... 32
4.2 Data Analysis ............................................................................................................. 33
4.2.1 Surface Roughness ............................................................................................... 33
4.2.2 Dimensional Accuracy ......................................................................................... 38
4.2.3 Tensile Strength ................................................................................................... 42
4.2.4 Fracture Toughness .............................................................................................. 46
4.2.4 Hardness............................................................................................................... 48
4.2.5 Porosity ................................................................................................................ 52
4.3 Regression Analysis and Optimization ...................................................................... 56
4.3.1 Surface roughness ................................................................................................ 56
4.3.2 Dimensional accuracy .......................................................................................... 56
4.3.3 Tensile Strength ................................................................................................... 57
4.3.4 Hardness............................................................................................................... 57
4.3.5 Porosity ................................................................................................................ 57
4.4 Confirmation Experiment ........................................................................................... 57
4.4 Shot Peening ............................................................................................................... 59
CHAPTER 5 : CONCLUSION ............................................................................................ 63
5.1 Conclusion .................................................................................................................. 63
5.2 Recommendations for future work ............................................................................. 64
REFERENCES ..................................................................................................................... 65
SUPPLEMENTARY ........................................................................................................... 69
Univers
ity of
Mala
ya

viii
LIST OF PUBLICATION AND PAPER PRESENTED ................................................. 69
Univers
ity of
Mala
ya
ix
LIST OF FIGURES
Figure 2.1: Basic of SLM process .......................................................................................... 8
Figure 2.2: SLM process parameters (Stwora & Skrabalak, 2013) ..................................... 10
Figure 2.3: Structure of samples: a) fully consistent surface, b) surface with balling
phenomenon, c) porous structure ......................................................................................... 13
Figure 2.4: Illustration of hatching distance ........................................................................ 15
Figure 2.5: Laser-sintered Inconel 625 ................................................................................ 16
Figure 2.6: Surface roughness measurements at a) 0o and b) 90o ........................................ 18
Figure 3.1: Flow chart of research methodology ................................................................. 21
Figure 3.2: Drawing of part used for testing ........................................................................ 23
Figure 3.3: Mitutoyo Surftest SJ-210 ................................................................................... 26
Figure 3.4: Oxford precision micrometer ............................................................................ 27
Figure 3.5: INSTRON universal testing machine ................................................................ 28
Figure 3.6: Vickers Hoytom Minor-69 ................................................................................ 29
Figure 3.7: Peenmatic 620 S machine .................................................................................. 31
Figure 4.1: FESEM micrographs of SS316L metal powder before melting at 500x
magnification........................................................................................................................ 32
Figure 4.3: Interaction plot for surface roughness ............................................................... 36
Figure 4.2: Main effect plot surface roughness .................................................................... 36
Figure 4.4: Main effects plot for dimensional accuracy, % ................................................. 41
Figure 4.5: Main effects plot for tensile strength ................................................................. 44
Figure 4.6: Fracture morphologies at laser power of 200 W with different laser scanning
speeds and hatching distances: a) 510 mm/s scanning speed and 0.08 mm hatching distance,
and b) 760 mm/s scanning speed and 0.14 mm hatching distance.................................. 46-47
Figure 4.7: Main effects plot for hardness ........................................................................... 51
Univers
ity of
Mala
ya

x
Figure 4.8: Main effects plot for porosity percentage, % .................................................... 54
Figure 4.9: Metallographic observation: top view of 1st experiment ................................... 55
Figure 4.10: Illustration of the shot peening mechanism ..................................................... 59
Figure 4.11: Sample 6: (a) before shot peening, (b) after shot peening ............................... 60
Figure 4.12: Micrograph images: Before shot peening ........................................................ 61
Figure 4.13:Micrograph images: After shot peening ........................................................... 62
Univers
ity of
Mala
ya

xi
LIST OF TABLES
Table 3.1: SLM 280HL specifications ................................................................................... 22
Table 3.2: Dimensions of manufactured part ....................................................................... 23
Table 3.3: Process parameters .............................................................................................. 24
Table 3.4: Taguchi design .................................................................................................... 25
Table 4.1: Chemical composition of SS316L ...................................................................... 33
Table 4.2: Experiment, Ra and S/N ratio results based on different process parameter
combinations using the L16 array ......................................................................................... 34
Table 4.3: ANOVA analysis for S/N ratios (surface roughness, R2 = 95.64%) .................. 35
Table 4.4: Response table for surface roughness ................................................................. 35
Table 4.5: Dimensional accuracy and S/N ratio results ....................................................... 39
Table 4.6: ANOVA analysis of S/N ratios (dimensional accuracy, R2 = 96.65%) .............. 40
Table 4.7: Response table for dimensional accuracy ........................................................... 40
Table 4.8:Tensile strength and S/N ratio results ............................................................. 42-43
Table 4.9: ANOVA analysis for S/N ratios (tensile strength, R2 = 92.67%) ....................... 43
Table 4.10: Response table for tensile strength ................................................................... 44
Table 4.11: Hardness and S/N ratio results ..................................................................... 48-49
Table 4.12: ANOVA analysis for S/N ratios (hardness, R2 = 80.31%) ............................... 50
Table 4.13: Response table for hardness .............................................................................. 50
Table 4.14: Porosity percentage and S/N ratio results ......................................................... 52
Table 4.15: ANOVA analysis for S/N ratios (Porosity percentage, R2 = 70.47%) ............. 53
Table 4.16: Response table for porosity percentage, % ....................................................... 53
Table 4.17: Comparison between predicted and experimental values ................................. 58
Table 4.18: Value reductions after shot peening .................................................................. 59
Univers
ity of
Mala
ya
xii
LIST OF SYMBOLS AND ABBREVIATIONS
SLM Selective laser melting
AM Additive manufacturing
CAD Computer aided design
SS316L Stainless steel 316L
Ed, J/mm2 Energy density, J/mm2
P, W Laser Power, Watt
v, mm/s Scanning speed, mm/s
hd, mm Hatching distance, mm
Ra Average of a set of individual measurements of a surfaces peaks and
valleys
UTS Ultimate tensile strength
HV Hardness Vickers
S/N Signal to noise ratio
ANOVA Analysis of variance
DF Degree of freedom
ADJ MS Adjusted mean squares measure
ADJ SS Adjusted sums of squares
F-Value Test statistic used to determine whether the term is associated with the
response
P-Value Probability that measures the evidence against the null hypothesis.
R2 Percentage to determine how close the data with the regression line
Univers
ity of
Mala
ya
1
CHAPTER 1 : INTRODUCTION
1.1 Background
The manufacturing industry seeking towards improvement on the production from time to
time while reducing cost. Nowadays, additive manufacturing (AM) is a technology that can
enhance the production process. One of an AM technology is the selective laser melting
(SLM), which significantly benefits product design and development. It simplifies the
process of the conventional molding method. The process requires minimal setup and lead
time to produce the part as well as variance selection of materials. Owing to these special
advantages, these technologies have been developing fast since the early 1990s.
The SLM process entails a layer-by-layer approach to produce the final parts by depositing
and melting the metallic powder material. Laser is used to melt the metal powder and create
the final parts directly from the 3D CAD data. It was invented in 1979 by R.F. Housholder
(Stwora & Skrabalak, 2013). The Housholder’s initial notion of sintering powder included
the movement of a focused heat source on the powder surface, followed by the deposition
and consolidation of powder layers with the help of a laser system to melt and join the powder
materials in the melt pool.
Some of the factors in laser melting are needed to be considered such as the powder material
properties, geometry of the parts and processing parameters. Normally, these factors are
influenced by the energy delivered to the powder surface. The physic-mechanical properties
of the manufactured parts, e.g. surface roughness, dimensional accuracy, tensile strength,
hardness and etc. depends on the energy applied, which is related to the process parameters.
A key factor in controlling the quality of the final part is to control the process parameters.
Univers
ity of
Mala
ya

2
The densification of iron-based powders that was dependent on the processing parameters,
such as laser power, layer thickness, scan rate and hatch distance was investigated by (A
Simchi, 2006). Besides that, the quality of the physic-mechanical and microstructural
properties of the manufactured part depends on the process parameters applied such as
building direction, layer thickness and scanning speed (Kruth et al., 2010).
Furthermore, some of the previous research works have mentioned that the shot peening
process are recommended in improving the surface quality of the SLM manufactured parts
(Calignano, Manfredi, Ambrosio, Iuliano, & Fino, 2012). It is known as a cold working
process that is used as a post-processing technique for metallic parts. The objective of this
process is to prevent fatigue and corrosion, thereby the life cycle of manufactured parts can
be increased. It involves the use of small spherical shots, which are bombarded onto the
surface of the manufactured part in other to obtain a better surface finish. The shot peening
method has proven to be the most economical and effective way of producing surface residual
compressive stresses, thereby increasing the life span of the treated metals.
The focus of this research is to study the influence of varying SLM process parameters,
including the laser power, scanning speed and hatching distance on the physic-mechanical
properties of manufactured parts.
Univers
ity of
Mala
ya

3
1.2 Objectives
1. To investigate the effects of processing parameter variations on the physic-
mechanical properties of manufactured parts.
2. To optimize the process parameters in order to improve the properties of
manufactured parts (surface roughness, dimensional accuracy, strength and
hardness).
3. To investigate the effects of the shot-peening process on the surface roughness,
dimensional accuracy and hardness of the manufactured part.
1.3 Problem Statement
In this research, the focus is on SLM process parameter matters. Although SLM technology
can yield excellent benefits, the sintered part quality is still not good enough to produce
accurate and dense parts. Some problems may arise during a very short melting process time
due to the high thermal energy required to promote material rearrangement and densification.
In order to achieve better quality of built parts, optimized process conditions should be
attained by changing the laser power intensity, scan rate and hatch distance. Different process
parameters affect the melting quality and ultimately, the quality of parts. Enhancements in
manufactured part quality are always desirable in the industry. Much research work remains
to be done to improve the performance of rapid prototyping. Furthermore, stainless steel
316L is one of the attractive metallic materials for biomedical applications due to its
mechanical properties, biocompatibility, and corrosion resistance but, there’s minimal
research study in this material by using SLM process.
Univers
ity of
Mala
ya

4
1.4 Significance of The Study
Selective laser melting (SLM) has recently experienced a rapid rise in usage due to the ability
to fabricate complex designs. Although SLM technology is greatly beneficial, the
manufactured part quality is still not sufficiently good to produce accurate and dense parts.
The quality of manufactured parts depends on the parameters applied during the melting
process. Hence, to ensure the quality of manufactured parts is as same as solid materials
produced using traditional methods, the optimum parameters are determined in this study.
1.5 Scope of The Study
This study focuses on the physic-mechanical properties of stainless steel 316L manufactured
part by using SLM machine with different setting parameters. Process parameters involved
in this study are laser power, scanning speed and hatching distance. Also, this study is limited
to design of experiments by Taguchi Method with L16 orthogonal array (OA) and three
control parameters with four levels each.
1.6 Organization of The Dissertation
This dissertation consists of five chapters as follows:
Chapter one provides a general overview of selective laser melting and a problem
statement that is addressed in this study. It also includes the scope of the research as well as
the study goals and objectives.
Chapter two presents the literature review, which summarizes literature and sources
including journals, books and periodicals from the previous researchers. The theory related
to the study and previous outcomes are discussed in this chapter.
In chapter three, the material selection employed for the sample model in this research
project is discussed. The design of experiment used to conduct the experiments is also
Univers
ity of
Mala
ya

5
presented. Moreover, the chapter gives a detailed description of the project methodology
including the suitable parameters and setup utilized to conduct the mechanical testing.
Chapter four consists of the results and discussion of this research project. The results
are presented in tables prior to analysis. The collected data are analyzed using MINITAB
software and explained in graphical form.
Chapter five concludes the major findings that are in agreement or disagreement with
the study objectives. Finally, recommendations are made for further improvement in future
works.
Univers
ity of
Mala
ya

6
CHAPTER 2 : LITERATURE REVIEW
2.1 Background
The manufacturing industry is always seeking ways to improve production processes by
reducing the product processing costs, reducing the time consumption to fabricate complex
parts, etc. Additive manufacturing (AM) is the best approach to solve the difficulties
encountered when fabricating complex parts or using difficult materials by conventional
manufacturing techniques. The AM process can directly produce functional prototypes and
tools with no post-processing procedures. Rapid prototyping (RP) is an additive
manufacturing process that can help to improve the production process by applying layers
upon layers to produce parts. This advanced manufacturing technology was first
commercialized in the mid-1980s (Delgado, Ciurana, & Rodríguez, 2011). SLM is a RP
technology that facilitates the direct fabrication of prototypes or assembly models using 3D
computer-aided design (CAD) databases without tools or fixtures and without producing any
big material waste such as scrap (Calignano et al., 2012).
Achieving the desired surface quality is very important for the functional behaviour of a part.
The quality of a part that is manufactured by SLM does not only depend on the surface
roughness aspect, but it is the keys in fulfilling the part manufacturing requirements during
the process. In recent years, the surface quality of SLM parts has posed major drawbacks,
whereby the surface roughness of manufactured parts is still high in comparison to solid
materials achieved by conventional methods (Badrossamay & Childs, 2006; Kruth et al.,
2010). On the other hand, the process-dependent nature of the surface roughness formation
mechanism along with numerous uncontrollable factors that influence pertinent phenomena,
make it almost impossible to find a straightforward solution. The most common strategy
Univers
ity of
Mala
ya

7
involves in selecting conservative process parameters, neither guarantee the achievement of
the desired surface finish nor attain high metal removal rates (Benardos & Vosniakos, 2003).
According to (Delgado et al., 2011), the process parameters need to be controlled to attain
better dimensional accuracy. The dimensional accuracy of parts manufactured through the
Shrinkage during the SLM process is another significant factor that determines the
dimensional accuracy of manufactured parts. Shrinkage can take place when the substrate
temperature is in a crucial stage (Chung & Das, 2006).
The main parameters involved in this process are the laser power, scanning speed, hatching
distance, layer thickness, building direction, working atmosphere and powder bed
temperature. Hence, it is necessary to study the parameters to ensure the quality of the parts
manufactured by SLM is comparable with the parts manufactured using conventional
method.
2.3 Selective Laser Melting Process
In the manufacturing industry, parts manufacturers and end users are always searching for
design alternatives. With an SLM machine it is possible to fabricate highly complex, tailored
and fully formed parts with minimal time consumption. Only a single step is required to
produce solid parts using this technology without the need for part-specific tooling.
SLM has the capability producing fully dense parts without post-processing process. It only
needs to remove the manufactured part and supports from base plate. By producing
manufactured part that have low porosity and high strength, SLM is more superior compared
to SLS in AM. Normally, post-processing process such as material infiltration and heat
treatment are needed to improve the quality of the SLS manufactured part. Also, post-
processing requires more time and significantly lengthens the lead time. Full melting of
Univers
ity of
Mala
ya

8
powder is achieved in SLM because of the use of high-intensity laser and binder materials
without the post-processing processes. SLM technology provides improvements in
production lead time, quality of the product, and reliability of the manufactured part
compared to binder-based laser sintering AM processes (Yap et al., 2015).
According to the SLM process shown in Figure 2.1, the CAD data transfers the design
directly to the machine to fabricate a part via the layer-by-layer with the aid of high laser
power. High laser power helps to fuse small powder particles together. One layer of powder
is spread over the building platform and heated just below the melting temperature. With the
Figure 2.1: Basic of SLM process Univers
ity of
Mala
ya

9
help of the laser, the temperature will slightly increase and selectively melt the powder
particles. The building platform is lowered by one-layer thickness upon the completion of
one layer. Subsequently, a new material layer is applied on top of the melted layer. When the
laser is exposed to the new layer, it melts and bonds to the previous layer. The process is
repeated until the object is completed. The solid part is built up through the consolidation of
powder particles with a focused laser beam that selectively scans the powder bed surface. It
occurs either by diffusion bonding or actual fusion of the powder particles (Calignano et al.,
2012).
The basic components of this technology normally comprise a laser system including an
optical system, a recoater for spreading the powder on the powder bed, feed pistons to store
the fresh powder, and a cylinder where the part is manufactured. Other components included
may be heaters located above the feed pistons. A computer controls all these components
through separate programmable logic controllers, electronics and sensors (Stucker, 2001).
In addition, the process can mesh layers above/onto each other at one time to create more
objects. Excess powder can be reused, but it still needs to be thoroughly sieved before the
next usage.
2.4 Materials
Laser melting is utilized to build parts of metallic materials that are fully melted. Several
materials can be used with this technology, such as low-cost powders like tool, brass and
steel, or high-quality materials like Inconel, titanium, nitinol and cobalt chrome. Stainless
steel 316L is known as one of the metallic materials that provide better mechanical properties,
corrosion resistance and biocompatibility (Dewidar, Khalil, & Lim, 2007). Also, this material
is popular metal for use in biomedical such as acetabula cup (one half of an artificial hip
joint) applications. Current applications of stainless steel 316L processed by SLM have been
Univers
ity of
Mala
ya

10
studied in (Tolosa, Garciandía, Zubiri, Zapirain, & Esnaola, 2010) to produce dental caps;
ultralight structures with over 450 holes and channels per cubic meter for aircraft,
automotive, and medical industries; thin walled (0.5 mm) 40×40-mm assembly parts; and
chirurgical devices. This popularity stems from a satisfactory combination of good
mechanical properties and reasonable cost.
2.5 Process Parameters
Several input parameters need to be controlled or varied since the final quality of the
manufactured parts totally depends on the SLM process parameters applied. The SLM
process parameters are shown in Figure 2.2:
The quality of manufactured parts are also affected by some parameters that impact the
energy density (Krishnan et al., 2014). Energy density is given in Equation (2.1):
Ed= P
v . hd
(2.1)
Figure 2.2: SLM process parameters (Stwora & Skrabalak, 2013) Univers
ity of
Mala
ya
11
Where, Ed = Energy density (J/mm2) P = laser power (W), hd = hatching distance (mm) and
v = scanning speed (mm/s).
The energy density is also computed from the nominal values of the process parameters by
using Equation (2.1). Based on Equation (2.1), high laser power and/or low scanning speed
will increase the energy density and temperature. Then the energy density must be increased
to produce metal parts, but greater energy density may produce curling effects. The thermal
effect of the laser energy raises the bed temperature, so the loose powder will bond together
(A. Simchi & Pohl, 2003).
2.5.1 Laser Power
Laser power contributes significantly to the surface quality of manufactured parts. Lower
laser power produces lower surface roughness results. In contrast, applying higher laser
power can smoothen and improve the melt pool in the layer connection and increase the
wettability of the melt. Hence, high laser power reduces the occurrence of the balling
phenomenon by relieving surface tension variations. Moreover, large amounts of material
can vaporize when the laser power is too high, which disrupts the melt pool surface and
increases the top surface roughness (Calignano et al., 2012).
Defects like shrinkage, warping and balling may develop when unsuitable laser power values
are applied. High laser power could completely melt and even break up the material due to
excessive shrinkage and high residual stresses, producing many visible cracks (Zhang, Liao,
& Coddet, 2012). However, insufficient energy from low laser power might not induce
significant melting of the metallic powders, which would inevitably lead to laminated
structure formation in the powders.
Univers
ity of
Mala
ya

12
Laser power has a significant effect on the density, because when greater laser power is
applied, it leads to higher densification (Stwora & Skrabalak, 2013). This is in line with the
energy density calculated, whereby with increasing laser power the energy density also
increases (Krishnan et al., 2014; A. Simchi & Pohl, 2003).
Laser power has an important influence on hardness, because hardness has a direct
relationship with the densification level. Hardness decreases when lower laser power is
applied. This is due to the many un-melted particles and the balling phenomenon that occurs.
Low laser power only melts the surface resulting a poor bond neck between the particulates.
This indicates that the parts have no mechanical strength and present a loose metal structure
(Zhang et al., 2012).
The effect of laser power on the parts manufactured with material by SLM on the dynamic
mechanical properties was studied by (Sharma, Singh, Sachdeva, & Kumar, 2013). They
found that the surrounding powder particles as well as the target particles melted as the
powder bed received an extra heat when the laser power was increased to higher levels.
Furthermore, high laser power had delivered extra energy to the powder material for sintering
and melting. Hence, the powder particles became closely packed, which boosts mechanical
properties.
The effects of laser power on the tensile properties and structure of printing materials in parts
manufactured with titanium(Ti) powder were studied by (Hanzl, Zetek, Bakša, & Kroupa,
2015). The researchers found that the energy transferred to the powder influenced the melting
temperature as well as the liquid phase extent in the melted components. Laser power was
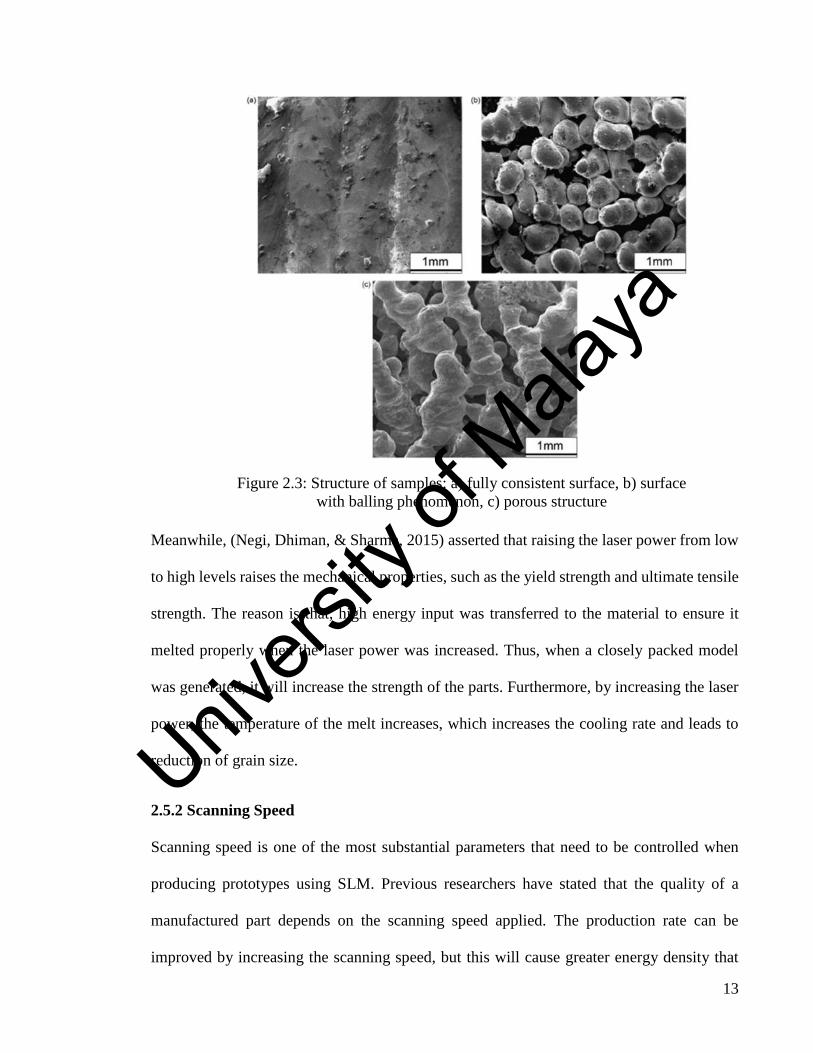
the main parameter affecting the mentioned energy. Based on the microstructural analysis in
Figure 2.3, high laser power formed a fully consistent melted surface. However, a porous
structure with open pores at the surface was exhibited when the laser power was reduced.
Univers
ity of
Mala
ya
13
Meanwhile, (Negi, Dhiman, & Sharma, 2015) asserted that raising the laser power from low
to high levels raises the mechanical properties, such as the yield strength and ultimate tensile
strength. The reason is that, high energy input was transferred to the material to ensure it
melted properly when the laser power was increased. Thus, when a closely packed model
was generated, it will increase the strength of the parts. Furthermore, by increasing the laser
power, the temperature of the melt increases, which increases the cooling rate and leads to
reduction of grain size.
2.5.2 Scanning Speed
Scanning speed is one of the most substantial parameters that need to be controlled when
producing prototypes using SLM. Previous researchers have stated that the quality of a
manufactured part depends on the scanning speed applied. The production rate can be
improved by increasing the scanning speed, but this will cause greater energy density that
Figure 2.3: Structure of samples: a) fully consistent surface, b) surface
with balling phenomenon, c) porous structure
Univers
ity of
Mala
ya

14
affects the manufactured part properties. (Y.-A. Song & Koenig, 1997) reported that reducing
the scanning speed will widen the scan lines and hence, decreased the porosity percentage.
Scanning speed has the greatest influence on surface roughness (Calignano et al., 2012). Low
scanning speed results in better surface finish, since the melt pools have more time to
smoothen before solidification. However, the volume amount of liquid formed within the
melt pool may increase when the scanning speed applied is too low. This is because of the
same melt pool may widen, causing a higher thermal difference over it and thus leading to
greater surface tension variations. Then the melt pool may break off into smaller entities – a
process known as “balling” that increases the surface roughness.
Hardness of the manufactured part will be increased when the scanning speed increased. This
can be attributed to the higher melt temperature and cooling rate, producing smaller size
grains hence raise the hardness of the manufactured part (Sateesh, Kumar, Prasad, C.K, &
Vinod, 2014).
In addition, the sintered density reduces when the scanning speed increases (Kruth et al.,
2010; A. Simchi & Pohl, 2003). Based on a microstructural analysis, when the scanning
speed decreases, the energy density increases and the melt pool widens, thus increasing the
overlapping of scan lines and leading to lower porosity percentages. Scanning speed also has
a significant effect on the microstructure and dimensional accuracy of manufactured parts
according to (Sateesh et al., 2014), who found that the dimensional accuracy decreases when
the scanning speed increases. This happens because of the increasing melt temperature that
leads to a decrease in molten metal viscosity and greater flowability. According to (Sateesh
et al., 2014) also investigated the effects of density on the scanning speed parameter. They
determined that the density decreases with increasing scanning speed. This can be explained
Univers
ity of
Mala
ya

15
in terms of laser energy, where the laser energy density is proportional to the laser power and
inversely proportional to the scanning speed.
The effects of scanning speed on yield strength and ultimate tensile strength were discussed
by (Negi et al., 2015), who found that increasing the scanning speed decreases the yield
strength and ultimate tensile strength. This phenomenon happened when the higher scanning
speed applied, the energy absorbed by the melted material over a unit time and a unit area
decreases, and thus improper sintering occurs due to insufficient energy delivered. Thus, the
part strength deteriorates.
2.5.3 Hatching Distance
The hatching distance is the distance between two consecutive scan lines, as shown in Figure
2.4:
Hatching distance is the main factor influencing the hardness and density of manufactured
parts. Increasing the hatching distance leads to a detrimental effect that diminishes the
hardness and density. Moreover, a greater hatching distance reduces the sintered density and
overlapping of melt pools within the layer. Subsequently, the porosity percentage of the
Figure 2.4: Illustration of hatching distance Univers
ity of
Mala
ya

16
manufactured part increases (A. Simchi & Pohl, 2003). However, increasing the hatching
distance improves the production rate (Krishnan et al., 2014).
Hatching distance has significant effect on manufactured parts as seen in Figure 2.5, where
a part with less than 0.3 mm was unsuccessfully built. The process cannot continue due to
recoater blade jamming and balling that occurred on account of the lower hatching distance
applied (Sateesh et al., 2014). In addition, lower hatching distance can lead to low hardness
due to the larger grain size in the manufactured part (Sateesh et al., 2014). Furthermore, a
smaller hatching distance causes an increase in energy density and possible curling on the
manufactured part (Krishnan et al., 2014).
Hatching distance also impacts the strength of manufactured parts when (Negi et al., 2015)
indicated that increasing the hatching distance reduces the strength of the parts manufactured.
This can be justified by the fact that a high hatching distance leads to pack poorly of the
Figure 2.5: Laser-sintered Inconel 625
Univers
ity of
Mala
ya

17
powder particles. For that reason, high chance of curling and clinging happened on the layer
and causes the next layer from melting properly, which leads to poor part strength.
2.5.4 Building Direction
Building direction impacts the surface roughness more than the aforementioned process
parameters. The mechanical properties, surface roughness and dimensional error of parts
manufactured by direct metal laser sintering (DMLS) and SLM are subject to the process
parameters applied, which are the scanning speed, layer thickness and building direction, as
studied by (Delgado et al., 2011). Based on their discussion, building direction has significant
impact on surface roughness obtained by DMLS and SLM. When the building direction was
changed from low to high degree (0o to 90o), the surface roughness increased. According to
the surface roughness measured in Figure 2.6, the top surface has less dimensional control so
it is more accurate to measure the surface roughness on the X-Y plane than the lateral surface
on the Y-Z plane.
Building direction additionally has strong influence on dimensional accuracy. When the
building direction was changed from 0o to 90o, greater dimensional error was obtained in the
width direction.
Univers
ity of
Mala
ya

18
In recent years, the anisotropic tensile properties of parts manufactured by SLM have
received much attention, particularly building direction (Guan, Wang, Gao, Li, & Zeng,
2013). The vertical building direction exhibits a great combination of ductility and strength,
while the other side, horizontal building direction produces better tensile strength.
2.5.5 Layer Thickness
According to (Guan et al., 2013), the producibility of parts manufactured by SLM increases
when thicker layers are applied, because the time to build the parts can be reduced while the
tensile strength and ductility of the manufactured parts remain good. This is because layer
thickness does not have a significant effect on the tensile strength and ductility of
manufactured parts. Moreover, when the layer thickness increases, the balling phenomenon
will occur due to insufficient energy density delivered to melt the powder. The presence of
un-melted powder on the former melted layer may disturb the subsequent powder deposition
process or it may cause the whole process to fail. Based on a microstructural study (Guan et
Figure 2.6: Surface roughness measurements at a) 0o and b) 90o
Univers
ity of
Mala
ya

19
al., 2013) of the differences in layer thickness, no obvious difference was detected during
observations of various layer thicknesses used. The slice thicknesses affect the surface
2.6 Design of Experiments
To investigate the interaction between parameters, a design of experiments (DOE) needs to
be created. The relationship between various factors and the output can be determined by
using DOE, since it is an organized and structured method (Phadke, 1995).
2.6.1 Taguchi Method
One of the DOE is the Taguchi method that is based on the experimental design arrangement
otherwise known as orthogonal array design. The advantage of the Taguchi method is the
minimal number of experiments required from a set of control factors. It is still an effective,
efficient, simple and reliable means to attain optimum results. In this study, the response
parameters affecting the mechanical properties can be optimized (Rahmati, Sarhan, & Sayuti,
2014).
There are a few stages in the Taguchi optimization, which include choosing the orthogonal
array (OA) based on the number of controllable factors, starting the experiments by following
the OA, analyzing the results, recognizing the optimum parameters using S/N ratios and
ANOVA analysis, and conducting confirmation tests of the new optimum process parameters
or factors. S/N ratios are known as log functions that serve as functions for optimization,
assisting with data analysis and obtaining the preliminary or predicted output of the new
optimum process parameters. S/N ratios are dependent on the experiment objectives
(Jugulum & Samuel, 2008).
Univers
ity of
Mala
ya

20
2.7 Shot Peening
Shot peening is a cold working process that is used as a finishing technique for metallic parts.
The objective of this process is to prevent fatigue and corrosion, thereby increasing the life
cycle of manufactured parts. It involves the use of small spherical shots, which are
bombarded onto the surface of a part in other to obtain a better surface finish. The shot
peening method has proven to be the most economical and effective way of producing surface
residual compressive stresses, thus increasing the life span of treated metals. Furthermore,
shot peening has been found to be a viable technique of enhancing the mechanical resistance
of SLM parts, straightening distortions generated during production, and producing
aerodynamic curvatures for aerospace applications (Frija, Hassine, Fathallah, Bouraoui, &
Dogui, 2006; Torres & Voorwald, 2002) . In addition, other research works have indicated
that the shot peening process could be used to enhance the surface quality of SLM
manufactured parts (Calignano et al., 2012).
2.8 Summary of Literature Review
Based on the literature review, few investigations report on the parameter variations
that influence the physic-mechanical properties of parts manufactured using SLM
technology. Furthermore, little research has been conducted to improve the physic-
mechanical properties of SLM manufactured parts. Hence, the focus in this research is on the
parameters that may have greater influence on parts manufactured by SLM, namely laser
power, scanning speed and hatching distance. In addition, the physic-mechanical properties
are improved in this research to ensure that the quality of parts manufactured by SLM is
comparable with that of solid materials produced using conventional methods.
Univers
ity of
Mala
ya
21
CHAPTER 3 : METHODOLOGY
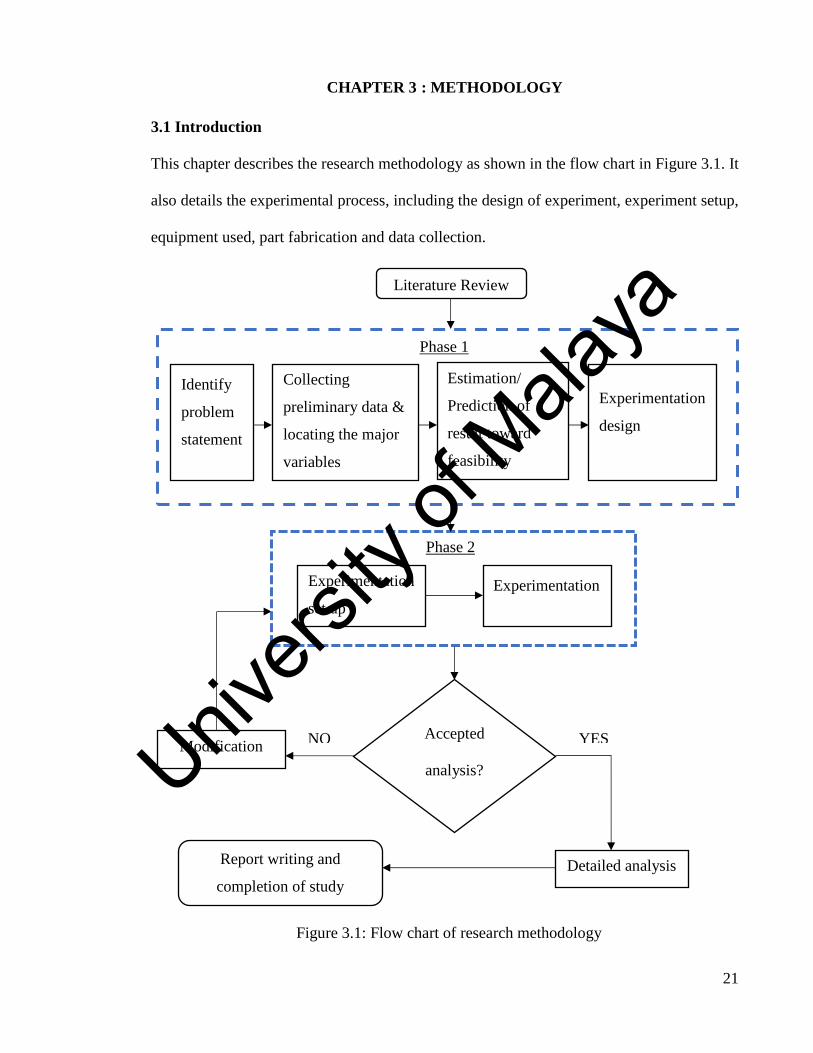
3.1 Introduction
This chapter describes the research methodology as shown in the flow chart in Figure 3.1. It
also details the experimental process, including the design of experiment, experiment setup,
equipment used, part fabrication and data collection.
Accepted
analysis?
Detailed analysis Report writing and
completion of study
Modification YES NO
Identify
problem
statement
Collecting
preliminary data &
locating the major
variables
Estimation/
Prediction of
result toward
feasibility
Experimentation
design
Literature Review
Phase 1
Experimentation
set up
Experimentation
Phase 2
Figure 3.1: Flow chart of research methodology
Univers
ity of
Mala
ya

22
3.2 Materials and Sample Preparation
In SLM, a laser source moves at a set scanning speed and selectively melts line-by-line each
layer of powder material. The diameter of the physical beam is usually smaller than the
diameter of the area where the particles are melted. The specifications and operation range
of the SLM 280HL machine used in this study are given in Table 3.1. The system software
developed can perform functions such as transferring the CAD models in STL format to the
layer data required by the machine. Besides, it can combine several parts to be manufactured
on one building platform and select the drive data according to the different process
requirements of each part.
Table 3.1: SLM 280HL specifications
Building Platform (H x W x L) 365 mm3 x 280 mm3 x 280 mm3
3D optics configuration/Dual
configuration:
with switching unit
Single (1x700 W), Twin (2x700 W), Dual
(1x700 W and 1x1000 W); Single (1x400 W),
Twin (2x400 W), Dual (1x400 W and 1x1000
W) IPG fiber laser
Powder materials available Titanium, tool steel and stainless steel,
aluminum, cobalt-chrome and nickel-based
alloys
Weight (with/without powder) approx. 1500 kg/ca. 1300 kg
Machine size (H x W x L) 2850 mm x 1050 mm x 3050 mm
Compressed air
requirements/Consumption
ISO 8573-1:2010 [1:4:1], 50 l/min @ 6 bar
Power input/E-connection 400 Volt 3NPE, 32 A, 50/60 Hz, 3.5 – 5.5 kW
Gas consumption purging (average) 70 l /min (argon)
Gas consumption in process (average) 2.5 l/min (argon)
Minimum feature size 150 µm
Building rate Up to 55 cm3/h
Laser beam diameter 80 - 115 µm
Layer thickness 20 µm - 75 µm
Maximum scanning speed 10 m/s
Univers
ity of
Mala
ya
23
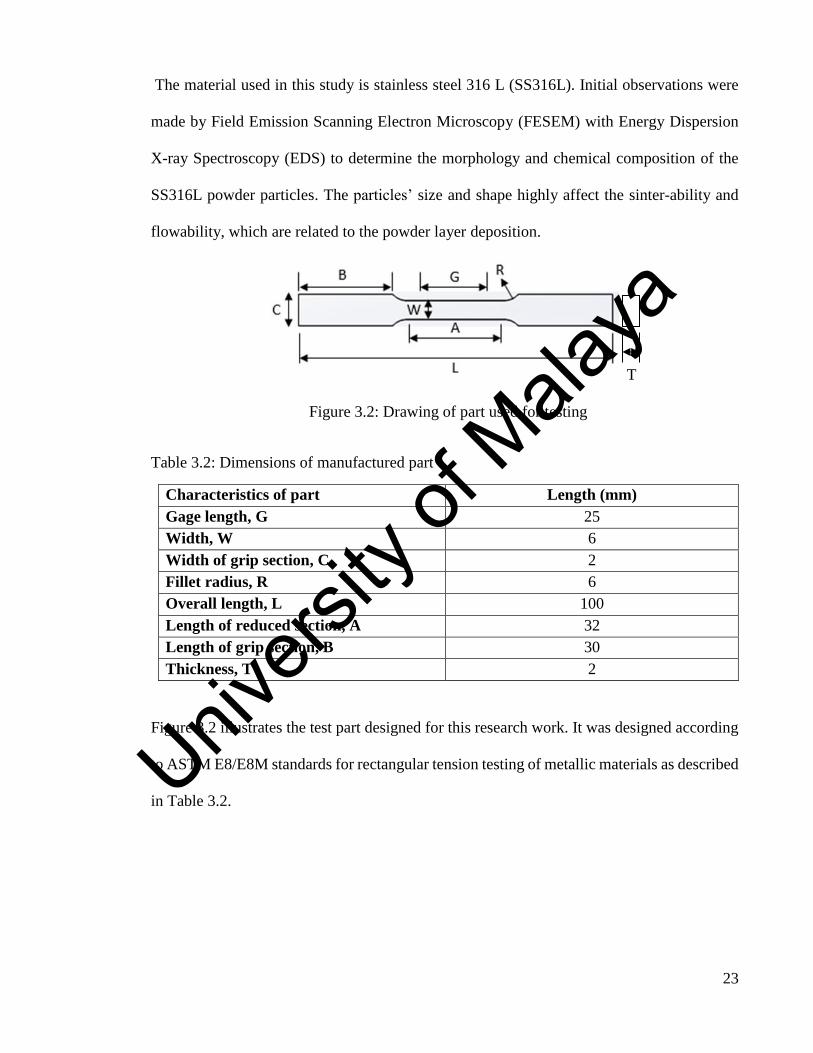
The material used in this study is stainless steel 316 L (SS316L). Initial observations were
made by Field Emission Scanning Electron Microscopy (FESEM) with Energy Dispersion
X-ray Spectroscopy (EDS) to determine the morphology and chemical composition of the
SS316L powder particles. The particles’ size and shape highly affect the sinter-ability and
flowability, which are related to the powder layer deposition.
Table 3.2: Dimensions of manufactured part
Characteristics of part Length (mm)
Gage length, G 25
Width, W 6
Width of grip section, C 2
Fillet radius, R 6
Overall length, L 100
Length of reduced section, A 32
Length of grip section, B 30
Thickness, T 2
Figure 3.2 illustrates the test part designed for this research work. It was designed according
to ASTM E8/E8M standards for rectangular tension testing of metallic materials as described
in Table 3.2.
T
Figure 3.2: Drawing of part used for testing
Univers
ity of
Mala
ya

24
3.3 Design of Experiments
The design of experiments (DOE) was set up to determine the relationship between factors
affecting a process and the process output. This information is needed to manage the process
inputs in order to optimize the output.
Table 3.3: Process parameters
Parameter
Units Symbol
Level
1 2 3 4
Laser Power Watts
(W)
P 120 200 275 360
Scanning
Speed
mm/s v 250 510 760 900
Hatching
distance
mm hd 0.08 0.10 0.12 0.14
The laser power, scanning speed and hatching distance employed are stated in Table 3.3.
These three parameters were chosen based on standard machine laser power, scanning speed
and hatching distance reported by the machine manufacturers. Moreover, both layer
thickness and laser focus diameter were kept constant as 50 µm and 80 µm, respectively. The
variations in process parameter values depend on the limitations of the machine used in the
experiments. Other parameters that have potential effects on surface roughness were kept
constant, as these parameters are outside the scope of the study.
Before conducting the experiment, the design of experiment was set up. For this study, the
Taguchi method was used to conduct the experiment, which is based on the orthogonal array
design. This design provides reduced variance in the experimentation process with optimum
control parameter settings. The S/N ratios are the log functions utilized to find the optimum
parameter settings. They also help with data analysis and predicting the optimum results.
Univers
ity of
Mala
ya

25
According to the full factorial technique, 64 tests should be done and that would be time-
consuming and costly. Hence, the Taguchi method reduces the number of experiments from
64 to 16. The Taguchi experimental design with three control factors and four levels each
(Table 3.4) was prepared to determine the effectiveness of the selected parameters on the
manufactured part properties. This was done using the design of experiments and analysis in
MINITAB software. The experiment was designed based on the L16 orthogonal array with
the Taguchi method. To assure the accuracy of the results obtained from the experiments,
each experiment was repeated three or five times, and the average of the results was taken.
Furthermore, ANOVA statistical analysis and S/N ratios were applied to evaluate the factors
that influence the properties of the manufactured part.
Table 3.4: Taguchi design
No P (W) v (mm/s) hd (mm) Ed (J/mm2)
1 120 250 0.08 6.00
2 120 510 0.10 2.35
3 120 760 0.12 1.32
4 120 900 0.14 0.95
5 200 250 0.10 8.00
6 200 510 0.08 4.90
7 200 760 0.14 1.88
8 200 900 0.12 1.85
9 275 250 0.12 9.17
10 275 510 0.14 3.85
11 275 760 0.08 4.52
12 275 900 0.10 3.06
13 360 250 0.14 10.29
14 360 510 0.12 5.88
15 360 760 0.10 4.74
16 360 900 0.08 5.00
Univers
ity of
Mala
ya

26
3.4 Testing
3.4.1 Surface roughness
The surface roughness of each sample was obtained accordingly to the ANSI Mitutoyo
Surftest SJ-210 surface roughness tester standard (Figure 3.3). The surface roughness value
(Ra) was measured three times at three different locations (on top). To ensure result accuracy,
every experiment was repeated three times and the average of the results was taken.
Figure 3.3: Mitutoyo Surftest SJ-210
Univers
ity of
Mala
ya

27
3.4.2 Dimensional accuracy
Dimensional accuracy in additive manufacturing describes the geometrical difference
between a virtually designed CAD part and a physical part after the building process
Dimensional errors occurred when the dimensional accuracy does not meet the quality target,
or the accuracy worsens. Dimensional accuracy is one of the main concerns in AM
technologies (Lee, Chung, Lee, Yoo, & Ko, 2014), whereby it is important for the
manufactured parts to be designed for products that can fit tightly with each other, especially
in the biomedical industry. SLM process can be checked by comparing the features of the
parts, such as cylinders, rectangular slots and angles (Kamarudin, Wahab, Raus, Ahmed, &
Shamsudin, 2017).
Dimensional measurements were made with an Oxford precision micrometer with 0.01
resolution and 0-25 mm measurement range. The thickness of the manufactured part was
measured as in Figure 3.4 and the dimensional accuracy was calculated with Equation (3.1):
Dimensional accuracy (%) = |thicknesstheoretical- thicknessexperimental
thicknesstheoretical
| x 100 % (3.1)
Figure 3.4: Oxford precision micrometer
Univers
ity of
Mala
ya
28
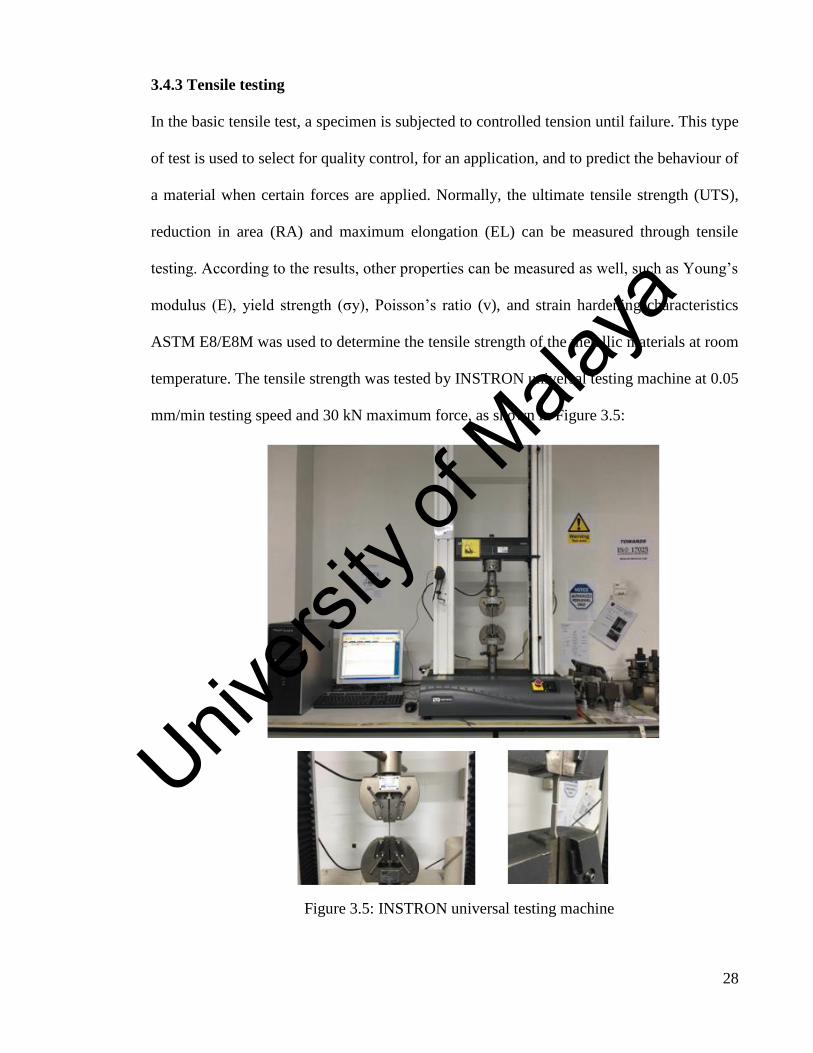
3.4.3 Tensile testing
In the basic tensile test, a specimen is subjected to controlled tension until failure. This type
of test is used to select for quality control, for an application, and to predict the behaviour of
a material when certain forces are applied. Normally, the ultimate tensile strength (UTS),
reduction in area (RA) and maximum elongation (EL) can be measured through tensile
testing. According to the results, other properties can be measured as well, such as Young’s
modulus (E), yield strength (σy), Poisson’s ratio (v), and strain hardening characteristics
ASTM E8/E8M was used to determine the tensile strength of the metallic materials at room
temperature. The tensile strength was tested by INSTRON universal testing machine at 0.05
mm/min testing speed and 30 kN maximum force, as shown in Figure 3.5:
Figure 3.5: INSTRON universal testing machine
Univers
ity of
Mala
ya

29
3.4.4 Hardness
Hardness test is to determine the hardness of the solid matter when some of a compressive
force is applied where, metal materials are stronger/harder than other materials. Generally,
macroscopic hardness is characterized by strong intermolecular bonds, but the reaction of
solid materials under force is complex. Hence, few others measurements are doneto obtain
the material hardness such as scratch hardness, rebound hardness and indentation hardness.
The hardness performance is dependent on elastic stiffness, ductility, plasticity, strength,
strain, viscosity, viscoelasticity and toughness.
Hardness testing is one of the steps required to check the quality of parts manufactured using
SLM. A Vickers Hoytom Minor-69 hardness tester was used to analyze the hardness of the
manufactured part, as illustrated in Figure 3.6. To obtain the average hardness of the
manufactured part, five measurements were taken in different areas. The testing was done
accordingly to ISO 6507-1:2005 standard.
Figure 3.6: Vickers Hoytom Minor-69
Univers
ity of
Mala
ya

30
3.4.5 Porosity
The density and porosity of the manufactured part were measured by volumetric method. The
mass of each manufactured part was measured in air and water three times with an electronic
balance and the average mass was calculated. An initial water volume of 20 mL was added
to a cylinder and then the manufactured part was immersed in the water. The final volume
was measured. The density of the manufactured part was calculated with Equation (3.2):
ρexperiment
= ma
Vf-Vi
(3.2)
Where ρexperiment is the manufactured part density, Vf is the final volume and Vi is the initial
volume. The difference between the theoretical and experimental density is termed porosity.
Equation (3.3) was used to calculate the percentage of porosity in the manufactured part.
Porosity (%)= |1-ρ
experiment
ρtheoretical
| x 100% (3.3)
where ρexperiment is the density of the manufactured part and ρtheoretical is the density of stainless
steel 316L, which is 8 g/cm3.
3.5 Shot Peening
In order to improve the mechanical properties of the manufactured part, shot peening was
applied for 6 parameter settings (i.e. six experiments) using a Peenmatic 620 S machine
(Figure 3.7) at 4 bars of pressure. Next, the Ra before and after shot peening was analyzed to
find the variation.
Univers
ity of
Mala
ya

31
3.7 Data Analysis
ANOVA statistical analysis and S/N ratio were applied to evaluate the factors that influence
the properties of the manufactured part. The S/N ratio is a log function used to find the
optimum parameter settings. It also helps with the data analysis and in predicting the
optimum results. The design of experiment and analysis were done using MINITAB
software.
Figure 3.7: Peenmatic 620 S machine
Univers
ity of
Mala
ya

32
CHAPTER 4 : RESULTS AND DISCUSSION
4.1 Powder Analysis
The SS316L metal powder underwent gas atomization due to the suitability of this process
for producing materials for additive manufacturing technologies (Kearns & Murray, 2010).
The morphology and chemical composition of the SS316L powder particles were obtained
using field emission scanning electron microscopy (FESEM) with energy dispersion x-ray
spectroscopy (EDX). Moreover, the shape and size of the powder particles were observed
due to the high effect they have on the sinter-ability and flow-ability of the material.
According to Figure 4.1, the shape of the particles seems to be spherical and it is agglomerates
to each other between tiny powder particles with bigger powder particles. The average of the
particle size distribution of the powders is 30 µm. The chemical composition of the powder
particles observed with the aid of EDX is given in Table 4.1.
Figure 4.1: FESEM micrographs of SS316L metal powder before melting at
500x magnification
Univers
ity of
Mala
ya
33
Table 4.1: Chemical composition of SS316L
Element Carbon,
C
Iron, Fe Nickel,
Ni
Silicon,
Si
Molybdenum,
Mo
Chromium,
Cr
Wt % 00.66 55.56 15.65 00.82 04.29 22.00
At % 02.90 52.75 14.14 01.54 02.37 22.44
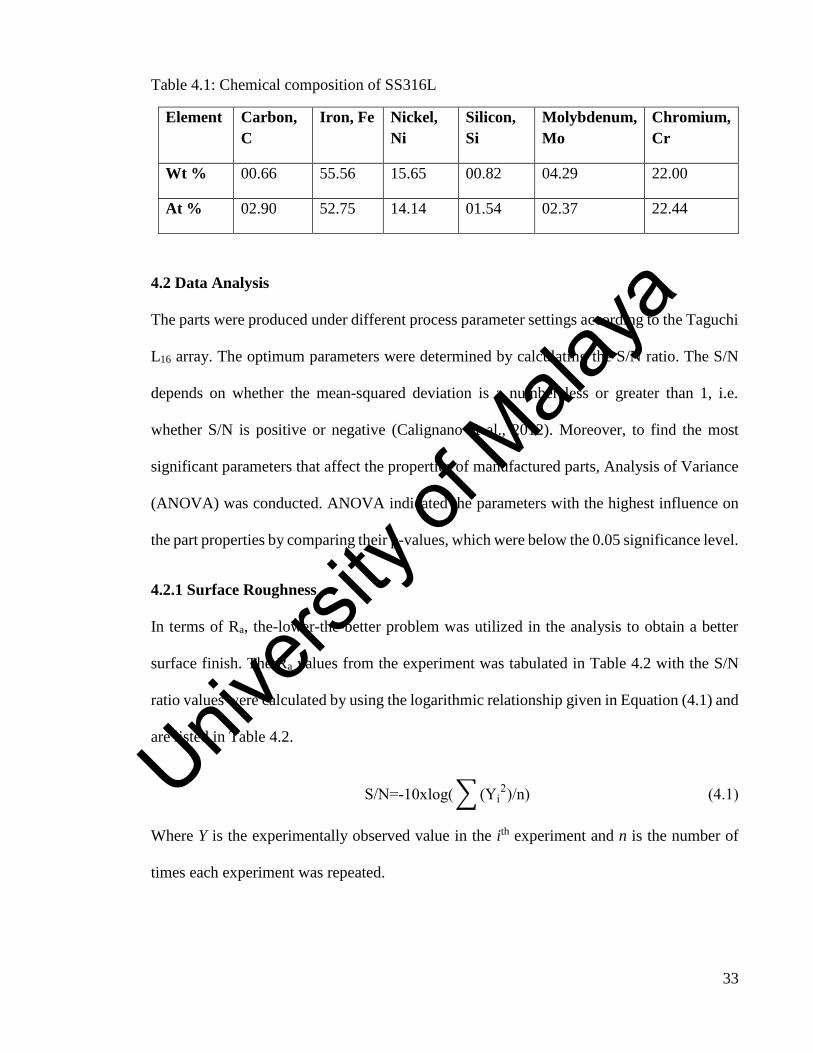
4.2 Data Analysis
The parts were produced under different process parameter settings according to the Taguchi
L16 array. The optimum parameters were determined by calculating the S/N ratio. The S/N
depends on whether the mean-squared deviation is a number less or greater than 1, i.e.
whether S/N is positive or negative (Calignano et al., 2012). Moreover, to find the most
significant parameters that affect the properties of manufactured parts, Analysis of Variance
(ANOVA) was conducted. ANOVA indicated the parameters with the highest influence on
the part properties by comparing their p-values, which were below the 0.05 significance level.
4.2.1 Surface Roughness
In terms of Ra, the-lower-the-better problem was utilized in the analysis to obtain a better
surface finish. The Ra values from the experiment was tabulated in Table 4.2 with the S/N
ratio values were calculated by using the logarithmic relationship given in Equation (4.1) and
are listed in Table 4.2.
S/N=-10xlog( ∑ (Yi2)/n) (4.1)
Where Y is the experimentally observed value in the ith experiment and n is the number of
times each experiment was repeated.
Univers
ity of
Mala
ya

34
Table 4.2: Experiment, Ra and S/N ratio results based on different process parameter
combinations using the L16 array
No P, W v,
mm/s
hd,
mm
Ra 1,
µm
Ra 2,
µm
Ra 3,
µm
Average
Ra,
µm
S/N
ratio
1 120 250 0.08 9.64 9.87 10.24 9.92 -19.93
2 120 510 0.1 10.69 12.16 11.75 11.53 -21.24
3 120 760 0.12 9.48 10.16 10.75 10.13 -20.11
4 120 900 0.14 10.12 10.48 9.73 10.11 -20.10
5 200 250 0.1 13.21 14.16 11.53 12.97 -22.26
6 200 510 0.08 11.65 12.32 13.52 12.50 -21.94
7 200 760 0.14 13.14 10.90 11.14 11.72 -21.38
8 200 900 0.12 11.20 11.60 10.83 11.21 -20.99
9 275 250 0.12 18.47 18.24 18.93 18.55 -25.37
10 275 510 0.14 20.26 21.51 18.47 20.08 -26.06
11 275 760 0.08 16.92 13.35 13.01 14.43 -23.18
12 275 900 0.1 11.12 12.28 10.49 11.30 -21.06
13 360 250 0.14 33.57 32.91 40.78 35.75 -31.07
14 360 510 0.12 23.40 27.86 20.91 24.06 -27.62
15 360 760 0.1 30.65 26.21 27.75 28.20 -29.01
16 360 900 0.08 25.75 14.58 20.08 20.13 -26.08
A sufficient amount of energy (energy density) is needed to deliver the powder on the part’s
bed surface in order to produce a good, functional melted part. If the amount of energy is
insufficient, a poor bond neck may form between the powder particles. Thus, the surface
finish can be enhanced by increasing the energy density up to an optimum level (Cherry et
al., 2015).
The ANOVA analysis for S/N ratio is presented in Table 4.3. To determine which parameters
were the most significant on the surface quality of the manufactured part, the p-values of the
parameters were compared. According to the table, it appears that the laser power factor has
the highest influence on surface quality because it has the lowest p-value (<0.05 significance
level).
Univers
ity of
Mala
ya
35
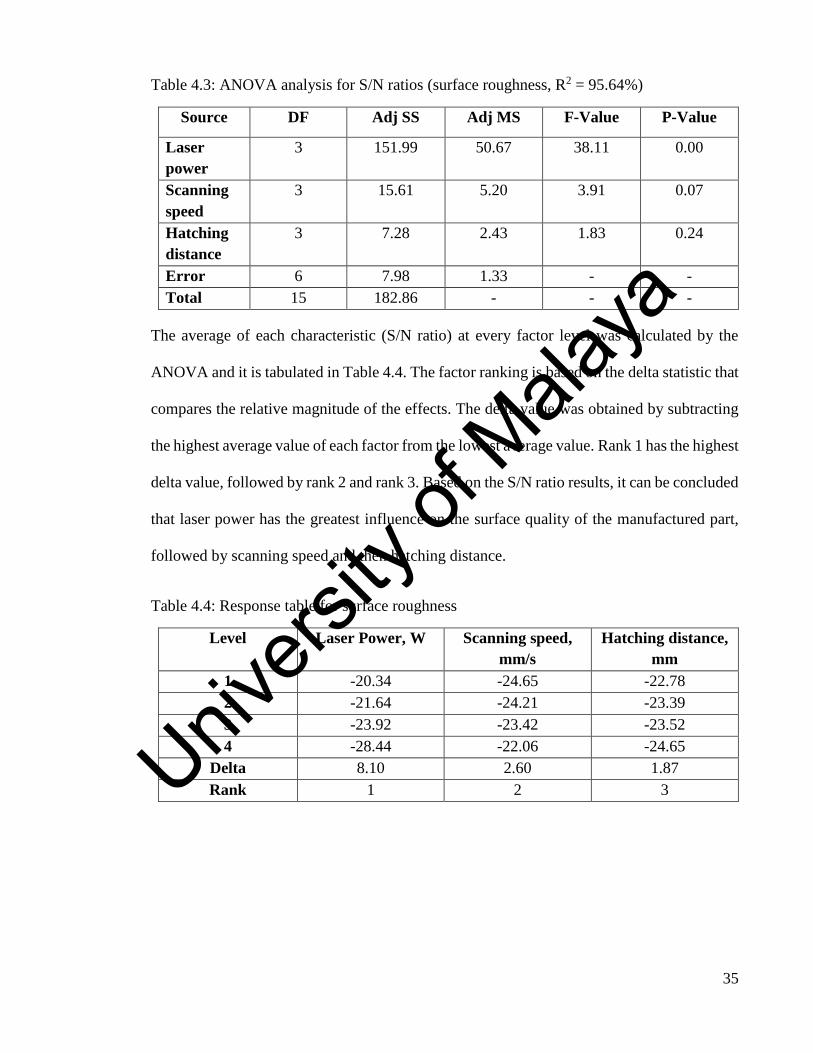
Table 4.3: ANOVA analysis for S/N ratios (surface roughness, R2 = 95.64%)
Source DF Adj SS Adj MS F-Value P-Value
Laser
power
3 151.99 50.67 38.11 0.00
Scanning
speed
3 15.61 5.20 3.91 0.07
Hatching
distance
3 7.28 2.43 1.83 0.24
Error 6 7.98 1.33 - -
Total 15 182.86 - - -
The average of each characteristic (S/N ratio) at every factor level was calculated by the
ANOVA and it is tabulated in Table 4.4. The factor ranking is based on the delta statistic that
compares the relative magnitude of the effects. The delta value was obtained by subtracting
the highest average value of each factor from the lowest average value. Rank 1 has the highest
delta value, followed by rank 2 and rank 3. Based on the S/N ratio results, it can be concluded
that laser power has the greatest influence on the surface quality of the manufactured part,
followed by scanning speed and then hatching distance.
Table 4.4: Response table for surface roughness
Level Laser Power, W Scanning speed,
mm/s
Hatching distance,
mm
1 -20.34 -24.65 -22.78
2 -21.64 -24.21 -23.39
3 -23.92 -23.42 -23.52
4 -28.44 -22.06 -24.65
Delta 8.10 2.60 1.87
Rank 1 2 3
Univers
ity of
Mala
ya

36
Main Effects Plot for Surface Roughness Ra
Figure 4.3: Main effect plot surface roughness
Figure 4.2: Interaction plot for surface roughness
30
20
10
0.140.120.100.08
900760510250
30
20
10
360275200120
30
20
10
Laser Power (W)
Scanning Speed (mm/s)
Hatching distance (mm)
120
200
275
360
(W)
Power
Laser
250
510
760
900
(mm/s)
Speed
Scanning
0.08
0.10
0.12
0.14
(mm)
distance
Hatching
Interaction Plot for Surface Roughness, Ra
Univers
ity of
Mala
ya

37
Figure 4.2 contains the main effect plot for S/N ratio that was used to verify the statistical
results obtained. The table displays the response mean for each factor level. In addition, a
horizontal line is drawn at the grand mean and the slopes of the lines relating to the process
parameter levels indicate the effect of each process parameter. It can be seen that the optimum
surface roughness was achieved when the laser power was 120 W, the scanning speed was
900 mm/s and the hatching distance was 0.08 mm.
The interaction between each of the input variables and the surface quality of the
manufactured part is shown in Figure 4.3. Lines that are parallel in the interactions plot
indicate there is no interaction between the given parameters. However, the higher the degree
of line intersection and the less parallel the lines are with one another, the higher the degree
of interaction is. Based on the graph, when the laser power and hatching distance values are
low and the scanning speed value is high, the possibility of obtaining a low Ra value is high.
Scanning speed and hatching distance evidently have a good interaction towards achieving a
good surface finish. Moreover, it is clear there is a strong relationship and interaction between
laser power and scanning speed when the laser power is less than 200 W.
Equation (2.1) indicates there is a directly proportional relationship between energy density
and laser power, and an inversely proportional variation relationship between hatching
distance and scanning speed with energy density. As such, whenever the laser power is
increased and the other two factors are decreased, there seems to be an imminent increase in
the powder temperature. Since there is a temperature gradient between the solidifying zone
and the laser beam when the laser moves, the increase in temperature creates a shear force
on the liquid surface that is contrasted by the surface tension of the melted liquid (Ho,
Cheung, & Gibson, 2002). The interlayer connection and wettability of the melt can then be
improved by applying higher laser power, due to its ability to flatten the melted pool. The
Univers
ity of
Mala
ya

38
tendency of the balling effect to occur can be reduced by improving the wettability due to the
diminished variations in surface tension. However, if laser power is set too high, large
amounts of material may vaporize and recoil pressure may occur that will cause disruptions
to the melt pool surface and thereby increasing the Ra (Stwora & Skrabalak, 2013). When an
optimum scanning speed is utilized, the top surface finish can be improved. This is because
the melt pool will have more time to flatten before solidification with the help of gravity and
surface curvature forces that counteract the external shear forces. Moreover, larger volumes
of liquid produced within the melt pool are also achievable by utilizing low scanning speed.
The reason is that the increased liquid volume has a tendency to widen the melt pool, thereby
causing larger thermal differences across it and consequently varying the surface tensions. In
addition, using optimum scanning speed causes the non-melted particle cores to bake together
into coarsened balls with a diameter almost the same as that of the beam. To minimize these
changes, the melt pool may break off into smaller entities -- which is known as “balling,”
thereby solidifying the edge of the melt pool and thus increasing the surface roughness, Ra.
Optimal parameters allow stabilizing thermal processes, consequently avoiding the balling
effect.
4.2.2 Dimensional Accuracy
The dimensional accuracy values of the parts are listed in Table 4.5. After evaluating the
response, ANOVA analysis was conducted to determine the highest influence on the
accuracy of the manufactured parts. The optimum parameters were determined using the
lower-the-better approach of dimensional error percentage as in Equation (4.1). The
dimensional accuracy was calculated with Equation (4.2).
Univers
ity of
Mala
ya

39
Dimensional Accuracy %= |A0-A1
A0
| (4.2)
Where A0 is the design size given by the computer and A1 is the actual size measured by a
micrometer screw gauge.
Based on the table below, the average thickness of the manufactured parts for each setting
parameter is higher than the drawing value (2 mm). The results also clearly show that higher
dimensional error occurred when the energy density was increased. The energy density is
related to the process parameters applied, namely laser power, scanning speed and hatching
distance.
Table 4.5: Dimensional accuracy and S/N ratio results
No P,
W
v,
mm/s
hd,
mm
D1,
mm
D2,
mm
D3,
mm
Average,
mm
Dimensi
onal
Accura
cy, %
S/N
Ratio
1 120 250 0.08 2.09 2.08 2.13 2.11 5.67 -15.07
2 120 510 0.1 2.10 2.10 2.11 2.10 5.17 -14.26
3 120 760 0.12 2.08 2.10 2.13 2.10 5.17 -14.26
4 120 900 0.14 2.07 2.10 2.10 2.09 4.56 -13.17
5 200 250 0.1 2.13 2.19 2.10 2.14 7.00 -16.90
6 200 510 0.08 2.08 2.10 2.09 2.12 6.00 -15.56
7 200 760 0.14 2.11 2.13 2.10 2.11 5.67 -15.07
8 200 900 0.12 2.10 2.10 2.09 2.10 4.89 -13.78
9 275 250 0.12 2.10 2.20 2.28 2.19 9.61 -19.66
10 275 510 0.14 2.14 2.15 2.13 2.28 14.15 -23.02
11 275 760 0.08 2.26 2.27 2.28 2.27 13.44 -22.58
12 275 900 0.1 2.15 2.11 2.11 2.12 6.11 -15.72
13 360 250 0.14 2.67 2.68 2.43 2.59 29.67 -29.45
14 360 510 0.12 2.21 2.26 2.21 2.55 27.67 -28.84
15 360 760 0.1 2.42 2.41 2.39 2.50 25.17 -28.02
16 360 900 0.08 2.36 2.27 2.28 2.30 15.17 -23.62
Univers
ity of
Mala
ya

40
The ANOVA analysis of S/N ratios is presented in Table 4.6. To determine which parameters
were the most significant on the surface geometry of manufactured parts, the p-values of the
parameters were compared. The table indicates that laser power is the factor with the greatest
influence on manufactured part accuracy because it has the lowest p-value (<0.05
significance level).
Table 4.6: ANOVA analysis of S/N ratios (dimensional accuracy, R2 = 96.65%)
Source DF Adj SS Adj MS F-Value P-Value
Laser
Power
3 438.63 146.21 52.39 0.00
Scanning
Speed
3 40.34 13.45 4.82 0.05
Hatching
Distance
3 4.52 1.51 0.54 0.67
Error 6 16.75 2.79 - -
Total 15 500.23 - - -
The average of each characteristic (S/N ratio) at every factor level is given in Table 4.7.
Based on the results, it can be concluded that laser power has the most influence on
manufactured part accuracy, followed by scanning speed and hatching distance.
Table 4.7: Response table for dimensional accuracy
Level Laser Power, W Scanning speed,
mm/s
Hatching Distance,
mm
1 -14.19 -20.27 -19.20
2 -15.33 -20.42 -18.73
3 -20.24 -19.98 -19.14
4 -27.48 -16.57 -20.17
Delta 13.29 3.85 1.45
Rank 1 2 3
Univers
ity of
Mala
ya

41
Figure 4.4 shows the main effects plot for S/N ratios that was used to verify the statistical
results obtained. Based on the figure, there is a huge gap in dimensional accuracy between
275 W and 360 W laser power applied. This happened due to the increase in melt temperature,
which led to a decrease in the viscosity of molten metal and an increase in flowability.
Moreover, it is evident that the optimum dimensional accuracy was obtained when the laser
power was 120 W, the scanning speed was 900 mm/s and the hatching distance was 0.08
mm.
The main cause of part inaccuracy was the swelling during melting, which does not always
take place uniformly. In addition, the high process temperature coupled with the melt pool
size and surface tension has a tendency to swell more than lower temperature, while part
geometries like thick walls or sections can boost the swelling phenomenon (Bin & B, 2015).
Besides, more solidified metal over the metal powder will lead to swelling on the
Figure 4.4: Main effects plot for dimensional accuracy, %
Univers
ity of
Mala
ya

42
manufactured part. Another reason swelling happens is that when the next layer to the powder
touches the building platform or previous layer, it quickly solidifies according to the thermal
properties and temperature of the substrate. Due to the different thermal boundary conditions,
the evolution of roads in the first layer differs from that in successive layers.
4.2.3 Tensile Strength
A tensile test was conducted on the manufactured parts and the results are tabulated in Table
4.8. After evaluation, ANOVA analysis was used to determine the process parameters with
the highest influence on the strength of the manufactured parts. The optimum parameters for
manufactured part strength were determined using the larger-the-better approach for S/N
ratios according to Equation (4.3):
S/N=-10xlog( ∑ (1
Yi2
)/n) (4.3)
Where Y is the experimentally observed value in the ith experiment and n is the number of
times each experiment was repeated. The results were compared with stainless steel 316L
from ASTM A240/A240M, which the ultimate tensile strength is 485 MPa.
Table 4.8:Tensile strength and S/N ratio results
NO P,
W
v,
mm/s
hd,
mm
UTS 1,
MPa
UTS 2,
MPa
UTS 3,
MPa
Average
MPa
S/N
Ratio
1 120 250 0.08 502.13 341.08 500.38 447.86 53.02
2 120 510 0.1 342.05 349.08 355.69 348.94 50.86
3 120 760 0.12 249.94 249.15 234.84 244.65 47.77
4 120 900 0.14 188.92 191.63 197.90 192.82 45.70
5 200 250 0.1 507.70 518.52 496.13 507.45 54.11
6 200 510 0.08 566.743 526.33 514.81 535.96 54.48
7 200 760 0.14 236.88 233.90 255.98 242.26 47.69
8 200 900 0.12 268.87 265.97 286.04 273.62 48.74
9 275 250 0.12 500.22 499.93 514.87 505.01 54.07
10 275 510 0.14 365.52 434.82 416.97 405.77 52.17
11 275 760 0.08 489.57 486.81 487.28 487.89 53.77
12 275 900 0.1 525.73 510.52 465.56 500.60 53.99
Univers
ity of
Mala
ya
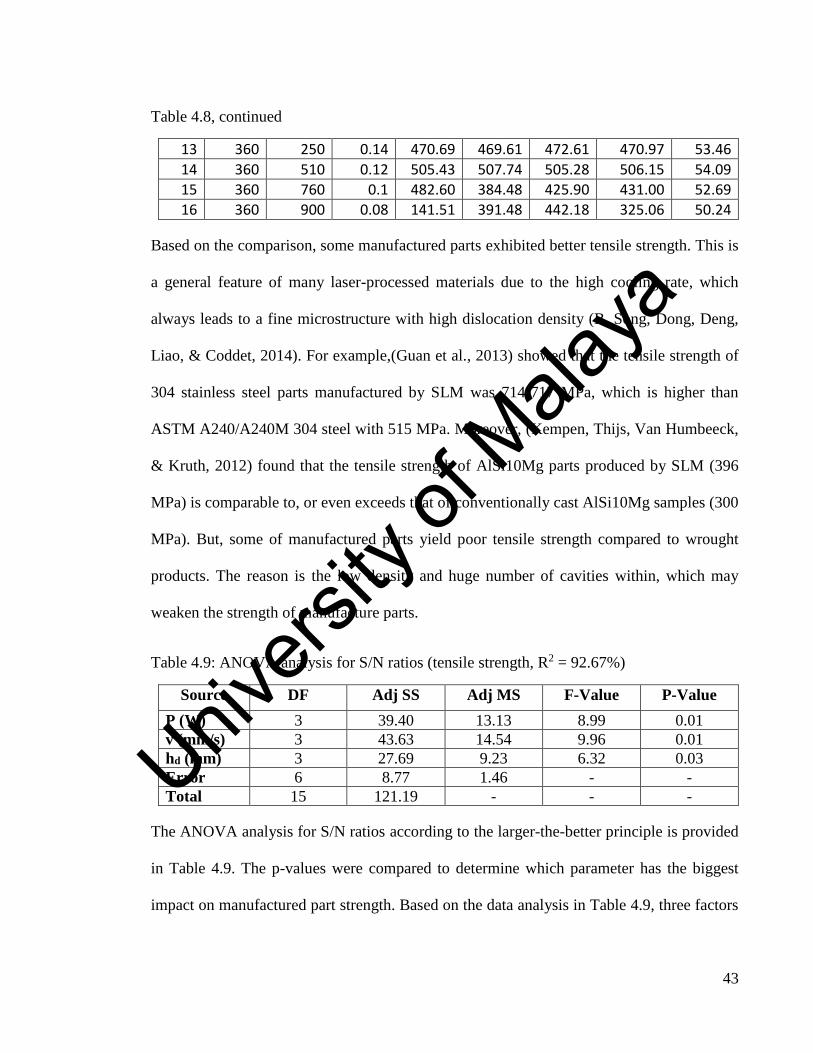
43
Table 4.8, continued
13 360 250 0.14 470.69 469.61 472.61 470.97 53.46
14 360 510 0.12 505.43 507.74 505.28 506.15 54.09
15 360 760 0.1 482.60 384.48 425.90 431.00 52.69
16 360 900 0.08 141.51 391.48 442.18 325.06 50.24
Based on the comparison, some manufactured parts exhibited better tensile strength. This is
a general feature of many laser-processed materials due to the high cooling rate, which
always leads to a fine microstructure with high dislocation density (B. Song, Dong, Deng,
Liao, & Coddet, 2014). For example,(Guan et al., 2013) showed that the tensile strength of
304 stainless steel parts manufactured by SLM was 714-717 MPa, which is higher than
ASTM A240/A240M 304 steel with 515 MPa. Moreover, (Kempen, Thijs, Van Humbeeck,
& Kruth, 2012) found that the tensile strength of AlSi10Mg parts produced by SLM (396
MPa) is comparable to, or even exceeds that of conventionally cast AlSi10Mg samples (300
MPa). But, some of manufactured parts yield poor tensile strength compared to wrought
products. The reason is the low density and huge number of cavities within, which may
weaken the strength of manufacture parts.
Table 4.9: ANOVA analysis for S/N ratios (tensile strength, R2 = 92.67%)
Source DF Adj SS Adj MS F-Value P-Value
P (W) 3 39.40 13.13 8.99 0.01
v (mm/s) 3 43.63 14.54 9.96 0.01
hd (mm) 3 27.69 9.23 6.32 0.03
Error 6 8.77 1.46 - -
Total 15 121.19 - - -
The ANOVA analysis for S/N ratios according to the larger-the-better principle is provided
in Table 4.9. The p-values were compared to determine which parameter has the biggest
impact on manufactured part strength. Based on the data analysis in Table 4.9, three factors
Univers
ity of
Mala
ya

44
have the greatest influence on the strength of manufactured parts on account of the lowest p-
value (below 0.05 significance level).
Next, the average of each characteristic (S/N ratio) at every factor level is shown in Table
4.10. Based on the S/N results, it can be concluded that laser power and scanning speed are
the highest influence on the strength of manufactured parts, followed by hatching distance.
Table 4.10: Response table for tensile strength
Level Laser Power (W) Scanning speed
(mm/s)
Hatching Distance
(mm)
1 49.34 53.66 52.90
2 51.28 52.92 52.91
3 53.50 50.48 51.17
4 52.62 49.67 49.75
Delta 4.16 4.00 3.16
Rank 1 2 3
Figure 4.5: Main effects plot for tensile strength
Univers
ity of
Mala
ya

45
Figure 4.5 displays the main effects plot for S/N ratios that was used to verify the statistical
results obtained. It is clear that the optimum parameters for tensile strength were obtained
when the laser power was 275 W, the scanning speed was 250 mm/s and the hatching distance
was 0.08 mm.
Increasing the laser power from low to high levels increased the ultimate tensile strength of
part manufactured. It happened due to high laser power when the energy transferred to the
powder material to ensure it melted properly, thus generating a closely packed model and
leading to enhanced part strength. Furthermore, greater laser power raises the melt
temperature, while higher melt temperature speeds up the cooling rate and leads to reduced
grain size. However, if the laser power is kept high, the tensile strength decreases owing to
the enlarged grain size, which is known as a severe undercut and humping effect (Makoana,
Möller, Burger, Tlotleng, & Yadroitsev, 2016).
In this study it was found that with a faster scanning speed tends to weaken the strength of
the manufactured parts. This phenomenon happened when the high scanning speed applied,
the energy absorbed by the sintered material over a unit time and a unit area decreases, and
thus leads to improper melting due to insufficient energy delivered. Hence, it reduced part
strength.
It was also found in this study that increasing the hatching distance reduced the strength of
the parts manufactured as discussed in (Negi et al., 2015). This can be justified by the fact
that a high hatching distance leads to pack poorly of the powder particles. For that reason,
high chance of curling and clinging on the layer happened and causes the next layer from
melting properly, which leads to poor part strength.
Univers
ity of
Mala
ya

46
As far as the mechanical behaviour of SLM parts is concerned, it was shown that they have
higher tensile strength and at the same time comparable ductility and lower fatigue life than
parts produced via traditional manufacturing processes. Hence, from this perspective, the
SLM process that allows the retention of self-strengthening mechanisms is opening great
potential for the fabrication of industrial parts.
4.2.4 Fracture Toughness
Defects, such as pickup of impurities like nitrogen and oxygen, pores and brittleness of the
manufactured part deteriorate the toughness of parts manufactured by SLM.
a)
Dimple
Univers
ity of
Mala
ya

47
b)
Figure 4.6 represents typical tensile fracture surfaces of SLM-processed iron specimens using
two scanning speeds (510 and 760 mm/s) and hatching distances (0.08 and 0.14 mm) and
laser power of 200 W. The central area of the fractured part is commonly described as a
region of fibrous fractures (Krakhmalev et al., 2016). FESEM analysis revealed that the
fractured surface in the fibrous zone of the manufactured part is quite irregular and not
horizontal due to the presence of initial porosity in the SLM specimens. A highly irregular
fracture surface implies intensive crack deflection during tension. For example, when the
pores and the micro voids coalesced, they formed not only horizontal but also inclined
surfaces. Another reason for the irregular fractured surface could be residual stresses
affecting crack propagation locally. Moreover, the FESEM analysis indicated the formation
of dimples and dimpled rupture fractures in the fibrous zone in Figures 4.6 (a) and (b). The
ductile fracture mechanisms in the necking region are usually associated with pore
coalescence.
Dimple
Figure 4.6: Fracture morphologies at laser power of 200 W with different laser scanning
speeds and hatching distances: a) 510 mm/s scanning speed and 0.08 mm hatching
distance, and b) 760 mm/s scanning speed and 0.14 mm hatching distance
Univers
ity of
Mala
ya

48
Figure 4.6(b) illustrates several dimple-like features corresponding to the high plastic
deformation that occurred before the rupture. Rupturing was due to the different effects of
scanning speed and hatching distance. Low scanning speed and hatching distance produced
better tensile strength performance based on the fracture morphology in Figure 4.6(a). When
the high scanning speed applied, improper melting will occur due to the insufficient energy
delivered to the material and it has tendency to weaken the strength of the manufactured part.
Also, when high hatching distance leads to insufficient overlapping between the layers and
cause the powder particles to pack poorly. As a consequence, this has reduced the strength
of the manufactured part.
4.2.4 Hardness
The resistance of a part when a force is applied can be determined via hardness tests. The
obtained data can suggest the future performance of parts manufactured by SLM. Hardness
depends on the stiffness, ductility, strain, plasticity, strength, viscosity and toughness of the
manufactured part (Monroy, Delgado, Sereno, Ciurana, & Hendrichs, 2014).
The hardness values of the sixteen manufactured parts are tabulated in Table 4.11. ANOVA
analysis was conducted to determine the most influential parameters on manufactured part
hardness. Next, the larger-the-better approach and Equation (4.3) were used to calculate the
S/N ratio and to find the optimum parameters for better hardness.
Table 4.11: Hardness and S/N ratio results
No P,
W
v,
mm/s
hd,
mm
HV 1,
HV
HV 2,
HV
HV 3,
HV
HV 4,
HV
HV 5,
HV
AVG
HV, HV
S/N
RATIO
1 120 250 0.08 214.00 230.00 235.00 264.00 257.00 240.00 47.60
2 120 510 0.1 264.00 248.00 246.00 258.00 253.00 253.80 48.09
3 120 760 0.12 273.00 276.00 275.00 277.00 266.00 273.40 48.74
4 120 900 0.14 271.00 272.00 279.00 265.00 272.00 271.80 48.68
5 200 250 0.1 262.00 263.00 268.00 269.00 256.00 263.60 48.42
Univers
ity of
Mala
ya

49
Table 4.11, continued
6 200 510 0.08 258.00 264.00 278.00 277.00 278.00 271.00 48.66
7 200 760 0.14 288.00 273.00 271.00 279.00 271.00 276.40 48.83
8 200 900 0.12 285.00 287.00 281.00 289.00 283.00 285.00 49.10
9 275 250 0.12 266.00 258.00 254.00 253.00 265.00 259.20 48.27
10 275 510 0.14 257.00 248.00 252.00 252.00 266.00 255.00 48.13
11 275 760 0.08 246.00 247.00 243.00 250.00 247.00 246.60 47.84
12 275 900 0.1 236.00 236.00 235.00 238.00 235.00 236.00 47.46
13 360 250 0.14 205.00 215.00 218.00 211.00 215.00 212.80 46.56
14 360 510 0.12 227.00 235.00 233.00 234.00 234.00 232.60 47.33
15 360 760 0.1 260.00 252.00 245.00 250.00 241.00 249.60 47.94
16 360 900 0.08 245.00 254.00 250.00 246.00 244.00 247.80 47.88
The results were compared with a traditional process used for producing stainless steel 316L,
which was 222 HV. According to the table above, the hardness of the manufactured parts
was ranged from 212 – 285 HV. Based on the results, the parts manufactured by SLM were
comparable to conventionally manufactured parts, whereby superior hardness values were
obtained over conventional electron beam melting, casting and forging.
Table 4.11 indicates that the lowest hardness obtained was 212.80 HV at highest energy
density of 10.28571429 J/mm2. The melting with cracks phenomenon occurred on the
manufactured part when higher energy input was applied, which involved greater laser power
combined with a relatively low scanning speed. The manufactured part could be completely
melted and even broken up due to the excessive shrinkage and high residual stresses that
produced many visible cracks.
The ANOVA analysis for S/N ratios according to the larger-the-better principle is shown in
Table 4.12 The p-values were compared to determine which parameter has the biggest impact
on the hardness of manufactured parts. The data analysis indicates that laser power has the
Univers
ity of
Mala
ya

50
greatest influence on hardness, because it had the lowest p-value (less than 0.05 significance
level).
Table 4.12: ANOVA analysis for S/N ratios (hardness, R2 = 80.31%)
Source DF Adj SS Adj MS F-Value P-Value
P (W) 3 3156.9 1052.3 6.00 0.031
v (mm/s) 3 780.5 260.2 1.48 0.311
hd (mm) 3 355.7 118.6 0.68 0.598
Error 6 1052.9 175.5 - -
Total 15 5346.1 - - -
The average of each characteristic (S/N ratio) at each factor level is given in Table 4.13.
Based on the S/N ratio results, laser power is the most influential on the hardness of
manufactured parts, followed by scanning speed and then hatching distance.
Table 4.13: Response table for hardness
Level Laser Power, W Scanning speed,
mm/s
Hatching distance,
mm
1 48.28 47.71 48.00
2 48.75 48.05 47.98
3 47.93 48.34 48.36
4 47.43 48.28 48.05
Delta 1.32 0.62 0.38
Rank 1 2 3
Univers
ity of
Mala
ya

51
As seen in Figure 4.7, the manufactured part hardness decreased rapidly when the laser power
increased from 200 W to 360 W. This is because an excessive amount of liquid formed that
reduced the viscosity of the manufactured part. The hardness also decreased when the lower
scanning speed was applied. This is due to the higher energy density that leads to the widen
of the melt pool area and the melt pool area is probably getting too hot. It leads to a too high
cooling rate and the possible inclusion of gas bubbles. Hence, reduced the hardness of the
manufactured part. The hardness of the manufactured parts increased when the hatching
distance was 0.12 mm. Based on the Figure 4.7, when the hatching distance applied was less
or more than 0.12 mm, the hardness of the manufactured parts decreased due to the
detrimental effect that diminished the hardness of the manufactured part. However, when the
high hatching distance was applied, the overlapping between the scan lines will be increased
and lead to high porosity. As a result, the hardness of the manufactured part was reduced.
Figure 4.7: Main effects plot for hardness
Univers
ity of
Mala
ya

52
Therefore, the optimum parameters for good manufactured part having good hardness are at
200 W laser power, 760 mm/s scanning speed and 0.10 mm hatching distance.
4.2.5 Porosity
The density and porosity of the manufactured parts were measured using the volumetric
method. The porosity percentages and S/N ratios of the manufactured parts are tabulated in
Table 4.14.
Table 4.14: Porosity percentage and S/N ratio results
According to Table 4.14, the average density of manufactured parts was 7.57 g/cm3. The
ANOVA analysis for S/N ratios was done using the smaller-the-better approach with
Equation (4.1) and the results are tabulated in Table 4.15. The p-values were compared to
determine which parameter has the biggest impact on the strength of manufactured parts.
Based on Table 4.15, the three factors do not have significant effects on the porosity of
manufactured parts because the p-values were above the 0.05 significance level.
NO P, W v, mm/s hd, mm Density
(g/cm3)
Porosity
(%)
S/N Ratio
1 120 250 0.08 8.36 4.50 -13.07
2 120 510 0.1 7.49 6.32 -16.02
3 120 760 0.12 6.97 12.90 -22.21
4 120 900 0.14 6.55 18.17 -25.19
5 200 250 0.1 6.63 17.08 -24.65
6 200 510 0.08 8.29 3.66 -11.27
7 200 760 0.14 7.34 8.24 -18.32
8 200 900 0.12 7.23 9.63 -19.67
9 275 250 0.12 7.86 1.75 -4.86
10 275 510 0.14 6.61 17.34 -24.78
11 275 760 0.08 7.91 1.09 -0.76
12 275 900 0.1 8.31 3.89 -11.79
13 360 250 0.14 7.13 10.90 -20.75
14 360 510 0.12 7.85 1.82 -5.19
15 360 760 0.1 8.08 1.01 -0.06
16 360 900 0.08 8.43 5.38 -14.61
Univers
ity of
Mala
ya

53
Table 4.15: ANOVA analysis for S/N ratios (Porosity percentage, R2 = 70.47%)
Source DF Adj SS Adj MS F-Value P-Value
P (W) 3 286.70 95.57 1.83 0.242
v (mm/s) 3 120.4 40.14 0.77 0.552
hd (mm) 3 341.10 113.71 2.18 0.192
Error 6 313.6 52.26 - -
Total 15 1061.8 - - -
The average of each characteristic (S/N ratio) for each factor level is given in Table 4.16. It
seems that hatching distance has the greatest influence on the porosity of manufactured parts,
followed by laser power and then scanning speed.
Table 4.16: Response table for porosity percentage, %
Level Laser Power, W Scanning Speed,
mm/s
Hatching Distance,
mm
1 -19.123 -15.832 -9.926
2 18.476 -14.314 -13.131
3 -10.547 -10.338 -12.983
4 -10.153 -17.816 -22.259
Delta 8.970 7.478 12.333
Rank 2 3 1
Univers
ity of
Mala
ya

54
Based on Figure 4.8, the optimum parameters to obtain low porosity are 360 W laser power,
760 mm/s scanning speed and 0.08 mm hatching distance. Higher laser power produced the
least porosity, as the laser input was sufficient to completely melt the stainless-steel
powders. In contrast, low laser power produced higher porosity, as only limited liquid formed
due to insufficient melting. The viscosity of the melt pool increases when a combination of
un-melted balls and a liquid phase is present, which has a negative influence on the
flowability of the liquid. Meanwhile, a low laser power beam may not be able to penetrate
all the way to the previously solidified layer for the newly formed liquid to attach, resulting
in poor wetting. Lower laser power may also mean less likelihood of powder ablation and
plasma formation near the powder bed surface, thus lessening the overall “absorptivity” of
the powder. A consequence of these various potential mechanisms is that large caves and
crevices formed with many un-melted and half-melted particles within, as shown in Figure
4.9.
Figure 4.8: Main effects plot for porosity percentage, %
Univers
ity of
Mala
ya

55
Less porosity was obtained at 760 mm/s scanning speed. The porosity percentage decreased
between 250 mm/s and 760 mm/s. However, the porosity percentage decreased rapidly above
760 mm/s scanning speed because the laser scanning track exhibited discontinuity due to
the balling phenomenon, as shown in Figure 4.9. The balling effect is possibly a
consequence of an unstable melt pool; very high scanning speeds exert much more shear
stress on the liquid phase, which generates higher surface tension inside the melt pool,
leading to a high likelihood of ball formation. The splashing of liquid balls caused by very
high scanning speeds also contributes to porosity under such processing conditions (Gu
et al., 2013).
In addition, as shown in Figure 4.8, a short 0.08 mm hatching distance led to very low
porosity percentage due to the greater overlap between melted zones. This means that the
material lateral to the scan line, which melted previously (and was solidified), melted again.
Un-melted particles
Caves
Figure 4.9: Metallographic observation: top view of 1st experiment
Univers
ity of
Mala
ya

56
It is suggested here that this phenomenon allows more of the trapped air to escape as bubbles.
Furthermore, complete lateral melting is possible with shorter hatching distances, hence
reducing the porosity.
4.3 Regression Analysis and Optimization
Further regression analysis was done to ensure the response values fit the model data. The
regression analysis used in this work involved mathematical models to determine the
relationship between the control parameters and performance of the manufactured parts based
on the robust L16 orthogonal array design. The previous analysis yielded a response equation
considering the effects of laser power (P), scanning speed (v) and hatching distance (hd). The
mathematical model produced relationships between the process parameters and output or
response of this study as shown in the following equations.
4.3.1 Surface roughness
Ra [μm]= -3.27+0.06815 (P)-0.00845 (v)+77.5 (hd)[R2=82.56 %] (4.4)
Based on Equation (4.4), the predicted surface roughness value for the manufactured part
obtained with the optimum parameters (120 W laser power, 900 mm/s scanning speed and
0.08 mm hatching distance) is 5.53 um.
4.3.2 Dimensional accuracy
Accuracy [%]= -9.48+0.0795 (P)-0.00685 (v)+56.5 (hd)[R2=60.01 %] (4.5)
According to Equation (4.5), the predicted thickness value obtained for the manufactured
part with the optimum parameters (120 W laser power, 200 mm/s scanning speed and 0.08
mm hatching distance) is 1.99 mm. Moreover, the dimensional error calculated is only 0.5%.
Univers
ity of
Mala
ya

57
4.3.3 Tensile Strength
Tensile Strength = 659+0.569 (P)-0.2613 (v)-2142 (hd)[R2=49.71%] (4.6)
According to Equation (4.6), the predicted tensile strength value obtained for the
manufactured part based on the optimum parameters (275 W laser power, 250 mm/s scanning
speed and 0.08 m,m hatching distance) is 603.58 MPa.
4.3.4 Hardness
Hardness = 256.5-0.1218 (P)+0.0270 (v)+99 (hd)[R2=49.98 %] (4.7)
The predicted hardness value obtained with Equation (4.7) for the optimum parameters (200
W laser power, 760 mm/s scanning speed and 0.12 mm hatching distance) is 288.73 HV.
4.3.5 Porosity
Porosity (%) = -2.04-0.260 (P)-0.00039 (v)+147.3(hd)[R2=48.08 %] (4.8)
The predicted porosity percentage obtained with Equation (4.8) for the optimum parameters
(360 W laser power, 760 mm/s scanning speed and 0.08 mm hatching distance) is 1.22 %.
The optimum properties of the manufactured parts obtained from the S/N ratio graph are
tabulated in Table 4.18, which also includes the values predicted by regression analysis.
4.4 Confirmation Experiment
A confirmation experiment was conducted using the optimal parameters obtained from the
testing experiments and it has been compared with the predicted values from the regression
analysis as in Table 4.17. The percentage error and accuracy of the predicted and
experimental values were calculated with Equation (4.9) and (4.10).
Percentage Error,%= |k0-k1
k0
| x 100% (4.9)
Univers
ity of
Mala
ya

58
Accuracy, A=1
aƩi=1
a (1-k0-k1
k0
) x 100 % (4.10)
Where k0 is the predicted value, k1 is the experimental value, , i=1, 2, 3 is the sample number
and A is the accuracy of k sample data.
Table 4.17: Comparison between predicted and experimental values
Test Optimum parameters Predicted
value
Experimental
value
Error
(%)
Accuracy
(%) P, W v,
mm/s
hd,
mm
Surface
Roughness,
Ra (um)
120 900 0.08 5.03 5.53 9.94 90.06
Thickness
accuracy
(mm)
120 900 0.08 1.99 2.03 2.01 97.90
Tensile
Strength
(MPa)
275 250 0.08 603.58 602.22 0.23 99.77
Hardness
(HV)
200 760 0.10 288.73 292.8 1.41 98.61
Porosity
(%)
360 760 0.08 1.22 0.99 18.85 81.15
The average percentage accuracy obtained is 93.50%. The low error level signifies that the
results predicted by regression analysis are close to the actual experimental results. The error
values indicate that the proposed model can predict the mechanical properties of
manufactured parts satisfactorily.
Univers
ity of
Mala
ya

59
4.4 Shot Peening
To complete the quality test analysis, shot peening was considered to investigate its effect on
the quality of manufactured parts. Sample No. 6 was chosen for comparison.
Table 4.18: Value reductions after shot peening
Test Before shot
peening
After shot peening
Improvement
(%)
Surface
roughness, Ra
(µm)
12.50 8.34
33.28
Dimensional
accuracy (%)
6 2.5 58.33
Hardness (HV) 271 363.8 34.24
The values of the manufactured parts’ mechanical properties before and after shot peening
are provided in Table 4.18. The results indicate that the shot peening technique offered about
33.28% improvement in surface roughness, 58.33% improvement in dimensional accuracy
and 34.24% improvement in hardness of the manufactured parts.
This is a cold working process, whereby steel shots are decelerated onto the metal surface,
thus enabling significant reductions in surface roughness (Ra) as illustrated in Figure 4.10
(Calignano et al., 2012).
Figure 4.10: Illustration of the shot peening mechanism
Univers
ity of
Mala
ya

60
a)
b)
Figure 4.11 also clearly shows that the surface roughness of the produced parts was reduced
greatly by shot peening, because the shot peening method involves high speed bombarded of
the part surface with small spherical particles known as shots. Moreover, previous works
have shown that shot peening, which involves a high velocity blast stream, produces fine
dimples on the surface of the work material via impact erosions (Torres & Voorwald, 2002).
This erosion process facilitates a smoother finishing on the parts without change in the
dimensions nor contamination.
The surface roughness profile of the manufactured parts prior to and after the application of
shot peening was captured using FESEM with 100x magnification. Figure 4.12 and 4.13 are
images of the sample before and after shot peening. According to Figure 4.12 the spherical
Figure 4.11: Sample 6: (a) before shot peening, (b) after shot peening
Univers
ity of
Mala
ya

61
balls (un-melted) of varying sizes appeared to be fused on the surface of the manufactured
part, resulting in poor surface finish. After the shot peening process however, the surface of
the manufactured part seemed free from un-melted spherical balls, indicating better surface
finish as shown in Figure 4.13. This could be attributed to the removal of the un-melted
spherical balls, burrs and imperfections in the part during shot peening. Thus, the shot
peening process appears to facilitate significant improvement in the surface finish of SLM
samples. According to the physical analysis in Figure 4.12 and 4.13, it can thus be concluded
that shot peening also helps minimized the presence of necks or voids on the surface of
manufactured parts.
Figure 4.12: Micrograph images: Before shot peening
Univers
ity of
Mala
ya

62
Figure 4.13:Micrograph images: After shot peening
Univers
ity of
Mala
ya

63
CHAPTER 5 : CONCLUSION
5.1 Conclusion
The effect of process parameters on the mechanical properties of SS316L components
produced using SLM was studied with the help of MINITAB® statistical software. The
effects of three process parameters (i.e. laser power, hatching distance and scanning speed)
on the surface roughness, dimensional accuracy, tensile strength, hardness and porosity of
manufactured parts were investigated. According to analysis, laser power has the most
significant effect on the surface roughness, dimensional accuracy, tensile strength and
hardness of parts manufactured using the SLM technique. Moreover, data analysis indicated
that hatching distance has the most significant effect on porosity percentage. The fracture
morphology analysis demonstrated that the tensile strength is better when low scanning speed
and hatching distance are applied.
In addition, the optimum parameters achieved at 120W of laser power, 900 mm/s of scanning
speed and 0.08 mm of hatching distance for (surface roughness and dimensional accuracy),
275W of laser power, 250 mm/s of scanning speed and 0.08 mm of hatching distance for
(tensile strength), 200 W of laser power, 760 mm/s of scanning speed and 0.10 mm of
hatching distance for (hardness) and 360 W of laser power, 760 mm/s of scanning speed and
0.08 mm of hatching distance for (porosity percentage). Regression analysis was done on the
predicted results compared with the confirmation test results according to the newly
identified optimum parameters. Based on the comparison, the average accuracy is 93.50 %.
Hence, the regression model can predict the mechanical properties of manufactured parts
satisfactorily.
In addition, it was found that shot peening with steel shots helps enhance the quality of
manufactured parts. The results indicate that shot peening facilitates improvements of about
Univers
ity of
Mala
ya

64
33.28% for surface roughness, 58.33% for dimensional accuracy and 34.24% for hardness.
The degree of improvement was affirmed with the FESEM images obtained and the physical
appearance. The shot-peened samples appeared to possess higher surface integrity.
Therefore, the shot peening post-processing technique is recommended for SLM components
in other to obtain better overall surface quality.
5.2 Recommendations for future work
In this study, the effect of process parameters such as laser power, scanning speed and
hatching distance on the physic-mechanical properties of the manufactured part have been
investigated. Besides these three process parameters, the other influential parameters in SLM
include building direction, layer thickness, laser source and laser beam size, which will
significantly affect the physic-mechanical properties of the manufactured part. All of these
parameters are not considered in this study. Therefore, the following works are recommended
for future study:
• Investigate the effects of building direction, layer thickness, laser source and laser
beam size on the physic-mechanical properties of the manufactured part.
• Parametric study in finite element model of SLM to evaluate the effects of the process
parameters on the SLM process.
Univers
ity of
Mala
ya

65
REFERENCES
Badrossamay, M., & Childs, T. (2006). Layer formation studies in selective laser melting of
steel powders. Proc. SFF Symp., Austin, Texas, USA, 268-279.
Benardos, P. G., & Vosniakos, G. C. (2003). Predicting surface roughness in machining: a
review. International Journal of Machine Tools and Manufacture, 43(8), 833-844.
Bin, H., & B, S. S. (2015). Curved Layer Adaptive Slicing (CLAS) for fused deposition
modelling. Rapid Prototyping Journal, 21(4), 354-367.
Calignano, F., Manfredi, D., Ambrosio, E. P., Iuliano, L., & Fino, P. (2012). Influence of
process parameters on surface roughness of aluminum parts produced by Direct Metal
Laser Sintering. The International Journal of Advanced Manufacturing Technology,
67(9), 2743-2751.
Cherry, J. A., Davies, H. M., Mehmood, S., Lavery, N. P., Brown, S. G. R., & Sienz, J.
(2015). Investigation into the effect of process parameters on microstructural and
physical properties of 316L stainless steel parts by selective laser melting. The
International Journal of Advanced Manufacturing Technology, 76(5), 869-879.
Chung, H., & Das, S. (2006). Processing and properties of glass bead particulate-filled
functionally graded Nylon-11 composites produced by selective laser sintering.
Materials Science and Engineering: A, 437(2), 226-234.
Delgado, J., Ciurana, J., & Rodríguez, C. A. (2011). Influence of process parameters on part
quality and mechanical properties for Direct Metal Laser Sintering and Selective
Laser Melting with iron-based materials. The International Journal of Advanced
Manufacturing Technology, 60(5), 601-610.
Dewidar, M. M., Khalil, K. A., & Lim, J. K. (2007). Processing and mechanical properties
of porous 316L stainless steel for biomedical applications. Transactions of
Nonferrous Metals Society of China, 17(3), 468-473.
Frija, M., Hassine, T., Fathallah, R., Bouraoui, C., & Dogui, A. (2006). Finite element
modelling of shot peening process: Prediction of the compressive residual stresses,
the plastic deformations and the surface integrity. Materials Science and
Engineering: A, 426(1–2), 173-180.
Gu, H., Gong, H., Pal, D., Rafi, K., Starr, T., & Stucker, B. (2013). Influences of energy
density on porosity and microstructure of selective laser melted 17-4PH stainless
steel. 2013 Solid Freeform Fabrication Symposium, 474.
Univers
ity of
Mala
ya

66
Guan, K., Wang, Z., Gao, M., Li, X., & Zeng, X. (2013). Effects of processing parameters
on tensile properties of selective laser melted 304 stainless steel. Materials & Design,
50, 581-586.
Hanzl, P., Zetek, M., Bakša, T., & Kroupa, T. (2015). The Influence of Processing Parameters
on the Mechanical Properties of SLM Parts. Procedia Engineering, 100, 1405-1413.
Ho, H., Cheung, W., & Gibson, I. (2002). Effects of graphite powder on the laser sintering
behaviour of polycarbonate. Rapid Prototyping Journal, 8(4), 233-242.
Jugulum, R., & Samuel, P. (2008). Appendix D: Equations for Signal-to-Noise (S/N) Ratios
Design for Lean Six Sigma (pp. 277-280): John Wiley & Sons, Inc.
Kamarudin, K., Wahab, M., Raus, A., Ahmed, A., & Shamsudin, S. (2017). Benchmarking
of dimensional accuracy and surface roughness for AlSi10Mg part by selective laser
melting (SLM). Paper presented at the AIP Conference Proceedings.
Kearns, M., & Murray, K. (2010). Gas atomised powders cut energy costs. Metal Powder
Report, 65(3), 16-20.
Kempen, K., Thijs, L., Van Humbeeck, J., & Kruth, J. P. (2012). Mechanical Properties of
AlSi10Mg Produced by Selective Laser Melting. Physics Procedia, 39(Supplement
C), 439-446.
Krakhmalev, P., Fredriksson, G., Yadroitsava, I., Kazantseva, N., Plessis, A. d., &
Yadroitsev, I. (2016). Deformation Behavior and Microstructure of Ti6Al4V
Manufactured by SLM. Physics Procedia, 83, 778-788.
Krishnan, M., Atzeni, E., Canali, R., Calignano, F., Manfredi, D., Ambrosio, E. P., & Iuliano,
L. (2014). On the effect of process parameters on properties of Aluminium
(AlSi10Mg) parts produced by Direct Metal Laser Sintering. Rapid Prototyping
Journal, 20(6), 449-458.
Kruth, J.-P., Badrossamay, M., Yasa, E., Deckers, J., Thijs, L., & Van Humbeeck, J. (2010).
Part and material properties in selective laser melting of metals. Paper presented at
the Proceedings of the 16th international symposium on electromachining.
Lee, P.-H., Chung, H., Lee, S. W., Yoo, J., & Ko, J. (2014). Review: Dimensional Accuracy
in Additive Manufacturing Processes. (45806), V001T004A045.
Univers
ity of
Mala
ya

67
Makoana, N. W., Möller, H., Burger, H., Tlotleng, M., & Yadroitsev, I. (2016). Evaluation
of single tracks of 17-4PH steel manufactured at different power densities and
scanning speeds by selective laser melting (Vol. 27).
Monroy, K. P., Delgado, J., Sereno, L., Ciurana, J., & Hendrichs, N. J. (2014). Effects of the
Selective Laser Melting manufacturing process on the properties of CoCrMo single
tracks. Metals and Materials International, 20(5), 873-884.
Negi, S., Dhiman, S., & Sharma, R. K. (2015). Influence of Process Parameters on
Mechanical Properties of Parts Fabricated by Selective Laser Sintering.
Phadke, M. S. (1995). Quality engineering using robust design: Prentice Hall PTR.
Rahmati, B., Sarhan, A. A. D., & Sayuti, M. (2014). Investigating the optimum molybdenum
disulfide (MoS2) nanolubrication parameters in CNC milling of AL6061-T6 alloy.
The International Journal of Advanced Manufacturing Technology, 70(5), 1143-
1155. doi:10.1007/s00170-013-5334-x
Sateesh, N. H., Kumar, G. C. M., Prasad, K., C.K, S., & Vinod, A. R. (2014). Microstructure
and Mechanical Characterization of Laser Sintered Inconel-625 Superalloy. Procedia
Materials Science, 5, 772-779.
Sharma, V. S., Singh, S., Sachdeva, A., & Kumar, P. (2013). Influence of sintering
parameters on dynamic mechanical properties of selective laser sintered parts.
International Journal of Material Forming, 8(1), 157-166.
Simchi, A. (2006). Direct laser sintering of metal powders: Mechanism, kinetics and
microstructural features. Materials Science and Engineering: A, 428(1), 148-158.
Simchi, A., & Pohl, H. (2003). Effects of laser sintering processing parameters on the
microstructure and densification of iron powder. Materials Science and Engineering:
A, 359(1–2), 119-128.
Song, B., Dong, S., Deng, S., Liao, H., & Coddet, C. (2014). Microstructure and tensile
properties of iron parts fabricated by selective laser melting (Vol. 56).
Song, Y.-A., & Koenig, W. (1997). Experimental Study of the Basic Process Mechanism for
Direct Selective Laser Sintering of LowMelting Metallic Powder. Cirp Annals-
manufacturing Technology, 46(1), 127-130.
Univers
ity of
Mala
ya

68
Stucker, B. (2001). The selective laser sintering process. Magnolia: Magnolia Publishing inc.
Stwora, A., & Skrabalak, G. (2013). Influence of selected parameters of Selective Laser
Sintering process on properties of sintered materials. Journal of achievements in
materials and manufacturing engineering, 61(2), 375-380.
Tolosa, I., Garciandía, F., Zubiri, F., Zapirain, F., & Esnaola, A. (2010). Study of mechanical
properties of AISI 316 stainless steel processed by “selective laser melting”,
following different manufacturing strategies. The International Journal of Advanced
Manufacturing Technology, 51(5-8), 639-647.
Torres, M. A. S., & Voorwald, H. J. C. (2002). An evaluation of shot peening, residual stress
and stress relaxation on the fatigue life of AISI 4340 steel. International Journal of
Fatigue, 24(8), 877-886.
Yap, C., Chua, C., Dong, Z., Liu, Z., Zhang, D., Loh, L., & Sing, S. (2015). Review of
selective laser melting: Materials and applications. Applied physics reviews, 2(4),
041101.
Zhang, B., Liao, H., & Coddet, C. (2012). Effects of processing parameters on properties of
selective laser melting Mg–9%Al powder mixture (Vol. 34).
Univers
ity of
Mala
ya

69
SUPPLEMENTARY
LIST OF PUBLICATION AND PAPER PRESENTED
1. “Effects of Process Parameters on Surface Roughness of Stainless Steel 316L Parts
Produced by Selective Laser Melting”, Journal of testing and evaluation - Accepted
2. “Effects of Process Parameters on Surface Roughness of Stainless Steel 316L Parts
Produced by Selective Laser Melting” 2017 2nd Advanced Research in Engineering
and Information Technology International Conference- Paper Presented
Univers
ity of
Mala
ya