making sound judgements about the effects of public...
TRANSCRIPT

1 | P a g e
Petri Uusikyla <First Draft 24.11.2009>
Net Effect Ltd.
The 6th European Conference on Evaluation of Cohesion Policy in Warsaw 30 November-1 December, 2009.
Lot 5: Missing Links between Cause and Effect
Making Sound Judgements about the Effects of Public Policies How to explore the missing links between the cause and effect?
Abstract
Macroeconomic models have provided useful tools for Cohesion Policy evaluators trying to transform project level
outputs and results into program level impacts and to finally measure the Community value-added of these
interventions. These models can give reliable 20% explanation to societal problems while 80% of the phenomena are
still not fully understood - not to mention explained. First major problem for explaning multi-level system behavior
based on actions and orientations at the level below is a typical micro-to-macro problem, i.e. that of the system is that
of moving from the lower level to the system level. Second problem is related to the issue of complexity and
interconnectedness, i.e. single cohesion policy measures are embedded into multi-layer intervention fields that
influence the implementation of these policies. Third problem has to do with under-socialized nature of understanding
European Cohesion Policy. European policies are implemented by social actors (individual or collective) whose
perception, values and trust relations have major influence on policy success or failure. Paper discusses these
methodological problems in the light of European Cohesion Policy Framework and also introduces alternative non-
linear methods such as network models and qualitative evaluation tools to use for deeper understanding the
mechanisms behind European Community policy interventions and also for better explanations for policy success or
failure.
Introduction
Evaluations are analytical assessments addressing results of public policies, organisations or programmes that
emphasise reliability and usefulness of findings. Their role is to improve information and reduce uncertainty; however,
even evaluations based on rigorous methods rely significantly on judgement” (OECD 1998, 3). This is only one
definition of the role and purposes that public policy evaluations serve. Motives behind evaluations can vary from
compliance control, enhancement for public accountability to learning and developing policies.
Methodological choices and alternative uses of evaluation findings are closely related to the content, architecture and
agendas (both explicit and hidden) of policies themselves. European cohesion policy has been under serious scrutiny
during last years. According to the recent report by Fabrizio Barca there is an urgent need for new paradigm of
European regional policy. Barca (2009) calls “for a cautious approach under which public interventions with a territorial
impact are made visible and verifiable and submitted to scrutiny together with the initiation of a process whereby
everyone is given the opportunity and the information to participate and to voice their dissent”. According to him a
place-based approach has the potential to ensure this1.
1 Essential features of the new paradigm are: tailoring interventions to specific territorial contexts and to their spatial linkages; and
eliciting and aggregating the knowledge and preferences of local actors. This new approach compares with an “old approach” to
regional policy, whose objective is compensating for regional differences in unit capital costs (due to productivity gaps) and
rebalancing labour and capital flows. Its strategy is centred on subsidies to firms or sectoral interventions, often with an exclusive
focus on the creation of jobs or on physical connections between places. It is often based on the replication of best-practices
2 | P a g e
Much of the criticism targeted on European cohesion policy model also relates to existing evaluation practices of this
policy, i.e. evaluation and policy are interdependent. The report argues that “the state of the empirical evidence on
the performance of cohesion policy is very unsatisfactory ( … ). The Report suggests, first, that econometric studies
based on macro-data on growth and transfers, while providing specific suggestions, do not offer any conclusive
general answer on the effectiveness of policy. This is due partly to the serious problems faced by any attempt to
isolate at macro-level the effects of cohesion policy from those of several confounding factors, and partly to the fact
that existing studies have largely analysed the effect on convergence, which is not a good proxy of the policy
objectives”. The report also shows “both the lack of any systematic attempt at EU and national/regional levels to
assess whether specific interventions “work” through the use of advanced methods of impact evaluation, and a very
poor use of the system of outcome indictors and targets formally built by the policy”.
There are several reasons for above mentioned problems of proving reliable empirical evidence on the results and
impacts of the European cohesion policy interventions. Some of these reasons are methodological (false assumptions
of causal mechanisms) by the nature, some are technical (lack of valid and reliable indicators) and some have to do
with evaluation methods applied (problems in applying appropriate scientific research methods). However, the core of
the problem lies in insufficient understanding of policies themselves and the local socio-economic conditions
influencing the implementation of these policies.
2. Quantity vs. Quality in Cohesion Policy Evaluation
The first regulations, adopted by the Council on 19 December 1988, concerned regional development plans which had
to be submitted by 1 January 1989. For many national and regional administrations, the need to establish multi-
annual programming was in itself a kind of revolution. Moreover, most competent authorities and the Commission
services did not have the required evaluation skills, at least as far as evaluating Structural Funds was concerned.
Consequently, evaluations carried out during the 1989-93 period were not of a very high quality, despite efforts by
many actors, especially at the Commission. (Evalsed 2009.)
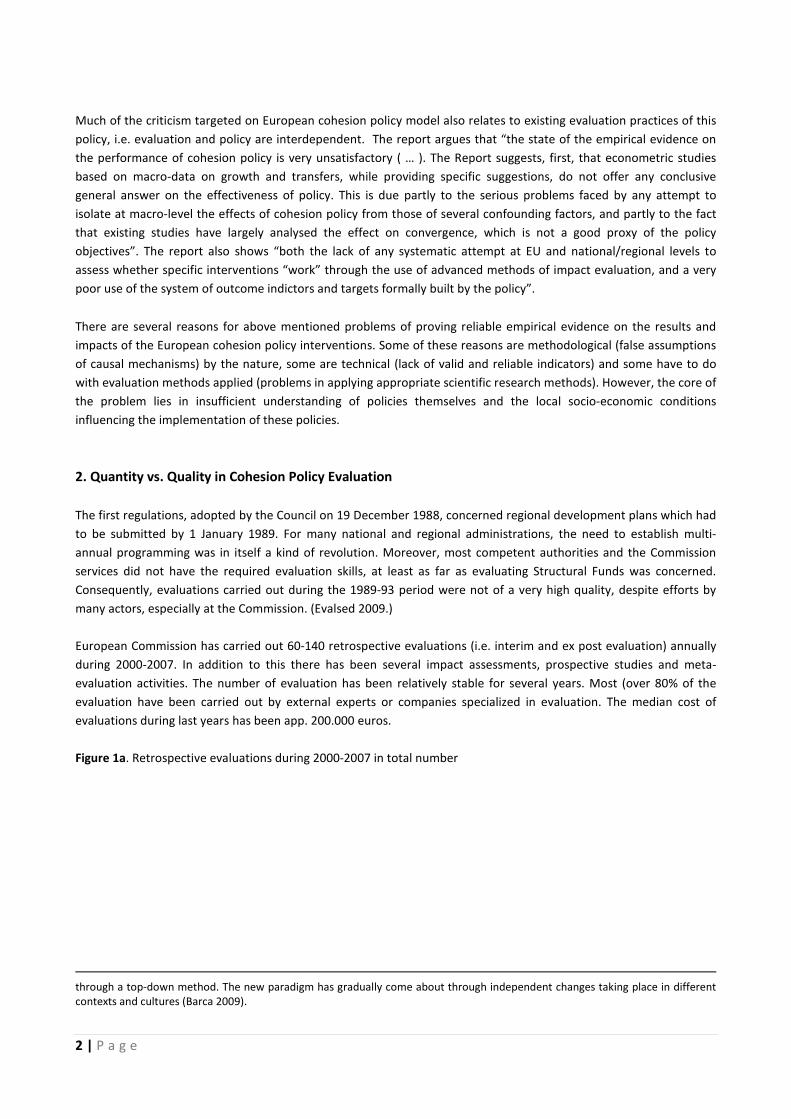
European Commission has carried out 60-140 retrospective evaluations (i.e. interim and ex post evaluation) annually
during 2000-2007. In addition to this there has been several impact assessments, prospective studies and meta-
evaluation activities. The number of evaluation has been relatively stable for several years. Most (over 80% of the
evaluation have been carried out by external experts or companies specialized in evaluation. The median cost of
evaluations during last years has been app. 200.000 euros.
Figure 1a. Retrospective evaluations during 2000-2007 in total number
through a top-down method. The new paradigm has gradually come about through independent changes taking place in different
contexts and cultures (Barca 2009).
3 | P a g e
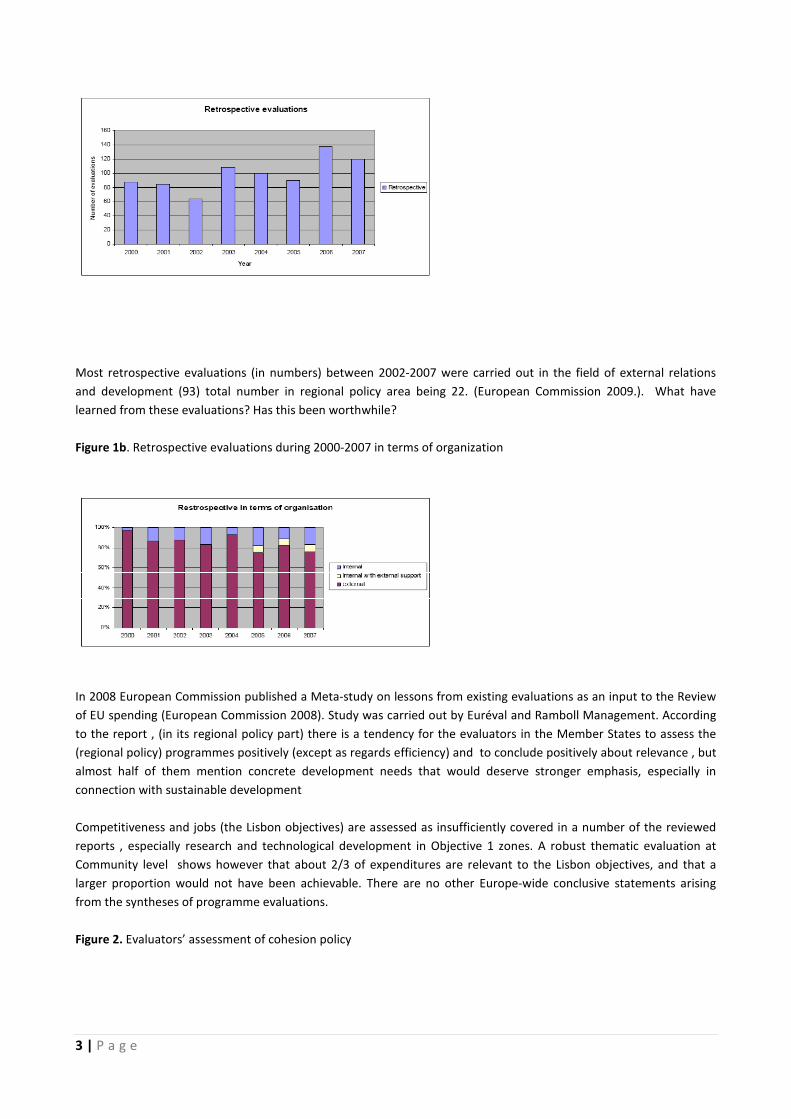
Most retrospective evaluations (in numbers) between 2002-2007 were carried out in the field of external relations
and development (93) total number in regional policy area being 22. (European Commission 2009.). What have
learned from these evaluations? Has this been worthwhile?
Figure 1b. Retrospective evaluations during 2000-2007 in terms of organization
In 2008 European Commission published a Meta-study on lessons from existing evaluations as an input to the Review
of EU spending (European Commission 2008). Study was carried out by Euréval and Ramboll Management. According
to the report , (in its regional policy part) there is a tendency for the evaluators in the Member States to assess the
(regional policy) programmes positively (except as regards efficiency) and to conclude positively about relevance , but
almost half of them mention concrete development needs that would deserve stronger emphasis, especially in
connection with sustainable development
Competitiveness and jobs (the Lisbon objectives) are assessed as insufficiently covered in a number of the reviewed
reports , especially research and technological development in Objective 1 zones. A robust thematic evaluation at
Community level shows however that about 2/3 of expenditures are relevant to the Lisbon objectives, and that a
larger proportion would not have been achievable. There are no other Europe-wide conclusive statements arising
from the syntheses of programme evaluations.
Figure 2. Evaluators’ assessment of cohesion policy

4 | P a g e
In the programming period 2000-2013 ex-ante evaluation of all the operational programmes under the Convergence
Objective (prior Objective 1) remains an obligation, while Operational Programmes under the Regional
Competitiveness Objective (prior Objective 2) and the Employment Objective (prior Objective 3) should be evaluated
either per programme, per Fund or per priority axis. Operational Programmes under the Territorial Co-operation
Objective should be evaluated individually or in groups. The ex-ante evaluation of the new National Strategic
Reference Frameworks (which replace the National Development Plan and CSF) is not binding but it is strongly
recommended by the European Commission, in particular for the large Convergence Objective Member States. What
can be learned from previous evaluations? What could be done differently?
3. Logic Models as Existing Evaluation Paradigm
The existing paradigm of European Cohesion Policy Evaluation (ECPE) follows the rationalistic programme theory
models in which evaluation focuses strongly on programme inputs, outputs, results and impacts (so called logic
model). The logic models have a strong relationship to evaluation approaches that have been grouped under the label
of the theory-based evaluation (Weiss 1997). This tradition tries to structure evaluation to reflect a coherent theory
of how activities are intended to generate the results. Although, the limitations of this model are well-known and also
expressed in the ECPE-guidelines and handbooks (see e.g. EVALSED 2008) it has been applied in a rather mechanic
way. The delivery mechanism are not analysed and understood sufficiently (so called black-box syndrome) and the
contextual factors that shape policies are not given enough attention.
The logical framework or logic model is sketched in its simplest form in Figure 1 (for logical model and its limitations
see Uusikylä & Valovirta 2007). To keep matters simple this is for a development strategy that involves a single
instrument, i.e., job creation project. Of course, the actual situation will inevitably be more complicated than this, but
Figure 1 is useful for drawing out the main features.
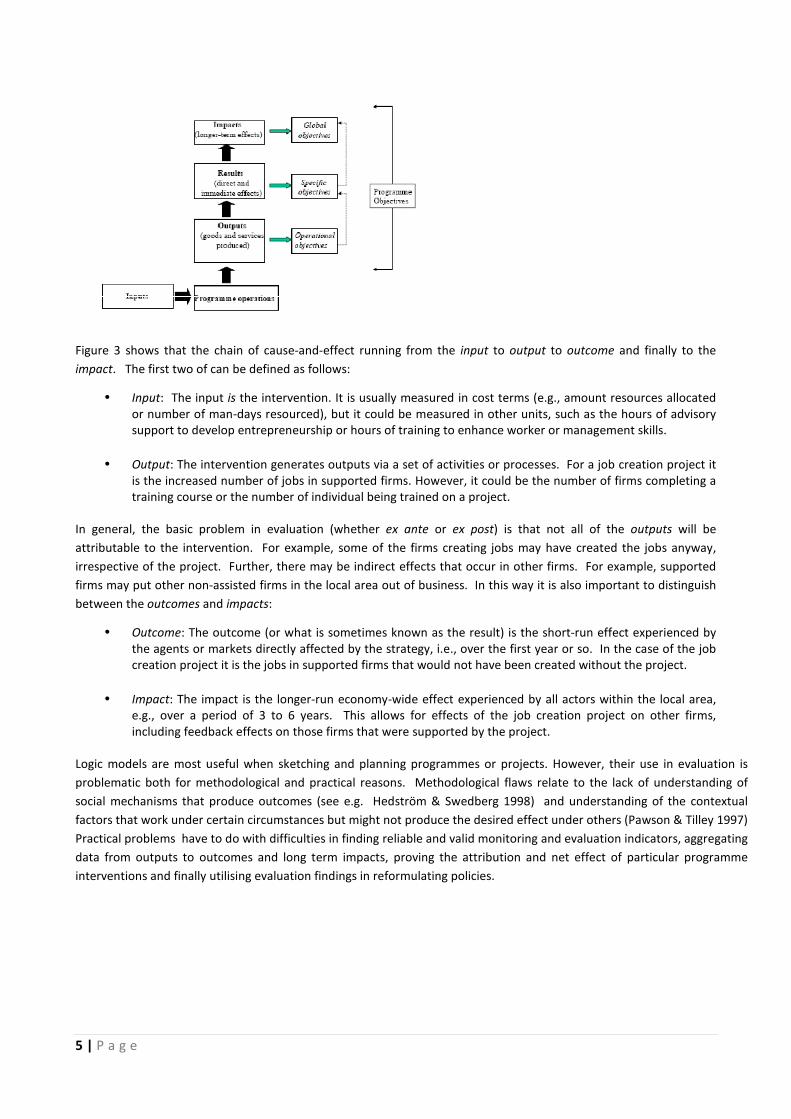
Figure 3. The Logic Model
5 | P a g e
Figure 3 shows that the chain of cause-and-effect running from the input to output to outcome and finally to the
impact. The first two of can be defined as follows:
• Input: The input is the intervention. It is usually measured in cost terms (e.g., amount resources allocated
or number of man-days resourced), but it could be measured in other units, such as the hours of advisory
support to develop entrepreneurship or hours of training to enhance worker or management skills.
• Output: The intervention generates outputs via a set of activities or processes. For a job creation project it
is the increased number of jobs in supported firms. However, it could be the number of firms completing a
training course or the number of individual being trained on a project.
In general, the basic problem in evaluation (whether ex ante or ex post) is that not all of the outputs will be
attributable to the intervention. For example, some of the firms creating jobs may have created the jobs anyway,
irrespective of the project. Further, there may be indirect effects that occur in other firms. For example, supported
firms may put other non-assisted firms in the local area out of business. In this way it is also important to distinguish
between the outcomes and impacts:
• Outcome: The outcome (or what is sometimes known as the result) is the short-run effect experienced by
the agents or markets directly affected by the strategy, i.e., over the first year or so. In the case of the job
creation project it is the jobs in supported firms that would not have been created without the project.
• Impact: The impact is the longer-run economy-wide effect experienced by all actors within the local area,
e.g., over a period of 3 to 6 years. This allows for effects of the job creation project on other firms,
including feedback effects on those firms that were supported by the project.
Logic models are most useful when sketching and planning programmes or projects. However, their use in evaluation is
problematic both for methodological and practical reasons. Methodological flaws relate to the lack of understanding of
social mechanisms that produce outcomes (see e.g. Hedström & Swedberg 1998) and understanding of the contextual
factors that work under certain circumstances but might not produce the desired effect under others (Pawson & Tilley 1997)
Practical problems have to do with difficulties in finding reliable and valid monitoring and evaluation indicators, aggregating
data from outputs to outcomes and long term impacts, proving the attribution and net effect of particular programme
interventions and finally utilising evaluation findings in reformulating policies.
6 | P a g e
4. Misinterpreting causality
Evaluations tend to label, relabel and to describe rather than to explain or understand why certain policies work while
others don’t. One of the main problem behind this and the mechanistic causal – effect models is that they neglect the fact
that action always takes place in situations and thus their success depends upon the way the action is performed by specific
actors in specific situations (as the realistic school of evaluation has emphasised). In a black box explanation the link
between input and output, or between explanans and explanandum, is assumed to be devoid of structure and the
explanatory mechanism is simply considered to be a regression coefficient linking I and O, and this regression coefficient is
supposed to describe the causal influence of I upon (Hedström & Swedberg 1998, 9–10).
I M O
In an alternative approach (so called mechanism–based explanation) seeks to find a causal agent that is assumed to have
generated the relationship between the entities being observed. Kaufman (1987) have highlighted that fact even before
the rise of realistic evaluation tradition, originally very heavily coined by Ray Pawson and Nick Tilley, approach by the
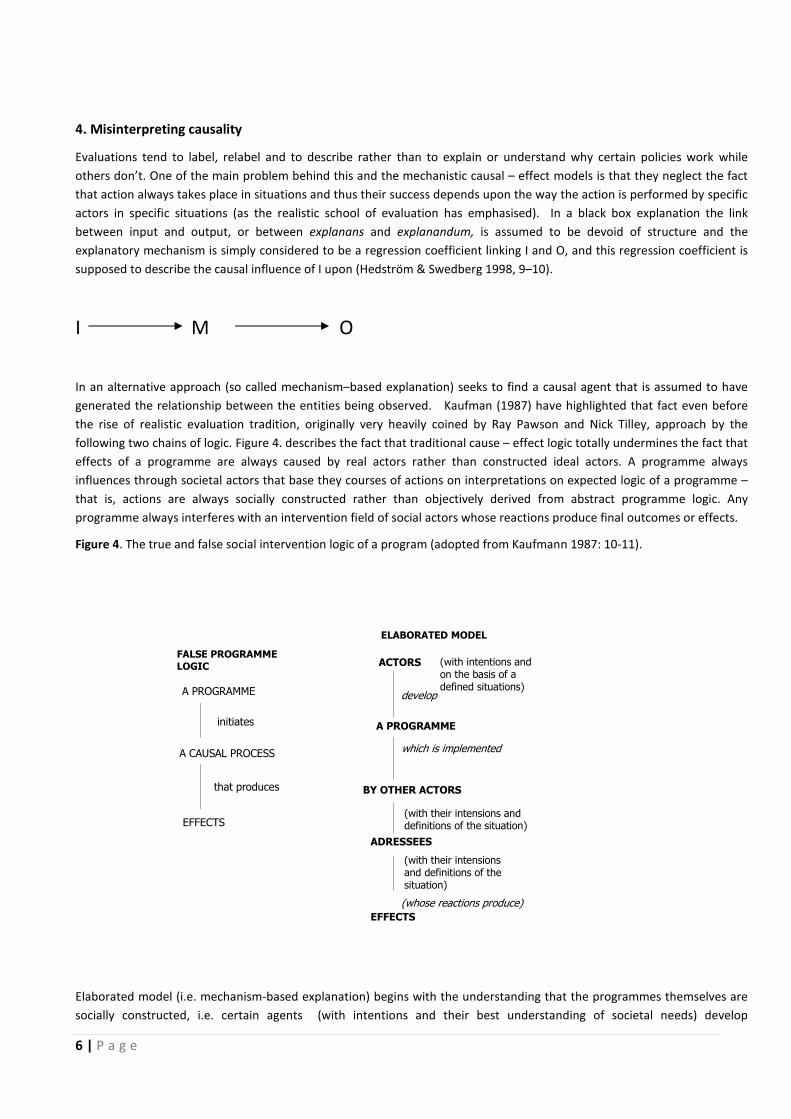
following two chains of logic. Figure 4. describes the fact that traditional cause – effect logic totally undermines the fact that
effects of a programme are always caused by real actors rather than constructed ideal actors. A programme always
influences through societal actors that base they courses of actions on interpretations on expected logic of a programme –
that is, actions are always socially constructed rather than objectively derived from abstract programme logic. Any
programme always interferes with an intervention field of social actors whose reactions produce final outcomes or effects.
Figure 4. The true and false social intervention logic of a program (adopted from Kaufmann 1987: 10-11).
Elaborated model (i.e. mechanism-based explanation) begins with the understanding that the programmes themselves are
socially constructed, i.e. certain agents (with intentions and their best understanding of societal needs) develop
ACTORS
A PROGRAMME
BY OTHER ACTORS
ADRESSEES
EFFECTS
develop
(with intentions andon the basis of a defined situations)
which is implemented
(with their intensions and definitions of the situation)
(with their intensionsand definitions of the situation)
(whose reactions produce)
FALSE PROGRAMME
LOGIC
A PROGRAMME
A CAUSAL PROCESS
EFFECTS
initiates
that produces
ELABORATED MODEL

7 | P a g e
programmes, which thereafter will be implemented by other actors who might – and most often do – have their own
interpretations of programme logic and its situational validation. Secondly, after that there will be a third set of actors who
try to adopt themselves with the expected goals and objectives (based on their own subjective understanding) and finally
implement the programme. Following through this logic of programme implementation constructed by multiple set of
actors it seems to be self-evident that we are dealing with several rather than one single interpretation of a program.
Therefore we need more precise methodology to understand how social programmes are turned into real outcomes and
impacts. In order to do this we also have to tackle so called agency problem or problem of combining micro level processes
to macro level policies.
5. Avoiding the Micro-Macro gap in policy analysis
In the main stream programme evaluation models there is imminent gap existing between programme-level goals and
project-level results. This is a classical problem of aggregation: programme-level results cannot simply be aggregated from
project-level results, although most of the programme evaluators and commissioners of these evaluations tend to believe
so. This is quite close to what Frank Fischer (1995) has called as mapping out situational validity in programme evaluation.
The major problem for explanations of system behaviour based on actions and orientations at the level below that of the
system is that of moving from the lower level to the system level. In economics, for example, there is microeconomic theory
and macroeconomic theory; and one of the central deficiencies in economic theory is the weakness of the linkage between
them, a weakness papered over with the idea of “aggregation” and with ubiquitous concept in macroeconomic theory, that
of the representative agent (Coleman 1990, 6-7). According to Coleman Model, proper explanations of change and variation
at the macro level entails showing how macro states (e.g. regional policy goals) at one point in time influence the behavior
of individual actors and how these actions generate new macro states (e.g. regional policy impacts) at a later time. In other
words, instead of analysing relationships between phenomena on the macro level, one should always try to establish how
macro-level events affect the individuals or organizations as collective actors, how these actors assimilate the impact of the
macro –level propositions and how number of individuals (see the critical mass or threshold by Granovetter 1985) through
their actions and interactions generate macro-level outcome.
Figure 5. Applied Coleman Model in Cohesion Policy Evaluation
A B
Regional Policy OP Economic growth
iv i
ii
1
3
2
iii
MACRO - LEVEL
MESO - LEVEL
MICRO - LEVEL
4
5 Programme created with certain set of actors that share common understanding of the programme goals
Local actors transform the programme goal into local priorities through local networks
Individuals in various projects transform programme goals and values into project goals and values
These goals are transformed into activities and outputs that benefit clients
Local innovations shape local modes of activities
Local results are transformed into macro effects
8 | P a g e
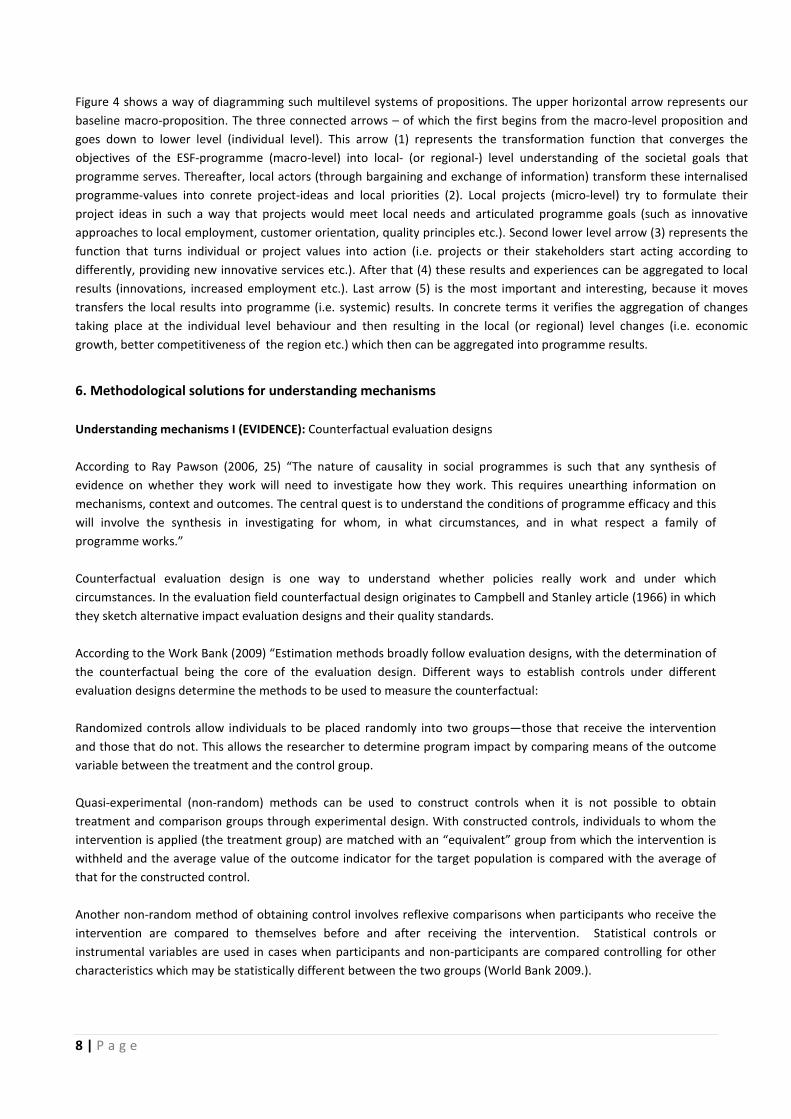
Figure 4 shows a way of diagramming such multilevel systems of propositions. The upper horizontal arrow represents our
baseline macro-proposition. The three connected arrows – of which the first begins from the macro-level proposition and
goes down to lower level (individual level). This arrow (1) represents the transformation function that converges the
objectives of the ESF-programme (macro-level) into local- (or regional-) level understanding of the societal goals that
programme serves. Thereafter, local actors (through bargaining and exchange of information) transform these internalised
programme-values into conrete project-ideas and local priorities (2). Local projects (micro-level) try to formulate their
project ideas in such a way that projects would meet local needs and articulated programme goals (such as innovative
approaches to local employment, customer orientation, quality principles etc.). Second lower level arrow (3) represents the
function that turns individual or project values into action (i.e. projects or their stakeholders start acting according to
differently, providing new innovative services etc.). After that (4) these results and experiences can be aggregated to local
results (innovations, increased employment etc.). Last arrow (5) is the most important and interesting, because it moves
transfers the local results into programme (i.e. systemic) results. In concrete terms it verifies the aggregation of changes
taking place at the individual level behaviour and then resulting in the local (or regional) level changes (i.e. economic
growth, better competitiveness of the region etc.) which then can be aggregated into programme results.
6. Methodological solutions for understanding mechanisms
Understanding mechanisms I (EVIDENCE): Counterfactual evaluation designs
According to Ray Pawson (2006, 25) “The nature of causality in social programmes is such that any synthesis of
evidence on whether they work will need to investigate how they work. This requires unearthing information on
mechanisms, context and outcomes. The central quest is to understand the conditions of programme efficacy and this
will involve the synthesis in investigating for whom, in what circumstances, and in what respect a family of
programme works.”
Counterfactual evaluation design is one way to understand whether policies really work and under which
circumstances. In the evaluation field counterfactual design originates to Campbell and Stanley article (1966) in which
they sketch alternative impact evaluation designs and their quality standards.
According to the Work Bank (2009) “Estimation methods broadly follow evaluation designs, with the determination of
the counterfactual being the core of the evaluation design. Different ways to establish controls under different
evaluation designs determine the methods to be used to measure the counterfactual:
Randomized controls allow individuals to be placed randomly into two groups—those that receive the intervention
and those that do not. This allows the researcher to determine program impact by comparing means of the outcome
variable between the treatment and the control group.
Quasi-experimental (non-random) methods can be used to construct controls when it is not possible to obtain
treatment and comparison groups through experimental design. With constructed controls, individuals to whom the
intervention is applied (the treatment group) are matched with an “equivalent” group from which the intervention is
withheld and the average value of the outcome indicator for the target population is compared with the average of
that for the constructed control.
Another non-random method of obtaining control involves reflexive comparisons when participants who receive the
intervention are compared to themselves before and after receiving the intervention. Statistical controls or
instrumental variables are used in cases when participants and non-participants are compared controlling for other
characteristics which may be statistically different between the two groups (World Bank 2009.).

9 | P a g e
Figure 6. Quasi-experimental evaluation design
Understanding mechanisms II (COMPLEXITY): Policy space and concept mapping
European multi-level governance is a complex environment to formulate, implement and evaluate policies and
programme. In this turbulent policy space actors in each level form complex policy networks (Kickert et. al. 1999)
where policy preferences, interests and explicit goals change in time and in circumstances. No single actor (European
or National or sub-national) has direct control over policies but the policy-making process is a nested game that needs
balancing and coordination between different societal actors (public, private and third sector ones) (Marks & Hooghe
2003).
Policy success in complex environment requires great deal of understanding on the non-linear linkages and indirect
impacts between different policies. It is notorious that many apparently simple problems turn out to be symptoms
rather than causes. For example homelessness in European urban areas is not a problem of lack of homes, but rather
of other traumas, from mental illness and family breakdown to drug addiction, that drive people onto the streets.
Similarly, prosperous start-ups are not direct causes of successful entrepreneur or innovation policies but a mixed
results of high-quality education system, supportive business environment, functioning value-networks, tax incetives
and know-how etc.
3
Target Group
(Random Sample)
Control Group
(Random Sample)
Prestest -measurement
Programme No-Programme
Posttest -measurement
Prestest -measurement
Posttest -measurement

10 | P a g e
Figure 7. Concept mapping as a tool for understanding strategy/policy space (case eGovernment Programme in
Finland)
Figure 7 gives an example on complex strategy space in the area of eGovernment in Finland. In the middle box there is
causal intervention scheme of the programme (JulkIT) as such and above the policies and strategies linking the
programme to a wider policy space. Below there are locan initiatives and sub-national strategies that play a critical
role when implementing the strategy or policy.
Concept mapping can be used as a tool for understanding complex policy environment when formulating policies but
also as an analytical tool for evaluating public policies. Colin Knox (1995) has applied concept mapping as an
evaluation technique to assess community relations programmes in Northern Ireland. He utilizes techniques such as
cluster analysis and multi-dimensional scaling to analyse linkages between policy areas.
Understanding mechanisms III (SOCIAL CAPITAL): Social network analysis
Alternative approaches in programme evaluation vary on how they treat programmes and actions that are taken to carry
out the activities of the programme. Economic models could be labelled as heavily under-socialised explanations (this term
is borrowed from Mark Granovetter (1985) who classify sociological and economic theories according to their emphasis on
agency and structure) of societal reality, i.e. they focus on programs and their societal goals while forgetting the individual
action through which - and the context in which - the programmes are implemented. This may in the worst case lead into
false and mechanistic interpretation of programmes’ actual results and impacts.
Investments inICT-services
Strategic capacityto apply eGovernment
services
Interoperatibilityof government
services
Interlinkagesbetween
inter-organisationalservice processes
Data security andprotection
Increasingproductivity
Improving servicequality
Improved servicequality
Customersatisfaction with
eServicesCitizens trust in
eGovernment
Increasedflexibility of
public services
Lisbon strategy
eTEN Programme
eInclusion
i2010
FP 7, 2007-2013
Cohesion policy
Government programme
SADe programme
Strategy on information society
Regional strategies and programmes
Municipal strategies
KuntaIT
PARAS-project
EU POLICIES &
STRATEGIES
NATIONAL POLICIES &
STRATEGIES
REGIONAL &
LOCAL
STRATEGIES AND INITIATIVES
eGOV STRATEGY

11 | P a g e
Social network analysis is based on an assumption of the importance of relationships among interacting units. The
social network perspective encompasses theories, models, and applications that are expressed in terms of relational
concepts or processes. Along with growing interest and increased use of network analysis has come a consensus about
the central principles underlying the network perspective. In addition to the use of relational concepts, we note the
following as being important:
• Actors and their actions are viewed as interdependent rather than independent, autonomous
units
• Relational ties (linkages) between actors are channels for transfer or "flow" of resources
(either material or nonmaterial)
• Network models focusing on individuals view the network structural environment as
providing opportunities for or constraints on individual action
• Network models conceptualize structure (social, economic, political, and so forth) as lasting
patterns of relations among actors
The unit of analysis in network analysis is not the individual, but an entity consisting of a collection of individuals and
the linkages among them. Network methods focus on dyads (two actors and their ties), triads (three actors and their
ties), or larger systems (subgroups of individuals, or entire networks2.
Network analysis is a cross-disciplinary endeavour to understand how social systems work and what is their impact on
communities and societies as a whole. Social network analysis (related to network theory) has emerged as a key
technique in modern sociology. It has also gained a significant following in anthropology, biology, communication
studies, economics, geography, information science, organizational studies, social psychology, and sociolinguistics as
well as a popular topic of speculation and study.
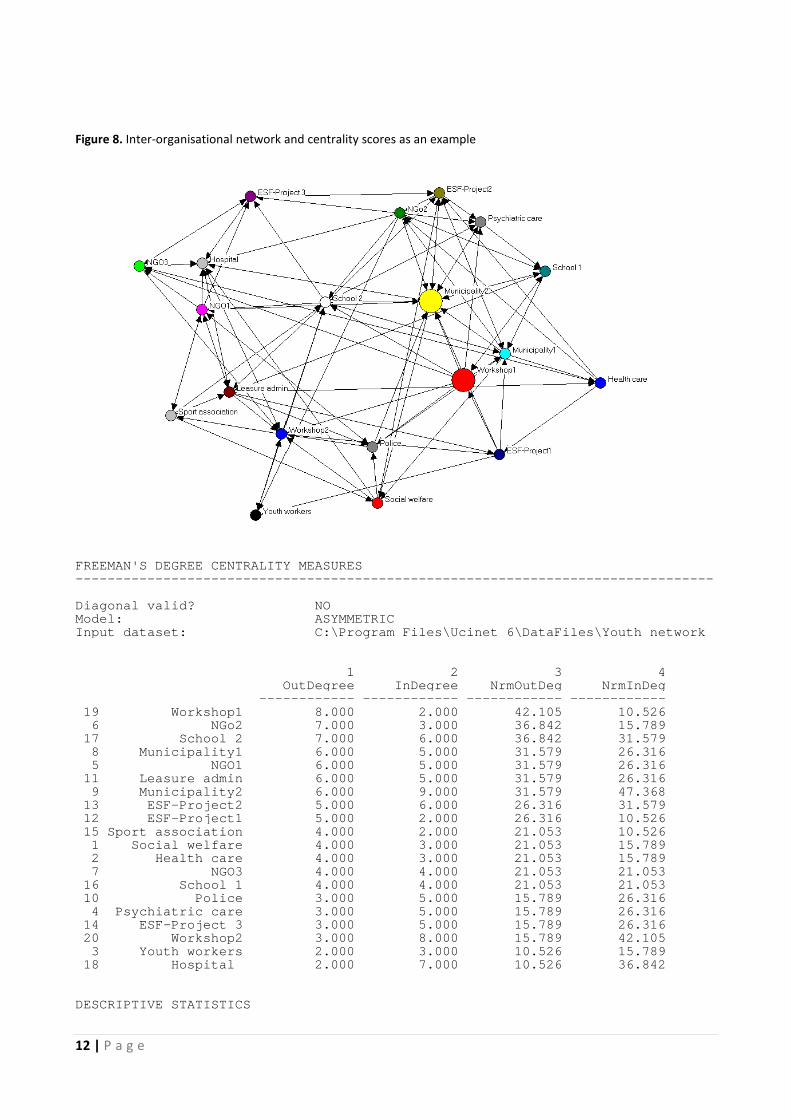
Network analysis is a useful tool for describing complex social or inter-organisational networks and cooperation
mechanisms. It can also be used powerful statistical toolbox for analyzing networks as a whole (density, centralization,
transitivity etc.), sub-groups of networks (clusters, block modeling, clique etc. ) and individual positions (centrality,
betweennes etc.) in networks. Figure 8 presents an example of regional level inter-organisational network of youth
inclusion. First there is a description or sociogramme of the networks and below Freeman’s centrality scores for each
organization in the network.
2 Wasserman, S. and K. Faust, 1994, Social Network Analysis. Cambridge: Cambridge University Press.
12 | P a g e
Figure 8. Inter-organisational network and centrality scores as an example
FREEMAN'S DEGREE CENTRALITY MEASURES--------------------------------------------------- ----------------------------- Diagonal valid? NOModel: ASYMMETRICInput dataset: C: OutDegree InDegree NrmOutDeg NrmInDeg ------------ 19 Workshop1 6 NGo2 7.000 3.000 36.842 15.789 17 School 2 7.000 6.000 36.842 31.579 8 Municipality1 6.000 5.000 31.579 5 NGO1 6.000 5.000 31.579 26.316 11 Leasure admin 6.000 5.000 31.579 26.316 9 Municipality2 6.000 9.000 31.579 47.368 13 ESF-Proj ect2 5.000 6.000 26.316 31.579 12 ESF- Project1 5.000 2.000 26.316 10.526 15 Sport association 4.000 2.000 21.053 10.526 1 Social welfare 4.000 3.000 2 Health care 4.000 3.000 21.053 15.789 7 NGO3 4.000 4.000 21.053 21.053 16 School 1 4.000 4.000 21.053 21.053 10 Police 3.000 5.000 15.789 26.316 4 Psychiatric care 3.000 5.000 15.789 26.316 14 ESF- Project 3 3.000 5.000 15.789 26.316 20 Workshop2 3.000 3 Youth workers 2.000 3.000 10.526 15.789 18 Hospital 2.000 7.000 10.526 36.842 DESCRIPTIVE STATISTICS
organisational network and centrality scores as an example
ENTRALITY MEASURES --------------------------------------------------- -----------------------------
Diagonal valid? NO Model: ASYMMETRIC Input dataset: C: \Program Files\Ucinet 6\ DataFiles
1 2 3 4OutDegree InDegree NrmOutDeg NrmInDeg
------------ ------------ ------------ ------------19 Workshop1 8.000 2.000 42.105 10.526
6 NGo2 7.000 3.000 36.842 15.78917 School 2 7.000 6.000 36.842 31.579
8 Municipality1 6.000 5.000 31.579 5 NGO1 6.000 5.000 31.579 26.316
11 Leasure admin 6.000 5.000 31.579 26.3169 Municipality2 6.000 9.000 31.579 47.368
ect2 5.000 6.000 26.316 31.579Project1 5.000 2.000 26.316 10.526
15 Sport association 4.000 2.000 21.053 10.5261 Social welfare 4.000 3.000 21.053 15.7892 Health care 4.000 3.000 21.053 15.7897 NGO3 4.000 4.000 21.053 21.053
16 School 1 4.000 4.000 21.053 21.053Police 3.000 5.000 15.789 26.316
4 Psychiatric care 3.000 5.000 15.789 26.316Project 3 3.000 5.000 15.789 26.316
20 Workshop2 3.000 8.000 15.789 42.1053 Youth workers 2.000 3.000 10.526 15.789
18 Hospital 2.000 7.000 10.526 36.842
--------------------------------------------------- -----------------------------
DataFiles \Youth network
1 2 3 4 OutDegree InDegree NrmOutDeg NrmInDeg
------------ 8.000 2.000 42.105 10.526
6 NGo2 7.000 3.000 36.842 15.789 17 School 2 7.000 6.000 36.842 31.579
26.316 5 NGO1 6.000 5.000 31.579 26.316
11 Leasure admin 6.000 5.000 31.579 26.316 9 Municipality2 6.000 9.000 31.579 47.368
ect2 5.000 6.000 26.316 31.579 Project1 5.000 2.000 26.316 10.526
15 Sport association 4.000 2.000 21.053 10.526 21.053 15.789
2 Health care 4.000 3.000 21.053 15.789 7 NGO3 4.000 4.000 21.053 21.053
16 School 1 4.000 4.000 21.053 21.053 Police 3.000 5.000 15.789 26.316
4 Psychiatric care 3.000 5.000 15.789 26.316 Project 3 3.000 5.000 15.789 26.316
8.000 15.789 42.105 3 Youth workers 2.000 3.000 10.526 15.789
18 Hospital 2.000 7.000 10.526 36.842

13 | P a g e
1 2 3 4 OutDegree InDegree NrmOutDe g NrmInDeg ------------ ------------ ----------- - ------------ 1 Mean 4.600 4.600 24.21 1 24.211 2 Std Dev 1.685 1.908 8.87 0 10.041 3 Sum 92.000 92.000 484.21 1 484.211 4 Variance 2.840 3.640 78.67 0 100.831 5 SSQ 480.000 496.000 13296.39 8 13739.612 6 MCSSQ 56.800 72.800 1573.40 7 2016.620 7 Euc Norm 21.909 22.271 115.31 0 117.216 8 Minimum 2.000 2.000 10.52 6 10.526 9 Maximum 8.000 9.000 42.10 5 47.368 Network Centralization (Outdegree) = 18.837% Network Centralization (Indegree) = 24.377%
Understanding mechanisms III (LEARNING): Metaevaluation and evaluators as information brokers
Evaluations must be fully integrated into programme planning and management. Programme managers need to think
of evaluation as a resource: a source of feedback, a tool for improving performance, an early warning of problems
(and solutions) and a way of systematizing knowledge. Evaluation is not simply an external imposition. Of course, this
truism has implications for evaluators, who need to take on board the concerns of programme managers (and their
partnerships) and try to take seriously their need for answers to difficult questions (Evalsed 2009).
METAEVALUATION
In his view (Burt, 2005), ”a structural hole is a potentially valuable context for action, brokerage is the action of
coordinating across the hole with bridges between people on opposite sides of the hole, and network (…) brokers, are
the people who build the bridges. (…) The social capital of structural holes comes from the opportunities that holes
provide to broker the flow of information between people, and shape the projects that bring together people from
opposite sides of the hole. “
By using Burt’s notion of structural holes, we propose that the evaluator role should be developed systematically
towards bridging the immanent structural holes (not only among actors but also between policies) that exist in
modern societies. Therefore evaluation should contribute more to strengthening a) social capital among policy-related
societal actors and b) enhancing policy coherence by bridging gaps between different policies and policy arenas.
The first endeavor (strengthening social capital) would move evaluation towards deliberative policy analysis thus
aiming at the strengthening of democratic governance in the network society. In practical terms it would mean
shifting focus from impact analysis to policy-making practices, processes and interpretation schemes. The goal here is
the inclusion of those affected by public policy and also the search for the most appropriate way of involving many of
the others that might be indirectly affected by it. This would mean the creation of well-considered linkages between
citizens, policy institutions and often unstable policy practices (Hajer et. al 2003).
The second goal (enhancing policy capital) refers to the increasing need to have a more comprehensive evaluation
focus. Evaluation should consider thematic sets of policies and their inter-linkages and not only single-policy effects
and their would-be impacts. In practice, this would mean that in the future evaluations would be more cross-sectoral,
thematic and would increasingly apply new techniques of meta-evaluation and scenario work developed in the field of
futures studies. This would also mean that the applied social science based disciplinary approach (including rigid
methodology, quantitative methods and linear causal models) should be complemented with synthesizing analyses
and the provision of meta-knowledge.

14 | P a g e
Figure 9. Evaluators bridging structural holes
Figure 9 summarizes our argumentation in respect of evaluators’ perceived brokerage role as bridging structural holes
between policy-makers and civic organizations/citizens by enhancing social capital . This has also been taken to the
agenda for realist school of evaluation (see Pawson 2006). The enhancement of policy-capital entails that the
evaluator becomes more active in creating new fora for policy-debates, the exchange of ideas and argumentation on
the issues of agenda-setting, policy-framing and policy-options. Finally the desire to strengthen policy coherence
entails a shift in the evaluation focus from single-policy impact analysis to multi- and cross-policy affiliations,
dependencies, gross-outcomes and their impacts on society and on the welfare of the citizens of Europe as a whole.
As it stands this schema currently constitutes only an abstract sketch of the overall need for a new brokerage and
closure role and thus undoubtedly requires further analysis and piloting to sculpt the new tools and methods likely to
be needed by evaluators in the next decade. What this schema needs, of course, is adjustment based on empirical
testing and more nyansed conceptual thinking.
Top-Elite
Decision-Makers
Expert Field
Evaluators
Society
Citizens &
Projects
Rational
Planning
Approach
Participatory
Approach
Policy Advise
Approach
Decision-Makers Evaluators Citizens &
Projects
Decision-Makers Evaluators Citizens &
Projects
GAP
GAP
GAP

15 | P a g e
References:
Barca, Fabrizio (2009). An Agenda for a Reformed Cohesion Policy. Place-based approach to meeting European
challenges and expectations. Independent Report prepared at the request of Danuta Hübner, Commissioner for
Regional Policy. April 2009.
Burt, Ronald S. (2005). Brokerage & Closure. An introduction to Social Capital. New York: Oxford University Press.
Campbell, Donald & Stanley, J.C (1966). Experimental and Quasi-experimental Designs is Research. Chicago: Rand
McNally.
Coleman, James (1990). Foundations of Social Theory. Cambridge, Mass: The Belknap Press of Harvard University
Press.
European Commission (2008). Meta-study on lessons from existing evaluations as an input to the Review of EU
spending. Final report by Euréval and Ramboll Management.
European Commission (2009). Statistics on evaluation in the Commission 2000-2007. Report by the European
Commission.
Evalsed (2009). The Evaluation of Socio-economic Development. The Guide. Brussels: European Commission.
Fischer, Frank (1995). Evaluating Pulic Policies. Chicago: Nelson-Hall Publishers.
Granovetter, Mark S. (1985). Economic Action and Social Structure: The Problem of Embeddedness. American Journal
of Sociology 91: 481-510.
Hajer, Maarten A. & Wagenaar, Hendrik (Eds) (2003). Deliberative policy Analysis. understanding Governance in the
Network Society. Cambridge: Cambridge University Press.
Hedström, Peter & Swedberg, Richard (2005). Social Mechanisms. An Introductory Essay in Hedström, Peter &
Swedberg, Richard (Eds.). Social Mechanisms. An Analytical Approach to Social Theory.
Kaufman, Franz-Xaver (1987). Prevention and Intervention in the Analytical Perspective of Guidance. In Klaus
Hurrelmann et al. (eds.) Social Interventions: Potential and Constraints. pp. 3-20. Berlin & New York: Walter de
Gruyter.
Knox, Colin (1995). Concept mapping in policy evaluation: a research review of community relations in Northern
Ireland. ULSTER PAPERS IN PUBLIC POLICY AND MANAGEMENT.
OECD (1998). Best Practice Guidelines for Evaluation. PUMA Policy Brief No. 5. Paris: OECD.
Pawson, Ray (2006). Evidence-based Policy. A Ralistic Perspective. London: SAGE Publications.
Pawson, Ray & Nick Tilley (1997) Realistic evaluation. Sage, Thousand Oaks.
Uusikylä, Petri & Virtanen, Petri (2000): Metaevaluation as a Tool for Learning: A Case Study of the European
Structural Fund Evaluations in Finland. Evaluation 1 (6), 50-65. 2000.
Virtanen, Petri & Uusikylä, Petri (2004). Exploring the Missing Links between Cause and Effect. A Conceptual
Framework for Understanding Micro-Macro Conversions in Programme Evaluation. Evaluation 1 (10), 77-91. 2004.
Uusikylä, Petri & Valovirta, Ville (2007). Three Spheres of Performance Governance: Spanning the boundaries from
single-organisation focus towards a partnership network', Evaluation 13(4).

16 | P a g e
Uusikylä, Petri & Virtanen, Petri (2009): Evaluators as Information Brokers – Approach to enhance social capital and
policy coherence. Conference paper in EES (European Evaluation Society) Conference, 1-3 October 2008. STREAM 4
Methodological Choices and Approaches (Evaluation connections 1/2009).
Wasserman, Stanley& Faust, Kathrine (1994). Social Network Analysis. Cambridge: Cambridge University Press.
Weiss, Carol H. (1997) Theory-Based Evaluation Past, Present, and Future. New Directions for Evaluation 76, 41-55.
World Bank (2004). Monitoring and Evalution. Some tools, methods and approaches. Washington DC: World bank.