making progress - social market foundation · making progress boosting the skills and wage ......
TRANSCRIPT
Nigel Keohane and Claudia Hupkau
MAKINGPROGRESS
Boosting the skills and wage prospects of the low paid
Kindly supported by
Boosting the skills and wage prospects of the low paid
MAKING PROGRESS

FIRST PUBLISHED BY The Social Market Foundation, April 2014 ISBN: 978-1-904899-90-7
11 Tufton Street, London SW1P 3QBCopyright © The Social Market Foundation, 2014The moral right of the authors has been asserted. All rights reserved. Without limiting the rights under copyright reserved above, no part of this publication may be reproduced, stored or introduced into a retrieval system, or transmitted, in any form or by any means (electronic, mechanical, photocopying, recording, or otherwise), without the prior written permission of both the copyright owner and the publisher of this book.
THE SOCIAL MARKET FOUNDATIONThe Foundation’s main activity is to commission and publish original papers by independent academic and other experts on key topics in the economic and social fields, with a view to stimulating public discussion on the performance of markets and the social framework within which they operate.
The Foundation is a registered charity and a company limited by guarantee. It is independent of any political party or group and is funded predominantly through sponsorship of research and public policy debates. The views expressed in this publication are those of the author, and these do not necessarily reflect the views of the sponsors or the Social Market Foundation.
CHAIRMANMary Ann Sieghart
MEMBERS OF THE BOARDDaniel FranklinGraham MatherSir Brian Pomeroy cbeBaroness Gillian ShephardNicola HorlickProfessor Alison WolfLord Richard Faulkner
DIRECTOREmran Mian
DESIGN AND PRODUCTIONSoapbox www.soapbox.co.uk
PRINTED BY Repropointwww.repropoint.com
CONTENTS
CONTENTS
Acknowledgements 4
About the Authors 5
Executive Summary 6
CHAPTER 1
Introduction 12
CHAPTER 2
The case for investing in skills 20
CHAPTER 3
The case for government action on skills 32
CHAPTER 4
The ‘Skills for Progress’ scheme for the low paid 43
APPENDIX
Methodology – Quarterly Labour Force Survey 59
Calculating the earnings premium from a qualification 61
Evolution of low pay and low pay persistence 66
Methodology – Household specimen calculations 67
for savings to the Exchequer
Low pay by industrial sector 70
Regional distribution of low pay and ‘stuck’ in low pay 71
Wage mobility by earnings quintiles 72
Definition of occupational groups 73

SOCIAL MARKET FOUNDATION
4
ACKNOWLEDGEMENTS
The publication of this report has been made possible by the
generous support of Interserve.
We would like to thank the members of our steering group,
including Katie Schmuecker (Joseph Rowntree Foundation), John
Wastnage (British Chambers of Commerce), Lesley Giles, (UKCES),
Derek French (Department for Work and Pensions), Kris Krasnowski
(Cabinet Office), Daniel Griffiths and Bob Vince (Interserve), Colin
Geering (Knowsley Metropolitan Borough Council), Richard Exell
(TUC) and Tony Wilson (Inclusion).
A big thank you is due to Gareth Morgan from Ferret Information
Systems who carried out the calculations on household benefits
for us.
We would also like to thank others who have commented on
previous drafts and inputted into the paper including Simon Blake,
Nida Broughton, Oliver Finlay and Emran Mian.
Any errors or omissions remain those of the authors.

MAKING PROGRESS
5
ABOUT THE AUTHORS
NIGEL KEOHANE
Nigel Keohane is Research Director at the Social Market Foundation,
having joined in summer 2011. Previously he was Head of Research
at the New Local Government Network where he was responsible
for NLGN’s research programme and policy development. His
research has focused on public service reform, commissioning,
public management and transport. Prior to that Nigel served as
a political advisor at Wokingham Borough Council, taught history
at Queen Mary College, University of London, and worked for the
Learning and Skills Council. He has a BA and MA in history from
Exeter University, and a PhD in Political History from Queen Mary.
CLAUDIA HUPKAU
Claudia Hupkau is a Research Fellow for the Social Market
Foundation. She is currently completing a PhD in Economics at the
Université Catholique de Louvain (UCL), Belgium, and is a member
of the Centre for Operations Research and Economics, Belgium.
She is part of the research group ‘Poverty, Resource Equality and
Social Policy’ at UCL and has worked on the behavioural economics
of poverty and education.
SOCIAL MARKET FOUNDATION
6
EXECUTIVE SUMMARY
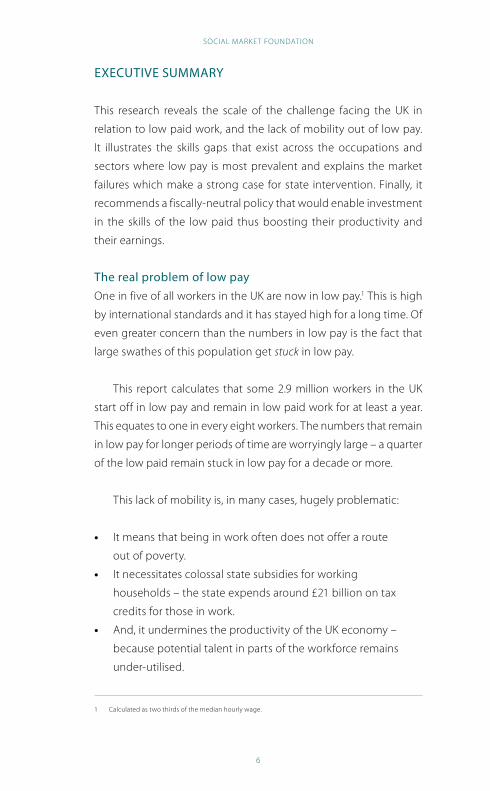
This research reveals the scale of the challenge facing the UK in
relation to low paid work, and the lack of mobility out of low pay.
It illustrates the skills gaps that exist across the occupations and
sectors where low pay is most prevalent and explains the market
failures which make a strong case for state intervention. Finally, it
recommends a fiscally-neutral policy that would enable investment
in the skills of the low paid thus boosting their productivity and
their earnings.
The real problem of low pay One in five of all workers in the UK are now in low pay.1 This is high
by international standards and it has stayed high for a long time. Of
even greater concern than the numbers in low pay is the fact that
large swathes of this population get stuck in low pay.
This report calculates that some 2.9 million workers in the UK
start off in low pay and remain in low paid work for at least a year.
This equates to one in every eight workers. The numbers that remain
in low pay for longer periods of time are worryingly large – a quarter
of the low paid remain stuck in low pay for a decade or more.
This lack of mobility is, in many cases, hugely problematic:
• It means that being in work often does not offer a route
out of poverty.
• It necessitates colossal state subsidies for working
households – the state expends around £21 billion on tax
credits for those in work.
• And, it undermines the productivity of the UK economy –
because potential talent in parts of the workforce remains
under-utilised.
1 Calculated as two thirds of the median hourly wage.
MAKING PROGRESS
7
Of these three problems, it is the productivity challenge that
is the most fundamental: leave it unaddressed and the social and
fiscal difficulties can only persist and worsen. UK productivity lags
behind comparator countries – a lack of investment in physical
capital, skills and innovation has undermined UK economic
performance. The latest figures show that UK productivity (in terms
of output per hour) was 16 percentage points below the average
for the rest of the major industrialised economies in 2012; and 24%
behind comparators such as France and Germany.
The UK cannot address its low pay problem without addressing
this productivity shortfall. To this end, policymakers should seek to
boost the skills and productivity of those stuck in low paid work.
We can make a strong case to businesses to pay their workers more
if these employees are made more valuable to them.
Why skills should be an answerThree in ten of those on low pay do not have officially-recognised
qualifications; a further one in five is educated to GCSE level.
Amongst the low paid workforce lie many of the poorly-skilled
individuals who require assistance to progress. Meanwhile, the latest
Employer Skills Survey finds that employers report significant skills
deficiencies; in the three bottom level occupations where low paid
work is concentrated, employers report that 656,000 workers have
insufficient skills to carry out their current role.
Our analysis shows that for those in low pay the association
between training and occupational progression is strong. Those
least likely to move occupational group were those on low pay
who did not receive training. On receipt of training the low paid
become the most likely to progress up the occupation bands.
These findings complement other evidence that skills qualifications
can help boost the earnings of the low paid. For instance, research
by the Department of Business, Innovation and Skills has shown
SOCIAL MARKET FOUNDATION
8
that on average, achieving a Level 1 qualification adds about 10%
to the earnings of a worker with no qualifications.
Despite the advantages that typically stem from training,
the low paid are the least likely to receive training, to be offered
it by their employer and to take it up when it is offered them.
A whole range of factors suppress take up, including cost and time
constraints.
In the context of a tightening UK skills budget and with the
introduction of 24+ loans for vocational education, this problem is
likely to worsen rather than improve. The Government’s ambitious
apprenticeships policy and the proposals from all political parties
to prioritise improvement in school education and support to
the young are necessary steps. But, with 80% of the UK’s 2020
workforce already of working age, much more needs to be done
to boost skill levels.
Stacking up the business case for investing in the skills of the low paidThis research makes the case for adopting an approach that
would encourage firms to up-skill those stuck in low pay without
additional costs to the public purse. A number of schemes –
including the Youth Contract – attempt to use projected savings
to the Exchequer to achieve specific goals on employment and
wage levels. This research finds a strong case for using the same
principle to invest in the skills and productivity of those stuck in
low pay, and specifically those who typically receive less support
from government, namely those over the age of 24.
So, how much might be saved to the public purse?
We estimate that under a revenue-neutral scheme the
Government would be able to spend over £2,000 on each person
stuck in low paid work through a mixture of training costs and
MAKING PROGRESS
9
financial incentives. Drawing on government and academic studies,
the report assumes a central estimate of 10% as an earnings premium
that comes from a nationally-recognised skills qualification. Such
increases could have a dramatic effect: increasing household
incomes and yielding significant savings to the Exchequer. For a
typical full-time low-paid worker earning £7 per hour (approximately
mid-way between the National Minimum Wage and the low pay
threshold), over £800 would accrue to the Treasury each year in
increased tax receipts and lower benefits paid out. For low income
households with children, where housing benefit payments are
high, the savings are even more significant. Were the state to
capture these savings, it would enable a significant pot with which
to invest in training and incentivise participation so as to address the
lack of skills provision and take up for those stuck in low pay. Even
allowing for a more pessimistic estimate of the earnings premium of
5%, the government would still be able to invest upwards of £2,000
were the savings to be captured over the course of a parliament.
The gains to the household are also significant. A single person
without dependent children with typical housing costs would take
home £555 extra per year (net of tax and benefits).
‘Skills for Progress’ schemeTo boost the skills, productivity and wages of those stuck in low
pay, this report proposes a ‘Skills for Progress’ scheme. The scheme
would make money available to employers (whether private
enterprises or public sector organisations) that they could draw
down to fund skills provision and qualifications for their employees
in low pay. Eligible individuals would include any worker who has
earned below the low pay threshold for a year or more and who
is aged over 24. We estimate there are approximately 2.93 million
eligible workers.
The report suggests that participating firms should be
incentivised to seek out the most productive training and to
SOCIAL MARKET FOUNDATION
10
facilitate progression. This could include the threat of a claw back of
part of the funding if the earnings of the employee did not increase
after two years elapsing.
Employers will be free to organise themselves into partnerships
to engage in this scheme. We envisage that some smaller firms
– who typically have more limited progression opportunities
internally as well as limited human resource capabilities – may
wish not to administer the scheme themselves. For those firms
that do not wish to participate in this scheme on their own, the
report proposes that Local Enterprise Partnerships (LEPs) could
take responsibility commissioning training on their behalf. These
business-led sub-regional partnerships would be able to draw
down funding – as part of their City Deals or Growth Deals – to
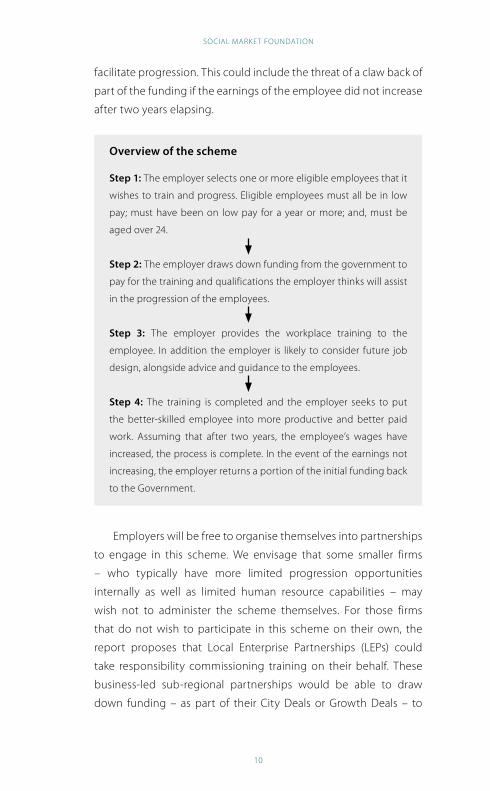
Overview of the scheme
Step 1: The employer selects one or more eligible employees that it
wishes to train and progress. Eligible employees must all be in low
pay; must have been on low pay for a year or more; and, must be
aged over 24.
Step 2: The employer draws down funding from the government to
pay for the training and qualifications the employer thinks will assist
in the progression of the employees.
Step 3: The employer provides the workplace training to the
employee. In addition the employer is likely to consider future job
design, alongside advice and guidance to the employees.
Step 4: The training is completed and the employer seeks to put
the better-skilled employee into more productive and better paid
work. Assuming that after two years, the employee’s wages have
increased, the process is complete. In the event of the earnings not
increasing, the employer returns a portion of the initial funding back
to the Government.

MAKING PROGRESS
11
invest on behalf of SMEs in their region. As with City Deals, the
outcome risks could be shared between national government
and LEPs. As well as commissioning training, LEPs would be well-
positioned to coordinate advice and HR support that, alongside
training, could facilitate progression.
Boosting the skills of those stuck in low pay would make these
individuals more valuable to UK firms and to the UK economy,
unblocking the barriers to career progression.
SOCIAL MARKET FOUNDATION
12
CHAPTER 1: INTRODUCTION
The recession and the current recovery have brought the issue of low
pay vividly into the public eye. Unemployment has been much lower
than many expected, but this has been accompanied by significant
reductions in real earnings since 2009.2 However, this immediate
problem of pay should not distract from more fundamental flaws in
the UK economy and labour market associated with low pay.3
4 What is low pay?
For the purpose of this paper we use the international definition of
low pay: hourly wages below two thirds of the national median wage.
In our analysis, we focus on the working population excluding full-
time students and those under the age of 25. The low-pay threshold
computed for this group from the Quarterly Labour Force Survey, July –
September, 2013 is £7.62.3 The percentage of this group that is low paid
is 22%; the number paid below £7.62 is 4.7m. By way of comparison, the
standard National Minimum Wage is currently set at £6.31. The Living
Wage is a bottom-up calculation of the minimum earnings needed to
enable a household to meet basic needs. The current Living Wage rate
is £7.65 outside London and £8.80 in London.4
1. LOW PAY UK
In September 2013, nearly 5 million people were on low pay, 22% of
the total UK workforce. This is a high proportion compared to most
other developed countries, second only in fact to the USA. What is
more, the prevalence of low paid work is a persistent characteristic
of the UK labour market rather than a consequence of the recession.5
2 Tony Wilson, Laura Gardiner and Kris Krasnowski, Work in Progress: Low pay and progression in London and the
UK (Inclusion, 2013).
3 By way of comparison the low pay threshold is £7.28 when under-25s are included.
4 The Living wage foundation, What is the living wage?, 2014, www.livingwage.org.uk.
5 Between 1986 and 2011, earnings increased by 47% for those in the lowest decile and by 62% for the median
earner.The share of the individuals who were stuck on low pay for at least one year was averaged around 65% in
the past decade, exhibiting a rising trend since the crisis (See appendix 3).
MAKING PROGRESS
13
2. WHO ARE THE LOW PAID?
Low pay is particularly common in specific sectors and occupations.
The proportion of employees on low pay in the private sector
(27%) is far higher than the proportion in the public sector (9%). By
industrial sector, the highest proportions can be found in retail and
hospitality (see Appendix 5). These two sectors have not only the
highest percentage of low paid workers but are also the two largest
employers of low paid staff, with 1.5 million and 830,000 respectively.6
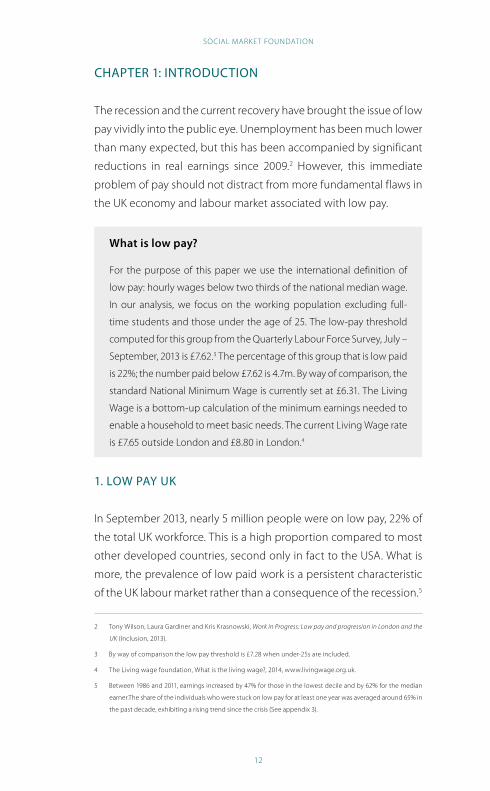
Figure 1: Breakdown of those on low pay by occupation
0%
10%
20%
30%
40%
50%
60%
70%
0
200,000
400,000
600,000
800,000
1,000,000
1,200,000
1,400,000
1,600,000
1,800,000
2,000,000
Elem
enta
ryoc
cupa
tions
Sale
s &
Cus
tom
er S
ervi
ces
Pers
onal
Ser
vice
s
Proc
ess,
plan
t &m
achi
nery
ope
rativ
es
Skill
ed tr
ades
Adm
in &
sec
reta
rial
Man
gers
&se
nior
offi
cial
s
Ass
ocia
te p
rofe
ssio
nal
& te
chni
cal
Prof
essi
onal
Shar
e of
em
ploy
ees
in lo
w p
ay
Num
ber o
f em
ploy
ees
in lo
w p
ay
Number of employeeson low pay (left axis)
Share of individualson low pay (right axis)
Source: Resolution Foundation, 2013.
Low pay is also – unsurprisingly – concentrated in lower occupations
(see Figure 1). Over half of those in the workforce in elementary
occupations and sales and customer service are on low pay.
Low pay is also frequently associated with part-time work, with 43%
of all part-time workers on low pay.7 The percentage of low paid staff is
much higher proportionally in small firms than in larger firms.
6 Alex Hurrell and Matthew Whittaker, Low Pay Britain 2013 (Resolution Foundation, 2013).
7 Alex Hurrell, Starting out or getting stuck. (Resolution Foundation, 2013).
SOCIAL MARKET FOUNDATION
14
3. THE REAL PROBLEM: THOSE TRAPPED IN LOW PAY
An economy will always have a certain share of the working
population on low pay (in part simply because it is a relative
measure). Young people may take on low paid jobs to build
experience, receive training and gain work skills that will help their
career progression.8 Others may choose to take on roles with little
responsibility even though remuneration is low.
Of greater public policy concern are people who become
trapped in low-pay, who face difficulties progressing in their job
and are dependent on government transfers over long periods of
time. The analysis below shows that many people find themselves
unable to break out of low pay.
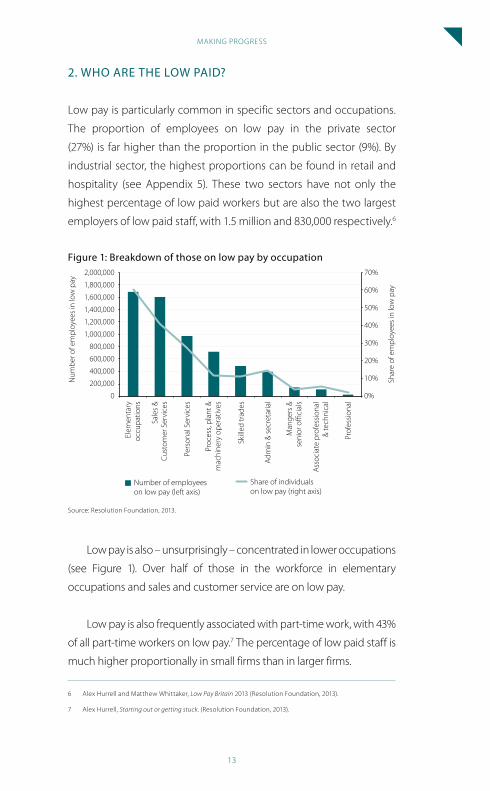
First, this problem can be explored by analysing movement
into and out of low pay. As Figure 2 below illustrates, 66% of those
who start off in low pay remain in low pay rather than progress
during a twelve month period.9
Second, evidence suggests that the same is true when looking
at the earnings distribution more generally (see Appendix 7): On
average over the past decade, about 70% of those who start off in
the bottom quintile of the wage distribution stay there for at least
one year.
The proportion of those who start off in low pay and remain
stuck has grown significantly (see Appendix 3): from around 58%
in 2005 to almost 75% in 2013. Between 2012 and 2013, some
2.9 million workers were on low pay and had been for at least
one year.
8 The analysis later on in this paper will discount those under 25 to recognise that low pay when young is the
natural start to one’s career.
9 See also analysis by Inclusion using Living Wage benchmarks. Tony Wilson, Laura Gardiner and Kris
Krasnowski, Work in Progress: Low pay and progression in London and the UK (Inclusion, 2013).
MAKING PROGRESS
15
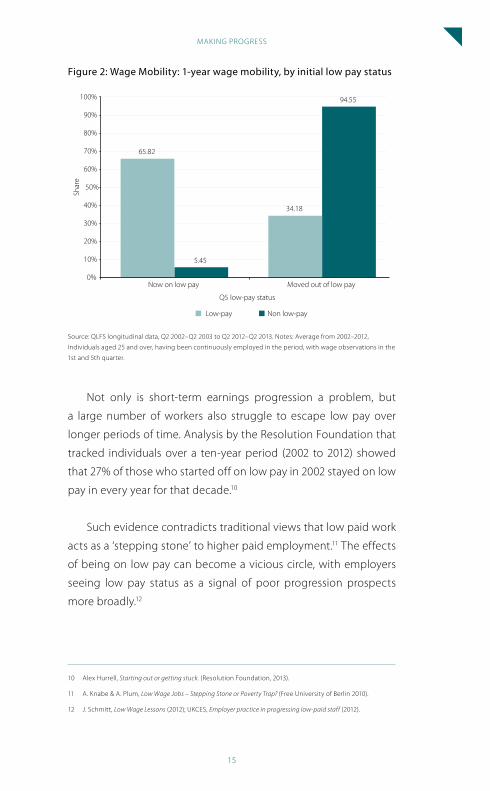
Figure 2: Wage Mobility: 1-year wage mobility, by initial low pay status
94.55
5.45
34.18
65.82
0%
10%
20%
30%
40%
50%
60%
70%
80%
90%
100%
Moved out of low pay Now on low pay
Q5 low-pay status
Shar
e
Non low-pay Low-pay
Source: QLFS longitudinal data, Q2 2002–Q2 2003 to Q2 2012–Q2 2013. Notes: Average from 2002–2012,
Individuals aged 25 and over, having been continuously employed in the period, with wage observations in the
1st and 5th quarter.
Not only is short-term earnings progression a problem, but
a large number of workers also struggle to escape low pay over
longer periods of time. Analysis by the Resolution Foundation that
tracked individuals over a ten-year period (2002 to 2012) showed
that 27% of those who started off on low pay in 2002 stayed on low
pay in every year for that decade.10
Such evidence contradicts traditional views that low paid work
acts as a ‘stepping stone’ to higher paid employment.11 The effects
of being on low pay can become a vicious circle, with employers
seeing low pay status as a signal of poor progression prospects
more broadly.12
10 Alex Hurrell, Starting out or getting stuck. (Resolution Foundation, 2013).
11 A. Knabe & A. Plum, Low Wage Jobs – Stepping Stone or Poverty Trap? (Free University of Berlin 2010).
12 J. Schmitt, Low Wage Lessons (2012); UKCES, Employer practice in progressing low-paid staff (2012).
SOCIAL MARKET FOUNDATION
16
4. THE PROBLEM OF LOW PAY: SOCIAL, ECONOMIC AND FISCAL
Having large numbers stuck in low pay is hugely problematic
economically, socially and fiscally.
A social problemIn-work poverty is now a major problem. Simply getting into work
does not ensure a sustainable route out of poverty because the
job may be insecure, the pay poor or opportunities for progression
limited.13 Two thirds of the 2.3 million children living in poverty
are from households in which at least one adult works.14 Second,
individuals from certain disadvantaged groups – including lone
parents, black and minority ethnic groups (including specific
sub-groups such as Bangladeshi men) and those without any
qualifications – are more likely than others to be in low paid work.
Lone parents are more likely (by a factor of almost two) to be stuck
in low pay than other groups.15
An economic problemHaving large numbers of workers stuck in low pay is also a symptom
of the UK’s poor record on productivity by international standards.
USA output per hour worked is 29% better than that of the UK; that
of Germany and France is 24% higher.16 The UK’s response to the
recession (with firms holding onto employees rather than making
them redundant) did not create this problem, but it exacerbated
it.17 Both the public and the private sector contribute to the UK’s
poor record.
13 Mike Brewer, Andy Dickerson, Lynn Gambin, Anne Green, Robert Joyce and Rob Wilson, Poverty and
inequality in 2020 impact of changes in the structure of employment (JRF, 2012).
14 JRF, “Poverty, economic status and skills: what are the links?”, 2013 www.jrf.org.uk ites/files/jrf/households-
skills-poverty-full.pdf
15 Tony Wilson, Laura Gardiner and Kris Krasnowski, Work in Progress: Low pay and progression in London and the
UK (Inclusion, 2013).
16 ONS, International Comparisons of Productivity – First Estimates, 2012 (2013).
17 Peter Patterson, The Productivity Conundrum, explanations and preliminary analysis (ONS, 2012).
MAKING PROGRESS
17
Alongside this, commentators have noted that the UK labour
market has been characterised by a decline in the proportion of
mid-skill level jobs; alongside growth in employment in occupations
with wages at the bottom and at the top of the distribution.18 With
a large number of low-skilled jobs, low incidence of training and a
hollowing-out economy, many economists argue that parts of the
UK economy are stuck in a low-skills/low-productivity equilibrium,
thus perpetuating a low-value-added economy. In this scenario,
instances where there is little differentiation between products or
services, firms compete primarily on cost and have little incentive
to up-skill low paid staff or to modernise their processes.
This all implies that boosting the productivity of UK workers and
firms is imperative, particularly for those trapped in less productive
jobs at the bottom end of the labour market.
A fiscal problemThe fiscal impact of low pay is such that the Government now
spends around £21 billion on tax credits for those in work, alongside
a large portion of the housing benefit bill.19 As well as acting as
a burden on the state, in-work subsidies also serve to suppress
wages. Businesses can get away with paying lower wages than
otherwise would be the case. By topping up incomes, the state
is correspondingly dampening the incentives for individuals to
progress in work and to invest in skills, because any gain in wages
is partially offset by a loss in state transfers. Lifting the productivity
and earnings of those trapped in low pay could lead to significant
reductions to the overall benefit bill.20
18 Paul Sissons, The Hourglass and the Escalator: Labour market change and mobility (Work Foundation, 2011).
19 Tax credit numbers taken from HMG, Expenditure Tables, Budget 2013; Housing Benefit number from,
Graeme Cooke, On the front foot: Designing a welfare cap that reforms social security (IPPR, 2013).
20 Tony Wilson, Laura Gardiner and Kris Krasnowski, Work in Progress: Low pay and progression in London and the
UK (Inclusion, 2013).
SOCIAL MARKET FOUNDATION
18
5. POLICY RESPONSES AND THIS RESEARCH PAPER
Given the scale of the problem, how should we respond?
Currently, there are three sets of responses being proposed by
the main parties to resolve the low wage problem. As will be seen,
on their own they do not address the fundamental productivity
problem and the lack of progression opportunities for those on
low pay.
1. Increasing the personal allowance and reducing the income
tax paid by low earners
Both parties in the Coalition have championed the extension
of the Government’s current policy to lift low earners out of
income tax. The personal allowance has been increased from
£6,475 in 2009–10 to £10,000 in 2014–15. The Budget increased
this further to £10,500 in 2015–16. However, such policies do
little to boost the productivity of those stuck in low pay.21
2. ‘Make Work Pay’
The Labour Party has proposed ‘Make Work Pay’ contracts.
Under this scheme, a Labour government would reward
employers that pay the Living Wage with 32 pence in tax
breaks for every pound they add to an employees’ wage (up to
the Living Wage).22 The Labour Party claims that this incentive
payment would be funded by the savings in benefits and
the increases in tax revenues that would result from such an
increase. It is unclear what appetite there will be from firms to
raise wage levels permanently in return for a one-off subsidy
(over the course of the Parliament, the value of the subsidy
would equate to one fifteenth of the increased wage bill).
Even where it does bite, without interventions to boost the
productivity of the workers, it is far from clear whether the
workforce will be more productive or just better paid.
21 Andrew Hood, Robert Joyce and David Phillips, ‘Policies to help the low paid’ in IFS, Green Budget 2014 (IFS, 2014).
22 Labour Party, Tackling the cost of living crisis with decent wages, helping business, cutting the cost of failure (2013).
MAKING PROGRESS
19
3. Welfare reform
The Coalition has made concerted attempts to increase
incentives to work by introducing more sticks and carrots into the
benefit system. Via its ‘in-work conditionality’ policy, recipients
of Universal Credit who earn less than the equivalent of 35
hours at the National Minimum Wage will risk losing part of their
benefit payment. Thus far however, there has been little sense
of how this will be delivered and there is as yet no significant
budget for up-skilling this population. Ironically, under Universal
Credit, the incentive is strongest for those entering work rather
than progressing in work. The taper rate for someone increasing
their earnings will actually be harsher than at present.
THE FOCUS OF THIS PAPER
This research explores the potential for acting first on productivity
by making a direct investment in the skills of those trapped in low
paid work. The chapter structure is as follows:
• Chapter 2 sets out the overall case for investment in the skills
of the low paid
• Chapter 3 sets out the case for government intervention in
skills policy
• Chapter 4 describes how the government could invest in the
skills of those stuck in low pay.

SOCIAL MARKET FOUNDATION
20
CHAPTER 2: THE CASE FOR INVESTING IN SKILLS
1. THE IMPORTANCE OF SKILLS
Skills play a fundamental part in the competitive global economy.
In order for an economy to grow, the skills of the workforce must
be improved so that they correspond to the changing needs of
employers.
The speed of technological change and the nature of global
competition have made skills ever more important. An employee
or workforce that fails to keep up with technological change risks
being made redundant by the same force. Meanwhile, better global
communication has meant that economic activity has become
far more dispersed. In the twenty-first century, many developing
countries with low labour costs can compete to provide low
value-added activities, thus encouraging developed countries to
compete on higher value products and services for which they
require higher levels of skill.
2. SKILLS GAPS
A large part of responding to the skills challenge is to improve
educational opportunities for children and young people. It is for
this reason that successive governments have prioritised spending
on schools, and why the current Government is investing heavily
in apprenticeships. Alongside this, however, there is a real need to
improve the skills and productivity of those in work: 80% of the UK’s
2020 workforce are already of working age.
General shortagesPersistent concerns have been registered about the skills of the UK’s
workforce and young people. At the end of the last decade, the
UKCES reported that the UK ranked 12th for higher level skills, but
MAKING PROGRESS
21
18th for intermediate level skills and 17th for lower level skills.23 More
recent data suggests that around a fifth of the adult population
lack basic literacy and numeracy skills.24
Surveys persistently reveal skills gaps across a range of
occupations and sectors. The latest UKCES Survey report notes ‘a
sharp rise in skills shortages which may be holding back the UK’s
economic recovery’.25 In England, the number of skill-shortages
vacancies (roles that are left vacant due to inability to attract a
candidate with the requisite skills) has nearly doubled since 2009,
increasing from 63,100 to 124,800. Meanwhile, 22% of all vacancies
were considered hard to fill because the skilled labour does not
exist in the UK, up from 16% in 2011. There appears to have been an
increased difficulty finding appropriate generic skills such as oral
and written communication, literacy and numeracy skills.26
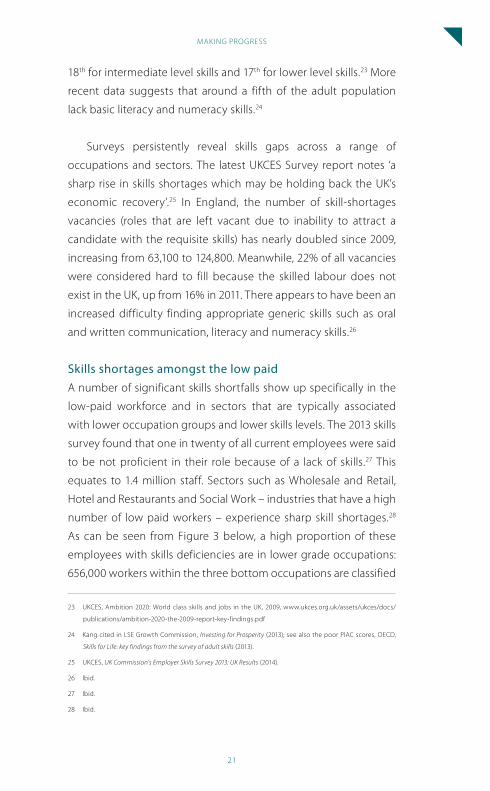
Skills shortages amongst the low paidA number of significant skills shortfalls show up specifically in the
low-paid workforce and in sectors that are typically associated
with lower occupation groups and lower skills levels. The 2013 skills
survey found that one in twenty of all current employees were said
to be not proficient in their role because of a lack of skills.27 This
equates to 1.4 million staff. Sectors such as Wholesale and Retail,
Hotel and Restaurants and Social Work – industries that have a high
number of low paid workers – experience sharp skill shortages.28
As can be seen from Figure 3 below, a high proportion of these
employees with skills deficiencies are in lower grade occupations:
656,000 workers within the three bottom occupations are classified
23 UKCES, Ambition 2020: World class skills and jobs in the UK, 2009, www.ukces.org.uk/assets/ukces/docs/
publications/ambition-2020-the-2009-report-key-findings.pdf
24 Kang cited in LSE Growth Commission, Investing for Prosperity (2013); see also the poor PIAC scores, OECD,
Skills for Life: key findings from the survey of adult skills (2013).
25 UKCES, UK Commission’s Employer Skills Survey 2013: UK Results (2014).
26 Ibid.
27 Ibid.
28 Ibid.
SOCIAL MARKET FOUNDATION
22
as not being trained sufficiently to fulfil their current role. While
such skills gaps are frequently attributed to transient factors (such
as new recruits or incomplete training), only 4% of all employers
reported that the problem was limited to these transient factors.29
Figure 3: Number of staff not fully proficient (as reported by employers)
0%
1%
2%
3%
4%
5%
6%
7%
8%
9%
0
50,000
100,000
150,000
200,000
250,000
300,000
Man
ager
s
Prof
essi
onal
s
Ass
ocia
tepr
ofes
sion
als
Adm
inis
trat
ive
and
cler
ical
Skill
ed tr
ades
Carin
g, le
isur
e an
dot
her s
ervi
ces
Sale
s an
dcu
stom
er
Mac
hine
oper
ativ
es
Elem
enta
ryoc
cupa
tions
Shar
e of
wor
kers
repo
rted
as
defic
ient
Num
ber o
f wor
kers
repo
rted
as
defic
ient
Number of staff not fully proficient
% of staff reportedas having skills gaps
Source: Data from Resolution Foundation, Low Pay Britain 2013, 2013.
This evidence suggests that, not only are there large parts of
the UK workforce without basic skills, but in a significant minority
of cases employers are reporting that this is impeding productivity.
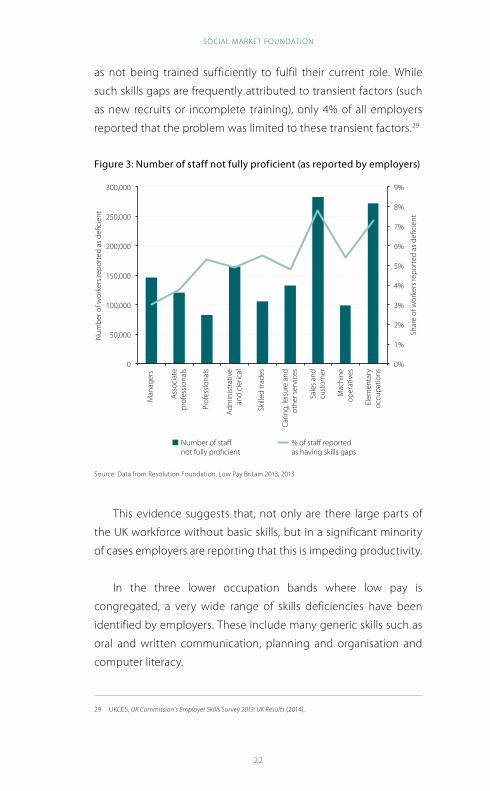
In the three lower occupation bands where low pay is
congregated, a very wide range of skills deficiencies have been
identified by employers. These include many generic skills such as
oral and written communication, planning and organisation and
computer literacy.
29 UKCES, UK Commission’s Employer Skills Survey 2013: UK Results (2014).
MAKING PROGRESS
23
Figure 4: Skills lacking among staff with skills gaps followed up by
occupation
Man
ager
s
Prof
essi
onal
s
Ass
ocia
te
Prof
essi
onal
s
Adm
inis
trat
ives
an
d Cl
eric
al
Skill
ed T
rade
s
Carin
g, L
eisu
re a
nd
Oth
er se
rvic
es
Sale
s an
d Cu
stom
er S
ervi
ce
Mac
hine
O
pera
tives
Elem
enta
ry
occu
patio
ns
%
Base 3673 1568 1369 3909 3032 2340 4840 1488 4630
Technical, practical or job specific
37 59 55 66 68 56 56 68 58
Planning and organisation
70 61 55 67 51 62 55 42 51
Team working 56 46 44 53 40 64 52 53 60
Customer handling 34 36 35 57 34 54 71 23 58
Problem solving 52 45 40 53 47 51 49 52 47
Oral communication
45 40 35 45 35 50 51 48 54
Written communication
32 35 33 48 30 58 25 39 34
Basic computer literacy / using IT
21 18 17 38 18 41 23 35 23
Strategic Management
65 42 29 20 21 15 20 12 16
Literacy 13 16 16 27 23 48 18 39 24
Advanced IT or software
33 33 26 44 17 24 16 15 11
Numeracy 13 14 11 28 19 36 23 31 22
Foreign Language 8 11 7 7 9 21 12 13 16
Source: Table from The UK Commission’s Employer Skills Survey 2013: UK Results, p. 132.30
Note: Base: All establishments with skills gaps in each occupation – up to two occupations followed up.
Percentages are based on all skills gaps, rather than all establishments with skills gaps; proportions therefore
show the percentage of skills gaps attributed to each cause.
When concerns about low skills levels in the UK are combined with
employer concerns about skills deficiencies, the case for investing in
skills is strong.
30 UKCES, UK Commission’s Employer Skills Survey 2013: UK Results (2014).
SOCIAL MARKET FOUNDATION
24
3. PROSPECTS FOR PROGRESSION: INFLUENCING EMPLOYER DEMAND FOR SKILLS
Notwithstanding these very significant skills shortages, policymakers
should not seek to over-simplify the challenge. Alongside boosting
skills, employers will need to provide information, advice and
guidance to employees, give consideration to job design and
progression opportunities and identify those for whom training will
have the greatest effect. First, wage progression for those on lower
pay varies markedly across different sectors. As Appendix 7 shows,
workers starting out in the bottom quintile of the wage distribution
in the distribution, hotels and restaurants sector – a sector containing
many low paid workers – were least likely to have moved up the wage
distribution.31 In contrast, workers in construction, transport and
communication are more likely to progress within a year.
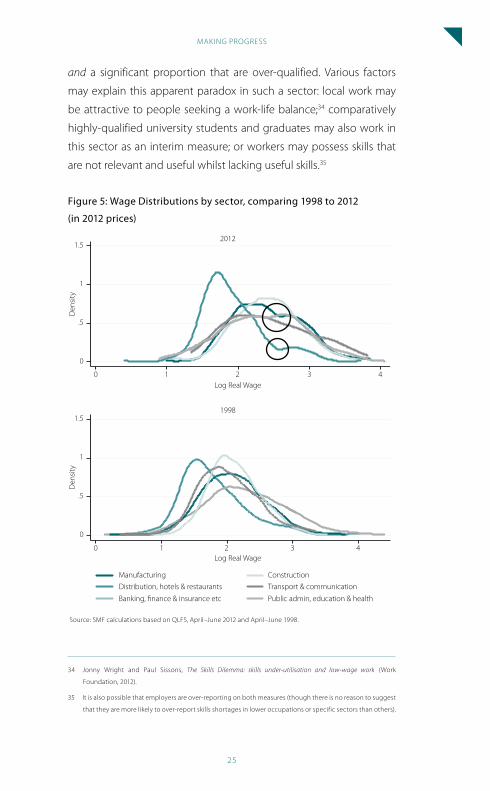
In addition, evidence suggests that opportunities for progression
have changed by sector over time. Figure 5 shows the distribution of
real wages by sector in 1998 and 2012.32 For all sectors, real wages are
now higher at every point in the distribution than they were in 1998.
More importantly, in 1998 the distribution, hotels and restaurants
sector had a single peak at the lower end of the spectrum; by 2012
it also displayed a significant dip in the middle. A dip can also be
observed for manufacturing, where the 2012 wage distribution
indicated a hollowing out effect.
Finally, alongside significant skills shortages among the low paid
workforce, there are also some whose skills are reported by their
employers as under-utilised, equating to 4.3 million workers.33 The
data implies that in some sectors (such as hotels and restaurants) there
are large proportions of the workforce without the necessary skills
31 This appears to reinforce research that found that employees who remain in manufacturing, wholesale and
retail and accommodation and food services industry jobs are less likely to escape low pay.
32 These wages are displayed in log form.
33 UKCES, UK Commission’s Employer Skills Survey 2013: UK Results (2014).
MAKING PROGRESS
25
and a significant proportion that are over-qualified. Various factors
may explain this apparent paradox in such a sector: local work may
be attractive to people seeking a work-life balance;34 comparatively
highly-qualified university students and graduates may also work in
this sector as an interim measure; or workers may possess skills that
are not relevant and useful whilst lacking useful skills.35
Figure 5: Wage Distributions by sector, comparing 1998 to 2012
(in 2012 prices)
0
.5
1
1.5
Den
sity
0
.5
1
1.5
Den
sity
0 1 2 3 4
0 1 2 3 4
Log Real Wage
Log Real Wage
Manufacturing Construction
Distribution, hotels & restaurants Transport & communication
Banking, finance & insurance etc Public admin, education & health
2012
1998
Source: SMF calculations based on QLFS, April–June 2012 and April–June 1998.
34 Jonny Wright and Paul Sissons, The Skills Dilemma: skills under-utilisation and low-wage work (Work
Foundation, 2012).
35 It is also possible that employers are over-reporting on both measures (though there is no reason to suggest
that they are more likely to over-report skills shortages in lower occupations or specific sectors than others).
SOCIAL MARKET FOUNDATION
26
More generally, low wage workers face particular problems in
terms of progression because they typically have fewer development
and progression opportunities, less intense human resource oversight
and support; and higher staff turnover.36 Part of this appears to stem
from perceptions: research suggests that employers and employees
in low-skilled jobs tend not to view low-skilled roles as a foundation
for progression.37 A Chartered Institute of Personnel and Development
(CIPD) survey found that fewer than half of employers have a strategy
to support the development of low-skilled workers. 38
Together low skills levels and, in some places, low demand from
employers for higher skills, are symptoms of what economists term a
‘low-skills equilibrium’. In this scenario, low supply of skills coincides
with low demand for skills. Businesses operate with low skills and
relatively low wages, compete predominantly on price rather than
quality and will not drive demand for higher level skills.39 However,
while an employer cannot simply transform an entry-level job into
a skilled job overnight, they can alter their working practices so that
more of their employees use skills to perform their jobs.40 Research
by the UKCES has also identified seven enablers displayed by firms
that successfully progress those in low pay: committed leadership
and management, a culture of progression, human resource
development dedicated to training, employee understanding, peer
support mechanisms and organisational scale.41
Therefore, as well as supplying the skills that employers need,
there is also a case to encourage firms and sectors to offer progression
opportunities to employees. This may be done through new job
36 UKCES, Engaging low skilled employees in workplace learning, 2012, www.ukces.org.uk/assets/ukces/docs/
publications/evidence-report-43-engaging-low-skilled-employees-in-workplace-learning.pdf
37 UKCES, Employer practice in progressing low-paid staff (2012).
38 Ibid.
39 Anne Green, Skills for Competitiveness: Country Report for the United Kingdom (OECD, 2012).
40 City and Guild, Where now for the unskilled and the low paid (2009) www.skillsdevelopment.org/pdf/2%20
%20Where%20Now%20for%20the%20Unskilled%20and%20the%20Low%20Paid%20V1%200.pdf
41 UKCES, Employer practice in progressing low-paid staff (2012).
MAKING PROGRESS
27
design, information, advice and guidance or adopting new business
processes; all of which can complement effective skills training.
4. THE CASE FOR UP-SKILLING THE LOW PAID
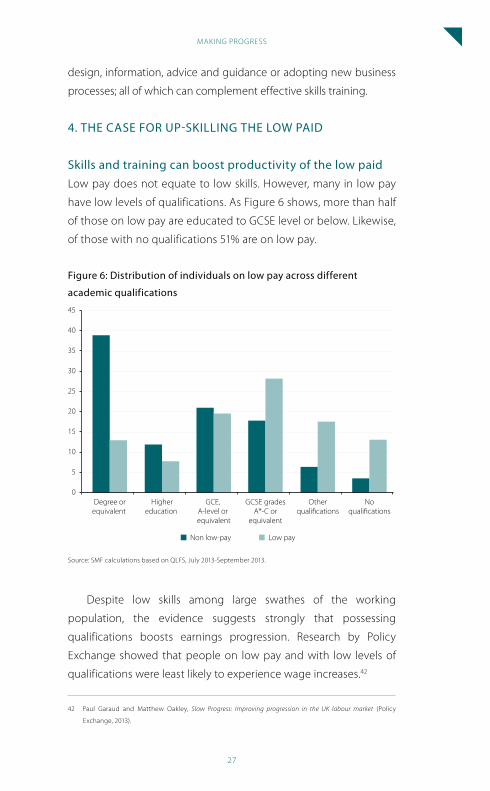
Skills and training can boost productivity of the low paidLow pay does not equate to low skills. However, many in low pay
have low levels of qualifications. As Figure 6 shows, more than half
of those on low pay are educated to GCSE level or below. Likewise,
of those with no qualifications 51% are on low pay.
Figure 6: Distribution of individuals on low pay across different
academic qualifications
0
5
10
15
20
25
30
35
40
45
Degree orequivalent
Highereducation
GCE, A-level or equivalent
GCSE gradesA*-C or
equivalent
Otherqualifications
Noqualifications
Non low-pay Low pay
Source: SMF calculations based on QLFS, July 2013-September 2013.
Despite low skills among large swathes of the working
population, the evidence suggests strongly that possessing
qualifications boosts earnings progression. Research by Policy
Exchange showed that people on low pay and with low levels of
qualifications were least likely to experience wage increases.42
42 Paul Garaud and Matthew Oakley, Slow Progress: Improving progression in the UK labour market (Policy
Exchange, 2013).
SOCIAL MARKET FOUNDATION
28
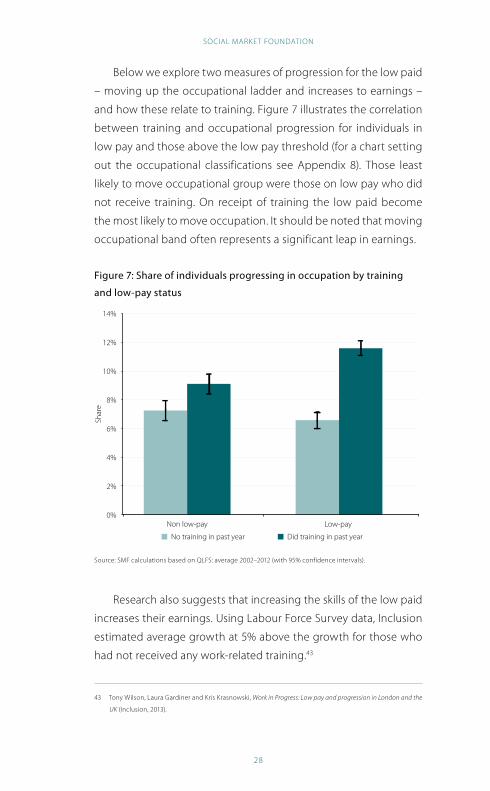
Below we explore two measures of progression for the low paid
– moving up the occupational ladder and increases to earnings –
and how these relate to training. Figure 7 illustrates the correlation
between training and occupational progression for individuals in
low pay and those above the low pay threshold (for a chart setting
out the occupational classifications see Appendix 8). Those least
likely to move occupational group were those on low pay who did
not receive training. On receipt of training the low paid become
the most likely to move occupation. It should be noted that moving
occupational band often represents a significant leap in earnings.
Figure 7: Share of individuals progressing in occupation by training
and low-pay status
Did training in past year No training in past year
0%
2%
4%
6%
8%
10%
12%
14%
Non low-pay Low-pay
Share of indiviudals progressing in occupation only individuals continuously in employment over past year only individuals continuously in employment over past year
Shar
e
Source: SMF calculations based on QLFS: average 2002–2012 (with 95% confidence intervals).
Research also suggests that increasing the skills of the low paid
increases their earnings. Using Labour Force Survey data, Inclusion
estimated average growth at 5% above the growth for those who
had not received any work-related training.43
43 Tony Wilson, Laura Gardiner and Kris Krasnowski, Work in Progress: Low pay and progression in London and the
UK (Inclusion, 2013).
MAKING PROGRESS
29
Estimating the premium from skillsExisting studies indicate that skills qualifications have a strong
effect on the earnings of an individual. Below we seek to identify
what seems to be a reasonable estimate of the average effect.
44 45Variation in earnings premiums across skill courses
A defensible case could be made to use the best in class as an
indication of what earnings premiums could be delivered by an
optimum skills system. For instance, estimates from the Department
for Business, Innovation and Skill indicate that while an RSA Level
2 derives a 17% premium, an NVQ at the same level derives a
premium of -2% (i.e. it would have been better not to have done
the qualification).44 Given that the past system has condoned poor
and mediocre outcomes, a better-designed system could drive
performance to the top. Specific government actions explain in part
the low yield from some qualifications. A massive and rapid state
investment in Level 2 qualifications under Train to Gain resulted in
inappropriate qualifications being taken that had little currency in
the wider job market, reductions in teaching quality (for example
through large classrooms) and a market flooded with similarly
qualified individuals. Analyses of the programme have concluded
that they ‘had little impact on employers’ decision to train and often
subsidised existing low-level training by firms.’ 45
Due to data availability and methodological differences,
estimates vary. An extensive study from the Department for
Business, Innovation and Skills (BIS) calculated premiums derived
from vocational education qualifications at between 3% and
20%.46 Premiums from apprenticeships are even higher. However,
these figures differ markedly from the outcomes of a DWP study
into general workplace training. Using data that tracked individuals
over a longer period of time, this study was able to control for
44 BIS, Returns to Intermediate and Low Level Vocational qualifications (2011).
45 Tess Lanning and Kayte Lawton, No train, no gain: Beyond free market and state led skills policy (2012).
www.ifs.org.uk/budgets/gb2006/06chap8.pdf
46 BIS, Returns to Intermediate and Low Level Vocational qualifications (2011).
SOCIAL MARKET FOUNDATION
30
specific background characteristics such as gender, occupation
and motivation. It estimated the wage premium of recipients of
employer-funded training at 2%. It is likely that a major explanatory
factor is that workplace training includes a wide range of activities,
some much less intense and of lower productivity value than formal
courses and qualifications. As the DWP report noted, ‘the return to
some forms of training may be quite low (e.g. as part of induction,
or to refresh).’ 47
The existing evidence, therefore, suggests an upper bound
of 20% (the best in class for any vocational training) and a lower
estimate of 2%. Here we use two working estimates: a central
estimate of 10% and a lower estimate of 5%.
The evidence we draw on uses the average premium
comparing a group with a specific qualification against a group
without the specific qualification. The premiums are drawn from
the 2011 BIS study Returns to Intermediate and Low Level Vocational
qualifications.48 These premiums use Quarterly Labour Force Survey
(QLFS) data and do not control for factors such as individual
motivation. However, academic assessments that have compared
longitudinal studies to those using the QLFS indicate that the latter
provides a reasonable estimate of the premium from training.
For more detail, see Appendix 2. It should be noted that these
estimates include what have been widely acknowledged as poor-
value government-initiated training and qualifications which have
suppressed the earnings premiums. Overall the following earnings
premiums for different levels of qualifications have been estimated:
47 Tess Lanning and Kayte Lawton, No train, no gain: Beyond free-market and state-led skills policy (2012).
48 The effects displayed in this study are the same order of magnitude to that of the 2007 BIS study.
MAKING PROGRESS
31
• The average earnings premium for those with a Level 3
qualification compared to those with a Level 2 qualification
is 9.6%.
• The average earnings premium for those with a Level 2
qualification compared to those with a Level 1 qualification
is 7.9%.49
• The average earnings premium for those with a Level 1
qualification compared to those with a no qualification
is 9.7%.50
Based on the above evidence, our central assumption is a skill
premium of 10% across Levels 1, 2 and 3.
A further factor that may affect the wage premium is the age
of acquisition. Analysis of this question often suffers from small
sample sizes and the evidence here is mixed. One well-respected
study found that there was ‘little significant variation’ by age of
acquisition for City and Guilds qualifications, but a ‘substantial
wage penalty’ for later acquisition of NVQ2.51 Much of the evidence
suffers from significant volatility. Our best estimate draws on BIS
analysis of Level 2 and Level 3 qualifications; the average gain for
those aged 26 and above is approximately 5%.52
49 Note, this average would be much higher were the NVQ2 to be stripped out.
50 Note, this average would be much higher were the NVQ1 to be stripped out.
51 Charley Greenwood, Andrew Jenkins and Anna Vignoles, The returns to qualifications in England: updating the
evidence base on Level 2 and Level 3 Vocational Qualifications (Centre for the Economics of Education, 2007).
52 Note, we do not include the figures for Level 1 here by age of acquisition. BIS’s report argued that their results
for Level 1 needed to be treated with caution due to significant and unexplained volatility. In addition, they
only report results for City and Guilds and NVQ (not BTEC), nor reference, the earnings premium comes out
slightly lower at 3.5% for Level 1.

SOCIAL MARKET FOUNDATION
32
CHAPTER 3: THE CASE FOR GOVERNMENT ACTION ON SKILLS
The evidence above indicates that the UK requires an injection of
skills. In fact, the percentage of workers engaging in more than 10
days training per year fell from 38% to 34% between 2006 and 2012,
while average training hours fell by a third.53
In superficial terms, the case for state intervention should
be weak. Given that useful training will result in both a more
productive worker and firm, this should translate into higher wages
to the individual and better productivity for the business. Under this
pure market scenario, workers would spy better employment and
wage prospects and invest in the best skills course to allow them
to achieve it. However, as Chapter 2 showed, the market does not
function perfectly in this way.
Individuals, for their part, have imperfect knowledge of what
employment opportunities are out there, and limited understanding
of what training to undertake in order to reach the opportunities
that they can identify. Even when they spy the right prospect,
individuals may struggle to finance the investment – a barrier that
the 24+ Loan seeks to resolve.54 Other constraints such as time also
impinge to suppress investment in skills.
Although employers spend significant sums on skills, theory
and evidence both suggest that they may not invest as much as
is desirable from a societal perspective. Primarily this is because
human capital is a mobile rather than a fixed asset and, therefore,
a skilled individual is free to move to another firm. From a societal
perspective this externality is beneficial; at a firm level it is
disadvantageous. While employers may be happy to invest in firm-
53 John Philpott, Rewarding work for low-paid workers (Forthcoming JRF, 2014).
54 It should be noted the Apprenticeships have been removed from the loans scheme and are likely to be
funded directly by government and employers.
MAKING PROGRESS
33
specific skills where productivity gains are likely to be felt by the firm
in question, there is a weaker business case for investing in generic
transferrable skills. Empirical evidence bears this out: firms have
been shown to be less likely to invest in generic skills when potential
poachers are near (for instance, when competitors are clustered in
close proximity) and when employees are tied more loosely to the
firm (for instance, when the employee is on a temporary contract).55
1. THE LOW PAID: LOW LEVELS OF TRAINING AND WHY
Training not reaching the low paidComparatively little training and support reaches the low paid.
Low-skilled people and those with fewer qualifications are less likely
to participate in workplace learning than colleagues with better
qualifications.56 A lower proportion of those with lower skills are also
given time off for training.57 This may partly be explained by the
shortage of generic skills in this group, which employers are typically
more reluctant to fund themselves. However, the lack of training for
this group suggests that it may go beyond this. Our analysis of the
Labour Force Survey reveals that a far lower proportion of those on
low pay undertake training compared to better-paid workers (see
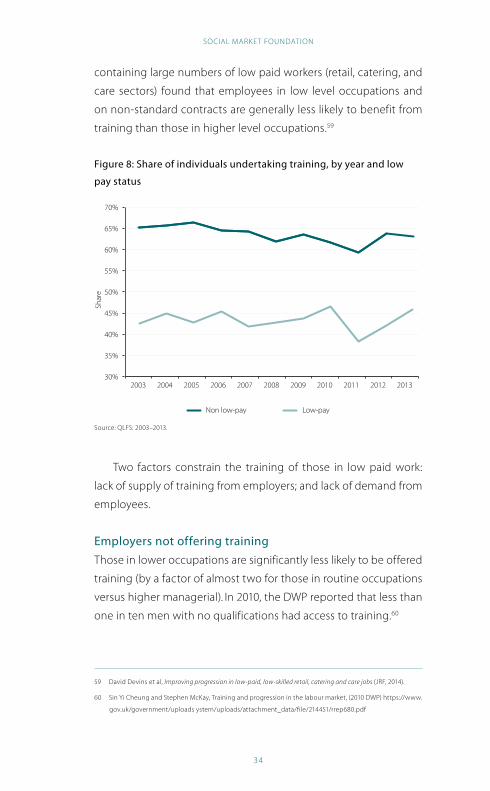
Figure 8). While about 65% of those not on low pay received some
training over the course of a year; this figure was only about 42% on
average over the past decade for individuals on low pay.
Survey data from 2007 suggests that those reporting themselves
qualified to (N/SVQ) Level 4 or equivalent were more than one
and a half times more likely to be receiving job-related training
than lower qualified individuals.58 A study looking at three sectors
55 SMF, Britain’s got talent (2012).
56 Steve Johnson et al, Employee Demand for Skills Development: a Research and Policy Review – Evidence Report 3
(UKCES, 2009).
57 City and Guild, Where now for the unskilled and low paid? 2009 www.skillsdevelopment.org/pdf/2%20%20
Where%20Now%20for%20the%20Unskilled%20and%20the%20Low%20Paid%20V1%200.pdf
58 UKCES, Employee demand for skills: A review of evidence and policy, 2009 http://webarchive.
nationalarchives.gov.uk/+/www.ukces.org.uk/upload/pdf/Evidence_Report_3_3.pdf
SOCIAL MARKET FOUNDATION
34
containing large numbers of low paid workers (retail, catering, and
care sectors) found that employees in low level occupations and
on non-standard contracts are generally less likely to benefit from
training than those in higher level occupations.59
Figure 8: Share of individuals undertaking training, by year and low
pay status
30%
35%
40%
45%
50%
55%
60%
65%
70%
2003 2004 2005 2006 2007 2008 2009 2010 2011 2012 2013
Shar
e
Non low-pay Low-pay
Source: QLFS: 2003–2013.
Two factors constrain the training of those in low paid work:
lack of supply of training from employers; and lack of demand from
employees.
Employers not offering trainingThose in lower occupations are significantly less likely to be offered
training (by a factor of almost two for those in routine occupations
versus higher managerial). In 2010, the DWP reported that less than
one in ten men with no qualifications had access to training.60
59 David Devins et al, Improving progression in low-paid, low-skilled retail, catering and care jobs (JRF, 2014).
60 Sin Yi Cheung and Stephen McKay, Training and progression in the labour market, (2010 DWP) https://www.
gov.uk/government/uploads ystem/uploads/attachment_data/file/214451/rrep680.pdf
MAKING PROGRESS
35
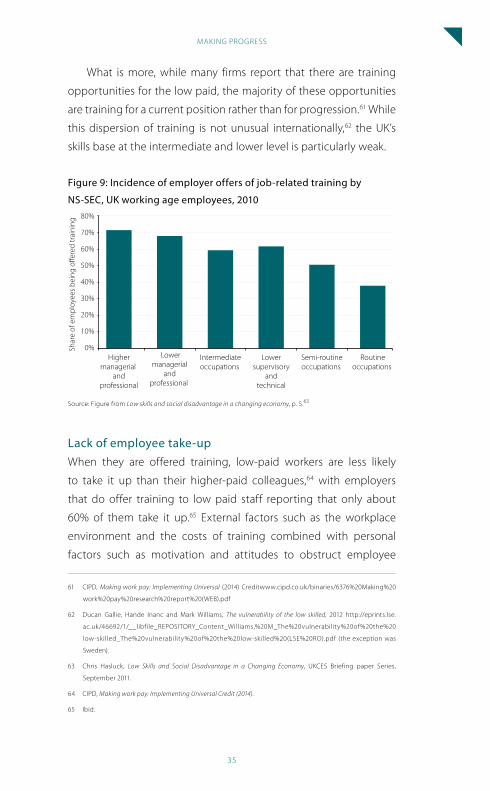
What is more, while many firms report that there are training
opportunities for the low paid, the majority of these opportunities
are training for a current position rather than for progression.61 While
this dispersion of training is not unusual internationally,62 the UK’s
skills base at the intermediate and lower level is particularly weak.
Figure 9: Incidence of employer offers of job-related training by
NS-SEC, UK working age employees, 2010
0%
10%
20%
30%
40%
50%
60%
70%
80%
Highermanagerial
andprofessional
Lowermanagerial
andprofessional
Intermediateoccupations
Lowersupervisory
andtechnical
Semi-routineoccupations
Routineoccupations
Shar
e of
em
ploy
ees
bein
g off
ered
trai
ning
Source: Figure from Low skills and social disadvantage in a changing economy, p. 5.63
Lack of employee take-upWhen they are offered training, low-paid workers are less likely
to take it up than their higher-paid colleagues,64 with employers
that do offer training to low paid staff reporting that only about
60% of them take it up.65 External factors such as the workplace
environment and the costs of training combined with personal
factors such as motivation and attitudes to obstruct employee
61 CIPD, Making work pay: Implementing Universal (2014) Creditwww.cipd.co.uk/binaries/6376%20Making%20
work%20pay%20research%20report%20(WEB).pdf
62 Ducan Gallie, Hande Inanc and Mark Williams, The vulnerability of the low skilled, 2012 http://eprints.lse.
ac.uk/46692/1/__libfile_REPOSITORY_Content_Williams,%20M_The%20vulnerability%20of%20the%20
low-skilled_The%20vulnerability%20of%20the%20low-skilled%20(LSE%20RO).pdf (the exception was
Sweden).
63 Chris Hasluck, Low Skills and Social Disadvantage in a Changing Economy, UKCES Briefing paper Series,
September 2011.
64 CIPD, Making work pay: Implementing Universal Credit (2014).
65 Ibid.
SOCIAL MARKET FOUNDATION
36
engagement in workplace learning, with the former being more
important than the latter.66
In a survey carried out for the UKCES, cost was the barrier cited
by employees most frequently. This survey – of three sectors with
high prevalence of low paid work – found that 54% cited cash fees
for training as a reason why they would be unable or unwilling
to undertake work related training.67 Other factors that depress
demand include time constraints (a quarter of respondents), family
commitments (e.g. childcare responsibilities), ill health, a lack of
suitable courses, limited information, insufficient information,
advice and guidance, a lack of peer support, and, personal
circumstances.
These rational considerations are often compounded by
behavioural factors that may dissuade people, most especially the
low paid, from investing in skills. Evidence suggests that those on
low skills may find it difficult to identify progression opportunities
and may view ‘lower level jobs’ as fragmented and disconnected
rather than related steps on a progression path.68 Workers can
therefore feel trapped in ‘dead-end’ jobs. Past experiences of
learning – such as poor educational attainment, poor non-
cognitive skills and disaffection with formal education – may affect
perceptions of skills and qualifications.69
Skills policy in the UKSuccessive governments have recognised the UK skills problem and
sought methods of redress. There is significant investment taking
place in apprenticeships, with the Government funding either the
66 Steve Johnson et al, Employee Demand for Skills Development: a Research and Policy Review – Evidence Report 3
(UKCES, 2009).
67 Professor Ronald McQuaid, Professor Robert Raeside, Dr Jesus Canduela, Dr Valerie Egdell and Colin Lindsay,
Engaging low skilled employees in workplace learning, 2012. http://www.ukces.org.uk/assets/ukces/docs/
publications/evidence-report-43-engaging-low-skilled-employees-in-workplace-learning.pdf
68 UKCES, Employer practice in progressing low-paid staff.
69 SMF, Britain’s got talent (2012).

MAKING PROGRESS
37
entire cost of the apprenticeship or up to 50% for those over-24.
In 2011–12, there were 510,000 apprenticeship starts, 231,000 more
than in the 2009/10 academic year.70 The Coalition Government is
currently consulting on further reforms to apprenticeships policy.
However, the Government has stopped providing grant funding
for many vocational education courses and is instead asking individuals
to fund classroom-based training. There is an expectation that much
workplace training should be funded by the employer. Those in work
and aged over 24 have to contribute to the funding of their course,
either by getting employer contributions or by making contributions
themselves (which can be financed by a loan) if they wish to pursue a
course above Level 2 (or re-train at Level 2). This is in sharp contrast to
those that are out of work who are eligible for funding.
The income-contingent loan model for higher education is
now being replicated in further education for learners over the
age of 24 in an attempt to resolve the financing constraints faced
by individuals. This was introduced in September 2013, although
loans for apprenticeships have subsequently been scrapped due
to concerns over take-up.71 BIS estimates that it will result in a 20%
reduction in take up of courses.72
Such reforms mean that access to the adult skills budget
is heavily constrained. On the positive side, the Government is
continuing to fully fund English and maths for those with an
‘identified need’ up to and including GCSE. Otherwise, full funding
for skills for those aged over the age of 24 is only available for the
unemployed and those claiming benefits.73 Those undertaking level
3 or 4 qualifications now have to source the funding themselves;
70 House of Commons Library, Apprenticeship statistics (10 February 2014).
71 New Economy Manchester, Advanced Learning Loans (24+) Assessing the Impact on Greater Manchester
Learning Providers: Evidence Base Report (December 2013).
72 Ibid.
73 Skills Funding Agency (2013) Funding Rules 2013/14 Version 2.1.
SOCIAL MARKET FOUNDATION
38
this is the same for those who wish to retrain at Level 2.74 This is
hugely problematic especially given that a large number of those
on low pay have Level 2 qualifications. Individuals or employers are
also expected to co-invest in any retraining at Level 2.
2. FISCAL GAINS FROM EARNINGS PROGRESSION
There is another reason why the Government should consider making
wider skills investments in the low paid: namely, reduced Treasury
expenditure on household benefits and increased tax revenues.
However, given the tight fiscal climate, additional expenditure that
has no payback or a payback that is longer than the course of a
parliament is likely to be unattractive to any government.
Below, we show that skills can drive significant gains not only to
the household concerned but also to the public purse. This analysis
assumes an earnings premium of 10% (see Chapter 2) derived from
a qualification, although we also give estimates were the earnings
premium is lower at 5%.75
Exchequer gains: the overall scaleSeparate calculations by the Labour Party and the IFS estimate
that the average savings rate to the Exchequer for households on
low pay – combining increased revenue from income tax, National
Insurance Contributions and reduced expenditure on tax credits
and benefits – is 50%. In other words, for each £1 extra earned by an
individual, the Exchequer saves 50p. This grows to approximately
60p once the individuals spend their additional wages because the
Government would gain further revenue from VAT.76
74 BIS and Skills Funding Agency, Skills Funding Statement 2013–16 (BIS, 2014). For large employers with over
1,000 employees there is a 25% reduction in funding for those 19 and over.
75 Additionally, there is evidence that individuals who have higher skills are also more likely to experience
higher wage growth in the future, which would mean a lasting positive effect rather than a one-off effect.
76 The IFS estimate it at 51%; the Labour Party at 49%. These calculations refer to the average savings to
the Exchequer for those earning below the Living Wage. Andrew Hood, Robert Joyce and David Phillips,
‘Policies to help the low paid’ in IFS, Green Budget 2014 (IFS, 2014).
MAKING PROGRESS
39
When the wages of low earners increase, the Exchequer can
gain in the following ways:
• Income tax paid by the household.
• National Insurance contributions paid by the employee.
• National Insurance contributions paid by the employer.
• Tax credits surrendered by the household.
• Housing benefit payments surrendered by the household.
• Additional receipts from VAT (sales tax) attributed to the
additional expenditure of the household.
In addition to these gains set out above, expenditure on
Council Tax Reduction would fall. Our calculations below exclude
this factor because the gains accrue not to the Treasury but to local
authorities. However, this may act as an additional spur for local
authorities to engage proactively with this agenda.
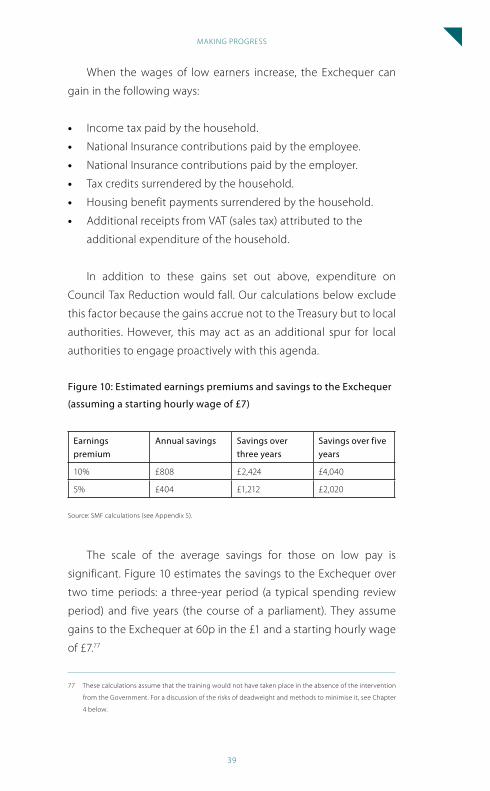
Figure 10: Estimated earnings premiums and savings to the Exchequer
(assuming a starting hourly wage of £7)
Earnings premium
Annual savings Savings over three years
Savings over five years
10% £808 £2,424 £4,040
5% £404 £1,212 £2,020
Source: SMF calculations (see Appendix 5).
The scale of the average savings for those on low pay is
significant. Figure 10 estimates the savings to the Exchequer over
two time periods: a three-year period (a typical spending review
period) and five years (the course of a parliament). They assume
gains to the Exchequer at 60p in the £1 and a starting hourly wage
of £7.77
77 These calculations assume that the training would not have taken place in the absence of the intervention
from the Government. For a discussion of the risks of deadweight and methods to minimise it, see Chapter
4 below.

SOCIAL MARKET FOUNDATION
40
As can be seen, a 10% premium would mean the Government
could invest between £2,424 and £4,040 in a training and
progression policy. If the premium were lower at 5%, the figures
would still be £2,020 for a five-year payback. Meanwhile, an upper
bound estimate of 15.6% (the average uplift of the best course
currently available at each qualification Level) would derive £1,260
per year. This is put in context by the box below, setting out the
costs of a range of courses.78
Cost of courses
The costs of vocational education training and qualifications vary
significantly. It should be noted that the average costs to the employer
of all costs associated with training at Level 2 (i.e. not just the training
costs but also the wages of apprentices and trainees, the costs of
training materials and courses, the costs of supervision whilst learning
on-the-job, the costs of organising training) are: £1,650 (retailing),
£1,950 (hospitality), £2,500 (Transport and logistics) and £1,250 (social
care).78 However, there is no suggestion that the Government should
pay for the wage costs of trainees, thus suggesting that the direct
costs of training would be significantly lower.
Variation in Exchequer savingsAlthough these average gains to the Treasury are strong, the
variation of these savings also matters in answering two questions:
is the minimum saving to the Exchequer sufficient to motivate
action in all cases? Might the distribution of the savings encourage
the government to target the policy on particular groups?
Below, the analysis simulates the savings to the Exchequer under
a central wage scenario for a set of eight specimen household types.
In these calculations we vary the make-up of the household as well
as the location in which they live (because of significant variation
78 BIS, Employer Investment in Apprenticeships and Workplace Learning: The Fifth Net Benefits of Training to
Employers Study (2012).
MAKING PROGRESS
41
in, for example, housing costs and housing benefit payments).
These calculations were carried out by Ferret Information Systems
using its Future Benefits Model. The methodology and the exact
composition of the households is described in Appendix 4.
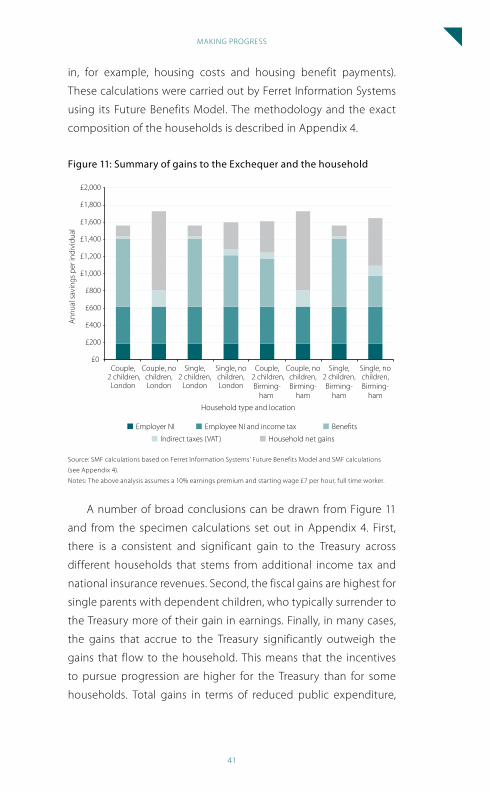
Figure 11: Summary of gains to the Exchequer and the household
£0
£200
£400
£600
£800
£1,000
£1,200
£1,400
£1,600
£1,800
£2,000
Couple, 2 children,
London
Couple, nochildren,London
Single,2 children,
London
Single, nochildren,London
Couple, 2 children,
Birming-ham
Couple, nochildren,Birming-
ham
Single,2 children,Birming-
ham
Single, nochildren,Birming-
ham
Ann
ual s
avin
gs p
er in
divi
dual
Household type and location
Employer NI Employee NI and income tax Benefits
Indirect taxes (VAT) Household net gains
Source: SMF calculations based on Ferret Information Systems’ Future Benefits Model and SMF calculations
(see Appendix 4).
Notes: The above analysis assumes a 10% earnings premium and starting wage £7 per hour, full time worker.
A number of broad conclusions can be drawn from Figure 11
and from the specimen calculations set out in Appendix 4. First,
there is a consistent and significant gain to the Treasury across
different households that stems from additional income tax and
national insurance revenues. Second, the fiscal gains are highest for
single parents with dependent children, who typically surrender to
the Treasury more of their gain in earnings. Finally, in many cases,
the gains that accrue to the Treasury significantly outweigh the
gains that flow to the household. This means that the incentives
to pursue progression are higher for the Treasury than for some
households. Total gains in terms of reduced public expenditure,

SOCIAL MARKET FOUNDATION
42
increased tax receipts and increased disposable income are in
the region of £1600 annually across the different household types
analysed here.
ConclusionsThis chapter has shown that there is a strong case for government
intervention to help up-skill those stuck in low paid work. The
evidence suggests that training leads to an increase in earnings
and that this, in turn, can generate considerable gains to the public
purse. In the following chapter, the report sets out how these
savings to the Treasury can be used to invest upfront in the skills
of the low paid.
MAKING PROGRESS
43
CHAPTER 4: THE ‘SKILLS FOR PROGRESS’ SCHEME FOR THE LOW PAID
The previous chapters set out why there is a strong case for up-
skilling those stuck in low paid work. They have also indicated that
significant gains to the Treasury accrue as an individual’s earnings
increase as a result of training. This chapter sets out how a policy
could be designed to boost the skills and progression opportunities
of those stuck in low pay.
This chapter sets out:
1. An introductory outline to the scheme
2. The rationale for the design of the policy
3. A description of the mechanics of the scheme
4. Piloting and further considerations
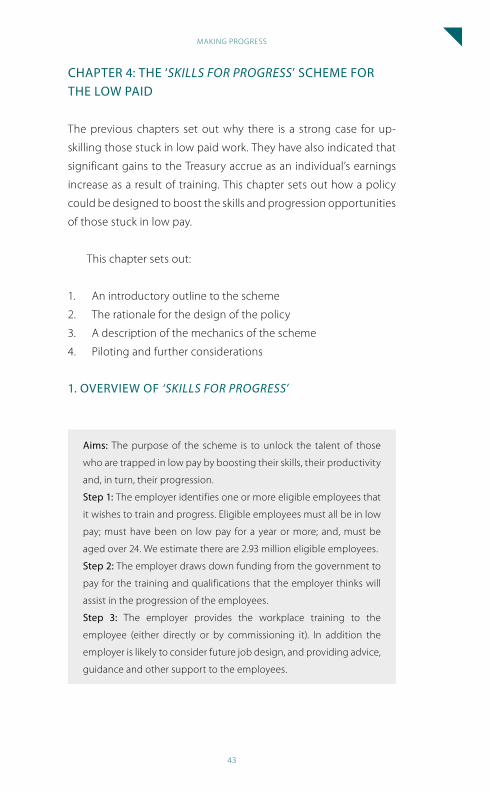
1. OVERVIEW OF ‘SKILLS FOR PROGRESS’
Aims: The purpose of the scheme is to unlock the talent of those
who are trapped in low pay by boosting their skills, their productivity
and, in turn, their progression.
Step 1: The employer identifies one or more eligible employees that
it wishes to train and progress. Eligible employees must all be in low
pay; must have been on low pay for a year or more; and, must be
aged over 24. We estimate there are 2.93 million eligible employees.
Step 2: The employer draws down funding from the government to
pay for the training and qualifications that the employer thinks will
assist in the progression of the employees.
Step 3: The employer provides the workplace training to the
employee (either directly or by commissioning it). In addition the
employer is likely to consider future job design, and providing advice,
guidance and other support to the employees.
SOCIAL MARKET FOUNDATION
4 4
Step 4: The training is completed and the employer seeks to put the
employee into more productive and better paid work. Assuming that
after two years, the employee’s wages have increased, the process is
complete. In the event of the earnings not increasing, the employer
returns a portion of the initial funding back to the Government.
2. RATIONALE FOR THE DESIGN OF THE POLICY
Ensuring that skills are useful to the economy: paying by resultsThe current adult skills system does not consistently deliver skills
and qualifications that are useful to the economy. As shown
in Chapter 2 and in Appendix 2, different qualifications deliver
markedly different earnings premiums. This variation exists across
different awarding bodies as well as across different sectors and
different qualification programmes.79 Given that the Government
spent over £2.4 billion in 2013–14 through its Adult Skills Budget,
this is hugely concerning.80
As Professor Alison Wolf argued in her review of vocational
education, ‘quality is highly variable’.81 These differences stem from
a mixture of poor provision, poorly-designed qualifications and
poor matching of the recipient to labour market opportunities.
Currently, providers are typically paid per course and qualification
(output) rather than the outcome (the labour market returns). This
means providers have little financial incentive to put students on
to the best and most appropriate courses.82 The SMF has previously
79 Figures taken from BIS, Returns to Intermediate and Low Level Vocational qualifications (2011).
80 This £2.4 billion only includes money directly spent through the Adult Skills Budget and so underplays the
extent of Government spending on skills. BIS and Skills Funding Agency, Skills Funding Statement 2013–16
(BIS, 2014).
81 Alison Wolf, Review of Vocational Education – The Wolf Report (DfE, 2011).
82 The difficulty has been recognised recently with the withdrawal of funding support for 5000 vocational
courses. Patrick Howse, Adult courses on balloon art and self tanning axe, BBC, March 5 2014.

MAKING PROGRESS
45
made the case for rewarding the providers of skills courses and
qualifications on the basis of the earnings uplift that results from
the intervention.83 Given that the target group discussed are all in
work, it reduces problems associated with tracking (which may be
more of an issue when dealing with the unemployed).
Precedents for payment by results in skills and for in-work progressionPaying for results would mirror the Government’s proposals for
traineeships (such as through employment outcomes).84 Such
approaches are increasingly being adopted by Local Enterprise
Partnerships through City Deals. In the Liverpool City Region City
Deal proposal, it is argued that ‘there should be an element of skills
funding for unemployed individuals that is linked to the economic
success those individuals enjoy as a result of that learning.’ 85 The
North East LEP is seeking to reward providers that get people
into work or increase the earnings of those already in work. The
Plymouth LEP is piloting a wage progression scheme with the DWP
and the Cabinet Office.86 This latter scheme releases £750,000 to be
spent on 750 18–25 year-olds. 50% of this funding will be provided
to the Work Programme provider upfront with the remaining 50%
linked to the performance of the project.
Design 1:
The Government should ensure that an external accountable entity
bares the risk for achieving outcomes through any investment
in skills. The desired outcome should be an increase in earnings
(compared to the average change in earnings).
83 John Springford, Britain’s got talent (SMF, 2012).
84 BIs and DfE, Traineeships: Supporting young people to develop the skills for apprenticeships and sustainable
employment – Framework for Delivery (2013).
85 Liverpool City Region, Skills for growth (2013).
86 Plymouth City Council, Plymouth and the south west peninsula city deal, https://www.gov.uk/government/
uploads/system/uploads/at tachment _data/f i le/271936/Plymouth_Cit y_Deal_Document _ and_
Implementation_Plans.pdf
SOCIAL MARKET FOUNDATION
46
Putting employers in chargeIn purely theoretical terms the best actor to incentivise in order
to identify the skills needed is the individual. But as noted in
Chapter 3, individuals often do not have access to the necessary
information to make decisions. What is more, much greater policy
attention is now being given to influencing the demand for skills
from employers.87 Therefore, the incentive for earnings progression
and productivity improvement should be borne not only by the
individual but also by actors that are able to affect demand.
Employers themselves can – by choosing how they compete
in the markets in which they operate, and how they invest in and
support their staff – determine progression opportunities for low paid
workers.88 Research has shown that the incentive to invest in training
and the outcome of investment in training depends on integration
with other Human Resource Management policies such as career
routes, advice and support.89 In addition, employers can ensure that
the skills provision that they commission is high quality and matched
to their economic needs. For both these reasons, large employers are
positioned well to take the risk on the outcomes from the investment.
Finally, the policy would align with the Government’s employer-led
skills agenda. As the Minister of State for Skills and Enterprise, Matthew
Hancock has argued, ‘this Government has always been clear that we
cannot create a responsive system by central planning, nor by placing
more requirements on training providers.’ Instead, funding should be
‘directed through the end user – the employer.’90
The most recent paper on apprenticeships funding emphasises a
number of principles: the employer should determine the content of
87 Paul Sissons and Katy Jones, How can local skills strategies which increase employer demand for skills help
improve outcomes for low earners? (JRF, 2013).
88 Katie Schmuecker, Future of the UK Labour Market (JRF, 2014).
89 Philpott, Rewarding work for low paid workers (JRF, 2014).
90 BIS & DfE, A consultation on funding reform for apprenticeships in England, 2013, https://www.gov.uk/
government/uploadsystem/uploads/attachment_data/file/223919/bis-13–1071-funding-reform-for-
apprenticeships-in-england.pdf
MAKING PROGRESS
47
the scheme; employers should purchase the training from providers
thus driving value for money; and, employers should have some
skin in the game – by co-investing alongside the Government.91 The
‘Skills for Progress’ policy outlined below adopts these intellectual
ideas: that employers should bear some risk; that employers should
purchase the training; and that employers should lead the decision
on the design and content of the training. 92 93 94
Government skills policy: an enhanced role for employers
Doug Richards in his review of apprenticeships, advocated handing
greater control of apprenticeships to employers.92 The Wolf
Review of Skills (which covered vocational education, 14–19) also
argued that smaller firms should be encouraged to take a lead on
apprenticeships and be subsidised. It also argued that employer
input into qualifications and course design should be increased
more generally.93 In this vein, the Government has set up the
Employer Ownership of Skills Pilots 1 and 2, under which employers
are able to bid for funding to pay for training for their workforce.
In the autumn, the Government announced that firms now have
access to £238 million of funding under this stream.94
The Government has sought to ‘turn the system on its head’
by putting power in the hands of individuals and employers, with
the rationale being that employers are better placed to understand
what skills are in demand.95 Co-investment from employers can also
give the employer a direct interest in ensuring that the training and
qualification are valuable.
91 BIS, A Consultation on Funding Reform for Apprenticeships in England (2013).
92 Doug Richard, The Richard Review of Apprenticeships (BIS, 2012).
93 Alison Wolf, Review of Vocational Education – The Wolf Report (DfE, 2011); DfE, Wolf recommendations
progress report November 2013 (2013).
94 BIS, Millions in government funding made available to target industrial strategy and skills training, 2013
https://www.gov.uk/government/news/millions-in-government-funding-made-available-to-target-
industrial-strategy-skills-training
95 BIS, Skills for sustainable growth (2010).
SOCIAL MARKET FOUNDATION
48
Design 2:
Employers should be able to draw down funding on behalf of
eligible workers to invest in skills and progression activity. The
employer would be liable for part of the initial payment to be
clawed back if an increase in the earnings of the individual is not
observed after 2 years. This will encourage the employer to seek
out the best skills for the worker, whilst incentivising an interest in
improving the productivity and progression of the employee so
that they can pay them more.
Minimising deadweight costs by focusing on those stuck in low payPolicymakers should seek to minimise deadweight. In skills
provision this can happen in two ways: first, paying for training
that has already taken place with the government simply paying
out for accreditation of existing skills. By putting a reward on the
outcome (a wage increase) we can minimise incentives for this type
of behaviour. Nevertheless, the Government is likely to wish to see
that training has been undertaken and one method of doing this
would be to hand money over on the condition that it is spent on
skills training that leads to a nationally-recognised qualification.
A second risk is that the state may pay for training that would
have occurred in any case. Under this scenario, useful training
and qualifications take place but such activities would have been
undertaken in the absence of the scheme. The National Audit
Office estimated that under Train to Gain approximately half of the
training under the scheme would have been undertaken by firms
anyway.96
It is impossible to eliminate deadweight. However, it can be
minimised. In the Work Programme, commissioners calculated
96 NAO, Train to Gain: Developing the skills of the workforce (2009).
MAKING PROGRESS
49
a ‘policy-off’ outcome that they predicted would occur in the
absence of any government programme. Such a task is hugely
difficult,97 but the Government may wish to estimate a baseline
level of skills progression for the target group.98
In addition, close targeting can reduce deadweight risks by
limiting eligibility to a group that is likely to exclude a significant
number of those who would have progressed in the absence of
the policy.99
Design 3:
Limiting eligibility to those who have been stuck in low pay would
reduce the deadweight costs, as would incorporating a reward
payment or penalty relating to the outcome (wage progression).
Focusing on the over 24sThe aim of the scheme is to unlock the talent of those who are
trapped in low pay and the focus is squarely on providing training
and progression opportunities to those who do not have these
opportunities at present. There is a case to direct the scheme at
those aged over 24. First, there are already a significant number of
schemes directed at those aged under-25. These include the Youth
Contract, efforts being pursued sub-regionally by Local Enterprise
Partnerships and the recent announcement to auto-enrol JSA
claimants aged 18–21 without English and Maths onto training and
for those claiming for six months, to undertake work experience
or training.100 Second, given that many under the age of 25 are in
some form of training this would likely complicate the policy. Third,
training is already free for those under the age of 24.
97 Ian Mulheirn, Will the work programme work? (SMF, 2011)
98 This could be calculated as a proportion of the 10% earnings premium that represents the gross gain.
99 For a discussion of the trade off in employment policy for deadweight and take up see Paul Bivand, Laura
Gardiner, Danielle Whitehurst and Tony Wilson, Youth unemployment: A million reasons to act? (Inclusion, 2011).
100 House of Commons Library, Autumn Statement 2013: a summary (2013).
SOCIAL MARKET FOUNDATION
50
Design 4:
The scheme should be limited to individuals over the age of 24.
Encouraging participationAs noted in Chapter 3, employers of low paid workers often do not
provide them with training; meanwhile, low paid employees often
do not take-up training. While research has shown that some may be
motivated to undertake training by relatively modest pay rewards,101 a
range of factors can impede participation on behalf of the individual.
A number of schemes and pilots have used financial incentives to
encourage participation in training, employment and progression
schemes. Recent trials have shown that financial support and mentor
guidance can improve the uptake of training.102 103 104
Encouraging participation in training and progression in work
Financial incentives have been trialled a number of times in the UK
and the USA in relation to job retention and progression. In the UK,
the Employment Retention and Advancement demonstration pilots
were an attempt to offer intensive adviser support and financial
incentives to encourage training beyond what would normally occur.
The 5-year findings have recently been made public. They show that
weekly earnings increased in the treatment group by approximately
£10 more than in the control group.103 The ERA increased incidents of
training, and wage advancement was highest where the training was
specific to occupations in which people worked. Overall, the evidence
suggests that financial incentives can work for some groups.104
101 JRF, Poverty and ethnicity: A review of evidence, 2011, www.jrf.org.uk ites/files/jrf/poverty-ethnicity-
workplace-culture-full.pdf
102 DWP, Employment retention and advancement demonstration (2011).
103 Richard Dorsett and Andrew J. Oswald, 'Human Well-being and In-Work Benefits: A Randomized Controlled
Trial’, Institute for the Study of Labor, IZA Discussion Paper No. 7943, February 2014.
104 Paul Garaud and Matthew Oakley, Slow Progress: Improving progression in the UK labour market (Policy
Exchange, 2013).
MAKING PROGRESS
51
Given the barriers that prevent some in the low paid workforce
from taking up training, we propose that individuals could be given
a financial incentive to complete the training. This could act as an
incentive to participate as well as encouragement for workers to
complete the training. Given the constraints on some workers,
individuals could draw down the incentive early where they
were using the money directly on work-related activities such as
vouchers for childcare.
Design 5:
To boost take up, employees should be encouraged to undertake
training with an incentive payment.
3. MECHANICS OF ‘SKILLS FOR PROGRESS’ SCHEME
A step by step guide: how it might work in practiceThis section describes how the mechanics of the scheme would
operate in more detail. The policy is designed to give employers as
much freedom as possible in terms of who they seek to train and
progress, as well as giving employers significant discretion in terms
of how they train and support these employees.
Step 1: Employers select employees to participate in the
scheme
Eligible employees must all be in low pay (using the standard
definition); must have been on low pay for a year or more (not
necessarily with the same employer); and, must be aged over 24.
These represent a group who are being overlooked by current
policy. We estimate there are 2.9 million eligible employees.
From this eligible group, employers will be able to select
which employees they believe have the greatest chance of
SOCIAL MARKET FOUNDATION
52
benefiting from training and other support.105 We envisage that
large employers may wish to take groups of employees through
the scheme (whether 10, 50, 100 or 250) at the same time. This
may link with changes to business processes that the employer is
making; alternatively the employer may have identified existing
skills gaps that need filling or may be creating new roles into which
the employee could progress. Given that work-based training
consumes significant resources and energy from the employer, we
envisage that it would be unlikely a firm would put all its eligible
employees through the scheme at one time.
Depending on their business model and the sector within
which they operate, progression routes could take many paths.
Below we set out a few:
• Developing new skills to accompany new business processes
such as new technologies in work.
• Training to allow workers to move into completely new
roles – for instance at the University of Derby cleaning staff
moved into administration roles, following training and
secondments.106
• Allowing sales assistants to be more productive in their jobs, for
instance, by boosting their customer service skills and thus the
offer to the customer and/or the volume of sales. Existing studies
indicate that approaches to boost service quality may lead to
opportunities for staff develop and progress in care services.
• Giving employees in frontline roles the skills to move into
supervisory functions.
Employees could be encouraged to participate with a reward
payment from the government that they receive on completion of
the training.
105 It would be desirable for employers to be made aware automatically of eligible employees such as through
the Universal Credit system.
106 UKCES, Employer practice in progressing low-paid staff (2012).

MAKING PROGRESS
53
Step 2: The employer draws down funding
The employer draws down funding from the Government to
pay for the training and qualifications it thinks will assist in the
progression of these employees. This funding will be available up
to £2,000 per participant (although the Government could make
this scheme more generous if it is ready to make the savings over a
longer period of time).
Step 3: The employer trains the employee and supports their
progression
The employer provides directly or commissions an external provider
to deliver training to the employees. The employer would be able to
select the training that is provided, although the Government may
wish to ensure that the training leads to a nationally-recognised
qualification. We agree with the Government’s position that it
should not be the role of the state to prescribe which specific
training courses and qualifications employers should use for their
employees. However, the Government should seek to publish good
quality data on the labour market returns that derive from different
qualifications and the labour market outcomes of different training
providers. As with proposed apprenticeship policy, the Government
may want to consider setting core elements of transferrable skills
that any training has to ensure are achieved. These could include
functional skills such as English, maths and oral communication.
At the same time as providing training, the employer is likely
to consider additional means of supporting the progression of
the employee, including: future job design, providing advice and
guidance and potentially other support such as mentoring.
Step 4: The training is completed and the employee progresses
Once the employee has been taken through their training and
has completed their qualification, the employee receives from the
Government the incentive payment and the employer seeks to put
the employer into better paid work.
SOCIAL MARKET FOUNDATION
54
Step 5: Earnings check
After two years, if the employee’s wages have increased, the
process is complete. In the event of the earnings not increasing,
the employer returns a portion of the initial funding back to the
Government. If an employee moves work we do not propose that
the employer who provided the training should be liable.107
With the advent of Universal Credit, the Government will
have an effective means of tracking the pay of individuals and
households, which will be connected to employer information.
Small and medium-sized enterprises (SMEs)The evidence suggests that smaller employers may wish to be treated
differently from larger employers. Very small employers frequently
have neither the requisite HR capability nor the scale to offer internal
progression opportunities; and, for many workers in small firms,
progression opportunities will be outside their existing firm.
Individual SMEs would be entitled to participate individually. As
in the Government’s Employer Ownership of Skills pilots, collections
of firms would be able to cluster to pursue this together.
In addition, we envisage that there may be a role for Local
Enterprise Partnerships (LEPs). Where SMEs do not wish to draw down
funding themselves, responsibilities could be carried out by LEPs on
their behalf. Labour markets vary considerably across the country,
and LEPs play a significant role in linking skills strategies with wider
economic development objectives, innovation and business support
policies in their areas.108 Following the review of Lord Heseltine, the
Spending Review of June 2013 committed significant additional
107 This mirrors the Government’s proposal for apprenticeship funding in which it proposes withholding
portion of the funding in a payment by results approach. HMG, The future of apprenticeships in England:
funding reform technical consultation (March 2014).
108 Paul Sissons and Katy Jones, How can local skills strategies which increase employer demand for skills help
improve outcomes for low earners? (JRF, 2013).
MAKING PROGRESS
55
commissioning power and funding to LEPs, including some skills
funding.109 LEPs are due to submit to the Treasury their Strategic
Economic Plans by the end of March 2014; Growth Deals are due to be
agreed by July 2014. The Labour Party has also proposed that budgets
for apprenticeships and the Work Programme should be devolved to
sub-regional bodies – potentially city regions.110
Under our proposals, LEPs would be encouraged to commission
provision of training through payment by results schemes. These
would offer a good way of piloting and developing the concepts of
payment by results in skills provision. As part of these agreements,
LEPs could propose to provide additional brokerage and advice
services to help people move firms. The evidence and best
practice also suggests that a bundle of additional services could be
wrapped around the skills provision, including career guidance, job
mapping and other services. Part of the outcome risk – otherwise
borne by employers – should be borne by the LEP as occurs in City
Deals. Given concerns about the varying resources and capability
of some individual LEPs currently,111 we recommend that where
there are capability gaps local authorities should be allowed to
fulfil this function.
4. PILOTING AND FURTHER CONSIDERATIONS
Options for piloting the schemeGiven the problems of workers being stuck in low pay, there
is a strong case for the Government to pursue reform actively.
However, the Government may wish to test the scheme ahead
of wider implementation. This would allow it to explore: how to
109 Lord Heseltine, No Stone Unturned (BIS, 2012); HMT and BIS, Government’s response to the Heseltine review
(2013).
110 Labour Press, Ed Miliband speech on tackling the cost of living crisis, 2014 http://press.labour.org.uk/
post/82080311502/ed-milibands-speech-on-tackling-the-cost-of-living
111 See for instance, see APPG on Local Growth, Rising to the challenge: how LEPs can deliver local growth strategies
(2013).
SOCIAL MARKET FOUNDATION
56
best achieve quality of skills and training; the eligibility criteria;
the incentives to employees to participate; what other support
employers put in place alongside training to help employees.
• Employer pilot: the Government could ask for a small number
of large companies to volunteer to test the scheme. This
would allow policymakers to test out the effectiveness of the
incentives in the scheme, the mechanics of the scheme and
how to reduce any regulatory burdens that it may impose on
businesses. This could also be an opportunity to assess what
HR practices help employees progress alongside the skills
training.
• Regional pilot: A pilot could be launched to focus on a region
where the number of people stuck in low pay is particularly
high or where the LEP has identified low pay as a particular
challenge in its economic plan. Appendix 6 shows that the
proportion of workers stuck in low pay varies significantly
across the country, with areas such as Merseyside and parts of
the North East having the highest proportion stuck in low pay.
A LEP could be given responsibility for commissioning training
provision for those stuck in low pay and for coordinating other
support functions to go alongside it.
Links to the Government’s In-work conditionality policyUnder Universal Credit, an estimated 1.3 million people will be
subject to some form of in-work conditionality. Nearly 45% of this
group has relatively low qualifications or no formal qualifications at
all.112 It is important that this group receive advice and guidance as
to how to increase their hours and/or earnings. The Government
should consider offering an additional incentive to employers to
train and develop this group given the fact that they consume
more state benefits than those in full-time work.
112 Paul Garaud and Matthew Oakley, Slow Progress: Improving progression in the UK labour market (Policy
Exchange, 2013).

MAKING PROGRESS
57
A significant proportion of low paid workers are in part-
time work. The payback to the public purse for training may be
less strong when someone is working and continues to work
part-time compared to full-time. It is important therefore for the
Government’s ‘In-work conditionality’ policy to include tangible
support structures to help people increase their hours as well as
progress their earnings.
Complementarities with other Government skills policyThere should be a place in the market for both high quality
apprenticeships and high quality vocational training for those in
work. It is to be hoped that take up of apprenticeships continues to
increase. The Coalition Government has invested significant energy
and funding into apprenticeships since it took office. The Chancellor
announced an additional 100,000 higher apprenticeships in the
March 2014 Budget. The Richards Review and the Government
have done much to emphasise the need for ensuring high quality
apprenticeships.
The Government is currently consulting on how to fund
apprenticeships. Depending on what methods are adopted, it
would be sensible to ensure that the systems are aligned. First,
funding structures could be joined up where appropriate. The
current consultation makes a number of recommendations for how
government money should be distributed (including via credits for
the trainee or via PAYE payments to HMRC that employers make).
Second, policymakers would want to avoid the risk that there
are perverse incentives for employers or employees to prefer one
form of training to the other. Therefore, consideration should also
be given as to how apprenticeships for those stuck in low pay
should be funded. One option would be for funding available to
employers through the 'Skills for Progress Scheme' to be used for
apprenticeship schemes as well.

SOCIAL MARKET FOUNDATION
58
Additional triggersIn addition, given the reluctance of some employers to offer
training to their low paid workers, additional triggers could be
introduced to the scheme over time to ensure that eligible workers
can access the scheme. Given that any such measures would
impose an additional burden on businesses, any such policy should
be designed carefully. One option would be to monitor take-up
initially and to introduce an employee right to request in specific
sectors for firms where there has been no take up. To safeguard
against burdensome requirements on businesses, SMEs could
be excluded from such a policy for a longer period of time (as is
occurring with the staging of auto-enrolment in pensions).
MAKING PROGRESS
59
APPENDIX 1: METHODOLOGY – QUARTERLY LABOUR FORCE SURVEY
This report draws on original data analysis by the SMF using the
Quarterly Labour Force Survey. For the computation of some of the
top level figures, such as the number and fraction of individuals
stuck in low pay and the current low pay wage, the latest available
quarter at the time of the writing of this report, was used, spanning
July 2013 to September 2013.
For the longitudinal analysis which tracks people on low pay
we used five-quarter data from the Labour Force Survey, which
provides a subsample of individuals who were interviewed in five
consecutive quarters. In order to take into account differential
attrition of respondents, responses are weighted for the
computation of descriptive statistics.
For comparability reasons, we use for every year of longitudinal
data the sample of individuals who were tracked starting in the
second quarter (April–June). Where not otherwise specified we
used a sub-sample of individuals aged 25 and above who were
not in full-time education at the time of interview. Self-employed
individuals are not included in the analysis as no wage data is
available for these groups.
Individuals were classified as being on low pay if their wage was
below the low pay threshold. The low pay threshold was computed
as two thirds of the median wage of the sample of the first quarter
of observation.
Individuals were classified as being stuck on low pay if their
wages at the fifth quarter of observation was still below two thirds
of the median wage as measured in the first quarter of observation
and if they had been in employment continuously throughout the
observational period of one year.

SOCIAL MARKET FOUNDATION
60
Occupational progress was defined as moving up at least
one step on the occupational scale as defined by SOC2010
major groups.113 Elementary Occupations represent the lowest
occupational group, and Managers, directors and senior officials
represent the highest occupational group.
113 For more information see appendix 8.
MAKING PROGRESS
61
APPENDIX 2: CALCULATING THE EARNINGS PREMIUM FROM A QUALIFICATION
The data on skills premiums varies significantly and there are a
range of factors that may affect the extent to which a correlation
between taking a qualification and observing an increase in wages
reflects the productivity boost simply from the qualification rather
than unobservable differences between individuals.
Intuitively, there is a concern that the apparent premium
may be over-reporting the actual productivity effect, because
the increase in the wage may not simply be an exposition of the
increase in the salary but also of the ability and/or motivation of the
individual. However, there are also biases that may systematically
underplay the effect of a qualification on wages. These include
the underreporting of qualifications and training which serves to
depress the apparent gains from training.
In this study, we use marginal returns from qualifications,
which estimates the earnings enhancement achieved when the
vocational qualification is the highest qualification.
The BIS paper used Quarterly Labour Force Survey data and was
unable to control for unobservable characteristics of individuals.
Finding reliable data on relevant qualifications using datasets that
control for additional variables (such as motivation) is difficult. The
BIS study makes use of the British Cohort Study and claims that this
controls for ‘motivation’. However, these figures (in Chapter 8) are
unhelpful and sample sizes are small.
Other papers imply that using Labour Force Survey (LFS) data
gives a reasonable indication of the magnitude of the effect of the
qualification. A 2000 paper, The Returns to Academic and Vocational
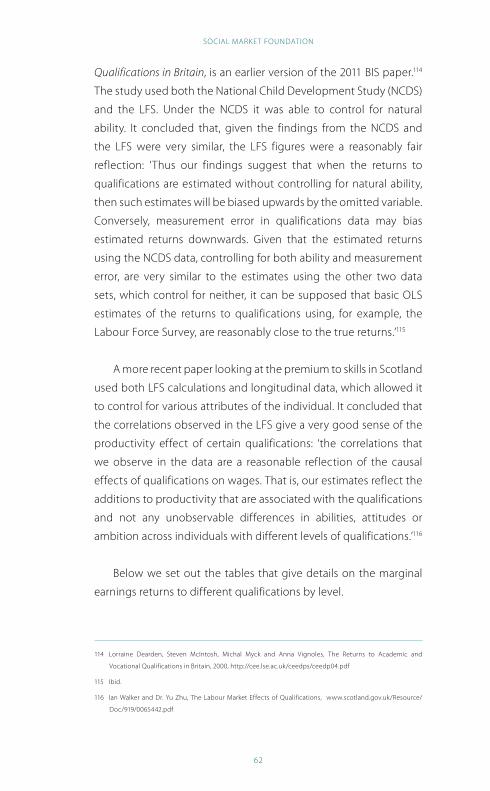
SOCIAL MARKET FOUNDATION
62
Qualifications in Britain, is an earlier version of the 2011 BIS paper.114
The study used both the National Child Development Study (NCDS)
and the LFS. Under the NCDS it was able to control for natural
ability. It concluded that, given the findings from the NCDS and
the LFS were very similar, the LFS figures were a reasonably fair
reflection: ‘Thus our findings suggest that when the returns to
qualifications are estimated without controlling for natural ability,
then such estimates will be biased upwards by the omitted variable.
Conversely, measurement error in qualifications data may bias
estimated returns downwards. Given that the estimated returns
using the NCDS data, controlling for both ability and measurement
error, are very similar to the estimates using the other two data
sets, which control for neither, it can be supposed that basic OLS
estimates of the returns to qualifications using, for example, the
Labour Force Survey, are reasonably close to the true returns.’115
A more recent paper looking at the premium to skills in Scotland
used both LFS calculations and longitudinal data, which allowed it
to control for various attributes of the individual. It concluded that
the correlations observed in the LFS give a very good sense of the
productivity effect of certain qualifications: ‘the correlations that
we observe in the data are a reasonable reflection of the causal
effects of qualifications on wages. That is, our estimates reflect the
additions to productivity that are associated with the qualifications
and not any unobservable differences in abilities, attitudes or
ambition across individuals with different levels of qualifications.’116
Below we set out the tables that give details on the marginal
earnings returns to different qualifications by level.
114 Lorraine Dearden, Steven McIntosh, Michal Myck and Anna Vignoles, The Returns to Academic and
Vocational Qualifications in Britain, 2000, http://cee.lse.ac.uk/ceedps/ceedp04.pdf
115 Ibid.
116 Ian Walker and Dr. Yu Zhu, The Labour Market Effects of Qualifications, www.scotland.gov.uk/Resource/
Doc/919/0065442.pdf
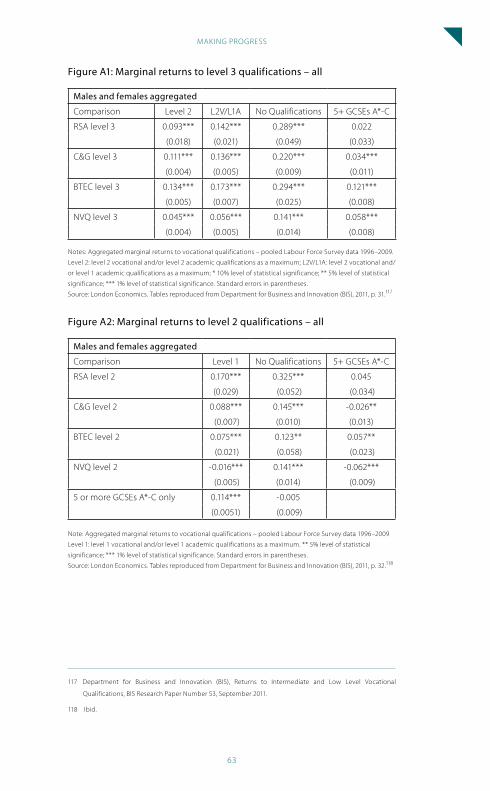
MAKING PROGRESS
63
Figure A1: Marginal returns to level 3 qualifications – all
Males and females aggregated
Comparison Level 2 L2V/L1A No Qualifications 5+ GCSEs A*-C
RSA level 3 0.093*** 0.142*** 0.289*** 0.022
(0.018) (0.021) (0.049) (0.033)
C&G level 3 0.111*** 0.136*** 0.220*** 0.034***
(0.004) (0.005) (0.009) (0.011)
BTEC level 3 0.134*** 0.173*** 0.294*** 0.121***
(0.005) (0.007) (0.025) (0.008)
NVQ level 3 0.045*** 0.056*** 0.141*** 0.058***
(0.004) (0.005) (0.014) (0.008)
Notes: Aggregated marginal returns to vocational qualifications – pooled Labour Force Survey data 1996–2009.
Level 2: level 2 vocational and/or level 2 academic qualifications as a maximum; L2V/L1A: level 2 vocational and/
or level 1 academic qualifications as a maximum; * 10% level of statistical significance; ** 5% level of statistical
significance; *** 1% level of statistical significance. Standard errors in parentheses.
Source: London Economics. Tables reproduced from Department for Business and Innovation (BIS), 2011, p. 31.117
Figure A2: Marginal returns to level 2 qualifications – all
Males and females aggregated
Comparison Level 1 No Qualifications 5+ GCSEs A*-C
RSA level 2 0.170*** 0.325*** 0.045
(0.029) (0.052) (0.034)
C&G level 2 0.088*** 0.145*** -0.026**
(0.007) (0.010) (0.013)
BTEC level 2 0.075*** 0.123** 0.057**
(0.021) (0.058) (0.023)
NVQ level 2 -0.016*** 0.141*** -0.062***
(0.005) (0.014) (0.009)
5 or more GCSEs A*-C only 0.114*** -0.005
(0.0051) (0.009)
Note: Aggregated marginal returns to vocational qualifications – pooled Labour Force Survey data 1996–2009
Level 1: level 1 vocational and/or level 1 academic qualifications as a maximum. ** 5% level of statistical
significance; *** 1% level of statistical significance. Standard errors in parentheses.
Source: London Economics. Tables reproduced from Department for Business and Innovation (BIS), 2011, p. 32.118
117 Department for Business and Innovation (BIS), Returns to Intermediate and Low Level Vocational
Qualifications, BIS Research Paper Number 53, September 2011.
118 Ibid.
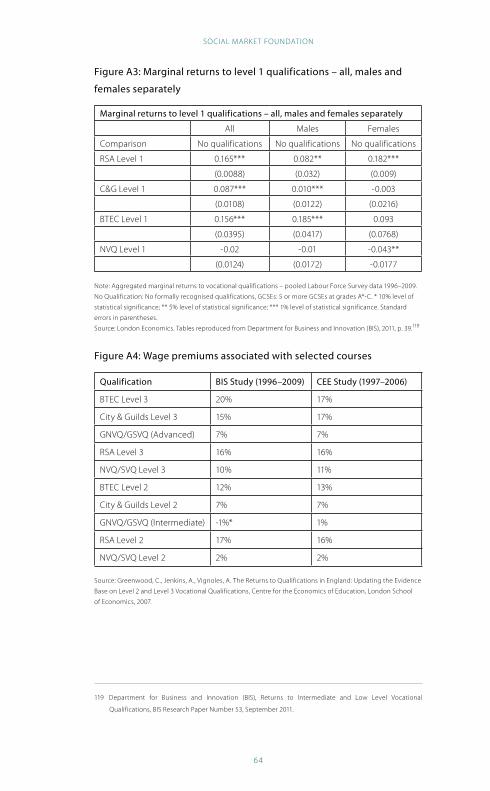
SOCIAL MARKET FOUNDATION
64
Figure A3: Marginal returns to level 1 qualifications – all, males and
females separately
Marginal returns to level 1 qualifications – all, males and females separately
All Males Females
Comparison No qualifications No qualifications No qualifications
RSA Level 1 0.165*** 0.082** 0.182***
(0.0088) (0.032) (0.009)
C&G Level 1 0.087*** 0.010*** -0.003
(0.0108) (0.0122) (0.0216)
BTEC Level 1 0.156*** 0.185*** 0.093
(0.0395) (0.0417) (0.0768)
NVQ Level 1 -0.02 -0.01 -0.043**
(0.0124) (0.0172) -0.0177
Note: Aggregated marginal returns to vocational qualifications – pooled Labour Force Survey data 1996–2009.
No Qualification: No formally recognised qualifications, GCSEs: 5 or more GCSEs at grades A*-C. * 10% level of
statistical significance; ** 5% level of statistical significance; *** 1% level of statistical significance. Standard
errors in parentheses.
Source: London Economics. Tables reproduced from Department for Business and Innovation (BIS), 2011, p. 39.119
Figure A4: Wage premiums associated with selected courses
Qualification BIS Study (1996–2009) CEE Study (1997–2006)
BTEC Level 3 20% 17%
City & Guilds Level 3 15% 17%
GNVQ/GSVQ (Advanced) 7% 7%
RSA Level 3 16% 16%
NVQ/SVQ Level 3 10% 11%
BTEC Level 2 12% 13%
City & Guilds Level 2 7% 7%
GNVQ/GSVQ (Intermediate) -1%* 1%
RSA Level 2 17% 16%
NVQ/SVQ Level 2 2% 2%
Source: Greenwood, C., Jenkins, A., Vignoles, A. The Returns to Qualifications in England: Updating the Evidence
Base on Level 2 and Level 3 Vocational Qualifications, Centre for the Economics of Education, London School
of Economics, 2007.
119 Department for Business and Innovation (BIS), Returns to Intermediate and Low Level Vocational
Qualifications, BIS Research Paper Number 53, September 2011.
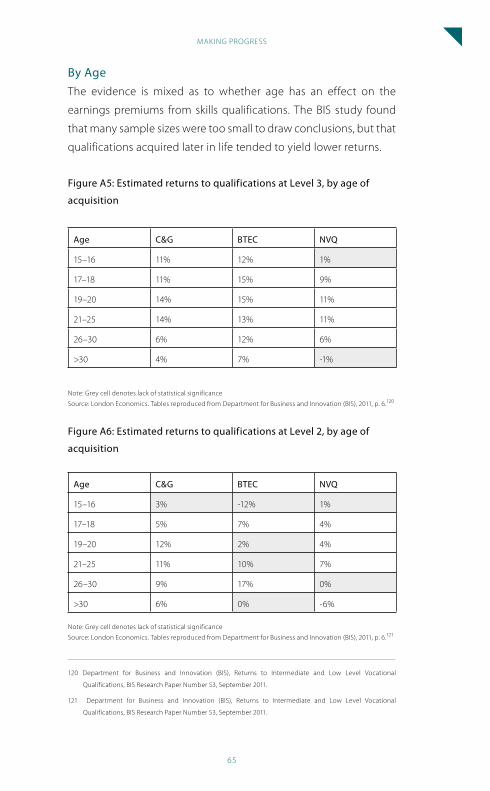
MAKING PROGRESS
65
By AgeThe evidence is mixed as to whether age has an effect on the
earnings premiums from skills qualifications. The BIS study found
that many sample sizes were too small to draw conclusions, but that
qualifications acquired later in life tended to yield lower returns.
Figure A5: Estimated returns to qualifications at Level 3, by age of
acquisition
Age C&G BTEC NVQ
15–16 11% 12% 1%
17–18 11% 15% 9%
19–20 14% 15% 11%
21–25 14% 13% 11%
26–30 6% 12% 6%
>30 4% 7% -1%
Note: Grey cell denotes lack of statistical significance
Source: London Economics. Tables reproduced from Department for Business and Innovation (BIS), 2011, p. 6.120
Figure A6: Estimated returns to qualifications at Level 2, by age of
acquisition
Age C&G BTEC NVQ
15–16 3% -12% 1%
17–18 5% 7% 4%
19–20 12% 2% 4%
21–25 11% 10% 7%
26–30 9% 17% 0%
>30 6% 0% -6%
Note: Grey cell denotes lack of statistical significance
Source: London Economics. Tables reproduced from Department for Business and Innovation (BIS), 2011, p. 6.121
120 Department for Business and Innovation (BIS), Returns to Intermediate and Low Level Vocational
Qualifications, BIS Research Paper Number 53, September 2011.
121 Department for Business and Innovation (BIS), Returns to Intermediate and Low Level Vocational
Qualifications, BIS Research Paper Number 53, September 2011.
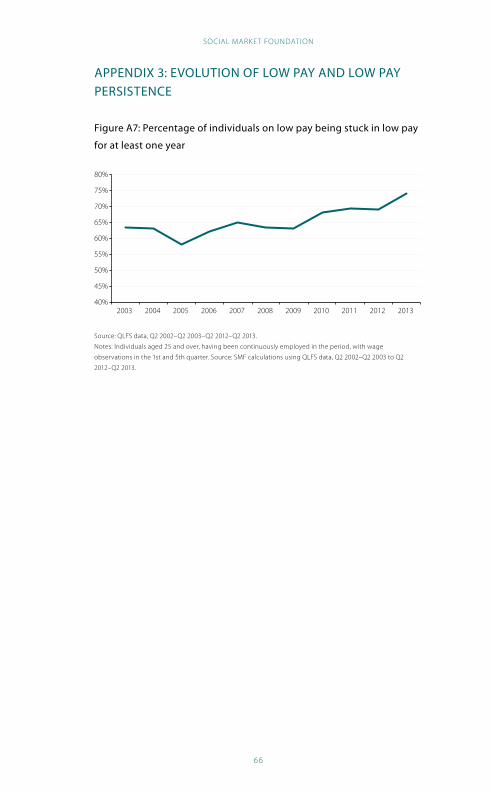
SOCIAL MARKET FOUNDATION
66
APPENDIX 3: EVOLUTION OF LOW PAY AND LOW PAY PERSISTENCE
Figure A7: Percentage of individuals on low pay being stuck in low pay
for at least one year
40%
45%
50%
55%
60%
65%
70%
75%
80%
2003 2004 2005 2006 2007 2008 2009 2010 2011 2012 2013
Source: QLFS data, Q2 2002–Q2 2003–Q2 2012–Q2 2013.
Notes: Individuals aged 25 and over, having been continuously employed in the period, with wage
observations in the 1st and 5th quarter. Source: SMF calculations using QLFS data, Q2 2002–Q2 2003 to Q2
2012–Q2 2013.
MAKING PROGRESS
67
APPENDIX 4: METHODOLOGY – HOUSEHOLD SPECIMEN CALCULATIONS FOR SAVINGS TO THE EXCHEQUER
This analysis simulated the savings to the Exchequer under a
central earnings scenario for a set of different specimen household
types. The exercise was carried out to assess the extent to which
the savings were higher or lower depending on location and
household constitution. Two locations were used: Outer East
London was selected because of high housing costs; Birmingham
because it has the median housing costs (as interpreted through
the Local Housing Allowance rate).
The gains to the Exchequer were simulated in the following way:
• The effect on the household’s benefits was calculated by Ferret
Information Systems’ Future Benefit Model. This is a highly-
respected tax-benefits calculator used in many academic studies.
• We calculated income tax receipts together with Employee
National Insurance Contributions by multiplying the earnings
increase by 0.32.
• We calculated Employer National Insurance Contributions by
multiplying the earnings increase 0.138.122
• We calculated additional VAT receipts by multiplying the
increase in net household income by 0.21.123
Ferret’s Future Benefits Model – SMF Earnings Variance Output: Modelling valuesThe claimant’s gross earnings in set 1 are £13,468.
The claimant’s gross earnings in set 2 are £14,815, an increase
by £1,347 per year.
122 Gov.uk, National Insurance contributions for your employees, 2014, https://www.gov.uk/national-insurance-
contributions-for-employers/national-insurance-contribution-rates
123 This is the average percentage of disposable income spent by the bottom 3 deciles of hosueholds according
to ONS, “The effects of taxes and benefits on household income, 2011–2012”, Table 16A.
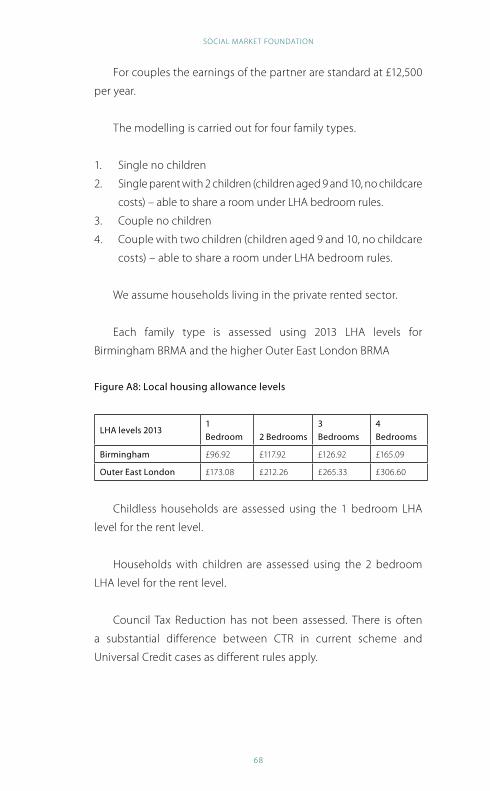
SOCIAL MARKET FOUNDATION
68
For couples the earnings of the partner are standard at £12,500
per year.
The modelling is carried out for four family types.
1. Single no children
2. Single parent with 2 children (children aged 9 and 10, no childcare
costs) – able to share a room under LHA bedroom rules.
3. Couple no children
4. Couple with two children (children aged 9 and 10, no childcare
costs) – able to share a room under LHA bedroom rules.
We assume households living in the private rented sector.
Each family type is assessed using 2013 LHA levels for
Birmingham BRMA and the higher Outer East London BRMA
Figure A8: Local housing allowance levels
LHA levels 20131 Bedroom 2 Bedrooms
3 Bedrooms
4 Bedrooms
Birmingham £96.92 £117.92 £126.92 £165.09
Outer East London £173.08 £212.26 £265.33 £306.60
Childless households are assessed using the 1 bedroom LHA
level for the rent level.
Households with children are assessed using the 2 bedroom
LHA level for the rent level.
Council Tax Reduction has not been assessed. There is often
a substantial difference between CTR in current scheme and
Universal Credit cases as different rules apply.

MAKING PROGRESS
69
MethodologyThe Future Benefits Model is produced and maintained by Ferret
Information Systems.
This model consolidates the changes to personal tax and
benefits rules announced in the Emergency Budget of June 2010,
the Comprehensive Spending Review of October 2010, the Autumn
Statement 2011, the Budgets 2012 and 2013 and the Welfare Reform
Act 2012 with subsequent regulations, together with other changes
announced to the current schemes of benefits.
Transitional Protection is not applied to any case. The results
show the effect of calculated entitlements.
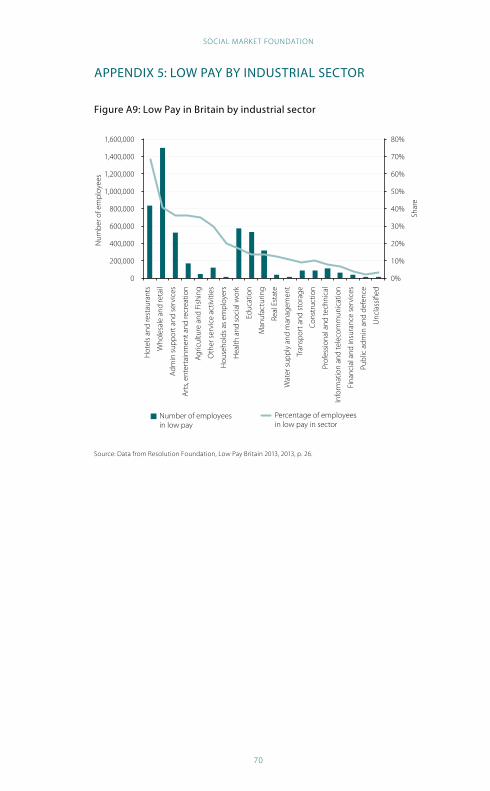
SOCIAL MARKET FOUNDATION
70
APPENDIX 5: LOW PAY BY INDUSTRIAL SECTOR
Figure A9: Low Pay in Britain by industrial sector
Number of employeesin low pay
Percentage of employeesin low pay in sector
0%
10%
20%
30%
40%
50%
60%
70%
80%
0
200,000
400,000
600,000
800,000
1,000,000
1,200,000
1,400,000
1,600,000 H
otel
s an
d re
stau
rant
s
Who
lesa
le a
nd re
tail
Adm
in s
uppo
rt a
nd s
ervi
ces
Art
s, en
tert
ainm
ent a
nd re
crea
tion
Agr
icul
ture
and
Fis
hing
Oth
er s
ervi
ce a
ctiv
ities
Hou
seho
lds
as e
mpl
oyer
s
Hea
lth a
nd s
ocia
l wor
k
Educ
atio
n
Man
ufac
turin
g
Real
Est
ate
Wat
er s
uppl
y an
d m
anag
emen
t
Tran
spor
t and
sto
rage
Con
stru
ctio
n
Prof
essi
onal
and
tech
nica
l
Info
rmat
ion
and
tele
com
mun
icat
ion
Fina
ncia
l and
insu
ranc
e se
rvic
es
Publ
ic a
dmin
and
def
ence
Unc
lass
ified
Shar
e
Num
ber o
f em
ploy
ees
Source: Data from Resolution Foundation, Low Pay Britain 2013, 2013, p. 26.
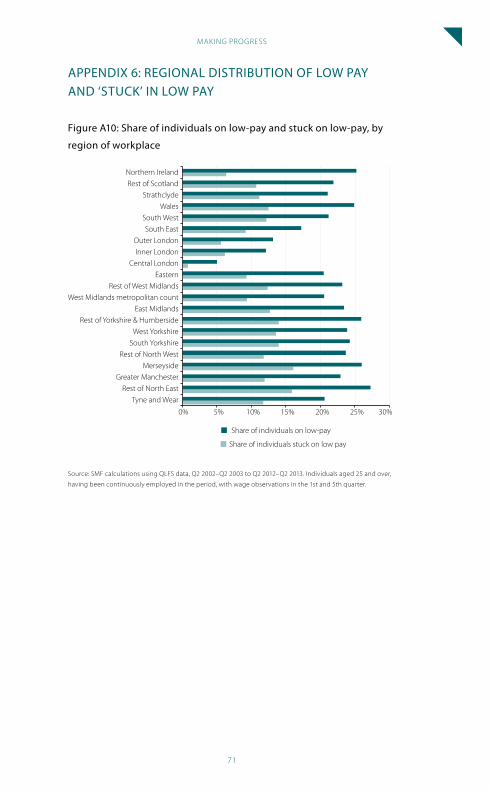
MAKING PROGRESS
71
APPENDIX 6: REGIONAL DISTRIBUTION OF LOW PAY AND ‘STUCK’ IN LOW PAY
Figure A10: Share of individuals on low-pay and stuck on low-pay, by
region of workplace
0% 5% 10% 15% 20% 25% 30%
Tyne and Wear
Rest of North East
Greater Manchester
Merseyside
Rest of North West
South Yorkshire
West Yorkshire
Rest of Yorkshire & Humberside
East Midlands
West Midlands metropolitan count
Rest of West Midlands
Eastern
Central London
Inner London
Outer London
South East
South West
Wales
Strathclyde
Rest of Scotland
Northern Ireland
Share of individuals stuck on low pay
Share of individuals on low-pay
Source: SMF calculations using QLFS data, Q2 2002–Q2 2003 to Q2 2012–Q2 2013. Individuals aged 25 and over,
having been continuously employed in the period, with wage observations in the 1st and 5th quarter.
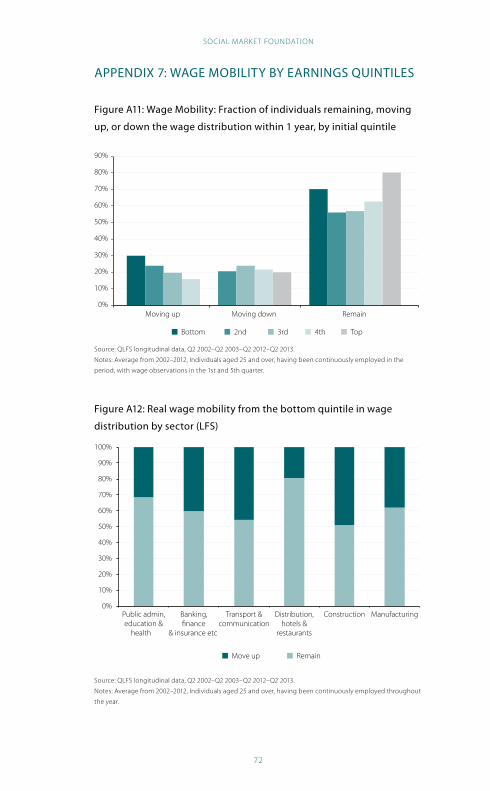
SOCIAL MARKET FOUNDATION
72
APPENDIX 7: WAGE MOBILITY BY EARNINGS QUINTILES
Figure A11: Wage Mobility: Fraction of individuals remaining, moving
up, or down the wage distribution within 1 year, by initial quintile
Bottom 2nd 3rd 4th Top
0%
10%
20%
30%
40%
50%
60%
70%
80%
90%
Moving up Moving down Remain
One-year transitions by initial quintile in wage distribution or unemployment averagefrom 2002-2012, only individuals continuously in employment during year
Source: QLFS longitudinal data, Q2 2002–Q2 2003–Q2 2012–Q2 2013.
Notes: Average from 2002–2012, Individuals aged 25 and over, having been continuously employed in the
period, with wage observations in the 1st and 5th quarter.
Figure A12: Real wage mobility from the bottom quintile in wage
distribution by sector (LFS)
Move up Remain
0%
10%
20%
30%
40%
50%
60%
70%
80%
90%
100%
Public admin,education &
health
Banking,finance
& insurance etc
Transport &communication
Distribution,hotels &
restaurants
Construction Manufacturing
Source: QLFS longitudinal data, Q2 2002–Q2 2003–Q2 2012–Q2 2013.
Notes: Average from 2002–2012, Individuals aged 25 and over, having been continuously employed throughout
the year.
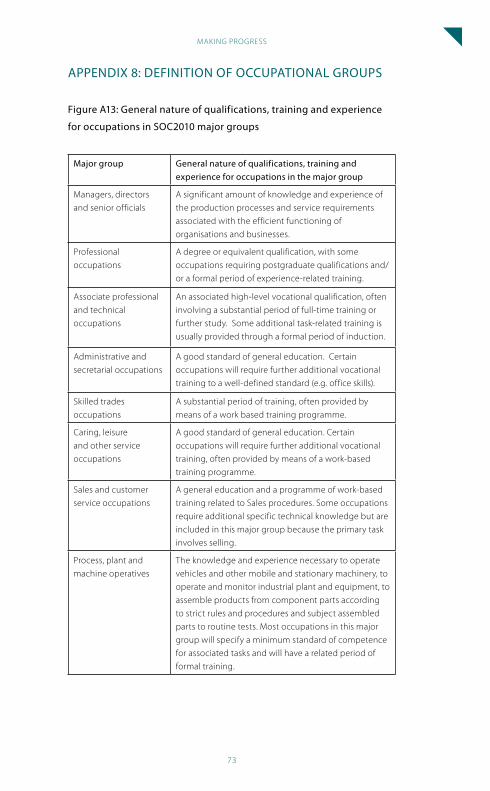
MAKING PROGRESS
73
APPENDIX 8: DEFINITION OF OCCUPATIONAL GROUPS
Figure A13: General nature of qualifications, training and experience
for occupations in SOC2010 major groups
Major group General nature of qualifications, training and experience for occupations in the major group
Managers, directors
and senior officials
A significant amount of knowledge and experience of
the production processes and service requirements
associated with the efficient functioning of
organisations and businesses.
Professional
occupations
A degree or equivalent qualification, with some
occupations requiring postgraduate qualifications and/
or a formal period of experience-related training.
Associate professional
and technical
occupations
An associated high-level vocational qualification, often
involving a substantial period of full-time training or
further study. Some additional task-related training is
usually provided through a formal period of induction.
Administrative and
secretarial occupations
A good standard of general education. Certain
occupations will require further additional vocational
training to a well-defined standard (e.g. office skills).
Skilled trades
occupations
A substantial period of training, often provided by
means of a work based training programme.
Caring, leisure
and other service
occupations
A good standard of general education. Certain
occupations will require further additional vocational
training, often provided by means of a work-based
training programme.
Sales and customer
service occupations
A general education and a programme of work-based
training related to Sales procedures. Some occupations
require additional specific technical knowledge but are
included in this major group because the primary task
involves selling.
Process, plant and
machine operatives
The knowledge and experience necessary to operate
vehicles and other mobile and stationary machinery, to
operate and monitor industrial plant and equipment, to
assemble products from component parts according
to strict rules and procedures and subject assembled
parts to routine tests. Most occupations in this major
group will specify a minimum standard of competence
for associated tasks and will have a related period of
formal training.

SOCIAL MARKET FOUNDATION
74
Major group General nature of qualifications, training and
experience for occupations in the major group
Elementary
occupations
Occupations classified at this level will usually require a
minimum general level of education (that is, that which
is acquired by the end of the period of compulsory
education). Some occupations at this level will also
have short periods of work-related training in areas
such as health and safety, food hygiene, and customer
service requirements.
Source: ONS, Standard Occupational Classification 2010, Volume 1, Structure and descriptions of unit groups,
2010, p. 4.

Copyright © The Social Market Foundation, 2014

£10.00 SOCIAL MARKET FOUNDATION11 Tufton Street | Westminster | London SW1P 3QBPhone: 020 7222 7060 | Fax: 020 7222 0310 www.smf.co.uk
Kindly supported by
The economic downturn and early signs of recovery have thrust the issue of low productivity of the UK economy into the public debate. While unemployment levels have remained low, real pay has been falling and UK productivity lags behind other major economies. The productivity problem sits alongside widespread skills shortages across industries and occupations, presenting a major growth bottleneck for the UK economy.
At the same time, a significant share of the UK labour force are stuck on low pay, with low skill levels limiting prospects for career progression and wage growth.
Making Progress proposes a skills based in-work progression policy to help individuals stuck on low pay enhance their productivity and escape the low-pay trap. Boosting the skills of those stuck in low pay will make these individuals more valuable to their employers and to the UK economy as a whole.