making inferences based on your sample learning …€¦ · chapter summary. the chapter is focused...
TRANSCRIPT

87
LEARNING OUTCOMES
After reading and reviewing
Chapter 6, you should
understand
• The use of inferential statistics
to determine whether the
finding of a study is unusual
• The importance of the
sampling distribution
• How to carry out the
hypothesis testing process
• When to reject or retain a null
hypothesis and the types of
errors associated with each of
these decisions
• The distinction between
statistical significance, effect
size, confidence intervals, and
practical significance
CHAPTER SUMMARY
The chapter is focused on inferential statistics that allow us to make inferences about a population from findings with a sample. Sampling distributions are a distribution of some statistic and provide the basis for deciding whether our sam-ple is representative (or not) of the population—or when a difference makes a difference. The decision-making process is called hypothesis testing and involves multiple steps: stating null and alternative hypotheses, defining the sampling dis-tribution, setting the criterion level (.05 or .01), computing a statistic, and deciding whether to reject or retain the null hypothesis. The alternative hypothesis determines the region of rejection in the sampling distribution and can be one-tailed (directional) or two-tailed (nondirectional). If the results of our analysis fall in the region of rejection, we reject the null hypothesis and support the alternative hypothesis, but if the statistic falls in the region of acceptance, we retain the null hypothesis.
We design studies to try to reject a false null hypoth-esis (called power), but because hypothesis testing is based on probability, the decision to reject or retain the hypothesis is associated with a probability of error. Type I error occurs when we reject a true null hypothesis, and Type II error occurs when we retain a false null hypothesis. Ways to decrease the probability of either type of error are described as well as ways to increase power. Finally, effect sizes (magnitude of an effect), confidence intervals (margin of error), and practical significance (everyday implications) are described as tools to enhance our understanding of the results of a study.
6Beyond DescriptivesMAKING INFERENCES BASED ON YOUR SAMPLE
Copyright ©2019 by SAGE Publications, Inc. This work may not be reproduced or distributed in any form or by any means without express written permission of the publisher.
Do not
copy
, pos
t, or d
istrib
ute

88 STUDENT STUDY GUIDE FOR RESEARCH METHODS, STATISTICS, AND APPLICATIONS
REVIEW AND APPLICATION OF KEY CONCEPTS FROM CHAPTER 6
Exercise 6.1: Inferential Statistics (Review)
1. ___________ statistics are the statistical analysis of data from a sample used to draw a conclusion about a population from which the sample is drawn.
2. Statistics from a population are called ______________________________.
3. ___________ is the population mean.
4. ___________ is the population standard deviation.
5. Fill in the table:
Descriptive Inferential
sample
parameter
mean (M)
sigma (σ)
6. Inferential statistics are based on ____________________ theory, which examines random events, such as what card you will draw in poker.
7. ___________________ is the decision-making process of determining the probability of finding a particular result.
8. A ____________ describes a distribution of statistics while a ____________ describes a distribution of scores.
Exercise 6.2: Hypothesis Testing (Review)
1. The ______________ hypothesis predicts what you expect to find in your study.
2. The _______________ hypothesis predicts no difference between groups.
3. A study is always designed to ____________ the null hypothesis.
4. The typical region of rejection is the extreme ______% of the sampling distribution, but sometimes we use the more strict extreme _____% to define the region of rejection.
5. If your results fall in the region of rejection, you should ______________ (reject/retain) the null hypothesis and you ______________ (have, have not) found statistical significance.
Copyright ©2019 by SAGE Publications, Inc. This work may not be reproduced or distributed in any form or by any means without express written permission of the publisher.
Do not
copy
, pos
t, or d
istrib
ute

CHAPTER 6 BEYOND DESCRIPTIVES 89
6. If your results fall in the region of acceptance, you should ______________ (reject/retain) the null hypothesis and you ______________ (have/have not) found statistical significance.
7. Statistical significance suggests that your results are not due to ____________ and that the results __________ (do/do not) belong to the sampling distribution implied by the null hypothesis.
8. A one-tailed test makes it ____________ (more/less) difficult to reject the null hypothesis because the region of rejection is located on one tail of the sampling distribution, while two-tailed tests divide the region of rejection between the two tails of the distribution.
9. A two-tailed test is a ______________ (more/less) conservative test than a one-tailed test because _________________________________________.
10. Researchers typically compute a __________-tailed test because it is more conservative.
11. The value of a statistic that defines the region of rejection in a sampling distribution is called the _____________ value.
12. The percentage of the distribution that the researcher selects for the region of rejection is called the ________ level and typically is less than _______%.
13. When you reject the null hypothesis, there is a probability of a __________ error and it is equal to the _________________________.
14. When you retain the null hypothesis, there is a probability of a ______________ error.
15. Regardless of your decision to reject or retain the null hypothesis, there is always a chance of error because statistics are based on _____________________.
16. Why can’t you have a probability of both a Type I and a Type II error in a study?
____________________________________________________________
____________________________________________________________
17. Correctly rejecting a false null hypothesis is called ________________.
18. You can reduce the probability of a Type II error by (increasing/decreasing)
a. _________________ sample size
b. _________________ error in your research design
c. _________________ strength of the effect
Copyright ©2019 by SAGE Publications, Inc. This work may not be reproduced or distributed in any form or by any means without express written permission of the publisher.
Do not
copy
, pos
t, or d
istrib
ute

90 STUDENT STUDY GUIDE FOR RESEARCH METHODS, STATISTICS, AND APPLICATIONS
Exercise 6.3: Hypothesis Testing (Application)
1. “There will be no difference in the number of crimes committed by those in urban areas and those in rural areas” is an example of a(n) __________ hypothesis.
2. “The number of crimes committed in urban areas will differ from the number committed in rural areas” is an example of a(n) ________________ hypothesis and it is _________________ (directional/nondirectional).
3. “The number of crimes committed in urban areas will be greater than the number committed in rural areas” is an example of a(n) ________________ hypothesis and it is _________________ (directional/nondirectional).
4. “Males are more likely than females to physically bully their classmates.” This is a ___________________ (directional/nondirectional) alternative hypothesis.
5. Define a sampling distribution for the following hypothesis: There is no difference in the percentage of income spent on housing by elderly households and the percentage of income spent on housing by all households. Hint: First name the percentage spent by all households (estimate a reasonable percentage).
_____________________________________________________________
6. In the figures below, the numbers on the x-axis are standard deviation units away from the mean. For example, −2 = 2 SD’s below the M, while 1 = 1 SD above the M.
Figure A: Draw the region of rejection and region of acceptance for a two-tailed test where p < .05.
Figure B: Draw the region of rejection and region of acceptance for a one-tailed test where p < .05.
0 1 2 3–3
A B
–2 –1 0 1 2 3–3 –2 –1
7. List the seven steps that you would follow to test the following hypothesis: “Males are more likely than females to physically bully their classmates.” Make your steps relevant to this specific study (e.g., state the null and alternative hypotheses for this study).
a.b.
Copyright ©2019 by SAGE Publications, Inc. This work may not be reproduced or distributed in any form or by any means without express written permission of the publisher.
Do not
copy
, pos
t, or d
istrib
ute

CHAPTER 6 BEYOND DESCRIPTIVES 91
c.d.e.f.g.
8. Which of the following p values would meet the criteria for statistical significance at p < .05? Circle them.
.001 .05 .006 .50 .047 .20 .02 .07 .70
9. If you find that, in your sample, girls verbally bully their classmates more often than boys (p = .04),
a. Are the results statistically significant?___________________
b. Would you reject or retain the null hypothesis? ____________________
c. What is the probability of a Type I error? ______ Type II error? _____
d. Name two ways you could reduce your chance of a Type I error in the study.i.ii.
10. If you find, in your sample, that males physically bully their classmates more often than girls (p = .07),
a. Are the results statistically significant?___________________
b. Would you reject or retain the null hypothesis? ____________________
c. Is there a probability of a Type I error? ______ Type II error? ______
11. Two studies were conducted on bullying at an elementary school. Study 1 selected a convenience sample of 10 boys and 10 girls from grades K–5. Study 2 selected a convenience sample of 25 boys and 25 girls from the fourth grade.
Which study is likely to have more power? _______ Why? (Hint: There are two reasons.)a.b.
Copyright ©2019 by SAGE Publications, Inc. This work may not be reproduced or distributed in any form or by any means without express written permission of the publisher.
Do not
copy
, pos
t, or d
istrib
ute

92 STUDENT STUDY GUIDE FOR RESEARCH METHODS, STATISTICS, AND APPLICATIONS
Exercise 6.4: Effect size, Confidence Intervals, and Practical Significance (Review)
1. The magnitude of an effect in a study is the ____________________.
2. The margin of error in a study is defined by the ______________________.
3. The everyday usefulness of results is the ___________________________.
4. The effect size used to examine mean differences and measured in standard deviation units is called ___________________________.
5. Another way to measure the effect size is the ________________________.
6. Fill in the table, but remember that these numbers are guidelines and not designed to be strict cutoffs.
Interpretation of Effect Size Effect Size: Cohen’s d
Effect Size: Proportion of Variability
Accounted for
Small/Weak
Medium/Moderate
Large/Strong
Exercise 6.5: Effect size, Confidence Intervals, and Practical Significance (Application)
1. Interpret each of the following effect sizes as weak, moderate, or strong:
a. 2% of the variability accounted for _______________________________
b. 50% of the variability accounted for ______________________________
c. d = .48 ____________________________________________________
d. d = 1.20 ___________________________________________________
e. d = .12 ____________________________________________________
f. 10% of the variability accounted for ______________________________
g. d = .25 ____________________________________________________
2. A teacher reports that exam grades ranged from 64% to 98%, with a mean of 79.85 (SD = 10.18), 95% CI [75.09, 84.61]. The confidence interval tells you that you are _______________ confident that the sample mean of _______________ represents a population mean that falls between _____________ and ___________________________________________.
Copyright ©2019 by SAGE Publications, Inc. This work may not be reproduced or distributed in any form or by any means without express written permission of the publisher.
Do not
copy
, pos
t, or d
istrib
ute

CHAPTER 6 BEYOND DESCRIPTIVES 93
3. Another teacher reports exam scores based on academic year.
First-year students: M = 75.25, SD = 5.16, 95% CI [71.70, 78.88]
Second-year students: M = 80.33, SD = 7.33, 95% CI [74.11, 86.55]
a. Do the confidence intervals for the population means overlap? ________
b. A second-year student brags that their year outperformed first-year students. Based on the confidence intervals, how might you counter this student’s claim?
__________________________________________________________
__________________________________________________________
__________________________________________________________
c. What would you say about the practical significance of these results?
__________________________________________________________
__________________________________________________________
__________________________________________________________
Exercise 6.6: The Big Picture: Making Sense of Results (Application)
1. What are the benefits of reporting each of the following in describing the results of a study?
a. Statistical significance ________________________________________
__________________________________________________________
b. Effect size _________________________________________________
__________________________________________________________
__________________________________________________________
c. Confidence interval __________________________________________
__________________________________________________________
__________________________________________________________
d. Practical significance _________________________________________
__________________________________________________________
__________________________________________________________
Copyright ©2019 by SAGE Publications, Inc. This work may not be reproduced or distributed in any form or by any means without express written permission of the publisher.
Do not
copy
, pos
t, or d
istrib
ute

94 STUDENT STUDY GUIDE FOR RESEARCH METHODS, STATISTICS, AND APPLICATIONS
2. Statistical significance, effect size, confidence intervals, and practical significance ______________ (can/cannot) vary independently.
3. A study examined whether convenience affected recycling behavior. The researchers operationally defined recycling behavior based on the weight (in pounds) of material recycled by each household. They found that households who were supplied a large recycling bin and weekly pickup (M = 25.00, SD = 5.00, 95% CI [20.25, 29.75]) recycled significantly more material than the households who were sent flyers encouraging them to recycle (M = 10.00, SD = 4.00, 95% CI [6.50, 13.50], p = .003). Convenience accounted for 22% of the variance in recycling.
a. Explain what the p value indicates and how you would interpret it.
__________________________________________________________
__________________________________________________________
b. Interpret the effect size.
__________________________________________________________
__________________________________________________________
c. Interpret the confidence intervals.
__________________________________________________________
__________________________________________________________
d. Interpret the practical significance of the study.
__________________________________________________________
__________________________________________________________
4. The researchers replicated the study in a different city and found that those supplied with a recycling bin (M = 25.00, SD = 7.00, 95% CI [16.20, 33.80]), recycled more than those who were just given an informational flyer (M = 10.00, SD = 5.50, 95% CI [2.50, 17.50]). This time, they found that p = .10, Cohen’s d = .25.
a. Explain what the p value indicates and how you would interpret it.
__________________________________________________________
__________________________________________________________
b. Interpret the effect size.
__________________________________________________________
__________________________________________________________
Copyright ©2019 by SAGE Publications, Inc. This work may not be reproduced or distributed in any form or by any means without express written permission of the publisher.
Do not
copy
, pos
t, or d
istrib
ute

CHAPTER 6 BEYOND DESCRIPTIVES 95
c. Interpret the confidence intervals.
__________________________________________________________
__________________________________________________________
d. Interpret the practical significance of the study.
__________________________________________________________
__________________________________________________________
5. Which of the two recycling studies
a. Found statistically significant results? Explain your answer.
__________________________________________________________
__________________________________________________________
b. Had a stronger effect size? Explain your answer.
__________________________________________________________
__________________________________________________________
__________________________________________________________
__________________________________________________________
c. Has more practical significance? Explain your answer.
__________________________________________________________
__________________________________________________________
__________________________________________________________
__________________________________________________________
__________________________________________________________
__________________________________________________________
YOUR RESEARCH
Find a primary research article on your topic. If possible, find an article that has a simple design. If the article describes multiple studies, pick one of the studies as the focus of this exercise. Before beginning to work on this section, look through the entire article.
You will see that in order to answer these questions, you will have to read the arti-cle very carefully and probably several times. This practice should give you some idea of the care that you should take in digesting research. Even though you need to take a lot of time to read articles, you may end up summarizing the article in your own literature
Copyright ©2019 by SAGE Publications, Inc. This work may not be reproduced or distributed in any form or by any means without express written permission of the publisher.
Do not
copy
, pos
t, or d
istrib
ute

96 STUDENT STUDY GUIDE FOR RESEARCH METHODS, STATISTICS, AND APPLICATIONS
review with a single sentence or by simply citing the article because of the measure you use from the study or for the procedure you adopt. But by attending to the details of published articles, you will learn a great deal about the format for reporting research, different methods for conducting research, various ways to analyze data, and appropri-ate interpretations of statistics. All of this will support you as you learn to design, carry out, analyze, and report your own studies.
1. Focus on the Introduction of the article.
a. Identify one hypothesis that most interests you. (Remember that it is important to learn how to write about research in your own words. Be sure that you do not plagiarize in writing the hypothesis!)
__________________________________________________________
__________________________________________________________
b. Is the hypothesis directional or nondirectional? How do you know?
__________________________________________________________
__________________________________________________________
2. Now examine the Method section.
What do you learn about the sample and procedure of the study that may help the researchers to avoid Type II errors (e.g., sample size, error in the research design, strength of effect)? You may want to review the section “Reducing the Chance of a Type II Error” in Chapter 6 before answering this question.
Sample:
_____________________________________________________________
_____________________________________________________________
_____________________________________________________________
Research design:
_____________________________________________________________
_____________________________________________________________
_____________________________________________________________
Strength of effect:
_____________________________________________________________
_____________________________________________________________
_____________________________________________________________
Copyright ©2019 by SAGE Publications, Inc. This work may not be reproduced or distributed in any form or by any means without express written permission of the publisher.
Do not
copy
, pos
t, or d
istrib
ute

CHAPTER 6 BEYOND DESCRIPTIVES 97
3. Review the Results section of the article. Even though there may be statistics you do not understand, focus on the statistics that you are familiar with: M, SD, range, possible and observed scores, p, percentage of variability accounted for (could be noted as r 2, rpb
2, η2), Cohen’s d, confidence intervals. Consider the hypothesis you selected in question 1 and answer the following questions regarding the analyses used to test this hypothesis.
a. Did the author(s) report any descriptive statistics (e.g., M, SD) related to the hypothesis you selected? ___________ If yes, explain what the descriptive statistics tell you about the variable(s) under examination.
__________________________________________________________
__________________________________________________________
__________________________________________________________
b. Did the researchers find statistically significant results for the hypothesis you noted in question 1? Explain.
__________________________________________________________
__________________________________________________________
c. Is there a probability of a Type I error? ___________ If yes, what is the exact probability? ____________________ Is there a probability of a Type II error? ___________
d. Did the authors report an effect size? _______ If yes, list it here and interpret its meaning.
__________________________________________________________
__________________________________________________________
e. Did the authors include a confidence interval for their findings? ______. If yes, list the confidence interval(s) and interpret the meaning.
__________________________________________________________
__________________________________________________________
__________________________________________________________
__________________________________________________________
4. Reread the Discussion section.
a. Did the authors indicate that they found support for the hypothesis you selected?
__________________________________________________________
Copyright ©2019 by SAGE Publications, Inc. This work may not be reproduced or distributed in any form or by any means without express written permission of the publisher.
Do not
copy
, pos
t, or d
istrib
ute

98 STUDENT STUDY GUIDE FOR RESEARCH METHODS, STATISTICS, AND APPLICATIONS
b. How do they interpret the meaning of the support or nonsupport for their hypothesis?
__________________________________________________________
__________________________________________________________
__________________________________________________________
c. What do the researchers state or imply about the practical significance of their study? They may not use the term practical significance; instead, they may discuss the implications or usefulness of their results.
__________________________________________________________
__________________________________________________________
__________________________________________________________
__________________________________________________________
__________________________________________________________
__________________________________________________________
d. Researchers also discuss limitations of their study in the Discussion. Do you see any limitations they mention that you can relate to the possibility of Type I or Type II errors? How do the authors suggest that future researchers should address or overcome these limitations?
__________________________________________________________
__________________________________________________________
__________________________________________________________
__________________________________________________________
__________________________________________________________
__________________________________________________________
__________________________________________________________
__________________________________________________________
As you read other primary research articles on your topic, we recommend you use some or all of these questions to help you evaluate the research.
Copyright ©2019 by SAGE Publications, Inc. This work may not be reproduced or distributed in any form or by any means without express written permission of the publisher.
Do not
copy
, pos
t, or d
istrib
ute
CHAPTER 6 BEYOND DESCRIPTIVES 99
IBM® SPSS® DATA ANALYSIS AND INTERPRETATION
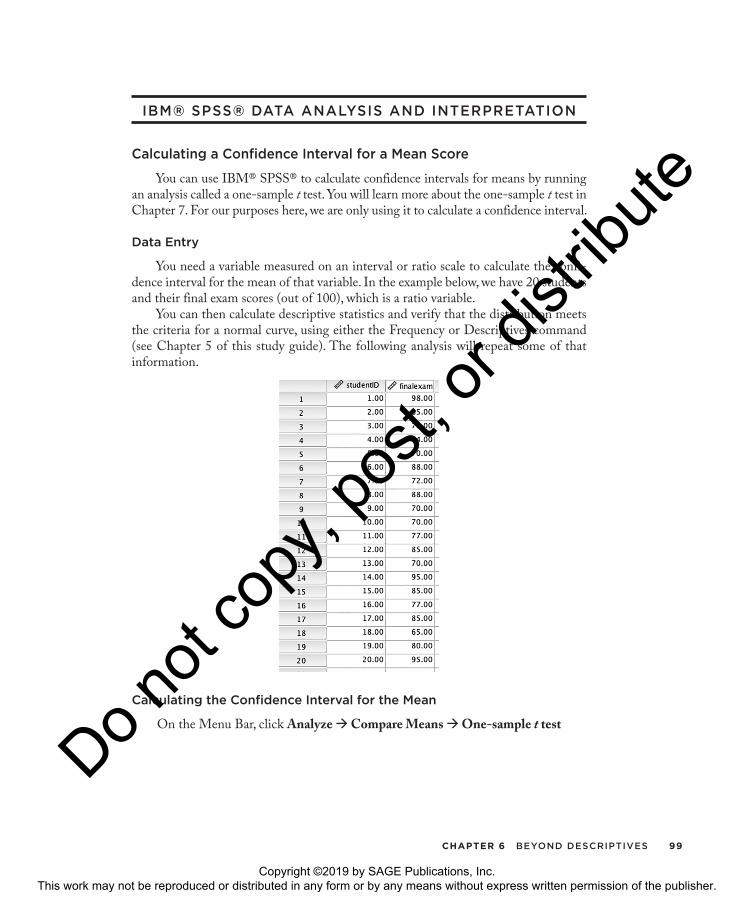
Calculating a Confidence Interval for a Mean Score
You can use IBM® SPSS® to calculate confidence intervals for means by running an analysis called a one-sample t test. You will learn more about the one-sample t test in Chapter 7. For our purposes here, we are only using it to calculate a confidence interval.
Data Entry
You need a variable measured on an interval or ratio scale to calculate the confi-dence interval for the mean of that variable. In the example below, we have 20 students and their final exam scores (out of 100), which is a ratio variable.
You can then calculate descriptive statistics and verify that the distribution meets the criteria for a normal curve, using either the Frequency or Descriptives command (see Chapter 5 of this study guide). The following analysis will repeat some of that information.
Calculating the Confidence Interval for the Mean
On the Menu Bar, click Analyze ‡ Compare Means ‡ One-sample t test
Copyright ©2019 by SAGE Publications, Inc. This work may not be reproduced or distributed in any form or by any means without express written permission of the publisher.
Do not
copy
, pos
t, or d
istrib
ute

100 STUDENT STUDY GUIDE FOR RESEARCH METHODS, STATISTICS, AND APPLICATIONS
1. Send the variable from the sample to “Test Variable(s).”
2. To calculate a confidence interval, leave the test value as 0.
(Note: the default is a 95%confidence interval, to change this, click “Options.”)
3. Click “OK.”
OUTPUT
One-Sample Statistics
N MeanStd.
DeviationStd. Error
Mean
finalexam 20 79.8500 10.17880 2.27605
One-Sample Test
Test Value = 0
t df Sig. (2-tailed) Mean Difference
95% Confidence Interval of the Difference
Lower Upper
finalexam 35.083 19 .000 79.85000 75.0862 84.6138
When you are interested in the confidence interval for the mean, focus on the last
two columns of the second table and ignore the rest.
Writing Up Results
When reporting a confidence interval for a mean, include the following:
� The mean and standard deviation (M, SD)
� What confidence level you are using (e.g., 95%, 99%)
� The confidence interval, typically but not always, is formatted as CI [lower, upper]
You may also opt to include other descriptive information, such as the sample size or minimum and maximum scores or other information you gained from conducting descriptive statistics (see Chapter 5 of this study guide).
The first table provides
descriptive statistics for the
sample.
Copyright ©2019 by SAGE Publications, Inc. This work may not be reproduced or distributed in any form or by any means without express written permission of the publisher.
Do not
copy
, pos
t, or d
istrib
ute

CHAPTER 6 BEYOND DESCRIPTIVES 101
Examples:
Twenty students completed a final exam. The mean score was 79.85 (SD = 10.18), 95% CI [75.09, 84.61].
OR
Student scores on the final exam ranged from 64 to 98 out of 100 possible (M = 79.85, SD = 10.18), 95% CI [75.09, 84.61].
OR
Final exam scores for 20 students indicated an average score of C+/B- (M = 79.85, SD = 10.18). At a 95% confidence level, we estimate that the population mean falls between 75.09 and 84.61.
Review and Practice Exercise
One evening, two waiters record what percentage of the bill their first 10 customers left as tips:
Waiter 1 Waiter 2
.15 .18
.16 .12
.15 .25
.12 .30
.18 .15
.22 .10
.15 .20
.25 .18
.20 .22
.14 .15
1. Review: Enter the data into SPSS.
2. Review: Using SPSS, calculate the appropriate descriptive statistics to describe the tip percentage for the entire sample. Write the statistics below.
_____________________________________________________________
3. Review: Using SPSS, calculate the appropriate descriptive statistics to compare the two waiters’ tip percentages. Write the statistics below.
_____________________________________________________________
_____________________________________________________________
Copyright ©2019 by SAGE Publications, Inc. This work may not be reproduced or distributed in any form or by any means without express written permission of the publisher.
Do not
copy
, pos
t, or d
istrib
ute

102 STUDENT STUDY GUIDE FOR RESEARCH METHODS, STATISTICS, AND APPLICATIONS
4. Practice with confidence intervals: Using SPSS, calculate the confidence interval for the entire sample mean and for each waiter separately. Write the intervals below.
_____________________________________________________________
_____________________________________________________________
_____________________________________________________________
5. Write up your results using correct APA format. Include a brief interpretation of the results based on the confidence interval.
_____________________________________________________________
_____________________________________________________________
_____________________________________________________________
_____________________________________________________________
_____________________________________________________________
_____________________________________________________________
_____________________________________________________________
_____________________________________________________________
_____________________________________________________________
6. What is the practical significance of the results? What other information would be useful in understanding the practical significance?
_____________________________________________________________
_____________________________________________________________
_____________________________________________________________
Copyright ©2019 by SAGE Publications, Inc. This work may not be reproduced or distributed in any form or by any means without express written permission of the publisher.
Do not
copy
, pos
t, or d
istrib
ute