making colombia's tax system more efficient fair and green_eco wp
TRANSCRIPT
Please cite this paper as:
Daude, C., S. Perret and B. Brys (2015), “Making Colombia'sTax Policy More Efficient, Fair and Green”, OECD EconomicsDepartment Working Papers, No. 1234, OECD Publishing,Paris.http://dx.doi.org/10.1787/5js0cqs9605g-en
OECD Economics Department WorkingPapers No. 1234
Making Colombia's TaxPolicy More Efficient, Fairand Green
Christian Daude, Sarah Perret, Bert Brys
JEL Classification: H24, H25, H26
Unclassified ECO/WKP(2015)52 Organisation de Coopération et de Développement Économiques Organisation for Economic Co-operation and Development 28-May-2015
___________________________________________________________________________________________
_____________ English - Or. English ECONOMICS DEPARTMENT
MAKING COLOMBIA’S TAX POLICY MORE EFFICIENT, FAIR AND GREEN
By Christian Daude, Sarah Perret and Bert Brys
ECONOMICS DEPARTMENT WORKING PAPERS No. 1234
OECD Working Papers should not be reported as representing the official views of the OECD or of its member
countries. The opinions expressed and arguments employed are those of the author(s).
Authorised for publication by Robert Ford, Deputy Director, Country Studies Branch, Economics Department.
All Economics Department Working Papers are available at www.oecd.org/eco/workingpapers
JT03377319
Complete document available on OLIS in its original format
This document and any map included herein are without prejudice to the status of or sovereignty over any territory, to the delimitation of
international frontiers and boundaries and to the name of any territory, city or area.
EC
O/W
KP
(20
15)5
2
Un
classified
En
glish
- Or. E
ng
lish
ECO/WKP(2015)52
2
OECD Working Papers should not be reported as representing the official views of the OECD or of its member countries. The opinions expressed and arguments employed are those of the author(s).
Working Papers describe preliminary results or research in progress by the author(s) and are published to stimulate discussion on a broad range of issues on which the OECD works.
Comments on Working Papers are welcomed, and may be sent to the Economics Department, OECD, 2 rue André-Pascal, 75775 Paris Cedex 16, France, or by e-mail to [email protected].
This document and any map included herein are without prejudice to the status of or sovereignty over any territory, to the delimitation of international frontiers and boundaries and to the name of any territory, city or area. The statistical data for Israel are supplied by and under the responsibility of the relevant Israeli authorities. The use of such data by the OECD is without prejudice to the status of the Golan Heights, East Jerusalem and Israeli settlements in the West Bank under the terms of international law. © OECD (2015)
You can copy, download or print OECD content for your own use, and you can include excerpts from OECD publications, databases and multimedia products in your own documents, presentations, blogs, websites and teaching materials, provided that suitable acknowledgment of OECD as source and copyright owner is given. All requests for commercial use and translation rights should be submitted to [email protected]
ECO/WKP(2015)52
3
ABSTRACT/RÉSUMÉ
Making Colombia’s Tax Policy More Efficient, Fair and Green
Tax revenues at 20% of GDP remain low compared to other Latin American countries and
the OECD average and tax evasion is pervasive. Lower oil revenues and the expiration of a
number of taxes are putting strains on the budget at a time when social and development
spending needs are rising. Heavy reliance on corporate income taxes reduces investment. At
the same time, the redistributive impact of taxation is reduced because most of income and
wealth taxes are paid by firms rather than households. Therefore, Colombia needs a
comprehensive tax reform that boosts revenues and shifts the tax burden to support more
inclusive and green growth. Tax loopholes and exemptions that reduce the tax base and
favour mainly the rich should be reduced significantly. Strengthening the tax administration
will help reduce evasion.
This Working Paper relates to the 2014 OECD Economic Survey of Colombia.
(www.oecd.org/eco/surveys/economic-survey-colombia.htm)
JEL classification codes: H24; H25; H26
Keywords: tax policy, corporate income tax, personal income tax, tax evasion, green taxation
*********************************
Axer davantage les politiques fiscales sur l’efficacité, l’équité et l’écologie
Les recettes fiscales de la Colombie, qui s’élèvent à 20% du PIB, sont faibles en comparaison d'autres
pays d'Amérique latine ou de la moyenne de l'OCDE, et la fraude fiscale est généralisée dans le pays. La
baisse des recettes pétrolières et la suppression d’un certain nombre d’impôts et de taxes exercent une
pression budgétaire alors même que les besoins de financement des mesures de développement et de
progrès social sont en hausse. Le système fiscal repose largement sur l’impôt sur les bénéfices des sociétés,
ce qui décourage l'investissement. En parallèle, les effets redistributifs de la fiscalité sont limités du fait
que l’essentiel de la fiscalité sur les revenus et le patrimoine est supporté par les entreprises et non par les
ménages. En conséquence, la Colombie doit réformer l’ensemble de sa fiscalité, afin d’augmenter les
recettes et de déplacer la charge fiscale pour favoriser une croissance plus inclusive et plus verte. Les
nombreuses niches fiscales et exonérations qui réduisent la base imposable et avantagent essentiellement
les plus riches devraient être limitées de manière significative. Le renforcement de l'administration de
l’impôt permettra de réduire la fraude.
Ce document de travail se rapporte à l’Étude économique 2014 de l’OCDE sur la Colombie.
(www.oecd.org/fr/eco/etudes/etude-economique-colombie.htm).
Classification JEL : H24; H25; H26
Mots clés : politique fiscale, impôt sur le revenu des sociétés, impôt sur le revenu des particuliers, évasion
fiscale, fiscalité verte.
ECO/WKP(2015)52
4
TABLE OF CONTENTS
MAKING COLOMBIA’S TAX POLICY MORE EFFICIENT, FAIR AND GREEN ............................... 7
Main trends and characteristics of the tax system ...................................................................................... 7 Tax revenues in Colombia are low .................................................................................................... 7 More revenues are needed to meet social and development needs ............................................ 7 The current tax mix is inefficient and regressive ......................................................................... 8
Making the tax system more efficient ...................................................................................................... 12 Colombia levies a high dual tax on corporate income ................................................................. 12 Generous tax benefits and special regimes reduce corporate tax revenues ............................. 14 Colombia’s free trade zone regime is particularly distortive ............................................................ 15 VAT on fixed assets discourages investment .............................................................................. 16 The business wealth tax can deter future investment ............................................................... 16 Colombia maintains a distortive financial transaction tax ...................................................... 17
Towards a more progressive tax system ................................................................................................... 18 VAT remains relatively regressive despite exemptions on basic foodstuffs ......................... 20 Personal income tax: A few paying too little ................................................................................ 21 Tax exemptions benefit the rich and reduce revenues ..................................................................... 22 The taxation of personal capital income is low ............................................................................... 22
Tackling tax evasion ................................................................................................................................. 24 Tax evasion is widespread ................................................................................................................ 24 Strengthening the tax administration to fight tax evasion ......................................................... 25 A voluntary disclosure programme of unreported income and wealth could increase
tax compliance ..................................................................................................................................... 26 Making the tax system greener ................................................................................................................. 27
Environmentally related tax revenues are low ............................................................................. 27 Eliminating the gasoline-diesel taxation differential and taxing fuels
beyond transportation ....................................................................................................................... 28 Price stabilisation schemes act as implicit fossil fuel subsidies ................................................... 29 Better targeting support for poor families .............................................................................................. 29 A carbon tax would deal with emissions in a cost-efficiency way ......................................... 29
Strengthening fiscal relations across levels of government ..................................................................... 29 Towards co-ordinating better the revenue and royalty sharing systems ................................................ 31 Subnational fiscal sustainability works but risk sharing can be improved ............................ 32 There is room to raise more local property taxes and simplify the tax system .................... 32
Towards a comprehensive reform of the tax system ................................................................................ 34
BIBLIOGRAPHY ....................................................................................................................................... 36
ECO/WKP(2015)52
5
Tables
1. Costs of capital and marginal corporate effective tax rates (METR) in Colombia ................................ 17 2. Tax rates on gasoline and diesel, selected Latin American countries and OECD average .................... 28
Figures
1. Tax effort has stagnated in recent years.............................................................................................. 8 3. The share of natural-resource related revenues in GDP has accelerated .......................................... 10 4. Tax revenue composition in 2012 ..................................................................................................... 10 5. Top statutory corporate income rates in OECD and Latin American countries ............................... 13 6. Taxation has little redistributive power ............................................................................................ 19 7. Taxes in Colombia are less progressive compared to Mexico .......................................................... 19 8. Colombia’s standard VAT rate is relatively low .............................................................................. 20 9. The personal income tax levies little revenue in part due to a high minimum exemption level ....... 21 10. Combined statutory tax rates on dividends ....................................................................................... 23 11. There is room to strengthen the tax administration .......................................................................... 25 12. Environmentally related taxes are low ............................................................................................. 27 13. Income per capita inequality across regions is high ......................................................................... 30 14. Composition of subnational (municipal and departmental) revenues............................................... 31
Boxes
1. Tax effort estimates for Colombia ......................................................................................................... 9 2. Tax policy changes approved for 2015-18 ........................................................................................... 11 3. Main aspects of the 2012 tax reform ...................................................................................................... 12 4. Marginal corporate effective tax rates and cost of capital in Colombia under different scenarios ........ 13 5. Evaluating subnational fiscal sustainability ........................................................................................... 33
Recommendations
Recommendations on tax policy ................................................................................................................ 35

ECO/WKP(2015)52
6
ECO/WKP(2015)52
7
MAKING COLOMBIA’S TAX POLICY MORE EFFICIENT, FAIR AND GREEN
By Christian Daude, Sarah Perret and Bert Brys1
Main trends and characteristics of the tax system
1. The Colombian tax system does not promote efficiency and fairness and is very complex. High
levels of informality in the economy constrain tax administration and enforcement, and explain to some
extent why personal income and wealth taxation is such a limited source of tax revenue, while the tax
burden on firms is very high. In the past, the internal armed conflict has also made it difficult to tax land
and activities in the agricultural sector. To compensate firms and individuals for the distortive and
regressive tax structure, successive governments have introduced special regimes and tax
exemptions increasing the complexity of the system, while doing little to effectively reduce inequalities. As
all these elements interact, a comprehensive approach to tax reform will be the most effective way to
change the tax system into the desired direction of raising revenues in a way that stimulates investment and
sustainable growth, reduces distortions and increases fairness.
Tax revenues in Colombia are low
2. Tax revenues have been increasing gradually over time during the last decade, but at 20% of
GDP remain low compared to other Latin American countries and the OECD average. Estimates of the tax
effort – actual revenue collection compared to potential in view of GDP per capita, trade openness and the
economic structure – is 82%, which implies that potential tax revenues are close to 24% of GDP (Box 1).
The effort remains below potential even when adjusted for non-tax revenues from royalties or mandatory
contributions to private pension schemes, which are usually not considered tax revenues (IADB, 2013).
Furthermore, the tax effort has stagnated since 2006 (Figure 1).
More revenues are needed to meet social and development needs
3. The rising share in GDP of oil and mining-related revenues – royalties, but especially dividends
from Ecopetrol and income tax paid by mining companies – over the past decade has increased the
dependency of the budget on mining sector developments (Figure 3). Most of these revenues stem from
hydrocarbons, with the rest mainly from coal mining. However, the resource boom, especially in oil and
coal, is expected to be relatively short-lived, with oil production estimated to peak around 2015-17
(Ministry of Mining and Energy, 2012). Revenues from Ecopetrol are already falling, as supply
constraints in production and other factors will reduce its dividend payments to the central government by
around half a percentage point of GDP in 2014 and 2015. Lower oil prices and rising production costs
are squeezing profits in the oil and mining sector. Therefore, taxing the sector more – e.g. by introducing
an excess profit tax – would not bring more revenues in the short term, in addition to the challenges it
1. Christian Daude is head of the Colombia desk in the OECD Economics Department; Sarah Perret is a tax
economist in the OECD Centre for Tax Policy and Administration and Bert Brys is head of the personal
and property tax unit and the country tax policy team in the OECD Centre for Tax Policy and
Administration. This paper is based on Chapter 1 of the 2015 OECD Economic Survey of Colombia,
published in January 2015 under the authority of the Economic and Development Review Committee
(EDRC). The authors are grateful to David Bradbury, Christine de la Maisonneuve, Robert Ford, Alvaro
Pereira, and Piritta Sorsa, for their useful comments on earlier drafts. Special thanks go to Guillaume
Bousquet for his valuable data processing contributions and assistance with tables and graphs, as well as
Anthony Bolton and Inés Gómez-Palacio for excellent editorial assistance.

ECO/WKP(2015)52
8
might pose in terms of implementation. Furthermore, as it is common practice in OECD countries,
mining and other types of royalty payments can be deducted from the corporate income tax base in
Colombia, such that higher royalties would reduce the income tax paid by oil and mining companies. This
puts pressure to find alternative sources of tax revenue to fund public spending, especially in municipalities
that now depend on royalty revenues. Preparing the central government tax system for the period when the
resource-related revenues start to decline would allow a smooth transition.
Figure 1. Tax effort has stagnated in recent years
1. Tax effort is the ratio between the observed tax to GDP ratio and the predicted levels according to the seven alternative econometric specifications. Average, maximum and minimum levels refer to the annual values across the seven alternative estimates (Box 1).
Source: Own calculations based on OECD Revenue Statistics; OECD/ECLAC/CIAT (2013), Revenue Statistics in Latin America: 1990-2012; and World Bank, World Development Indicators database.
4. The expiration of a number of other revenue sources also put strains on the budget at a time
when social and development spending needs are rising. The expiration of a temporary wealth tax at
the end of 2014, and the phasing out of the financial transaction tax between 2015 and 2017 – would
reduce revenues by around 0.6% and 0.8% of GDP, respectively. At the same time, additional spending
pressures are likely to arise from planned expansions of social policies and a potential peace deal with
guerrilla groups.
5. The fiscal rule requires the structural central government deficit to decline gradually from 2.3%
in 2014 to 1% of GDP in 2025. Achieving this fiscal consolidation, without large cuts in spending, will
require a major overhaul of the Colombian tax system to raise more revenue. Congress passed a law in
December 2014, which among others extend wealth and financial transactions taxes for another four years,
to deal with the revenue shortfall in the next four years (Box 2), but a more comprehensive approach
is needed, given the challenges of the tax system in terms of efficiency and fairness.
The current tax mix is inefficient and regressive
6. The tax structure is biased towards indirect or consumption taxes. In principle, this makes the
system more growth friendly, but regressive (Figure 4, Panel A). However, the heavy reliance on corporate
income taxes (CIT) among the direct taxes may affect the ability to sustain the high level of investment and
incentives for formal sector work (Arnold et al., 2012). The redistributive impact of taxation is also
reduced by the fact that most of the income and wealth taxes are paid by firms rather than households. For
example, households account only for around 5% of the wealth tax revenues.
ECO/WKP(2015)52
9
Box 1. Tax effort estimates for Colombia
Differences in tax revenue across countries depend on structural characteristics and explanatory variables such as GDP per capita, trade openness and the sectorial composition of GDP. In general, high levels of development, trade openness and the size of the manufacturing sector are associated with higher tax revenues (Pessino and Fenochietto, 2010). Estimates for Colombia based on the following equation with a variety of econometric techniques for a sample of 45 OECD and Latin American economies show large shortfalls:
𝑇𝑎𝑥
𝐺𝐷𝑃𝑖𝑡= 𝛼 + 𝛽𝑙𝑛(𝐺𝐷𝑃 𝑝𝑒𝑟 𝑐𝑎𝑝𝑖𝑡𝑎)𝑖𝑡 + 𝛾𝐼𝑛𝑑𝑢𝑠𝑡𝑟𝑦 𝑠ℎ𝑎𝑟𝑒 𝑖𝑛 𝐺𝐷𝑃𝑖𝑡 + 𝜃
𝑇𝑟𝑎𝑑𝑒
𝐺𝐷𝑃 𝑖𝑡+ 𝜀𝑖𝑡
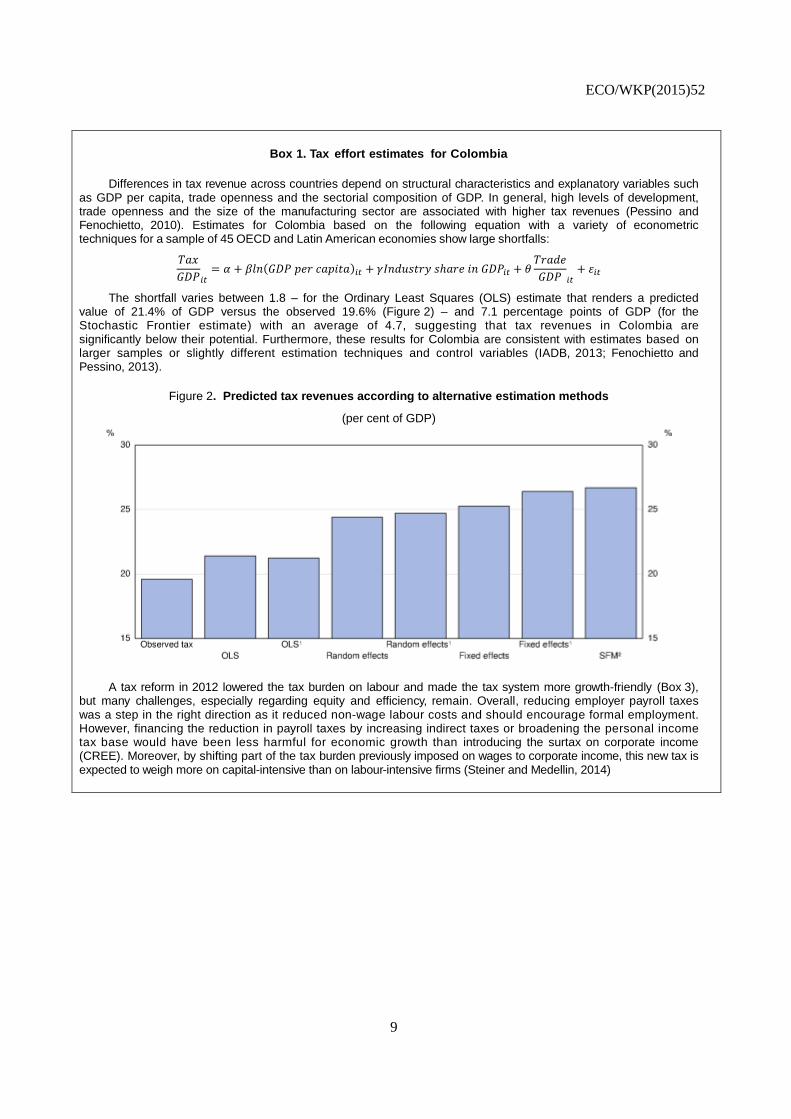
The shortfall varies between 1.8 – for the Ordinary Least Squares (OLS) estimate that renders a predicted value of 21.4% of GDP versus the observed 19.6% (Figure 2) – and 7.1 percentage points of GDP (for the Stochastic Frontier estimate) with an average of 4.7, suggesting that tax revenues in Colombia are significantly below their potential. Furthermore, these results for Colombia are consistent with estimates based on larger samples or slightly different estimation techniques and control variables (IADB, 2013; Fenochietto and Pessino, 2013).
Figure 2. Predicted tax revenues according to alternative estimation methods
(per cent of GDP)
A tax reform in 2012 lowered the tax burden on labour and made the tax system more growth-friendly (Box 3), but many challenges, especially regarding equity and efficiency, remain. Overall, reducing employer payroll taxes was a step in the right direction as it reduced non-wage labour costs and should encourage formal employment. However, financing the reduction in payroll taxes by increasing indirect taxes or broadening the personal income tax base would have been less harmful for economic growth than introducing the surtax on corporate income (CREE). Moreover, by shifting part of the tax burden previously imposed on wages to corporate income, this new tax is expected to weigh more on capital-intensive than on labour-intensive firms (Steiner and Medellin, 2014)

ECO/WKP(2015)52
10
Figure 3. The share of natural-resource related revenues in GDP has accelerated
(in per cent of GDP)
Source: DIAN, SIMCO and ANH.
Figure 4. Tax revenue composition in 2012
Source: OECD Revenue Statistics database; and OECD/ECLAC/CIAT (2013), Revenue Statistics in Latin America: 1990-2012.
ECO/WKP(2015)52
11
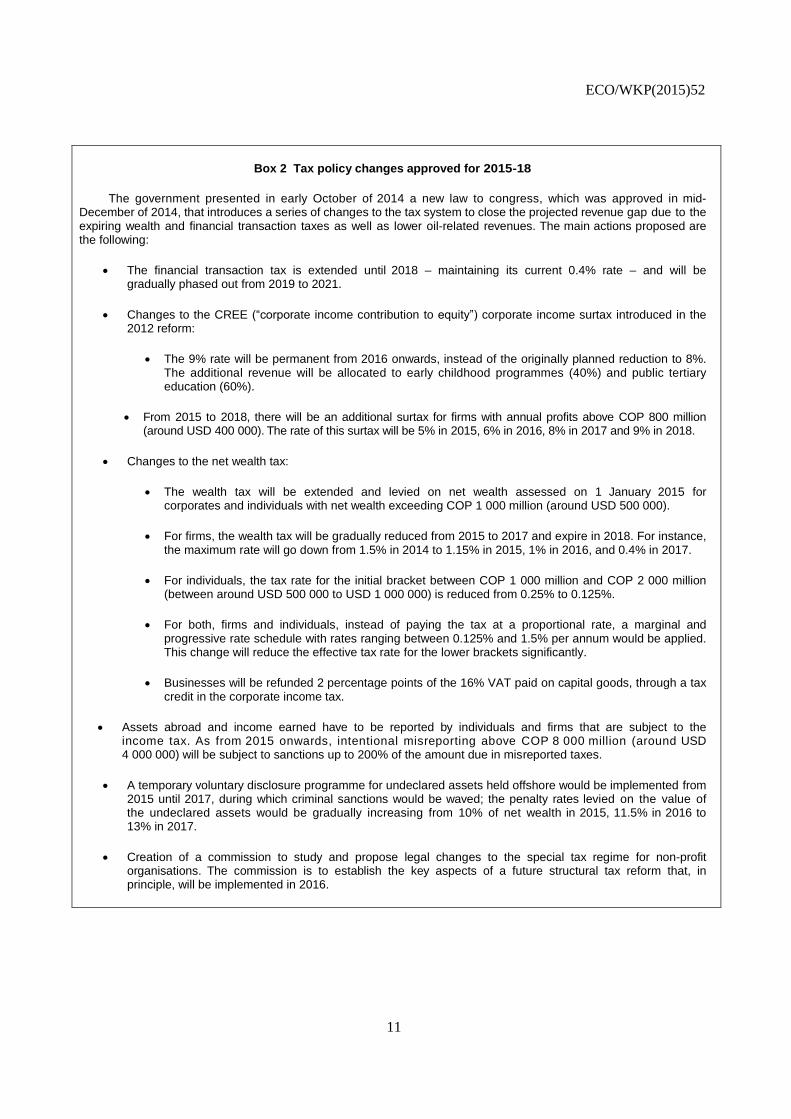
Box 2 Tax policy changes approved for 2015-18
The government presented in early October of 2014 a new law to congress, which was approved in mid-December of 2014, that introduces a series of changes to the tax system to close the projected revenue gap due to the expiring wealth and financial transaction taxes as well as lower oil-related revenues. The main actions proposed are the following:
The financial transaction tax is extended until 2018 – maintaining its current 0.4% rate – and will be gradually phased out from 2019 to 2021.
Changes to the CREE (“corporate income contribution to equity”) corporate income surtax introduced in the 2012 reform:
The 9% rate will be permanent from 2016 onwards, instead of the originally planned reduction to 8%. The additional revenue will be allocated to early childhood programmes (40%) and public tertiary education (60%).
From 2015 to 2018, there will be an additional surtax for firms with annual profits above COP 800 million (around USD 400 000). The rate of this surtax will be 5% in 2015, 6% in 2016, 8% in 2017 and 9% in 2018.
Changes to the net wealth tax:
The wealth tax will be extended and levied on net wealth assessed on 1 January 2015 for corporates and individuals with net wealth exceeding COP 1 000 million (around USD 500 000).
For firms, the wealth tax will be gradually reduced from 2015 to 2017 and expire in 2018. For instance, the maximum rate will go down from 1.5% in 2014 to 1.15% in 2015, 1% in 2016, and 0.4% in 2017.
For individuals, the tax rate for the initial bracket between COP 1 000 million and COP 2 000 million (between around USD 500 000 to USD 1 000 000) is reduced from 0.25% to 0.125%.
For both, firms and individuals, instead of paying the tax at a proportional rate, a marginal and progressive rate schedule with rates ranging between 0.125% and 1.5% per annum would be applied. This change will reduce the effective tax rate for the lower brackets significantly.
Businesses will be refunded 2 percentage points of the 16% VAT paid on capital goods, through a tax credit in the corporate income tax.
Assets abroad and income earned have to be reported by individuals and firms that are subject to the income tax. As from 2015 onwards, intentional misreporting above COP 8 000 million (around USD 4 000 000) will be subject to sanctions up to 200% of the amount due in misreported taxes.
A temporary voluntary disclosure programme for undeclared assets held offshore would be implemented from 2015 until 2017, during which criminal sanctions would be waved; the penalty rates levied on the value of the undeclared assets would be gradually increasing from 10% of net wealth in 2015, 11.5% in 2016 to 13% in 2017.
Creation of a commission to study and propose legal changes to the special tax regime for non-profit organisations. The commission is to establish the key aspects of a future structural tax reform that, in principle, will be implemented in 2016.
ECO/WKP(2015)52
12
7. Revenue mobilisation is concentrated at the national level, despite important expenditure
responsibilities at subnational level, especially at the departmental level. Departments in Colombia have
significant obligations in terms of managing expenditures in education, health, and water sanitation, but
their own revenues are small compared to subnational levels of government in Latin America and OECD
economies (Figure 4, Panel B).
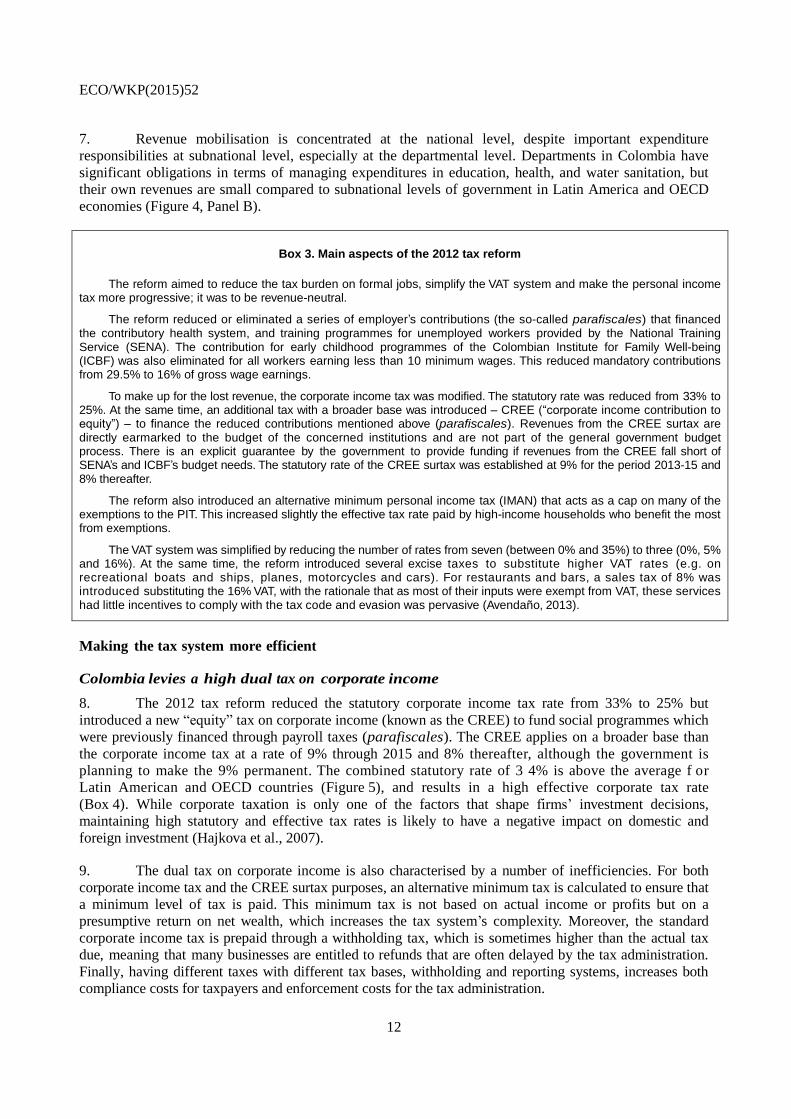
Box 3. Main aspects of the 2012 tax reform
The reform aimed to reduce the tax burden on formal jobs, simplify the VAT system and make the personal income tax more progressive; it was to be revenue-neutral.
The reform reduced or eliminated a series of employer’s contributions (the so-called parafiscales) that financed the contributory health system, and training programmes for unemployed workers provided by the National Training Service (SENA). The contribution for early childhood programmes of the Colombian Institute for Family Well-being (ICBF) was also eliminated for all workers earning less than 10 minimum wages. This reduced mandatory contributions from 29.5% to 16% of gross wage earnings.
To make up for the lost revenue, the corporate income tax was modified. The statutory rate was reduced from 33% to 25%. At the same time, an additional tax with a broader base was introduced – CREE (“corporate income contribution to equity”) – to finance the reduced contributions mentioned above (parafiscales). Revenues from the CREE surtax are directly earmarked to the budget of the concerned institutions and are not part of the general government budget process. There is an explicit guarantee by the government to provide funding if revenues from the CREE fall short of SENA’s and ICBF’s budget needs. The statutory rate of the CREE surtax was established at 9% for the period 2013-15 and 8% thereafter.
The reform also introduced an alternative minimum personal income tax (IMAN) that acts as a cap on many of the exemptions to the PIT. This increased slightly the effective tax rate paid by high-income households who benefit the most from exemptions.
The VAT system was simplified by reducing the number of rates from seven (between 0% and 35%) to three (0%, 5% and 16%). At the same time, the reform introduced several excise taxes to substitute higher VAT rates (e.g. on recreational boats and ships, planes, motorcycles and cars). For restaurants and bars, a sales tax of 8% was introduced substituting the 16% VAT, with the rationale that as most of their inputs were exempt from VAT, these services had little incentives to comply with the tax code and evasion was pervasive (Avendaño, 2013).
Making the tax system more efficient
Colombia levies a high dual tax on corporate income
8. The 2012 tax reform reduced the statutory corporate income tax rate from 33% to 25% but
introduced a new “equity” tax on corporate income (known as the CREE) to fund social programmes which
were previously financed through payroll taxes (parafiscales). The CREE applies on a broader base than
the corporate income tax at a rate of 9% through 2015 and 8% thereafter, although the government is
planning to make the 9% permanent. The combined statutory rate of 3 4% is above the average f or
Latin American and OECD countries (Figure 5), and results in a high effective corporate tax rate
(Box 4). While corporate taxation is only one of the factors that shape firms’ investment decisions,
maintaining high statutory and effective tax rates is likely to have a negative impact on domestic and
foreign investment (Hajkova et al., 2007).
9. The dual tax on corporate income is also characterised by a number of inefficiencies. For both
corporate income tax and the CREE surtax purposes, an alternative minimum tax is calculated to ensure that
a minimum level of tax is paid. This minimum tax is not based on actual income or profits but on a
presumptive return on net wealth, which increases the tax system’s complexity. Moreover, the standard
corporate income tax is prepaid through a withholding tax, which is sometimes higher than the actual tax
due, meaning that many businesses are entitled to refunds that are often delayed by the tax administration.
Finally, having different taxes with different tax bases, withholding and reporting systems, increases both
compliance costs for taxpayers and enforcement costs for the tax administration.

ECO/WKP(2015)52
13
10. Reforming the corporate income tax would be growth enhancing. In particular moving towards a
lower statutory rate would stimulate investment, especially in activities with narrower profit margins than
the commodity sector. However, the short-term revenue costs of lowering the corporate income tax rate
are likely to be high and benefits in terms of attracting investment and FDI will only arise in the longer
run (Steiner, 2014). This suggests that a gradual decrease in the statutory rate may be more desirable. At
the same time, better aligning the yearly withheld tax with the actual tax liability that has to be paid at the
end of the year would reduce the cash flow problems that the current system creates for many firms. This
would particularly benefit SMEs. In the longer run, the corporate income tax and the CREE surtax
should be unified, which would require the CREE surtax to be no longer earmarked to specific expenditure
programmes.
Figure 5. Top statutory corporate income rates in OECD and Latin American countries
1. Simple average for countries included in the figure.
2. Includes 9% social security contributions.
3. Surtax for dividends not included.
Source: OECD Tax database and KPMG Corporate Tax Rates (2014).
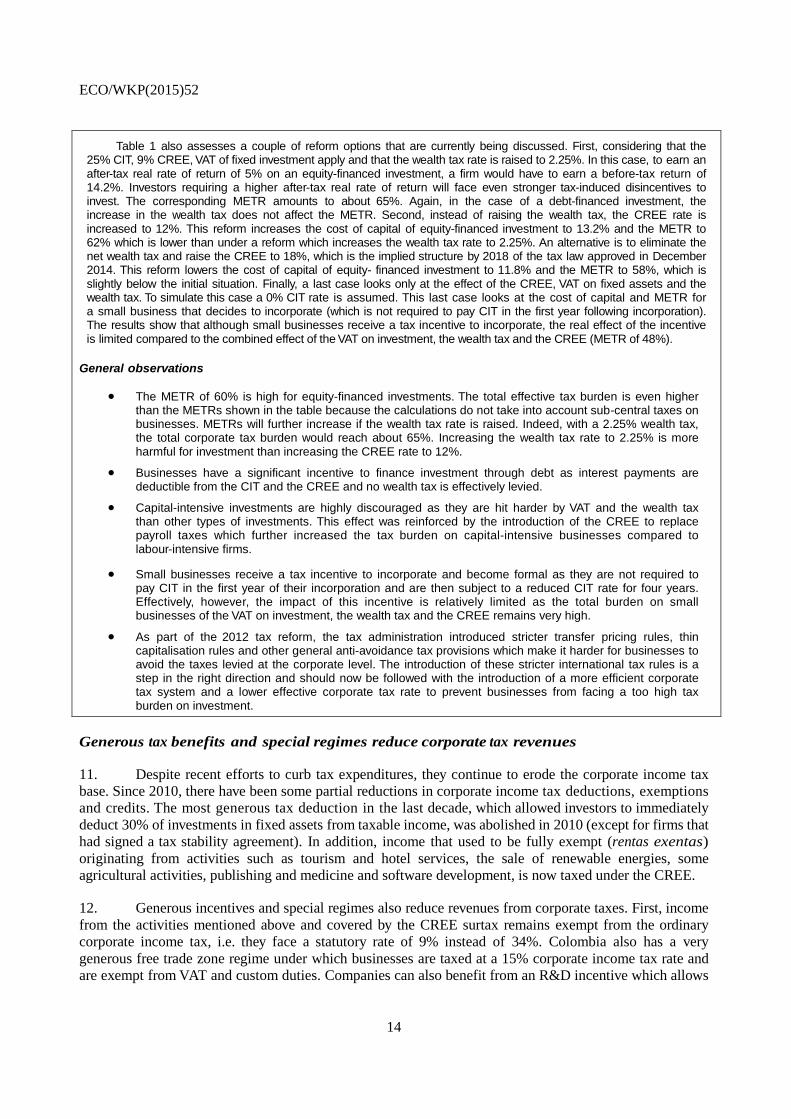
Box 4. Marginal corporate effective tax rates and cost of capital in Colombia under different scenarios
Calculations of the cost of capital and marginal corporate effective tax rate allow assessing the burden imposed by the corporate income tax on investment. The cost of capital reflects the required pre-tax real rate of return on a marginal investment such that the investor after-tax breaks-even (i.e. for the investment project to be worthwhile at the margin). Based on this pre-tax real rate of return, the marginal corporate effective tax rate (METR) can be calculated as follows: tc = (p-r)/p, where tc is the marginal corporate effective tax rate, r is the after-tax real rate of return and p is the cost of capital. The calculations assume that the after-tax real rate of return on investment that the investor expects is 5% and the inflation rate is 2%.The calculations also assume that tax depreciation allowances follow the economic depreciation of assets, meaning that depreciation does not have an impact on the effective corporate tax burden. The results show a widely varying effective burden of the different taxes on investment but also point to tax-induced distortions in investment decisions (see Table 1 in the main text).
In the situation where only the CIT and the CREE apply, the corporate METR for equity investments is 34% (25% CIT + 9% CREE), while with debt-financed investment, the METR is -26%. This is because not only real but nominal interest payments are deductible from the CIT and the CREE bases. Considering in addition the VAT on fixed asset the corporate METR rises from 34% to 52% for equity-financed investments and from -26% to 28.9% for a debt-financed investment. This is because a business needs to earn a return on the total cost of investment which includes the unrecoverable VAT. If in addition, the 1.5% wealth tax is considered, which describes the current situation where all taxes apply, the equity-financed METR is around 60%. In the case of a debt-financed investment, the introduction of the wealth tax does not affect the METR as the wealth tax only applies to net wealth (i.e. assets net of liabilities). The cost of capital increases by more than 1.5% because the wealth tax has to be paid from after-tax profits.
ECO/WKP(2015)52
14
Table 1 also assesses a couple of reform options that are currently being discussed. First, considering that the 25% CIT, 9% CREE, VAT of fixed investment apply and that the wealth tax rate is raised to 2.25%. In this case, to earn an after-tax real rate of return of 5% on an equity-financed investment, a firm would have to earn a before-tax return of 14.2%. Investors requiring a higher after-tax real rate of return will face even stronger tax-induced disincentives to invest. The corresponding METR amounts to about 65%. Again, in the case of a debt-financed investment, the increase in the wealth tax does not affect the METR. Second, instead of raising the wealth tax, the CREE rate is increased to 12%. This reform increases the cost of capital of equity-financed investment to 13.2% and the METR to 62% which is lower than under a reform which increases the wealth tax rate to 2.25%. An alternative is to eliminate the net wealth tax and raise the CREE to 18%, which is the implied structure by 2018 of the tax law approved in December 2014. This reform lowers the cost of capital of equity- financed investment to 11.8% and the METR to 58%, which is slightly below the initial situation. Finally, a last case looks only at the effect of the CREE, VAT on fixed assets and the wealth tax. To simulate this case a 0% CIT rate is assumed. This last case looks at the cost of capital and METR for a small business that decides to incorporate (which is not required to pay CIT in the first year following incorporation). The results show that although small businesses receive a tax incentive to incorporate, the real effect of the incentive is limited compared to the combined effect of the VAT on investment, the wealth tax and the CREE (METR of 48%).
General observations
The METR of 60% is high for equity-financed investments. The total effective tax burden is even higher than the METRs shown in the table because the calculations do not take into account sub-central taxes on businesses. METRs will further increase if the wealth tax rate is raised. Indeed, with a 2.25% wealth tax, the total corporate tax burden would reach about 65%. Increasing the wealth tax rate to 2.25% is more harmful for investment than increasing the CREE rate to 12%.
Businesses have a significant incentive to finance investment through debt as interest payments are deductible from the CIT and the CREE and no wealth tax is effectively levied.
Capital-intensive investments are highly discouraged as they are hit harder by VAT and the wealth tax than other types of investments. This effect was reinforced by the introduction of the CREE to replace payroll taxes which further increased the tax burden on capital-intensive businesses compared to labour-intensive firms.
Small businesses receive a tax incentive to incorporate and become formal as they are not required to pay CIT in the first year of their incorporation and are then subject to a reduced CIT rate for four years. Effectively, however, the impact of this incentive is relatively limited as the total burden on small businesses of the VAT on investment, the wealth tax and the CREE remains very high.
As part of the 2012 tax reform, the tax administration introduced stricter transfer pricing rules, thin capitalisation rules and other general anti-avoidance tax provisions which make it harder for businesses to avoid the taxes levied at the corporate level. The introduction of these stricter international tax rules is a step in the right direction and should now be followed with the introduction of a more efficient corporate tax system and a lower effective corporate tax rate to prevent businesses from facing a too high tax burden on investment.
Generous tax benefits and special regimes reduce corporate tax revenues
11. Despite recent efforts to curb tax expenditures, they continue to erode the corporate income tax
base. Since 2010, there have been some partial reductions in corporate income tax deductions, exemptions
and credits. The most generous tax deduction in the last decade, which allowed investors to immediately
deduct 30% of investments in fixed assets from taxable income, was abolished in 2010 (except for firms that
had signed a tax stability agreement). In addition, income that used to be fully exempt (rentas exentas)
originating from activities such as tourism and hotel services, the sale of renewable energies, some
agricultural activities, publishing and medicine and software development, is now taxed under the CREE.
12. Generous incentives and special regimes also reduce revenues from corporate taxes. First, income
from the activities mentioned above and covered by the CREE surtax remains exempt from the ordinary
corporate income tax, i.e. they face a statutory rate of 9% instead of 34%. Colombia also has a very
generous free trade zone regime under which businesses are taxed at a 15% corporate income tax rate and
are exempt from VAT and custom duties. Companies can also benefit from an R&D incentive which allows
ECO/WKP(2015)52
15
an up to 175% income tax deduction for investments in scientific and technological projects. In addition,
Colombia offers a special regime for non-profit organisations with a reduced corporate tax of 20% and tax
exemptions for re-invested surpluses in non-profit activities. It is in fact very likely that this special regime
has been misused as around one company out of five in Colombia is registered as a non-profit. In this
sense, the government’s proposal to revise the non-profit regime is a positive development (Box 2).
13. In addition to their substantial fiscal cost, these tax benefits and special regimes generate
horizontal inequities between different types of companies and industry sectors. Companies from different
sectors end up facing very different effective tax rates (Steiner and Cañas, 2013). Tax incentives are also
often poorly targeted. The R&D incentive, for example, benefits mostly the largest companies as they
generate most of the R&D and have significant taxable income, which allows them to take advantage of the
deduction. Finally, tax benefits and special regimes increase the complexity of the tax system and
eventually raise compliance and enforcement costs. The R&D tax allowance should be reduced. The use
and impact of other tax benefits and special regimes should also be closely assessed with a view to
removing or reforming those that are distortive, inefficient or misused.
Colombia’s free trade zone regime is particularly distortive
14. There are more than 100 free trade zones (FTZ) in Colombia. Between 2013 and 2014, 17 new
zones were authorised and the government is considering the creation of a new FTZ for deep-sea
offshore exploration. There are two types of FTZs: permanent FTZs and single-enterprise FTZs. A
permanent FTZ is a designated geographical location in which multiple companies operate and which is
managed by an FTZ operator, while a single- enterprise FTZ allows an individual company which fulfils
specific investment and job creation requirements to benefit from the tax and customs duty incentives
irrespective of its location in the country. In addition, Colombia has Special Economic Zones for Exports
(ZEEE) for businesses located within a few designated cities; these activities do not benefit from the CIT
rate reduction but from reductions in payroll taxes and certain labour surcharges instead. Profits from
certain infrastructure projects within ZEEEs are exempt from CIT and CREE (Brys and Perret, 2015).
15. The FTZ regime creates distortions and has often been misused by companies. For instance,
companies in FTZs established before and after 2013 are treated differently: the CREE is not applicable to
companies declared as FTZs before 31 December 2012 but applies to FTZs established after that date. In
addition, the single-enterprise FTZs create disadvantages for domestic SMEs as these will likely not
meet the investment and employment creation requirements to be granted the single-enterprise FTZ
status. Furthermore, many activities located in free trade zones have been classified as
manufacturing when in reality no or only minor transformation occurs. The special border tax
regime also increases smuggling problems, according to officials of the tax administration. Moreover,
FTZs have generated opportunities for tax avoidance through the manipulation of transfer prices between
businesses inside and outside FTZs. From a tax administration perspective, the FTZ regime is very difficult
to monitor.
16. Thus, in parallel to lowering the statutory corporate income tax rate, Colombia should also seek to
broaden the corporate income tax base by removing or lowering existing deductions and exemptions.
Incentives are often justified as a way to stimulate investment but a similar or greater impact could be
reached by reducing the statutory rate for all businesses. Regarding the FTZ regime, Colombia should in
the short run tighten the criteria for firms to enter permanent FTZs further and phase out single-enterprise
zones as they generate significant distortions between similar companies and are very difficult to audit. In
the longer run, if the net wealth tax on businesses is phased out – as currently planned by the government –
and the corporate income tax rate lowered, permanent FTZs could be turned into zones which only provide
VAT and customs duty benefits.

ECO/WKP(2015)52
16
VAT on fixed assets discourages investment
17. In most countries VAT is only levied on consumption. Businesses that purchase goods and
services, either from the domestic market or from abroad, pay VAT on their purchases but receive a refund
for the VAT paid on their inputs (as long as the goods and services are used as part of the regular business
activity). A consumption-based VAT provides refunds for fixed assets as well. In Colombia, however,
businesses are not refunded for the VAT paid on fixed assets, which increases the cost of capital for
businesses (Box 4) and strongly discourages domestic and foreign investment.
18. The government has announced that businesses will be refunded for the VAT paid on fixed assets
at a rate ranging from 0% (no refund) to 16% (full refund), with the actual refund rate set depending on
whether the tax administration meets its tax revenue target. However, no actual refund rate has been
published by the government so far, mainly because of the significant revenue loss of refunding VAT on
fixed assets. As the current system is very distortive, Colombia should start refunding VAT on fixed assets
at the standard VAT rate of 16% or, if resources are not available in the short run, gradually increase the
refund rate over time.
The business wealth tax can deter future investment
19. Businesses account for about 95% of the revenues collected from the wealth tax. The wealth tax
charges taxpayers a lump sum based on their declared net wealth on 1 January 2011, with the amount
payable over four years. The top marginal rate was 6% for taxpayers with wealth above USD 2.5 million,
equivalent to 1.5% per year over the four-year period. For 2015, the government has proposed to increase
until 2018 the CREE surtax rate to 18% and to gradually phase out the wealth tax on firms by 2018
(Box 2).
20. The Colombian wealth tax distorts individuals’ savings and investment behaviour. It generates or
amplifies the preferential treatment of some forms of savings over others as the value of shares or
company interests in Colombian companies and the first USD 160 000 of the primary house value
can be deducted from the tax base. The wealth tax also encourages tax planning and capital flight. The
wealth tax has not reduced income differentials as the share of top-income households in total income
earned in Colombia before and after taxes remains practically unaltered (Alvaredo and Londoño, 2013).
Only about 50 000 people pay the tax, or 0.01% of the population.
21. The wealth tax’s distortive effects on businesses are even more pronounced as it comes on top
of an already high combined corporate income tax and CREE surtax rate. The cascading effect of the total
CIT/CREE/wealth tax can raise corporate effective tax rates up to 51% (Clavijo et al., 2013).The OECD
calculated the cost of capital and the total marginal effective corporate tax burden under different
scenarios (Table 1; Box 4). Taking into account the 25% corporate income tax rate, the 9% CREE surtax
rate, the 1.5% wealth tax as well as VAT on fixed assets, the OECD calculations find that if businesses
wish to earn 5% real after-tax return on their investment, they need to earn a pre-tax return of 12.7%. The
proposal to increase the CREE rate from 9% to 12% increases the cost of capital to 13.2%. This
implies that the total marginal effective tax burden on businesses is in the order of 60% (Table 1).
Considering the changes approved by Congress in December 2014 of increasing the CREE to 18% and
eliminating the wealth tax, the cost of capital is reduced to 11.8% and the marginal effective tax rate for
equity-financed investment to 58%. This represents just a slight improvement compared to the situation
in 2014. More generally, the results highlight that the wealth tax and the VAT on fixed assets account for a
significant part of the total effective tax burden on businesses.
ECO/WKP(2015)52
17
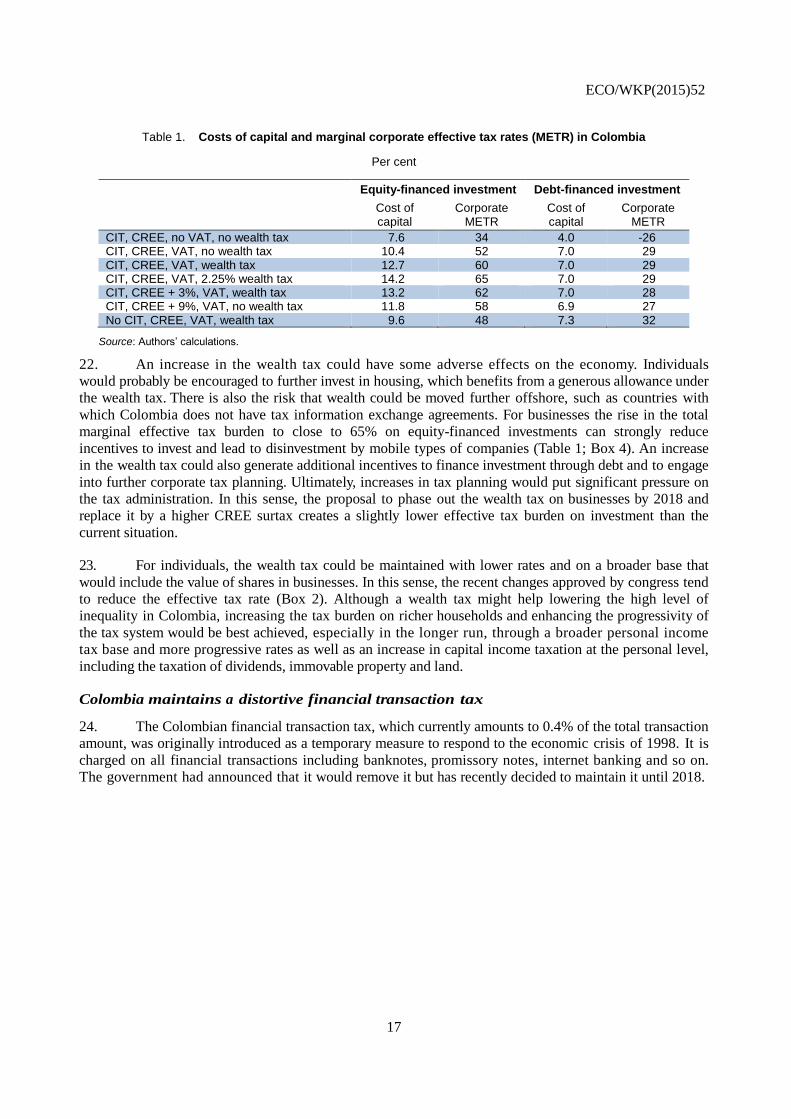
Table 1. Costs of capital and marginal corporate effective tax rates (METR) in Colombia
Per cent
Equity-financed investment Debt-financed investment
Cost of capital
Corporate METR
Cost of capital
Corporate METR
CIT, CREE, no VAT, no wealth tax 7.6 34 4.0 -26 CIT, CREE, VAT, no wealth tax 10.4 52 7.0 29 CIT, CREE, VAT, wealth tax 12.7 60 7.0 29 CIT, CREE, VAT, 2.25% wealth tax 14.2 65 7.0 29 CIT, CREE + 3%, VAT, wealth tax 13.2 62 7.0 28 CIT, CREE + 9%, VAT, no wealth tax 11.8 58 6.9 27 No CIT, CREE, VAT, wealth tax 9.6 48 7.3 32
Source: Authors’ calculations.
22. An increase in the wealth tax could have some adverse effects on the economy. Individuals
would probably be encouraged to further invest in housing, which benefits from a generous allowance under
the wealth tax. There is also the risk that wealth could be moved further offshore, such as countries with
which Colombia does not have tax information exchange agreements. For businesses the rise in the total
marginal effective tax burden to close to 65% on equity-financed investments can strongly reduce
incentives to invest and lead to disinvestment by mobile types of companies (Table 1; Box 4). An increase
in the wealth tax could also generate additional incentives to finance investment through debt and to engage
into further corporate tax planning. Ultimately, increases in tax planning would put significant pressure on
the tax administration. In this sense, the proposal to phase out the wealth tax on businesses by 2018 and
replace it by a higher CREE surtax creates a slightly lower effective tax burden on investment than the
current situation.
23. For individuals, the wealth tax could be maintained with lower rates and on a broader base that
would include the value of shares in businesses. In this sense, the recent changes approved by congress tend
to reduce the effective tax rate (Box 2). Although a wealth tax might help lowering the high level of
inequality in Colombia, increasing the tax burden on richer households and enhancing the progressivity of
the tax system would be best achieved, especially in the longer run, through a broader personal income
tax base and more progressive rates as well as an increase in capital income taxation at the personal level,
including the taxation of dividends, immovable property and land.
Colombia maintains a distortive financial transaction tax
24. The Colombian financial transaction tax, which currently amounts to 0.4% of the total transaction
amount, was originally introduced as a temporary measure to respond to the economic crisis of 1998. It is
charged on all financial transactions including banknotes, promissory notes, internet banking and so on.
The government had announced that it would remove it but has recently decided to maintain it until 2018.

ECO/WKP(2015)52
18
25. Similar financial transaction taxes are common in other Latin American countries and in Asia
(Matheson, 2011). They are appealing because they can raise substantial revenue and are relatively easy
to administer. However, they tend to hamper financial deepening, which in turn adversely affects business
sector growth and encourage cash operations, which usually results in greater informality and revenue
losses from other taxes. Revenues from these types of taxes also have a tendency to decline over time, as
taxpayers find ways to circumvent them. Governments frequently end up raising the rate in an effort to
address revenue erosion, which can lead to an even larger contraction of the tax base (Matheson, 2011).
Although revenues have been stable around 0.8% of GDP since some loopholes were closed in 2010, there
is some evidence of revenue erosion in the financial transaction tax for Colombia. For example, despite
doubling the tax rate in 2004, revenues raised by the financial transaction tax in terms of GDP were the
same in 2010 as in 2003.
26. Despite exemptions for small transactions, the financial transaction tax causes
disintermediation and generates costly distortions in Colombia. For example, a study shows that the
financial transaction tax accounts for around 20% of the net interest margin and its interaction with
forced investments in securities to finance agricultural development could explain up to 40% of the
margin (Galindo and Majnoni, 2006). High intermediation margins are one of the main factors holding
back financial deepening and inclusion in Colombia (Daude and Pascal, 2015). The structure of the tax
also favours less competition among banks, as it creates incentives for individuals to have all accounts and
services with the same institution. Furthermore, some studies indicate that the financial transaction tax
reduced significantly the demand for financial services (Kirilenko and Summers, 2002) and increased the
demand of cash (Arbeláez, Burman and Zuluaga, 2004). The increased use of cash for transactions also
contributes to overall tax evasion. Actually, some estimates show that the net effect of the financial
transaction tax on tax revenues might be negative, given the high levels of informality that it induces
(Clavijo, Vera and Vera, 2013). Overall, the tax is distortive and costly for investment and economic
growth (Arias, Carrasquilla and Galindo, 2002; Suescun, 2001).
27. While in the short-term it might not be economically and politically feasible to eliminate, as it
levies around 0.8% of GDP, the government should aim to find alternative sources of revenue and phase it
out as soon as possible. An alternative would be to levy the financial transaction tax on a different type of
transactions. For instance, a tax on high-frequency trading could continue to raise revenue from the
financial sector as well as lower the risks of asset price bubbles. However, like other transaction taxes, such
a tax would have cascading effects, raising the cost of capital for some businesses more than others and
possibly increasing financial disintermediation (Matheson, 2011).
Towards a more progressive tax system
28. Income inequality in Colombia is among the highest in the world and the tax system does little to
reduce it. In contrast to most OECD economies, but similarly to other Latin American countries, income
inequality in Colombia remains broadly unaltered by direct taxes and cash transfers (Figure 6). In part, this
reflects the relatively low overall tax intake– even if taxes and transfers were progressive, their incidence
would be small. But it also reflects a regressive tax mix and pervasive exemptions that are not progressive
(Figure 7).

ECO/WKP(2015)52
19
Figure 6. Taxation has little redistributive power
Gini coefficient at market income and after direct taxes and transfers (circa 2010)
1. The Gini index has a range from zero (when everybody has identical incomes) to one (when all income goes to only one person).Increasing values of the Gini coefficient thus indicate higher inequality in the distribution of income.
Source: OECD Database on Household Income Distribution and Poverty; Lustig et al., (2013), “The Impact of Taxes and Social Spending on Inequality Argentina, Bolivia, Brazil, Mexico, Peru and Uruguay: An Overview”, CEQ Working Paper, No. 13, August; Lustig and Melendez (2014), “The Impact of Taxes and Transfers on Inequality and Poverty in Colombia”, CEQ Working Paper, No. 24, Center for Inter-American Policy and Research and Department of Economics, Tulane University and Inter-American Dialogue, forthcoming.
Figure 7. Taxes in Colombia are less progressive compared to Mexico
Source: Lustig et al., (2013), “The Impact of Taxes and Social Spending on Inequality Argentina, Bolivia, Brazil, Mexico, Peru and Uruguay: An Overview”, CEQ Working Paper, No. 13, August; Lustig and Melendez (2014), “The Impact of Taxes and Transfers on Inequality and Poverty in Colombia”, CEQ Working Paper, No. 24, Center for Inter-American Policy and Research and Department of Economics, Tulane University and Inter-American Dialogue, forthcoming.
ECO/WKP(2015)52
20
VAT remains relatively regressive despite exemptions on basic foodstuffs
29. The VAT and other indirect taxes are regressive despite the existence of reduced (5% and
0%) rates. As a result indirect taxes reduce the income of the deciles in the middle of the distribution two
times more than for the richest decile. This stands in contrast with other Latin American countries, for
example Mexico, where indirect taxes are higher and have a more progressive profile (Figure 7, Panel A).
Furthermore, in many OECD countries and several Latin American countries the VAT is progressive when
the tax is expressed as percentage of household consumption expenditure (instead of income to net out the
effect of savings). By contrast, in Colombia the VAT is regressive also in terms of consumption
expenditure (IADB, 2013).
30. Broadening the VAT tax to excluded activities could boost revenues. In addition to exemptions
and reduced rates on foodstuffs and other essential items, many activities– especially services – are
excluded from the VAT system. VAT exemptions and reduced rates represent around 0.5% of GDP in
terms of foregone tax revenue (MHCP, 2014a). The Constitutional Court has ruled several times that
these exemptions are needed to guarantee the fundamental rights of the poor to access affordable basic
goods. In the medium run, existing cash-transfer programmes to the poor would need to be expanded and
adapted to compensate the poor for the negative effects on purchasing power of eliminating
exemptions and reduced rates. This would only cost around 0.1% of GDP (Steiner and
Medellin, 2014). However, the gains of doing so are small compared with the estimated revenue loss from
not taxing the excluded activities – including construction, electricity, transport, education, financial and
other services – of about 2.4% of GDP (Yori Parra et al., 2013). Many of these items are not essential for
the vulnerable population and are usually subject to VAT in other Latin American and OECD countries.
Therefore, there is significant room to broaden the base by including more sectors into the VAT system.
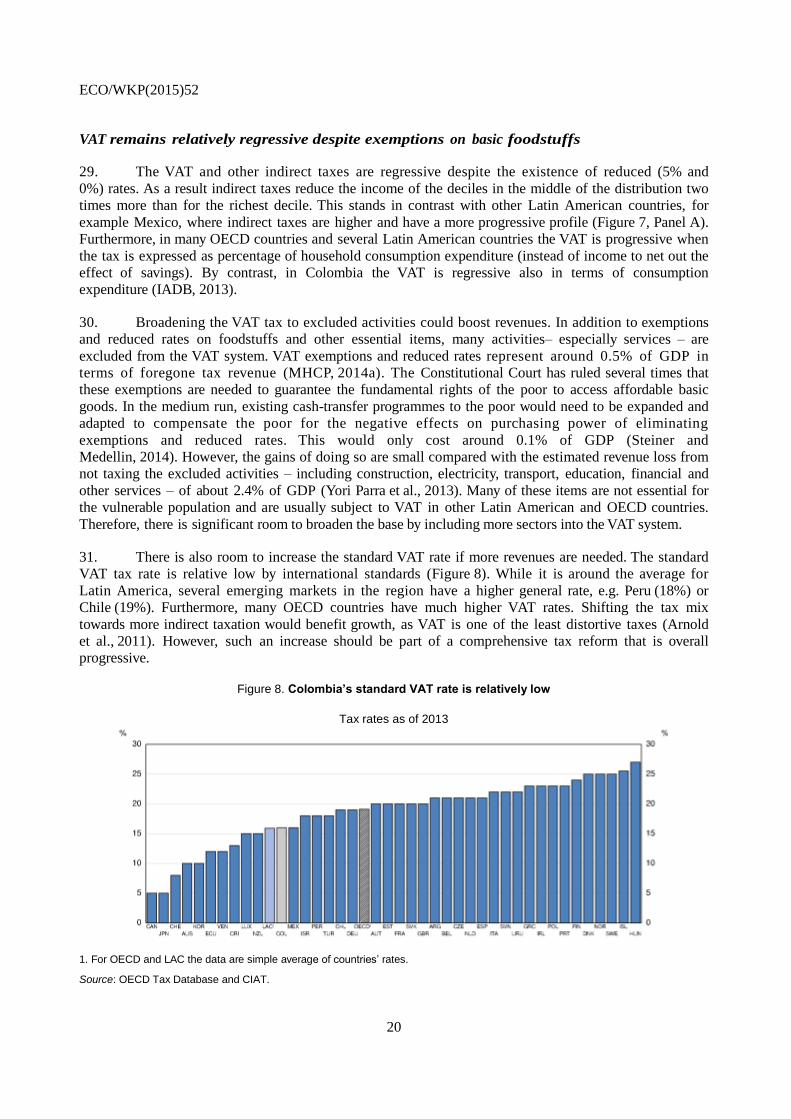
31. There is also room to increase the standard VAT rate if more revenues are needed. The standard
VAT tax rate is relative low by international standards (Figure 8). While it is around the average for
Latin America, several emerging markets in the region have a higher general rate, e.g. Peru (18%) or
Chile (19%). Furthermore, many OECD countries have much higher VAT rates. Shifting the tax mix
towards more indirect taxation would benefit growth, as VAT is one of the least distortive taxes (Arnold
et al., 2011). However, such an increase should be part of a comprehensive tax reform that is overall
progressive.
Figure 8. Colombia’s standard VAT rate is relatively low
Tax rates as of 2013
1. For OECD and LAC the data are simple average of countries’ rates.
Source: OECD Tax Database and CIAT.

ECO/WKP(2015)52
21
32. Furthermore, the productivity of the VAT – defined as the revenue relative to
consumption or GDP divided by the general VAT rate – in Colombia is low compared to Latin
American and OECD economies. The main reasons are tax evasion and a relatively weak tax
administration (IADB, 2013). Therefore, fighting evasion and improving the tax administration could
yield more revenues from VAT, even with the current tax structure.
Personal income tax: A few paying too little
33. Revenues from the personal income tax in Colombia at 0.8% of GDP are low. The OECD average
is 8.5% of GDP (Figure 9, Panel A). Few households are subject to the personal income tax, as
informality is widespread and the minimum exemption level is relatively high. While in OECD countries
individuals start paying personal income tax from above one fourth of the average national per capita
income, in Colombia the threshold is three times the average national per capita income (Figure 9,
Panel B). As a consequence, less than 10% of the population have to present a tax declaration and only
around 5% pay personal income taxes. While the lower absolute income levels and highly unequal income
distribution in Colombia make it difficult to reach revenue levels as in the OECD in the short term,
countries in Latin America – which share similar constraints – collect on average two times more
personal income taxes than Colombia (Figure 9, Panel A).
Figure 9. The personal income tax levies little revenue in part due to a high minimum exemption level
1. OECD refers to 2011 data. The graph presents only income tax revenues that are identified as personal income tax revenues by the OECD Revenue Statistics, while sometimes a significant amount is unclassified between corporate and personal income.
Source: OECD Revenue Statistics; and OECD/ECLAC/CIAT (2013), Revenue Statistics in Latin America: 1990-2012; IADB (2013), More than revenue: Tax policy as a development tool.
34. The top marginal tax rate of 33% is also low compared to top rates in the OECD, but close to the
Latin American average. However, the taxable income that falls into the highest income bracket is extremely
high in Colombia at ten times the average per capita income. In Mexico it applies at three times the average
income and it is slightly above two times the average income in other OECD economies (IADB, 2013).
This implies that individuals start to pay the top marginal rate in Colombia, when they are in absolute
terms almost 40% richer than the average OECD person subject to the top marginal rate (accounting for
differences in purchasing power across countries).

ECO/WKP(2015)52
22
Tax exemptions benefit the rich and reduce revenues
35. Generous exemptions reduce revenue and progressivity of the personal income tax, as they mainly
benefit the rich. According to estimates by the tax administration (DIAN), the effective tax rate is almost
flat along the income schedule at just around 5%. Therefore, progressivity only arises between those
paying this effective tax rate and those who do not pay the personal income tax, e.g. those below the
minimum exemption level (which includes the poor but also middle-income households).
36. The tax treatment of pensions is extremely generous further benefitting the few better off who get
a pension (de la Maisonneuve, 2015). First, pensions below 50 times the minimum wage
(around USD 15 000 per month) are completely exempt from the personal income tax, which in
practice implies that almost no pensions are taxed. Second, mandatory contributions to pension funds
or the public pension scheme as well as health care are fully exempt, and there are generous exemptions
for voluntary savings in pension funds. Finally, returns on investments by pension funds are also exempt.
In all OECD countries, pensions are at least taxed at one of the three stages. Given the generosity of the
current defined-benefit public pension scheme, it seems that the most progressive measure would be to tax
high pensions in the pay-out phase at progressive personal income tax rates.
37. According to IMF estimates, taxing pensions above five minimum wages at a moderate 10%
rate would increase revenues by 0.2% of GDP.
38. In addition to pensions and health care, taxpayers can deduct many other items. There is a
general deduction of 25% of income (capped around USD 3 500 per annum) as well as a 10% deduction
per dependent. Mortgage interest payments can be deducted and voluntary savings for real estate are also
exempt up to generous amounts. Richer households also benefit more from the privileged tax treatment
of savings (see below).
39. The 2012 reform introduced an alternative minimum tax (IMAN) for salaried and
independent workers, which puts a cap on some of these exemptions for high-income households. The
alternative minimum tax allows less exemptions and deductions and applies to workers with monthly
income above 1.548 tax unit values per annum, equivalent to around USD 23 000. According to estimates
by DIAN, this would make the personal income tax more progressive, raising the effective tax rate for
high-income persons up to 15% from 5%. Official simulations imply a reduction of almost 2 percentage
points in the Gini coefficient due to the IMAN from 0.57 to 0.55. However, other analysts find more
modest results on inequality (Hurtado, Lustig and Melendez, 2014).
The taxation of personal capital income is low
40. Colombia does not tax dividends at the personal shareholder level. Capital gains are taxed at a
rate of 10%, but gains realised from the sale of certain assets, including immovable property, are taxed
at lower rates or are tax-exempt. Interest payments are taxed under ordinary personal income tax rates (i.e.
rates ranging from 0% to up to 33%), with an adjustment for inflation. The low taxation of personal
capital income partly accounts for the relatively small share of the personal income tax paid by top
income households in Colombia and low progressivity of the tax (Alvaredo and Londoño, 2013).
41. In the OECD, despite large differences across countries, the combined statutory tax rate on
dividends usually exceeds 40% when the statutory corporate income tax rate and the taxes on dividends at
the shareholder level are taken into account. Colombia’s taxes on dividends are lower than the OECD
average as dividends are taxed at the statutory rate of34%, which combines the corporate income tax and
the CREE surtax (Figure 10). The main advantage in Colombia of not taxing dividends at the personal level
is that the system is simple and, in contrast to most OECD countries, there is no economic double

ECO/WKP(2015)52
23
taxation of profits (although the overall tax burden matters more than whether dividends are taxed once or
twice). However, to increase the overall progressivity of the tax system but also to potentially use the
revenue to lower the corporate income tax rate, Colombia should consider introducing a dividend tax
levied at the personal shareholder level.
42. Given the significant imbalance between the taxation of capital income at the personal and
corporate levels, the introduction of a dividend tax at the shareholder level would require lowering
corporate taxation. The statutory CIT rate would have to be significantly reduced to avoid having very
high combined corporate and individual rates. While the overall level of taxation on dividends and capital
gains at the personal level is very low (CIT and CREE), the tax burden on distributed dividends is very high
when VAT on investments and the business wealth tax are also taken into account. The combined tax
burden then exceeds 60% (see above).
43. To tax capital more at the personal level, Colombia could introduce a tax levied on dividends
distributed to Colombian shareholders but withheld at the corporate level, as was recently implemented in
Mexico. A dividend tax withheld at the corporate level is easier to administer – there are less
corporations that distribute dividends than there are shareholders receiving dividends – and would be more
difficult to evade (e.g. by Colombian tax residents whose dividends are paid to an offshore account).
However, such a tax would not allow taxing dividends at progressive personal income tax rates.
Figure 10. Combined statutory tax rates on dividends
Corporate and personal shareholder level
Source: Author’s calculations.
44. Moving towards a dual personal income tax scheme could be a good option for implementing
a more progressive personal income tax system. Some OECD countries tax capital income together with
labour income at progressive personal income tax rates. Most OECD countries, including Denmark,
Finland, Norway or Sweden, have a dual income tax system in which labour income is taxed at progressive
rates and capital income is taxed separately at proportional and typically lower tax rates. Recently, several
countries in Latin America have moved towards similar schemes (IADB, 2013). While a dual income tax
might be slightly less progressive than an income tax system that taxes capital income at progressive
PIT rates, the dual scheme has a series of characteristics that make it an attractive option for Colombia.
Their tax administration is easier than comprehensive schemes, as they can be implemented with a
withholding at the source scheme and can be levied on a broad capital income tax base. Furthermore, if rates
are set coherently, there are fewer incentives for tax avoidance. This makes them often more progressive

ECO/WKP(2015)52
24
than integral schemes in countries with weak tax administrations and where the capital income tax base is
narrow. Compared to the current situation, this would allow taxing capital income at higher rates and
increase therefore progressivity.
45. Dividend taxation should be consistent with capital gains taxation. A shift of the capital
income tax burden from the corporate towards the personal shareholder level may have to be accompanied
by an increase in the capital gains tax rate. If dividends were to be taxed at higher effective tax rates than
capital gains, corporations would no longer have an incentive to distribute profits but rather retain and
reinvest them. As a result, profits would be “locked-in”, which would reduce the possibility for young and
growing companies to attract external equity financing.
Tackling tax evasion
Tax evasion is widespread
46. Widespread tax evasion is a significant drag on tax revenues in Colombia. Official estimates of
VAT evasion are currently around 25%, which represents around 2% of GDP (Cruz, 2011). However, a
recent IMF assessment of VAT evasion put it at 40%, which is close to the estimates of some private
analysts (Steiner and Medellin, 2014). While part of the high evasion reflects the overall high informality
of the economy, it is also explained by some institutional weaknesses in the tax and customs administration.
In particular, a large share of VAT evasion occurs due to weak border and customs controls, as
well as corruption. The tax administration (DIAN) has little effective control over VAT on imports,
because of personnel constraints, regulations and segmented information systems.
47. Official estimates of tax evasion rates in the corporate income tax are around 30% over the 2007-
11 period on average. The Inter-American Development Bank estimates 2.3% of GDP. While there are
no reliable estimates of evasion for the personal income tax, the international evidence shows that in
general it is more pervasive than for VAT or corporate income taxation (IADB, 2013). Therefore, curbing
tax evasion would increase revenues even without changing the current tax mix.
48. The financial disintermediation caused by the financial transaction tax also tends to contribute to
tax evasion. As the tax has increased cash transactions in the informal sector, evasion may rise. The banking
system often plays a crucial role in facilitating information for tax collection and enforcement
(OECD 2007). Moreover, according to one estimate, the tax would have reduced collection of other taxes
such as income tax and VAT by 10%, implying an overall reduction of 0.3% of GDP in total tax
revenues (Clavijo, Vera and Vera, 2013). Therefore, removing the financial transaction tax would
contribute to reducing informality and tax evasion, in addition to removing the financial sector distortions
discussed above.
49. The Colombian tax system also suffers from high levels of offshore tax evasion. Offshore
evasion often involves placing assets in neighbouring Panama or islands in the Caribbean. Tax evasion has
been encouraged by highly distortive taxes (e.g. the net wealth tax), illicit activities and instability from the
armed conflict in the case of offshore evasion. Colombia has recently joined several multilateral and
bilateral information exchange agreements, and passed legislation to tax transactions with jurisdictions
that do not collaborate in the exchange of information. This will potentially help to curb tax evasion, but a
less heavy tax on wealth would also facilitate voluntary disclosure and compliance.

ECO/WKP(2015)52
25
Strengthening the tax administration to fight tax evasion
50. Strengthening the tax administration (DIAN) would help reduce tax evasion. A
restructuring proposal to give DIAN more effective supervising powers over customs services is under
consideration in congress. Expanding tax controls would also help. DIAN inspects only 0.1% of taxpayers,
compared to around 3% in other Latin American countries. This is in part a consequence of its relatively
small staff. There are less than half of employees in the tax administration per person in Colombia than in
Mexico, Chile or other emerging economies (Gómez Sabaini and Jiménez, 2012; Figure 11, Panel A). In
addition, the average age of DIAN’s staff is relatively high and staff sometimes lacks adequate language
skills or technical knowledge on issues such as transfer pricing or specific sectors (Figure 11, Panel B).
Moreover, the large number of employees who are on temporary contracts cannot receive training. DIAN’s
capacities are also constrained by the lack of efficient IT systems.
Figure 11. There is room to strengthen the tax administration
1. Note by Turkey: The information in this document with reference to “Cyprus” relates to the southern part of the Island. There is no single authority representing both Turkish and Greek Cypriot people on the Island. Turkey recognises the Turkish Republic of Northern Cyprus (TRNC). Until a lasting and equitable solution is found within the context of the United Nations, Turkey shall preserve its position concerning the “Cyprus issue”.
2. Note by all the European Union Member States of the OECD and the European Union: The Republic of Cyprus is recognised by all members of the United Nations with the exception of Turkey. The information in this document relates to the area under the effective control of the Government of the Republic of Cyprus.
3. NOECD is an average of 18 countries: Argentina, Brazil, Bulgaria, China, Colombia, Cyprus, Hong Kong (China), India, Indonesia, Latvia, Lithuania, Malaysia, Malta, Romania, Russia, Saudi Arabia, Singapore and South Africa.
Source: OECD (2013a), Tax Administration 2013: Comparative Information on OECD and other advanced and emerging economies.
ECO/WKP(2015)52
26
51. The use of information technologies (IT) and mass audits and other similar tools is less frequent
than in other countries (IADB, 2013). This is reflected in the relatively low IT expenditures compared
to peers (Figure 11, Panel C). A broader use of IT would simplify the tax administration and enforcement,
and also lower compliance costs for taxpayers. For example, only around 25% of firms file their CIT and
VAT returns electronically in Colombia, while in other Latin American countries such as Argentina,
Brazil, Chile or Mexico, all firms use electronic filing (OECD, 2013a).
52. Positive changes were introduced regarding the auditing methods carried out by DIAN. DIAN
used to conduct exclusively in-depth audits, which resulted in a heavy caseload and opportunities for
corruption. Efforts are now being made to implement automated basic checks (“fiscalización masiva”) to
detect basic errors and omissions. This will increase the number of audits performed every year and
raise the perceived risk associated with non-compliance. An audit manual was also developed and audit
cases are now managed centrally. Finally, a new system of joint audits between the different tax auditing
units (tax, customs, exchange control and transfer pricing) was put in place.
53. DIAN is also constrained by several regulations that limit its powers to enforce payments of
tax debt. DIAN writes off more than half of the outstanding tax debt per year, twice the level in OECD
countries and well above also other emerging market economies (Figure 11, Panel D). In part this low
level of collection is linked to restrictions DIAN faces to enforce payments. For example, businesses do not
require a tax clearance certificate to be contractors of the public sector or cannot be denied certain
government services in case of uncollected tax debts, as is standard in most OECD countries. Furthermore,
DIAN cannot request a search warrant without the help of other state agencies, offset tax debt with
outstanding tax credits of the same taxpayer, or initiate bankruptcy procedures.
54. DIAN’s audit function could be further strengthened by modernising the IT systems, increasing
the number of staff and ensuring that they have the adequate expertise. The criteria used for audit risk-
scoring should also be clearly specified and the risk-based selection programme should be run regularly
during the tax year to ensure inclusion of late filers (USAID, 2013). More focus could be put on PIT
evasion, which has received less attention than CIT evasion. Finally, while the audit function aims to
control registered taxpayers, efforts should also be made to address the issues of non-filers and the informal
economy which typically fall under the responsibility of other units in the tax administration (e.g.
fraud investigations). The objective is to increasingly bring Colombians who currently operate in the
informal sector within the reach of the tax administration.
A voluntary disclosure programme of unreported income and wealth could increase tax
compliance
55. The law approved in December 2014 increases sanction for tax evasion and introduces a tax
amnesty for unreported assets held abroad by Colombians (Box 2). With this amnesty, taxpayers who come
forward would be subject to the wealth tax and a penalty. Taxpayers who do not come forward would face
higher fines. Currently, taxpayers are criminally liable only when they do not pay withheld taxes and VAT
within the two months following the due date. Making tax fraud a criminal offence would help in this
regard.
56. However, such an amnesty raises a number of issues. The amnesty might not be credible
because of previously unsuccessful tax amnesties in Colombia (in 1995, 2003 and a failed attempt in
2012). In addition, the tax administration’s relatively weak audit capacity could also make the
amnesty less credible. Finally, if the amnesty is not perceived as a credible one-off offer, it could end up
being counter-productive as honest taxpayers may resent the amnesty and stop paying their taxes and
evaders may wait for a future amnesty.
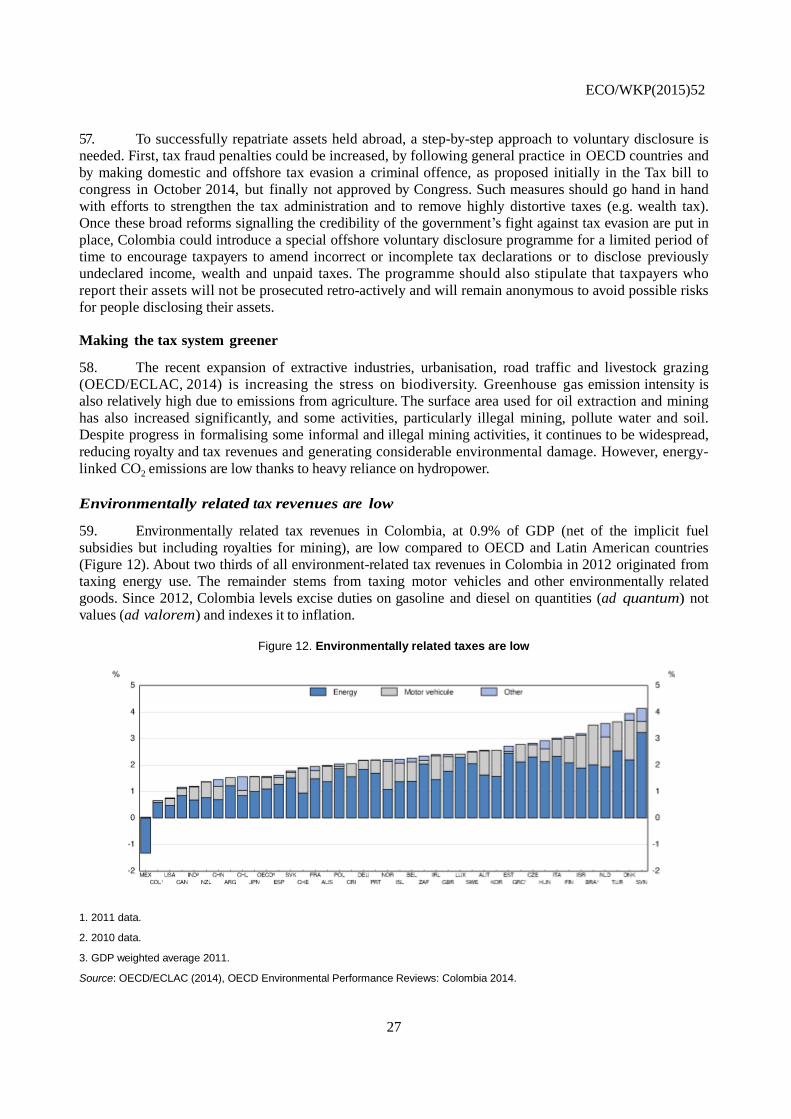
ECO/WKP(2015)52
27
57. To successfully repatriate assets held abroad, a step-by-step approach to voluntary disclosure is
needed. First, tax fraud penalties could be increased, by following general practice in OECD countries and
by making domestic and offshore tax evasion a criminal offence, as proposed initially in the Tax bill to
congress in October 2014, but finally not approved by Congress. Such measures should go hand in hand
with efforts to strengthen the tax administration and to remove highly distortive taxes (e.g. wealth tax).
Once these broad reforms signalling the credibility of the government’s fight against tax evasion are put in
place, Colombia could introduce a special offshore voluntary disclosure programme for a limited period of
time to encourage taxpayers to amend incorrect or incomplete tax declarations or to disclose previously
undeclared income, wealth and unpaid taxes. The programme should also stipulate that taxpayers who
report their assets will not be prosecuted retro-actively and will remain anonymous to avoid possible risks
for people disclosing their assets.
Making the tax system greener
58. The recent expansion of extractive industries, urbanisation, road traffic and livestock grazing
(OECD/ECLAC, 2014) is increasing the stress on biodiversity. Greenhouse gas emission intensity is
also relatively high due to emissions from agriculture. The surface area used for oil extraction and mining
has also increased significantly, and some activities, particularly illegal mining, pollute water and soil.
Despite progress in formalising some informal and illegal mining activities, it continues to be widespread,
reducing royalty and tax revenues and generating considerable environmental damage. However, energy-
linked CO2 emissions are low thanks to heavy reliance on hydropower.
Environmentally related tax revenues are low
59. Environmentally related tax revenues in Colombia, at 0.9% of GDP (net of the implicit fuel
subsidies but including royalties for mining), are low compared to OECD and Latin American countries
(Figure 12). About two thirds of all environment-related tax revenues in Colombia in 2012 originated from
taxing energy use. The remainder stems from taxing motor vehicles and other environmentally related
goods. Since 2012, Colombia levels excise duties on gasoline and diesel on quantities (ad quantum) not
values (ad valorem) and indexes it to inflation.
Figure 12. Environmentally related taxes are low
1. 2011 data.
2. 2010 data.
3. GDP weighted average 2011.
Source: OECD/ECLAC (2014), OECD Environmental Performance Reviews: Colombia 2014.

ECO/WKP(2015)52
28
60. The 2012 tax reform took steps in the right direction. In particular, the pre-existing ad
quantum and ad valorem taxes on gasoline and diesel were merged to one ad quantum tax. This is
welcome as ad quantum taxation of fuels corresponds more closely to the energy service received from
fuels and to their emissions. The indexation of this tax to inflation should be sustained as it prevents a
decline of environmentally related tax revenue in real terms. In addition to the national taxes on fuels
used in transport there are also subnational surtaxes on gasoline and diesel. While the diesel rate is
centrally determined at 6% of the net sales price, subnational governments can set the surcharge on
gasoline. Some selected rates are 6.5% of the net sales price in Valle del Cauca and Santander, 18.5% in
Cundinamarca, 25% in Bogotá, all higher than the national tax rate on diesel (Bogotá Municipality,
2014). Although Colombia taxes energy more than many oil producing countries, energy tax rates
are low compared to other Latin American countries and significantly lower than the OECD average
(Table 2). A particular constraint to raising more fuel taxes are extremely low prices in Venezuela that
have encouraged significant smuggling into Colombia.
Table 2. Tax rates on gasoline and diesel, selected Latin American countries and OECD average
Colombia Chile Argentina Uruguay OECD average
Gasoline (EUR/GJ) 4.7 10.3 6.9 13.2 15.5
Diesel (EUR/GJ) 3.2 2.2 4.2 12.5 10.5
Source: OECD calculations based on Colombian Government (2014) and OECD (2013b). Tax rates are as of August 2014 for Latin American countries and as of 1 April 2012 for the OECD average.
Eliminating the gasoline-diesel taxation differential and taxing fuels beyond
transportation
61. Lower taxation of diesel than gasoline has contributed to a higher demand for diesel, such that
the share of diesel in fuel consumption has doubled since 2000. From an environmental perspective,
a lower tax rate on diesel fuel is not warranted. Diesel has higher emissions of carbon and of harmful air
pollutants (notably particulate matter) per litre of fuel used. The fuel efficiency advantage of diesel
vehicles over their gasoline counterparts does not justify this differential in taxation on a per litre basis.
Furthermore, increasing the diesel rate to the same level as the rate on gasoline could raise significant
revenues (Harding, 2014).
62. Currently, only energy used for transportation is taxed in Colombia, whereas the OECD average
effective tax rate on heating, process, and electricity generation is EUR 0.9 per GJ (OECD, 2013b). Three
quarters of all energy in Colombia is used for heating, process use, and electricity generation. Almost half
of electricity is made from hydropower, a third of natural gas and 16% from coal. The generation from coal
has increased in recent years increasing carbon emissions (OECD/ECLAC, 2014) and local air pollution. A
more coherent taxation regime would tax emissions from heating and process use of energy as well as
electricity. Enlarging the energy tax base to these energy uses would also allow for increasing the revenue
from energy taxation.
ECO/WKP(2015)52
29
Price stabilisation schemes act as implicit fossil fuel subsidies
63. Fuel prices are regulated at below-market rates, resulting in implicit fuel price subsidies. The
Colombian fuel price stabilisation fund for gasoline and diesel was meant to reduce subsidies, but it has
accumulated a debt of 0.3% of GDP between 2008 and 2011, implying continued price subsidies
(Kojima, 2013). Changes in the fund’s price formula in 2011 and 2012 increased transparency of price
regulation and achieved a 28% reduction in the fund’s deficit (Garcia and Calderon, 2013). Further
strengthening the link between international and domestic prices is needed. A series of gradual price
increases, as currently done in Mexico, may be a way forward to contain resistance and potential protests
that have happened in the past due to price hikes.
Better targeting support for poor families
64. Cross-subsidised utility prices (electricity, gas, water and waste) are not well targeted and do not
create incentives for efficient resource utilisation. Subsidised utility prices reduce prices for households
classified as low-income, financed by a 20% surcharge on households in higher-income categories and
commercial and industrial users (OECD/ECLAC, 2014). These programmes are not well targeted,
allowing almost 90% of Colombian households to benefit from utility price subsidies (OECD, 2013c).
Targeting assistance better to low-income households could be achieved via using conditional cash
transfers, as for example, in Brazil (OECD, 2013b), where the government first included vouchers for
fuels. Later, payments were included in the cash-transfer programme Bolsa Familia. These payments are
not directly linked to fuels consumption, allowing therefore for more spending flexibility and efficient use
of fuels.
A carbon tax would deal with emissions in a cost-efficiency way
65. A tax on the carbon content of fuels would make polluters pay for the social costs of their carbon
emissions. By increasing the price of fuels a carbon tax incentivises an increase in fuel efficiency, a switch
to cleaner fuels and renewable energy sources and sends a signal to invest in cleaner infrastructure. If the
carbon tax is implemented at the level of fuel importers and extraction companies and the tax is passed
through to fuel users, all sectors of the economy will pay the tax, even informal activities. Collecting tax
revenues from a “bad” such as carbon emissions minimises economic distortions and is thereby a very
efficient form of taxation. By applying a carbon tax broadly across all fuels and uses Colombia would also
substantially increase its energy tax base. Implementing a carbon tax would also help Colombia to steer its
economy towards a green growth path by signalling investors to invest in clean infrastructure today and
avoid a likely more costly grow first and clean-up later policy. OECD countries in the region, Mexico and
Chile, have also moved towards implementing carbon taxation recently. In this sense, the government
should consider implementing such a tax, as it already proposed in 2012.
Strengthening fiscal relations across levels of government
66. There are few signs of convergence in living standards across departments, despite significant
efforts in fiscal decentralisation over the last two decades (Bonet, 2006). Inequality in GDP per capita
across departments is high compared to OECD economies and other large emerging market economies
(Figure 13). A recent study finds that it would take the department of Choco 200 years to converge to
Bogota’s income per capita levels (Galvis and Meisel, 2012). The revenue sharing system between the
central and subnational governments (SGP) does little to change these inequalities, as fiscal equalisation
has not been a priority. The system also does not compensate for the better ability of well-off departments
and municipalities to raise their own revenues from local and departmental taxes compared to the poorer
departments.

ECO/WKP(2015)52
30
Figure 13. Income per capita inequality across regions is high
Gini coefficient across regions
1. For China, the autonomous regions of Hong Kong (China), Macau (China) and Chinese Taipei were excluded.
Source: OECD (2013d), OECD Regions at a Glance 2013.
67. Subnational governments have significant financial resources and spending responsibilities.
Subnational expenditures currently amount to one third of total general government expenditures, slightly
below the OECD average of around 40%. More than half of public investment is done by subnational
governments. However, their tax revenues represent only 18% of overall tax revenues, almost half the
OECD average (OECD, 2014). This vertical fiscal imbalance is not necessarily a problem, as it might be
more efficient to raise revenues at the national level while decentralising expenditures would better address
demands for local public goods, but it poses some challenges.
68. The effective degree of autonomy of subnational governments in Colombia in using the funds is
limited, however. Most of sub-national taxes and transfers from the revenue sharing system are earmarked,
mainly for education, health and water sanitation. The central government sets targets for coverage and
quality standards in each sector. The main objective is to guarantee that everybody has access to these key
public services with similar quality. Subnational governments are allowed to use any surplus resources in
areas of their choice only if these targets and standards have been accomplished. Thus, in general sub-
national governments basically execute expenditures with no autonomy and little incentive regarding how
to improve these services.
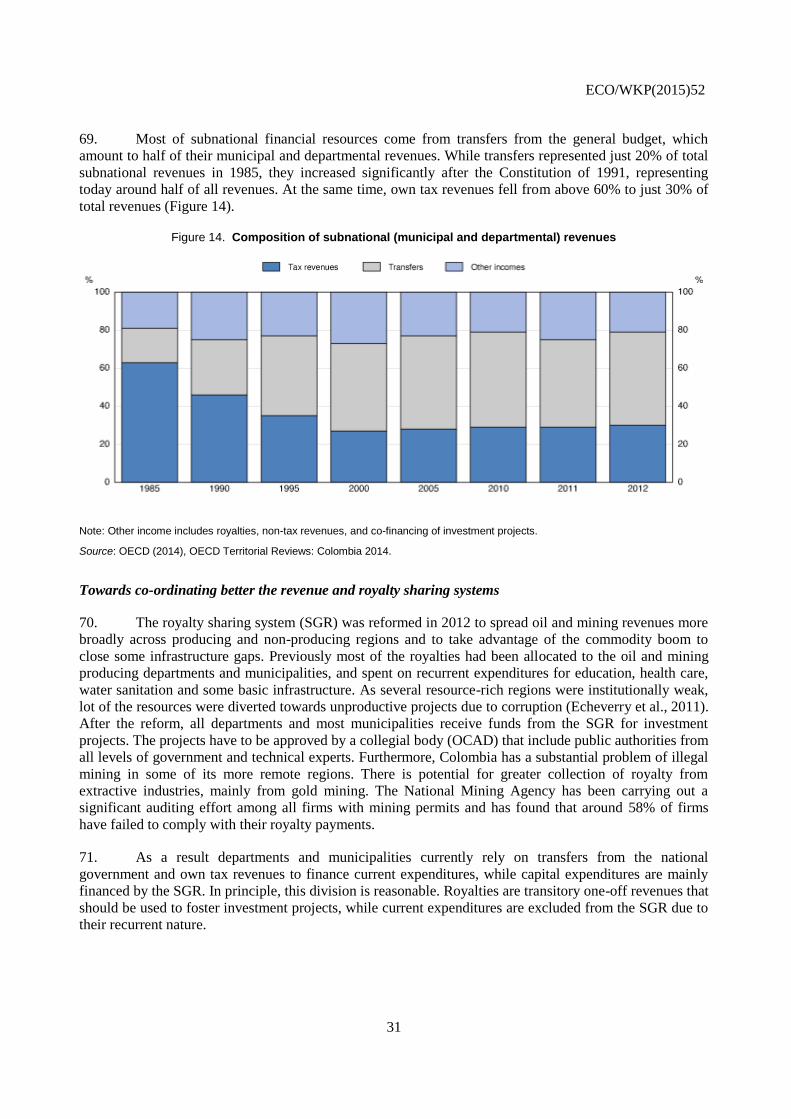
ECO/WKP(2015)52
31
69. Most of subnational financial resources come from transfers from the general budget, which
amount to half of their municipal and departmental revenues. While transfers represented just 20% of total
subnational revenues in 1985, they increased significantly after the Constitution of 1991, representing
today around half of all revenues. At the same time, own tax revenues fell from above 60% to just 30% of
total revenues (Figure 14).
Figure 14. Composition of subnational (municipal and departmental) revenues
Note: Other income includes royalties, non-tax revenues, and co-financing of investment projects.
Source: OECD (2014), OECD Territorial Reviews: Colombia 2014.
Towards co-ordinating better the revenue and royalty sharing systems
70. The royalty sharing system (SGR) was reformed in 2012 to spread oil and mining revenues more
broadly across producing and non-producing regions and to take advantage of the commodity boom to
close some infrastructure gaps. Previously most of the royalties had been allocated to the oil and mining
producing departments and municipalities, and spent on recurrent expenditures for education, health care,
water sanitation and some basic infrastructure. As several resource-rich regions were institutionally weak,
lot of the resources were diverted towards unproductive projects due to corruption (Echeverry et al., 2011).
After the reform, all departments and most municipalities receive funds from the SGR for investment
projects. The projects have to be approved by a collegial body (OCAD) that include public authorities from
all levels of government and technical experts. Furthermore, Colombia has a substantial problem of illegal
mining in some of its more remote regions. There is potential for greater collection of royalty from
extractive industries, mainly from gold mining. The National Mining Agency has been carrying out a
significant auditing effort among all firms with mining permits and has found that around 58% of firms
have failed to comply with their royalty payments.
71. As a result departments and municipalities currently rely on transfers from the national
government and own tax revenues to finance current expenditures, while capital expenditures are mainly
financed by the SGR. In principle, this division is reasonable. Royalties are transitory one-off revenues that
should be used to foster investment projects, while current expenditures are excluded from the SGR due to
their recurrent nature.

ECO/WKP(2015)52
32
72. While the new SGR has brought improvements, it also presents some challenges. The new
system has increased significantly the allocation of resources towards poor regions compared to the old
system (Bonet and Urrego, 2014). Nevertheless, the increase in subnational investment will require higher
recurrent maintenance expenditures from the SGP in the medium-term. This will put pressure on the
system, as departments and municipalities have too little own revenues. Therefore, co-ordinating better
both systems and encouraging subnational revenue mobilisation would improve efficiency in subnational
expenditures (OECD, 2014).
Subnational fiscal sustainability works but risk sharing can be improved
73. After fiscal sustainability problems of several subnational governments during the 1990s, a series
of amendments and changes managed to bring subnational finances into order. In particular, the reform of
the SGP in 2001 and the fiscal responsibility law of 2003 introduced changes in terms of revenue
distribution, targets and rules for subnational budget balances, lending and debt that have improve
subnational fiscal sustainability significantly (MHCP, 2014b; Box 5).
74. Until 2016, the Constitution states that transfers to subnational governments have to grow 3% per
annum in real terms. Additional one-off resources are transferred when real GDP grows above 4%. While
the current formula has the advantage of being very predictable and stable for subnational governments, it
puts a significant burden on the central government in terms of macroeconomic stabilisation. Although the
central government is in a better position to hedge some of the aggregate risks, if a significant growth
slowdown should occur, the current scheme would put significant pressures on the central government’s
fiscal accounts. Furthermore, it is also not very effective in sharing idiosyncratic risks across regions
(Bousquet, Daude and de la Maisonneuve, 2015).
75. There will be an opportunity to reform the system in 2016, as the current scheme expires. If no
reform is proposed, by default, transfers will grow at the same rate as revenues in the four previous years.
While a four-year average smoothes out part of the potential short-term fluctuations, it would be better if
transfers were linked to changes in structural revenues in line with the central government’s fiscal rule.
Furthermore, the overall system should be evaluated in terms of its effectiveness to share risks and reduce
regional inequalities.
There is room to raise more local property taxes and simplify the tax system
76. Despite having significant expenditure responsibilities, subnational governments mobilise little
revenue. Departmental revenues amount to less than 1% of GDP (around 5% of total tax revenues) from
excise taxes on beer, tobacco, liquors, a register tax as well as vehicle tax. Apart from their own
responsibilities, departments often take over basic services delivery from small municipalities with lower
capacities.
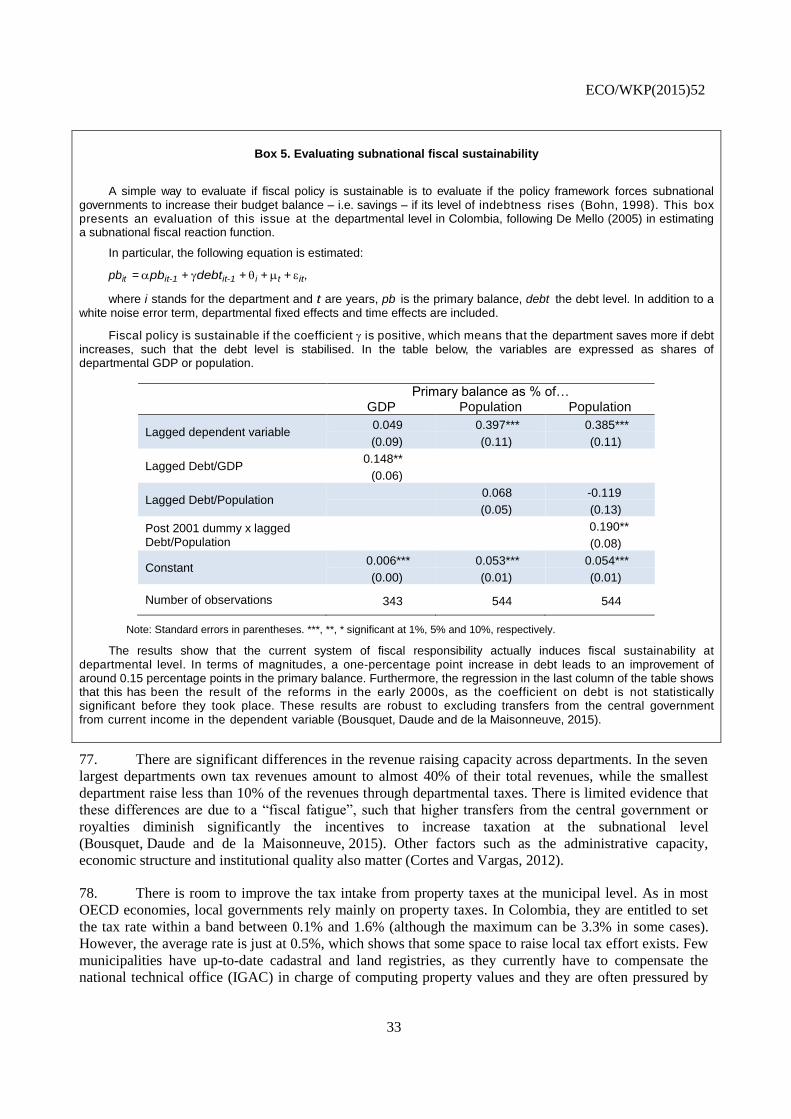
ECO/WKP(2015)52
33
Box 5. Evaluating subnational fiscal sustainability
A simple way to evaluate if fiscal policy is sustainable is to evaluate if the policy framework forces subnational governments to increase their budget balance – i.e. savings – if its level of indebtness rises (Bohn, 1998). This box presents an evaluation of this issue at the departmental level in Colombia, following De Mello (2005) in estimating a subnational fiscal reaction function.
In particular, the following equation is estimated:
pbit = pbit-1 + debtit-1 + i + t + it,
where i stands for the department and t are years, pb is the primary balance, debt the debt level. In addition to a white noise error term, departmental fixed effects and time effects are included.
Fiscal policy is sustainable if the coefficient is positive, which means that the department saves more if debt increases, such that the debt level is stabilised. In the table below, the variables are expressed as shares of departmental GDP or population.
Primary balance as % of…
GDP Population Population
Lagged dependent variable 0.049 0.397*** 0.385***
(0.09) (0.11) (0.11)
Lagged Debt/GDP 0.148**
(0.06)
Lagged Debt/Population 0.068 -0.119
(0.05) (0.13)
Post 2001 dummy x lagged Debt/Population
0.190**
(0.08)
Constant 0.006*** 0.053*** 0.054***
(0.00) (0.01) (0.01)
Number of observations 343 544 544
Note: Standard errors in parentheses. ***, **, * significant at 1%, 5% and 10%, respectively.
The results show that the current system of fiscal responsibility actually induces fiscal sustainability at departmental level. In terms of magnitudes, a one-percentage point increase in debt leads to an improvement of around 0.15 percentage points in the primary balance. Furthermore, the regression in the last column of the table shows that this has been the result of the reforms in the early 2000s, as the coefficient on debt is not statistically significant before they took place. These results are robust to excluding transfers from the central government from current income in the dependent variable (Bousquet, Daude and de la Maisonneuve, 2015).
77. There are significant differences in the revenue raising capacity across departments. In the seven
largest departments own tax revenues amount to almost 40% of their total revenues, while the smallest
department raise less than 10% of the revenues through departmental taxes. There is limited evidence that
these differences are due to a “fiscal fatigue”, such that higher transfers from the central government or
royalties diminish significantly the incentives to increase taxation at the subnational level
(Bousquet, Daude and de la Maisonneuve, 2015). Other factors such as the administrative capacity,
economic structure and institutional quality also matter (Cortes and Vargas, 2012).
78. There is room to improve the tax intake from property taxes at the municipal level. As in most
OECD economies, local governments rely mainly on property taxes. In Colombia, they are entitled to set
the tax rate within a band between 0.1% and 1.6% (although the maximum can be 3.3% in some cases).
However, the average rate is just at 0.5%, which shows that some space to raise local tax effort exists. Few
municipalities have up-to-date cadastral and land registries, as they currently have to compensate the
national technical office (IGAC) in charge of computing property values and they are often pressured by

ECO/WKP(2015)52
34
local lobbies for not doing so. Therefore, the national government should provide cadastral services free of
charge – or with a subsidy – and reward greater subnational tax effort (e.g. linking increases in transfers
from the central government to subnational revenue growth). This would also help develop land markets
needed to increase efficiency in the use of land.
79. Simplifying municipal taxation would reduce compliance costs and raise efficiency. Although
municipalities raise more than 80% from three taxes: property taxation, a turnover tax on businesses, and a
gasoline surtax, there are currently more than 19 local taxes and fees. Therefore, while many of these taxes
do not raise significant revenues, they increase the complexity of compliance and raise costs for
businesses. An overall simplification and elimination of some of these taxes would therefore be beneficial
for the local business climate without affecting revenues significantly. Furthermore, the tax base of
turnover taxes varies across municipalities, which also makes the system extremely complex. The national
government should define a common tax base and parameters for these taxes, while municipalities could
be allowed to set rates within a pre-established band.
Towards a comprehensive reform of the tax system
80. Colombia will need to raise considerably more tax revenues in the near future to finance social
expenditures and other investments needed. At the same time, Colombia should adjust its tax mix to make
the tax system less distortive and more inclusive. This will require a comprehensive tax reform.
81. To make the tax system more investment friendly, Colombia should shift the capital income tax
burden partly from the corporate towards the personal shareholder level. The corporate tax rates will have
to be lowered and the corporate tax base significantly broadened. A comprehensive tax reform implies also
taxing dividends and increasing the capital gains tax rate, and abolishing the wealth tax on businesses.
Many different options exist, but a dual income type of tax system where taxes on capital income can be
withheld at source seems an attractive way forward.
82. Colombia needs to develop a strategy that brings more taxpayers within the reach of the tax
administration. The tax and benefit system should no longer provide incentives for businesses to stay
informal. The recent reform in Mexico is an example to follow. The financial transaction tax should
therefore be phased out; abolishing the business wealth tax will also induce more businesses to go formal.
The resources of the tax administration (DIAN) have to be increased such that more effective audits can be
carried out and non-filers are identified; a better identification of taxpayers is crucial, including through
reporting obligations by third parties such as financial institutions and pension funds.
83. A larger formal sector would allow Colombia to raise more revenues from personal income taxes
as well as to fund the benefit system partly through social security contributions. The advantage of such a
reform is that richer taxpayers will bear a larger share of the tax burden. Broadening the base of the VAT,
and especially abolishing VAT exemptions on non-essential items, is part of such a reform strategy. The
VAT should be turned into a pure consumption tax.
84. Colombia should also aim at raising more revenues from environmentally related taxes,
immovable property and especially land. This will require a better property valuation system. Sub-central
governments can be given more taxing powers and the current sub-central funding system needs to be
revised.
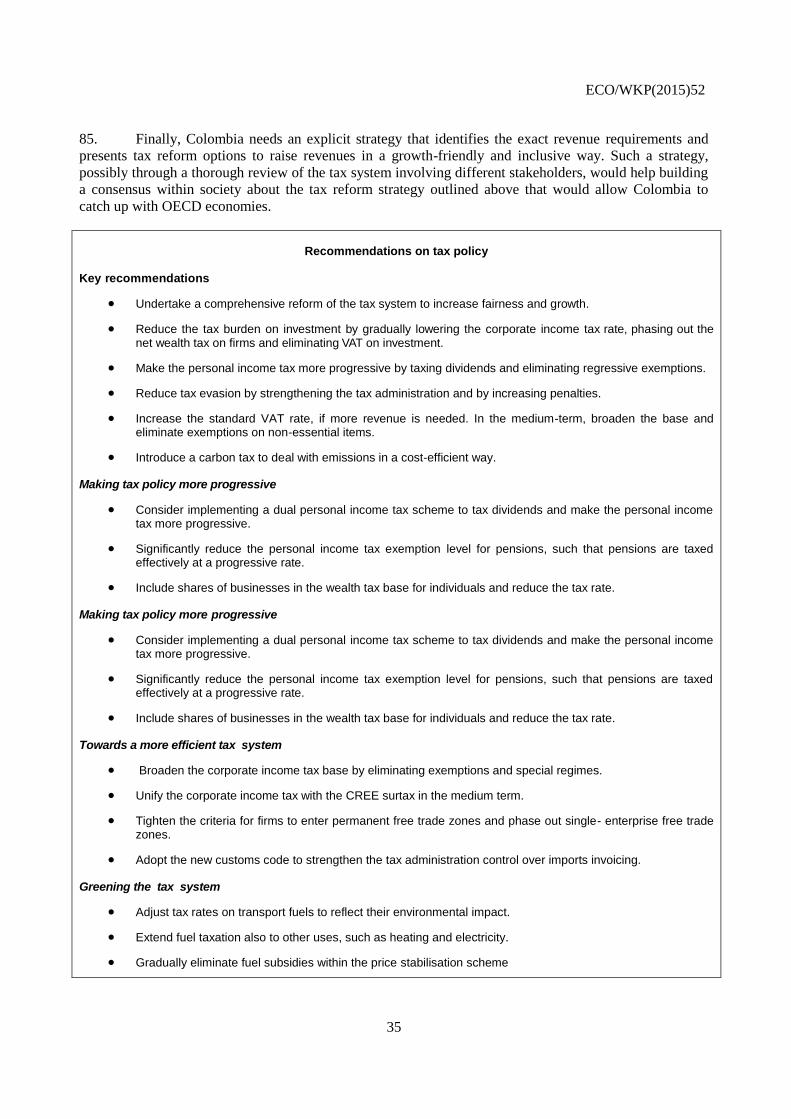
ECO/WKP(2015)52
35
85. Finally, Colombia needs an explicit strategy that identifies the exact revenue requirements and
presents tax reform options to raise revenues in a growth-friendly and inclusive way. Such a strategy,
possibly through a thorough review of the tax system involving different stakeholders, would help building
a consensus within society about the tax reform strategy outlined above that would allow Colombia to
catch up with OECD economies.
Recommendations on tax policy
Key recommendations
Undertake a comprehensive reform of the tax system to increase fairness and growth.
Reduce the tax burden on investment by gradually lowering the corporate income tax rate, phasing out the net wealth tax on firms and eliminating VAT on investment.
Make the personal income tax more progressive by taxing dividends and eliminating regressive exemptions.
Reduce tax evasion by strengthening the tax administration and by increasing penalties.
Increase the standard VAT rate, if more revenue is needed. In the medium-term, broaden the base and eliminate exemptions on non-essential items.
Introduce a carbon tax to deal with emissions in a cost-efficient way.
Making tax policy more progressive
Consider implementing a dual personal income tax scheme to tax dividends and make the personal income tax more progressive.
Significantly reduce the personal income tax exemption level for pensions, such that pensions are taxed effectively at a progressive rate.
Include shares of businesses in the wealth tax base for individuals and reduce the tax rate.
Towards a more efficient tax system
Broaden the corporate income tax base by eliminating exemptions and special regimes.
Unify the corporate income tax with the CREE surtax in the medium term.
Tighten the criteria for firms to enter permanent free trade zones and phase out single- enterprise free trade zones.
Adopt the new customs code to strengthen the tax administration control over imports invoicing.
Greening the tax system
Adjust tax rates on transport fuels to reflect their environmental impact.
Extend fuel taxation also to other uses, such as heating and electricity.
Gradually eliminate fuel subsidies within the price stabilisation scheme

ECO/WKP(2015)52
36
BIBLIOGRAPHY
Alvaredo, F. and J. Londoño (2013), “High Incomes and Personal Taxation in a Developing Economy:
Colombia 1993-2010”, CEQ Working Paper, No. 12, March.
Arbeláez, M.A., L.E. Burman and S. Zuluaga (2004), “The Bank Debit Tax in Colombia”, Fedesarrollo,
accessed www.fedesarrollo.org.co/wp-content/uploads/2011/08/The-Bank-Debit-Tax-in-Colombia-
v8.pdf.
Arias, A., A. Carrasquilla and A. Galindo (2002), “Efectos en bienestar de la repression financiera”,
Documento CEDE 2002-02 ISSN 1657-7191, CEDE, Universidad de los Andes.
Arnold, J. et al. (2011), “Tax Policy for Economic Recovery and Growth”, Economic Journal, Vol. 121,
Issue 550, pp. 59-80.
Avendaño, N. (2013), “Colombia’s indirect tax system: slowly moving in the right direction”, World
Journal of VAT/GST Law, Vol. 2, Issue 2, pp. 136-140,
http://dx.doi.org/10.5235/20488432.2.2.136.
Bogotá Municipality (2014), “Surtax on gasoline”, accessed on 25 August 2014,
http://impuestos.shd.gov.co/portal/page/portal/portal_internet_sdh/impuestos/otros_imp/sobretasa_a
_la_gasolina.
Bohn, H. (1998), “The Behaviour of US Public Debt and Deficits”, Quarterly Journal of Economics, Vol.
113(3), pp. 949-963.
Bonet, J. (2006), “Fiscal decentralization and regional income disparities”, Annals of Regional Science,
Vol. 40, pp. 661-676.
Bonet, J. and J. Urrego (2014), “El Sistema General de Regalías: ¿mejoró, empeoró o quedó igual?”,
Documentos de trabajo de economía regional, No. #198, Banco de la República, Centro de
Estudios Económicos Regionales, Cartagena.
Bousquet, G., C. Daude and C. de la Maisonneuve (2015), “Fiscal decentralisation in Colombia: New
evidence regarding sustainability, risk sharing and fiscal fatigue”, OECD Economics Department
Working Paper, No. 1202.
Brys, B. and S. Perret (2015), “Encouraging Investment through tax policy reform in Colombia”, OECD
Economics Department Working Paper 1204.
Clavijo, S., A. Vera and N. Vera (2013), Estructural fiscal de Colombia y ajustes requeridos (2012-20),
ANIF. Colombian Government (2014), “Official diary of 30 January 2014, Resolution 40 of 2014,
adjusting fuel tax rates”, accessed on 25 August 2014, www.leyex.info/diario/49049.pdf.
Cortés, D. and J.F. Vargas (2012), “Inequidad Regional en Colombia”, Documentos CEDE, No. 34,
Universidad de los Andes.
Daude, C. and J. Pascal (2015), “Efficiency and Contestability in the Colombian Banking System”, OECD
Economics Department Working Paper, No. 1203.

ECO/WKP(2015)52
37
De la Maisonneuve, C. (2015), “Reforming the pension system to increase coverage and equity in
Colombia”, OECD Economics Department Working Paper, No. 1235.
De Mello, L. (2005), “Estimating a Fiscal Reaction Function: The Case of Debt Sustainability in Brazil”,
OECD Economics Department Working Paper, No. 423, OECD Publishing,
http://dx.doi.org/10.1787/556325773018.
Echeverry Garzón, J.C., G. Alonso Masmela and A. García Montaña (2011b), “Por qué es necesaria la
creación de un Sistema General de Regalías”, Notas Fiscales, Ministerio de Hacienda y Crédito
Público, No. 2, January.
Fenochietto, R. and C. Pessino (2013), “Understanding Countries’ Tax Effort”, IMF Working Paper, No.
13/244, International Monetary Fund, Washington, DC.
Galindo, A. and G. Majnoni (2006), “Represión financiera y el costo del financiamiento en Colombia”,
Finance, Private Sector and Infrastructure Group, World Bank, June.
Galvis, L.A. and A. Meisel (2012), “Convergencia y trampas espaciales de pobreza en Colombia:
Evidencia reciente”, Documento de trabajo sobre economía regional, No. #177, Banco de la
República, Centro de Estudios Económicos Regionales, Cartagena.
Gómez Sabaini, J.C. and J.P. Jiménez (2012), “Tax Structure and Tax Evasion in Latin America”, Serie
Macroeconomía del desarrollo, No. 118, CEPAL.
Hajkova, D., G. Nicoletti, L. Vartia and K.Y. Yoo (2007), “Taxation, Business Environment and FDI
Location in OECD Countries”, OECD Economic Studies, No. 43, Vol. 2006/2, OECD Publishing.
Harding, M. (2014), “The Diesel Differential: Differences in the Tax Treatment of Gasoline and Diesel for
Road Use”, OECD Taxation Working Paper, No. 21, OECD Publishing,
http://dx.doi.org/10.1787/5jz14cd7hk6b-en.
IADB (2013), More than Revenue: Taxation as a Development Tool, Corbacho, A., V. Fretes Cibils and
E. Lora (eds.), Development in the Americas, Inter-American Development Bank, Washington, DC.
Kojima, M. (2013), “Petroleum product pricing and complementary policies”, Policy Research Working
Paper, No. 6396, Sustainable Energy Department, World Bank.
Matheson, T. (2011), “Taxing Financial Transactions: Issues and Evidence”, IMF Working Paper, Fiscal
Affairs Department.
Ministerio de Hacienda y Crédito Público (2014a), Marco Fiscal de Mediano Plazo, June.
Ministerio de Hacienda y Crédito Público (2014b), Quince Años de transformación fiscal territorial en
Colombia 1997-2012, February.
Ministry of Mining and Energy (2012), “Escenarios de Oferta y Demanda de Hidrocarburos en Colombia”,
UPME, December.
OECD (2007), Improving Access to Bank Information for Tax Purposes: The 2007 Progress Report,
OECD Publishing, Paris.

ECO/WKP(2015)52
38
OECD (2010), Tax Policy Reform and Economic Growth, OECD Tax Policy Studies, No. 20, OECD
Publishing.
OECD (2013a), Tax Administration 2013: Comparative Information on OECD and Other Advanced and
Emerging Economies, OECD Publishing, Paris.
OECD (2013b), Taxing energy use. A graphical analysis, OECD Publishing.
OECD (2013c), OECD Economic Surveys: Colombia 2013 – Economic Assessment, OECD Publishing.
OECD (2013d), OECD Regions at a Glance 2013, OECD Publishing.
OECD (2014), OECD Territorial Reviews: Colombia 2014, OECD Publishing.
OECD/ECLAC (2014), OECD Environmental Performance Reviews: Colombia 2014, OECD Publishing.
OECD/ECLAC/CIAT (2013), Revenue Statistics in Latin America, OECD Publishing, Paris.
Pessino, C., and R. Fenochietto (2010), “Determining Countries’ Tax Effort”, Hacienda Pública Española/
Revista de Economía Pública, Vol. 195, pp. 61-68.
Steiner, R. (2014), “Taxation and Economic Growth in Colombia”, IDB Working Paper Series, No. IDB-
WP-493, Inter-American Development Bank, Washington, DC, February.
Steiner, R. and A. Cañas (2013), “Tributación y equidad en Colombia”, mimeo, Fedesarrollo.
Steiner, R. and J.C. Medellin (2014), “Parte II: Elementos para una nueva reforma tributaria”, in
Perspectivas Fiscal 2014-18, Fedesarrollo, April.
USAID (2013), “Detailed Guidelines for Improved Tax Administration in Latin America and the
Caribbean”, USAID Leadership in Public Financial Management.
Yori Parra, G., D.M. Parra Garzón and P.H. Sierra Reyes (2013), “El Gasto Tributario en Colombia.
Principales beneficios en el impuesto sobre la renta e IVA. Años gravables 2010 y 2011.
Actualización”, Cuaderno de Trabajo, No. 50, DIAN, December
ECO/WKP(2015)52
39
WORKING PAPERS
The full series of Economics Department Working Papers can be consulted at www.oecd.org/eco/workingpapers
1233. Skills and labour market performance in Sweden
(May 2015) by Margherita Bussi and Jon Kristian Pareliussen
1232. Skills and inclusive growth in Sweden
(May 2015) by Jon Kristian Pareliussen, Margherita Bussi, Christophe André and Vincent Koen
1231. Incorporating anchored inflation expectations in the Phillips Curve and in the derivation of
OECD measures of equilibrium unemployment
(May 2015) by Elena Rusticelli, David Turner and Maria Chiara Cavalleri
1230. Macroeconomic uncertainties, prudent debt targets and fiscal rules,
(July 2015) by Falilou Fall and Jean-Marc Fournier
1229. Limits to government debt sustainability
(July 2015) by Jean-Marc Fournier and Falilou Fall
1228. Government debt indicators: understanding the data
(July 2015) by Debbie Bloch and Falilou Fall
1227. The costs of flexibility-enhancing structural reforms: a literature review
(July 2015) by Tito Boeri, Pierre Cahuc and André Zylberberg
1226. Household finance and income inequality in the euro area
(June 2015) Oliver Denk and Alexandre Cazenave-Lacroutz
1225. Financial sector pay and labour income inequality: evidence from Europe
(June 2015) by Oliver Denk
1224. Finance and income inequality in OECD countries
(June 2015) by Oliver Denk and Boris Cournède
1223. Finance and economic growth in OECD and G20 countries
(June 2015) by Boris Cournède and Oliver Denk
1222. What impedes household investment in energy efficiency and renewable energy?
(May 2015) by Nadia Ameli and Nicola Brandt
1221. Recent trends in productivity in China – shift-share analysis of labour productivity growth and
the evolution of the productivity gap
(May 2015) by Margit Molnar and Thomas Chalaux
1220. Assessing China's skills gap and inequalities in education
(May 2015) by Margit Molnar, Boqing Wang and Ruidong Gao
1219. Providing the right skills to all in China – from “made in China” to “created in China”
(May 2015) by Margit Molnar and Vincent Koen

ECO/WKP(2015)52
40
1218. Agricultural reforms and bridging the gap for rural China
(May 2015) by Ben Westmore
1217. A snapshot of China’s service sector
(May 2015) by Margit Molnar and Wei Wang
1216. Does the post-crisis weakness of global trade solely reflect weak demand?
(May 2015) by Patrice Ollivaud and Cyrille Schwellnus
1215. Estonia: raising productivity and benefitting more from openness
(May 2015) by Andreas Kappeler
1214. Estonia: making the most of human capital
(May 2015) by Andrés Fuentes Hutfilter
1213. The Czech labour market: documenting structural change and remaining challenges
(May 2015) by Sónia Araújo and Petr Malecek
1212. Reforming the Slovak public sector
(April 2015) by Lilas Demmou and Robert Price
1211. Spurring growth in lagging regions in the Slovak Republic
Lilas Demmou, Martin Haluš, Gabriel Machlica and Robert Menkyna
1211. Spurring growth in lagging regions in the Slovak Republic
(April 2015) by Lilas Demmou, Gabriel Machlica, Martin Haluš and Robert Menkyna
1210. Skill mismatch and public policy in OECD countries
(April 2015) by Müge Adalet McGowan and Dan Andrews
1209. Labour market mismatch and labour productivity: evidence from PIAAC data
(April 2015) by Müge Adalet McGowan and Dan Andrews
1208. Maintaining an efficient and equitable housing market in Belgium
(April 2015) by Sanne Zwart
1207. Determinants of the low female labour force participation in India
(April 2015) by Piritta Sorsa, Jan Mares, Mathilde Didier, Caio Guimaraes, Marie Rabate,
Gen Tang and Annamaria Tuske
1206. Strengthening skill use and school-to-work transitions in the Czech Republic
(April 2015) by Sónia Araújo and Petr Malecek
1205. Reforming the tax on immovable property: taking care of the unloved
(April 2015) by Hansjörg Blöchliger
1204. Taxation and investment in Colombia
(April 2015) by Sarah Perret and Bert Brys
1203. Efficiency and contestability in the Colombian banking system
(April 2015) by Christian Daude and Julien Pascal