making america rich again: the latino effect on economic ... · the latino effect on economic...
TRANSCRIPT
Jeffrey A. Eisenach, Ph.D.December 2016
Making America Rich Again: The Latino Effect on Economic Growth

About the Author
Dr. Eisenach is a Managing Director and Co-Chair of NERA’s Communications, Media, and
Internet Practice. He is also an Adjunct Professor at George Mason University Law School,
where he teaches Regulated Industries, and a Visiting Scholar at the American Enterprise
Institute, where he focuses on policies affecting the information technology sector,
innovation, and entrepreneurship. Previously, Dr. Eisenach served in senior policy positions at
the US Federal Trade Commission and the White House Office of Management and Budget,
and on the faculties of Harvard University’s Kennedy School of Government and Virginia
Polytechnic Institute and State University.
The author is grateful to Carey Ransone and Patrick McGervey for their assistance with this
report, and to the Latino Donor Collaborative and RBC Capital Markets for their sponsorship.
The views expressed are exclusively his own and do not necessarily represent those of NERA
Economic Consulting or any of the institutions with which he is affiliated.
1
I. Introduction
This study presents a comprehensive analysis of the contribution made by Latino Americans1 to the US economy, based on data from a wide variety of government and private sources. The findings are striking: To an extent few appreciate, the US Latino population is growing, young, increasingly educated, employed, connected, entrepreneurial, and upwardly mobile in terms of income as well as consumption.
Consider the following:
• While much of the developed world is facing stagnant population growth and an increasingly elderly age distribution, growth in the Latino population is keeping America both young and growing. Between 1990 and 2015, the Latino population grew from 22 million to 57 million, roughly five times as fast as the population overall. To illustrate this rapid growth, consider that if the Latino population had grown at the same rate as the rest of the US, there would be 30 million fewer Americans today.
• At 28 years old, the median Latino is nine years younger than the population at large and 15 years younger than the median white. Millenials make up 26 percent of the Hispanic population, compared to 22 percent for the US population. Economic research suggests that the youthful demographic profile of the Latino population enhances productivity and increases growth in per capita incomes.
• Latinos are responsible for 29 percent of the growth in real income since 2005. They account for roughly 10 cents of every dollar of US national income, and that proportion is rising both due to growth in the Latino population and rising per capita earnings.
• Latinos play a critical role in the labor force, both as employees and, especially, as job creators and entrepreneurs. They are more likely to participate in the labor force (65.9 percent vs. 62.7 percent) and to be employed (61.6 percent vs. 59.3 percent) than the overall US population. While Latinos account for 17 percent of all workers, they account for 21 percent of new entrepreneurs. Latinos accounted for nearly half—46 percent—of the growth in employment from 2011 to 2015.
1 Throughout this report, the words “Hispanic” and “Latino” are used interchangeably to refer to ethnic Latinos
in the United States. Further, for simplicity of exposition, the report refers to Hispanics, whites, and other groups as “ethnic” groups (as opposed to “racial” or “racial-ethnic” groups). For statistical purposes, the U.S. Office of Management and Budget (OMB) defines “Hispanic or Latino” as a “person of Cuban, Mexican, Puerto Rican, South or Central American, or other Spanish culture or origin, regardless of race. The term, ‘Spanish origin,’ can be used in addition to ‘Hispanic or Latino.’” See Standard for Maintaining, Collecting, and Presenting Federal Data on Race and Ethncity,” Office of Management and Budget (October 30, 1997) (available at https://www.whitehouse.gov/sites/default/files/omb/assets/information_and_regulatory_affairs/re_app-a-update.pdf). See also “Revisions to the Standards for the Classification of Federal Data on Race and Ethnicity,” Office of Management and Budget (October 30, 1997) (available at https://www.whitehouse.gov/omb/fedreg_1997standards).
2
• The Hispanic poverty rate is falling more rapidly than for the rest of the population: Hispanic poverty fell by 2.2 points from 2014 to 2015 (from 23.6 percent to 21.4 percent in 2015) while the national average rate fell by 1.3 points—and Hispanics are the only major ethnic group with a lower poverty rate today than in 2007.
• As consumers, Latinos wield more than $1.3 trillion in buying power, and the number of affluent Hispanic households is growing much faster than for the overall population: In 2015, there were approximately 370,000 US Latino households with incomes over $200,000, an increase of 187 percent since 2005.
• The Latino population is also becoming more geographically dispersed across the US. The final section of this study presents data on the 25 Metropolitan Statistical Areas (MSAs) with the largest Latino economies, as measured by aggregate personal income. These communities are located in every region of the US, from Atlanta to Denver, Chicago to Miami, Los Angeles to Washington, DC, and together account for more than 36 million Latinos with combined incomes of over $650 billion. Over the last decade, Latinos accounted for 22 percent of the growth in personal income in these MSAs.
The remainder of this study is organized as follows. Section II focuses on Latino demographics, including the growth and age distribution of the Latino population and characteristics, such as educational achievement and Internet connectivity. Section III presents data on the role of Latinos as workers and entreprenuers. Section IV presents data on Latino income and purchasing power. Section V focuses on the top 25 power MSAs. Section VI provides a brief summary of the findings.
3
II. The Latino Population: Growing, Young, Educated, Connected
Latinos represent the fastest growing ethnic group in the US, accounting for 53 percent of US population growth since 2000. Indeed, if the Latino population had grown at the same rate as the rest of the US population from 1990 to 2015, there would be 30 million fewer Americans today, meaning millions fewer workers, consumers, and taxpayers. Importantly, Hispanics are much younger than other Americans, with a median age of 28 years old compared to 37 years old for all others. While Hispanics have traditionally lagged behind other groups in educational attainment, they are catching up rapidly. It bodes well that the Latino population is in many respects more connected to the Internet and electronic media than most other non-Hispanic Americans.2
2 This section focuses on population growth and demographic characteristics. In the abstract, population growth
can have both positive and negative effects, but the data presented below demonstrate that Latinos are contributing disproportionately to U.S. economic prosperity as well as to demographic vitality.
4
A. Latinos Account for More than Half of US Population Growth
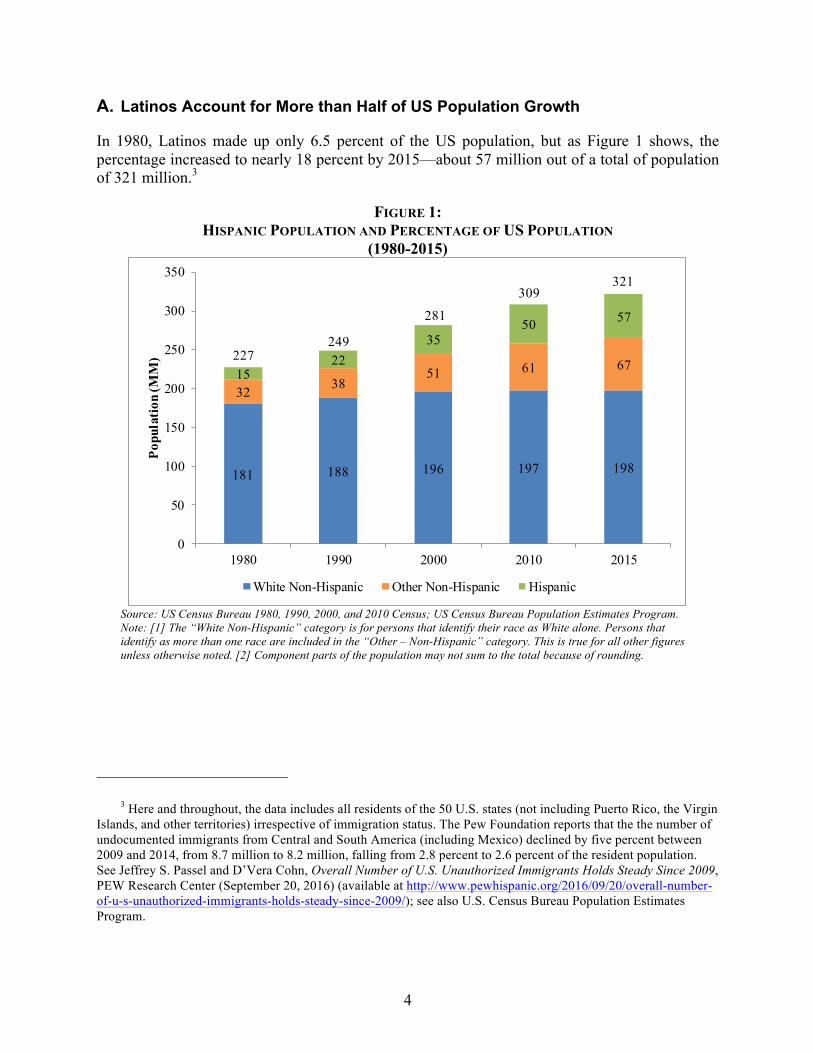
In 1980, Latinos made up only 6.5 percent of the US population, but as Figure 1 shows, the percentage increased to nearly 18 percent by 2015—about 57 million out of a total of population of 321 million.3
FIGURE 1: HISPANIC POPULATION AND PERCENTAGE OF US POPULATION
(1980-2015)
Source: US Census Bureau 1980, 1990, 2000, and 2010 Census; US Census Bureau Population Estimates Program. Note: [1] The “White Non-Hispanic” category is for persons that identify their race as White alone. Persons that identify as more than one race are included in the “Other – Non-Hispanic” category. This is true for all other figures unless otherwise noted. [2] Component parts of the population may not sum to the total because of rounding.
3 Here and throughout, the data includes all residents of the 50 U.S. states (not including Puerto Rico, the Virgin
Islands, and other territories) irrespective of immigration status. The Pew Foundation reports that the the number of undocumented immigrants from Central and South America (including Mexico) declined by five percent between 2009 and 2014, from 8.7 million to 8.2 million, falling from 2.8 percent to 2.6 percent of the resident population. See Jeffrey S. Passel and D’Vera Cohn, Overall Number of U.S. Unauthorized Immigrants Holds Steady Since 2009, PEW Research Center (September 20, 2016) (available at http://www.pewhispanic.org/2016/09/20/overall-number-of-u-s-unauthorized-immigrants-holds-steady-since-2009/); see also U.S. Census Bureau Population Estimates Program.
181 188 196 197 198
32 3851 61 67
1522
3550 57
227249
281
309321
0
50
100
150
200
250
300
350
1980 1990 2000 2010 2015
Popu
latio
n (M
M)
White Non-Hispanic Other Non-Hispanic Hispanic
5
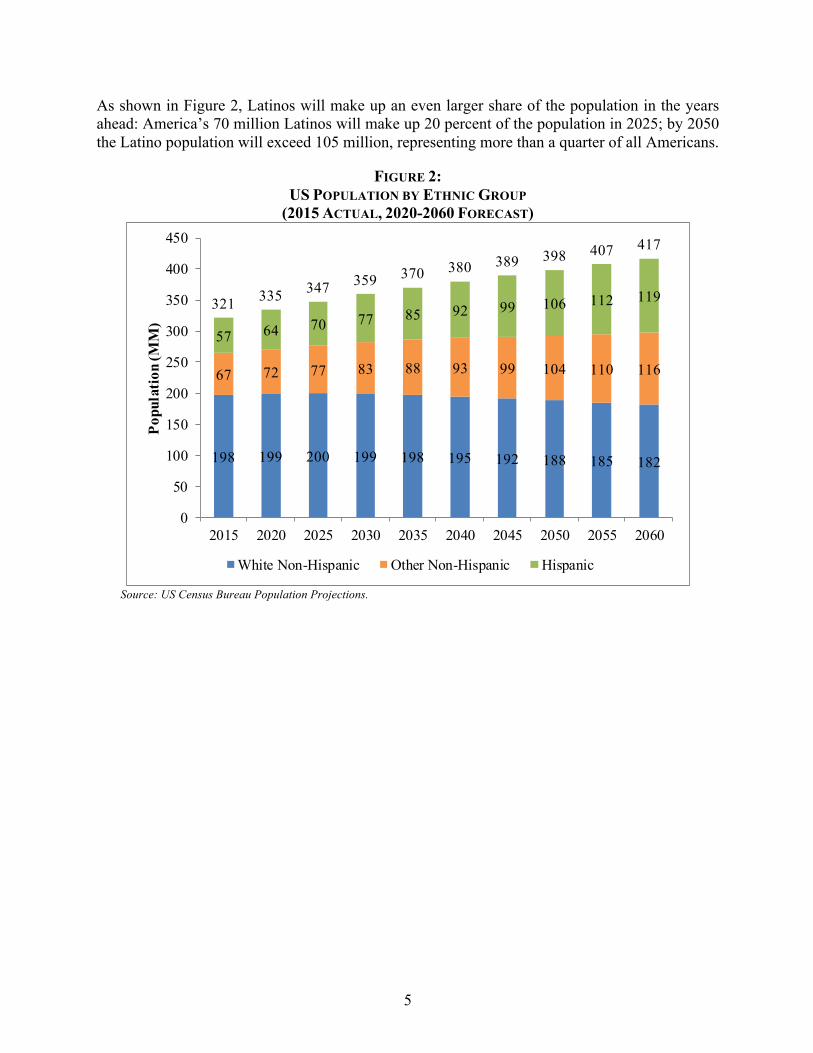
As shown in Figure 2, Latinos will make up an even larger share of the population in the years ahead: America’s 70 million Latinos will make up 20 percent of the population in 2025; by 2050 the Latino population will exceed 105 million, representing more than a quarter of all Americans.
FIGURE 2: US POPULATION BY ETHNIC GROUP
(2015 ACTUAL, 2020-2060 FORECAST)
Source: US Census Bureau Population Projections.
198 199 200 199 198 195 192 188 185 182
67 72 77 83 88 93 99 104 110 116
57 64 70 77 85 92 99 106 112 119321 335 347 359 370 380 389 398 407 417
0
50
100
150
200
250
300
350
400
450
2015 2020 2025 2030 2035 2040 2045 2050 2055 2060
Popu
latio
n (M
M)
White Non-Hispanic Other Non-Hispanic Hispanic
6
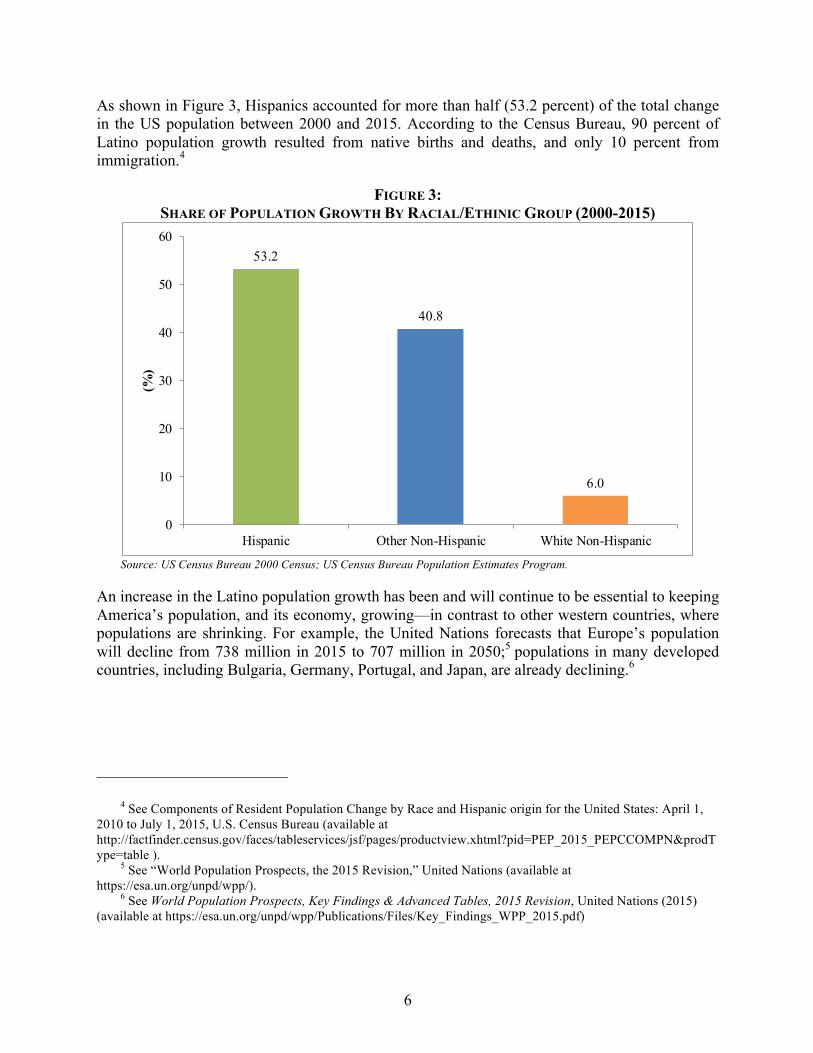
As shown in Figure 3, Hispanics accounted for more than half (53.2 percent) of the total change in the US population between 2000 and 2015. According to the Census Bureau, 90 percent of Latino population growth resulted from native births and deaths, and only 10 percent from immigration.4
FIGURE 3: SHARE OF POPULATION GROWTH BY RACIAL/ETHINIC GROUP (2000-2015)
Source: US Census Bureau 2000 Census; US Census Bureau Population Estimates Program.
An increase in the Latino population growth has been and will continue to be essential to keeping America’s population, and its economy, growing—in contrast to other western countries, where populations are shrinking. For example, the United Nations forecasts that Europe’s population will decline from 738 million in 2015 to 707 million in 2050;5 populations in many developed countries, including Bulgaria, Germany, Portugal, and Japan, are already declining.6
4 See Components of Resident Population Change by Race and Hispanic origin for the United States: April 1,
2010 to July 1, 2015, U.S. Census Bureau (available at http://factfinder.census.gov/faces/tableservices/jsf/pages/productview.xhtml?pid=PEP_2015_PEPCCOMPN&prodType=table ).
5 See “World Population Prospects, the 2015 Revision,” United Nations (available at https://esa.un.org/unpd/wpp/).
6 See World Population Prospects, Key Findings & Advanced Tables, 2015 Revision, United Nations (2015) (available at https://esa.un.org/unpd/wpp/Publications/Files/Key_Findings_WPP_2015.pdf)
53.2
40.8
6.0
0
10
20
30
40
50
60
Hispanic Other Non-Hispanic White Non-Hispanic
(%)
7
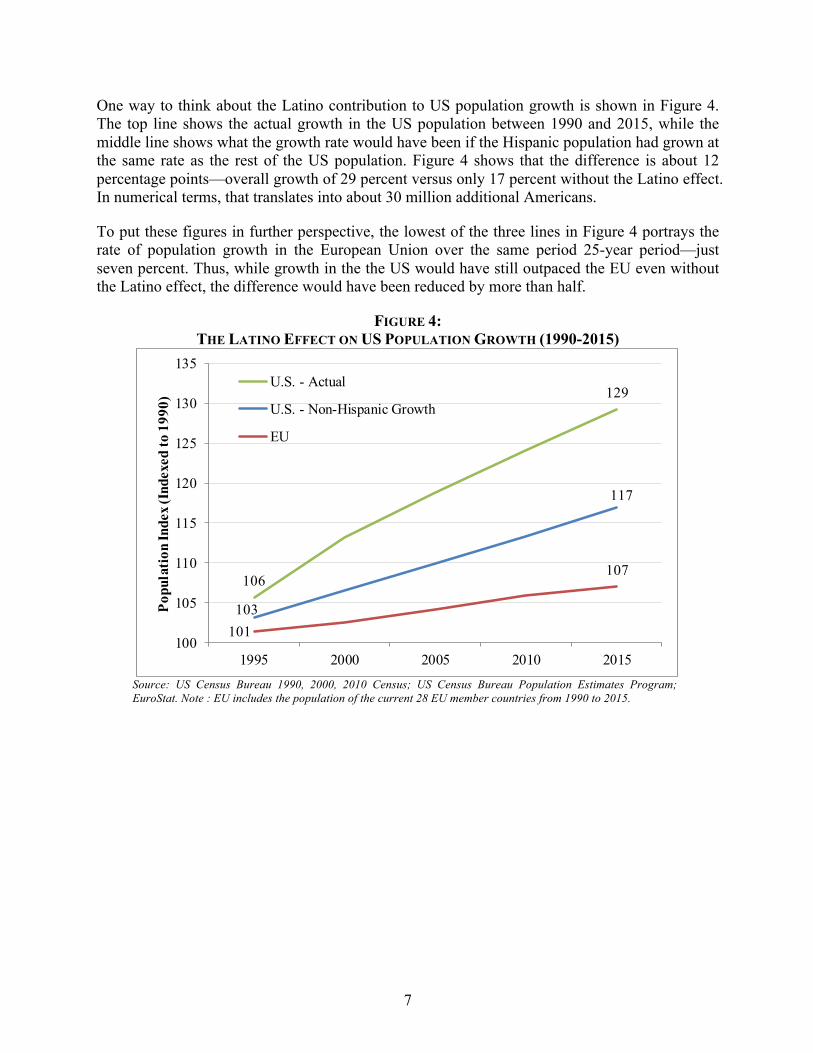
One way to think about the Latino contribution to US population growth is shown in Figure 4. The top line shows the actual growth in the US population between 1990 and 2015, while the middle line shows what the growth rate would have been if the Hispanic population had grown at the same rate as the rest of the US population. Figure 4 shows that the difference is about 12 percentage points—overall growth of 29 percent versus only 17 percent without the Latino effect. In numerical terms, that translates into about 30 million additional Americans.
To put these figures in further perspective, the lowest of the three lines in Figure 4 portrays the rate of population growth in the European Union over the same period 25-year period—just seven percent. Thus, while growth in the the US would have still outpaced the EU even without the Latino effect, the difference would have been reduced by more than half.
FIGURE 4: THE LATINO EFFECT ON US POPULATION GROWTH (1990-2015)
Source: US Census Bureau 1990, 2000, 2010 Census; US Census Bureau Population Estimates Program; EuroStat. Note : EU includes the population of the current 28 EU member countries from 1990 to 2015.
106
129
103
117
101
107
100
105
110
115
120
125
130
135
1995 2000 2005 2010 2015
Popu
latio
n In
dex (
Inde
xed
to 1
990)
U.S. - Actual
U.S. - Non-Hispanic Growth
EU
8
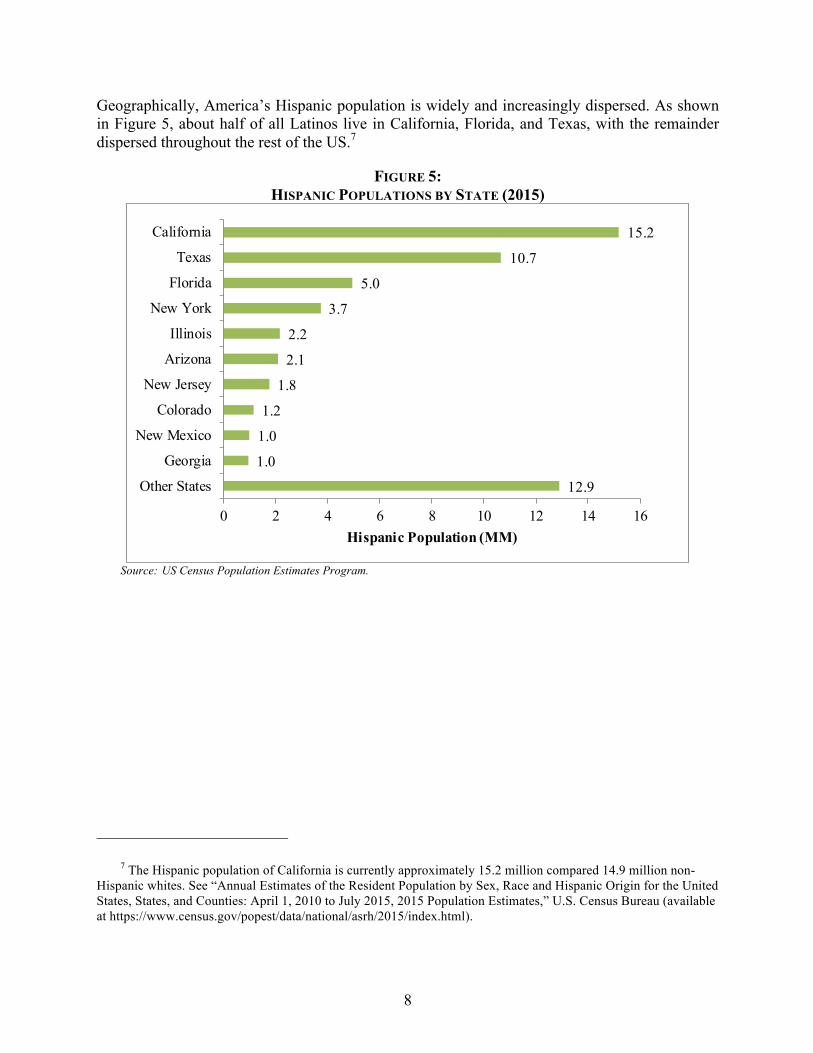
Geographically, America’s Hispanic population is widely and increasingly dispersed. As shown in Figure 5, about half of all Latinos live in California, Florida, and Texas, with the remainder dispersed throughout the rest of the US.7
FIGURE 5: HISPANIC POPULATIONS BY STATE (2015)
Source: US Census Population Estimates Program.
7 The Hispanic population of California is currently approximately 15.2 million compared 14.9 million non-
Hispanic whites. See “Annual Estimates of the Resident Population by Sex, Race and Hispanic Origin for the United States, States, and Counties: April 1, 2010 to July 2015, 2015 Population Estimates,” U.S. Census Bureau (available at https://www.census.gov/popest/data/national/asrh/2015/index.html).
12.9
1.0
1.0
1.2
1.8
2.1
2.2
3.7
5.0
10.7
15.2
0 2 4 6 8 10 12 14 16
Other States
Georgia
New Mexico
Colorado
New Jersey
Arizona
Illinois
New York
Florida
Texas
California
Hispanic Population (MM)
9
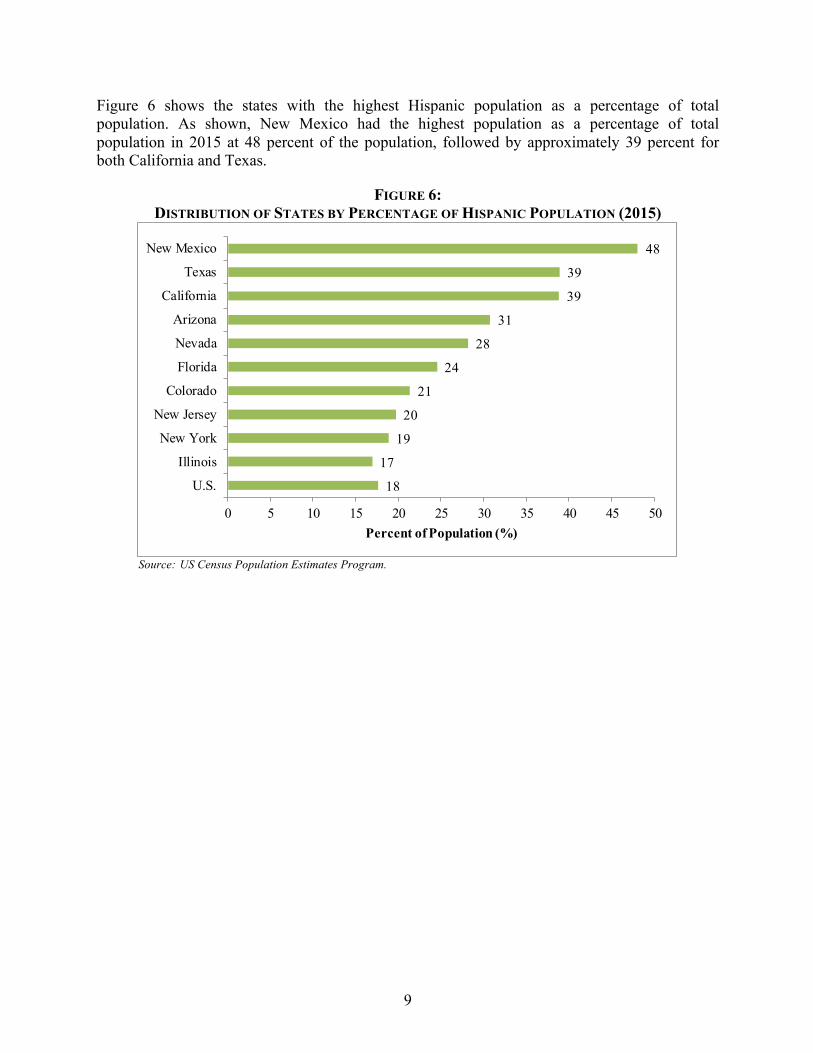
Figure 6 shows the states with the highest Hispanic population as a percentage of total population. As shown, New Mexico had the highest population as a percentage of total population in 2015 at 48 percent of the population, followed by approximately 39 percent for both California and Texas.
FIGURE 6: DISTRIBUTION OF STATES BY PERCENTAGE OF HISPANIC POPULATION (2015)
Source: US Census Population Estimates Program.
18
17
19
20
21
24
28
31
39
39
48
0 5 10 15 20 25 30 35 40 45 50
U.S.
Illinois
New York
New Jersey
Colorado
Florida
Nevada
Arizona
California
Texas
New Mexico
Percent of Population (%)
10
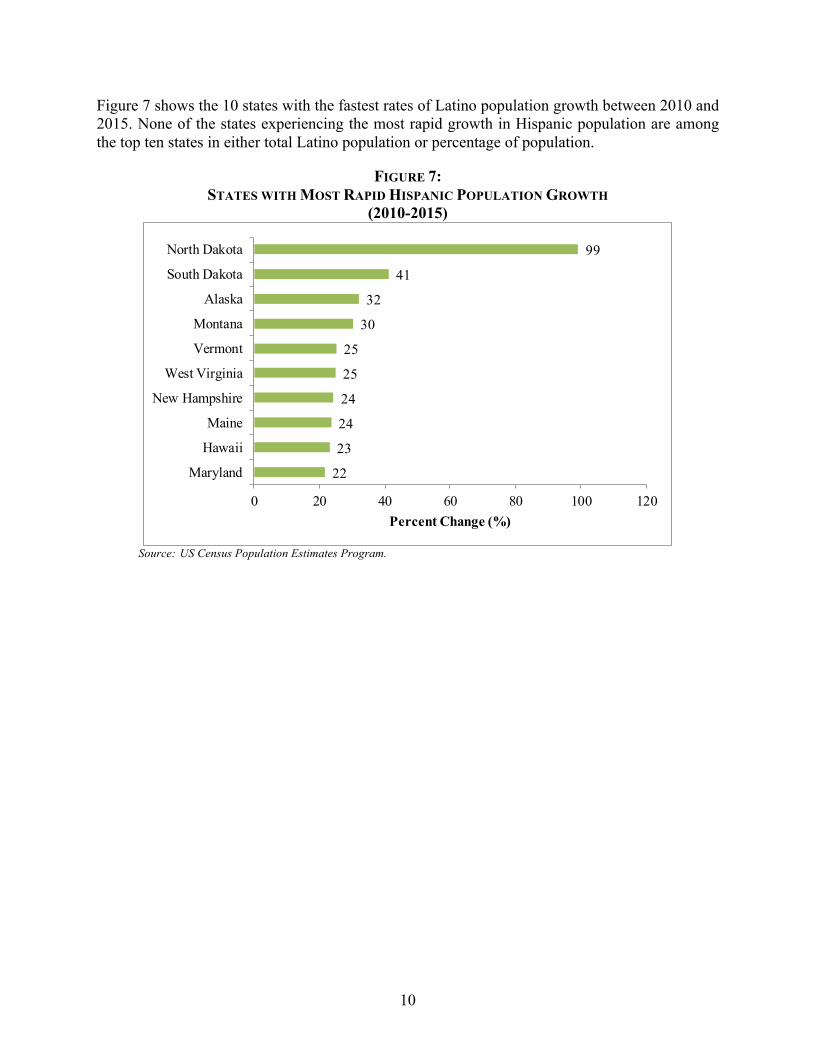
Figure 7 shows the 10 states with the fastest rates of Latino population growth between 2010 and 2015. None of the states experiencing the most rapid growth in Hispanic population are among the top ten states in either total Latino population or percentage of population.
FIGURE 7: STATES WITH MOST RAPID HISPANIC POPULATION GROWTH
(2010-2015)
Source: US Census Population Estimates Program.
22
23
24
24
25
25
30
32
41
99
0 20 40 60 80 100 120
Maryland
Hawaii
Maine
New Hampshire
West Virginia
Vermont
Montana
Alaska
South Dakota
North Dakota
Percent Change (%)
11
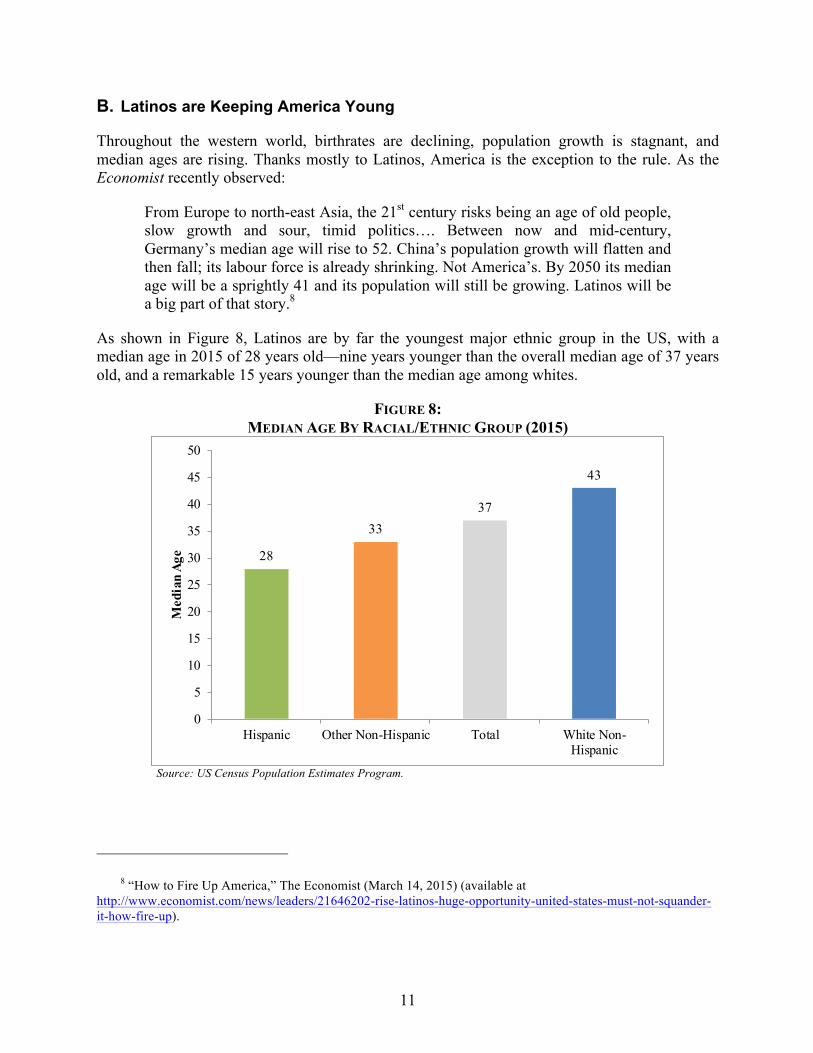
B. Latinos are Keeping America Young
Throughout the western world, birthrates are declining, population growth is stagnant, and median ages are rising. Thanks mostly to Latinos, America is the exception to the rule. As the Economist recently observed:
From Europe to north-east Asia, the 21st century risks being an age of old people, slow growth and sour, timid politics…. Between now and mid-century, Germany’s median age will rise to 52. China’s population growth will flatten and then fall; its labour force is already shrinking. Not America’s. By 2050 its median age will be a sprightly 41 and its population will still be growing. Latinos will be a big part of that story.8
As shown in Figure 8, Latinos are by far the youngest major ethnic group in the US, with a median age in 2015 of 28 years old—nine years younger than the overall median age of 37 years old, and a remarkable 15 years younger than the median age among whites.
FIGURE 8: MEDIAN AGE BY RACIAL/ETHNIC GROUP (2015)
Source: US Census Population Estimates Program.
8 “How to Fire Up America,” The Economist (March 14, 2015) (available at
http://www.economist.com/news/leaders/21646202-rise-latinos-huge-opportunity-united-states-must-not-squander-it-how-fire-up).
28
3337
43
0
5
10
15
20
25
30
35
40
45
50
Hispanic Other Non-Hispanic Total White Non-Hispanic
Med
ian
Age
12
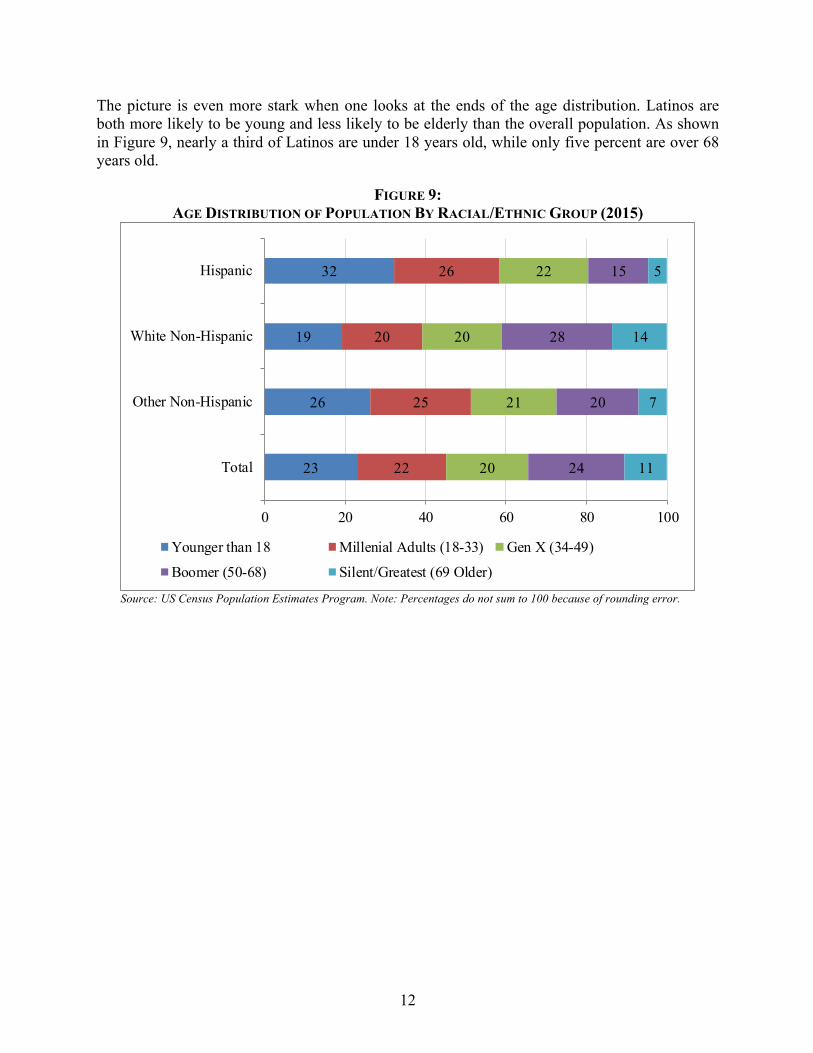
The picture is even more stark when one looks at the ends of the age distribution. Latinos are both more likely to be young and less likely to be elderly than the overall population. As shown in Figure 9, nearly a third of Latinos are under 18 years old, while only five percent are over 68 years old.
FIGURE 9: AGE DISTRIBUTION OF POPULATION BY RACIAL/ETHNIC GROUP (2015)
Source: US Census Population Estimates Program. Note: Percentages do not sum to 100 because of rounding error.
23
26
19
32
22
25
20
26
20
21
20
22
24
20
28
15
11
7
14
5
0 20 40 60 80 100
Total
Other Non-Hispanic
White Non-Hispanic
Hispanic
Younger than 18 Millenial Adults (18-33) Gen X (34-49)
Boomer (50-68) Silent/Greatest (69 Older)
13
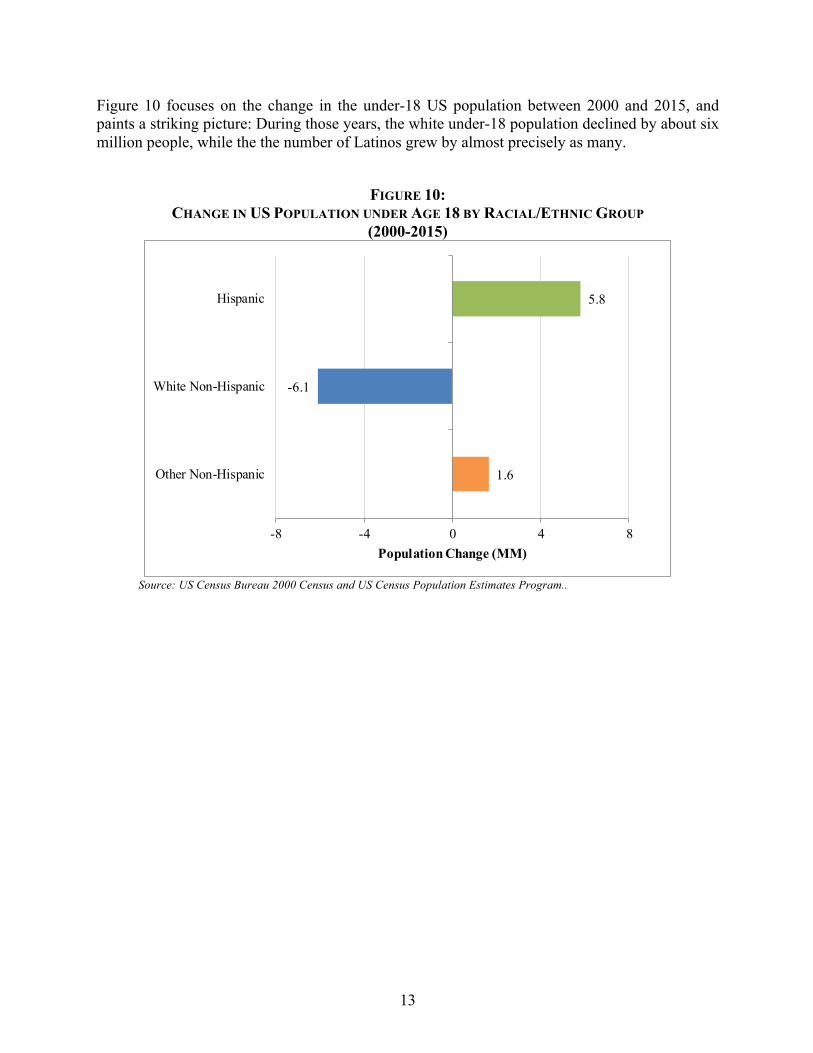
Figure 10 focuses on the change in the under-18 US population between 2000 and 2015, and paints a striking picture: During those years, the white under-18 population declined by about six million people, while the the number of Latinos grew by almost precisely as many.
FIGURE 10: CHANGE IN US POPULATION UNDER AGE 18 BY RACIAL/ETHNIC GROUP
(2000-2015)
Source: US Census Bureau 2000 Census and US Census Population Estimates Program..
1.6
-6.1
5.8
-8 -4 0 4 8
Other Non-Hispanic
White Non-Hispanic
Hispanic
Population Change (MM)

14
Figure 11 compares the age distribution of Latinos with the population overall. The top chart shows the proportion of the population comprised of each age group for the Hispanic population and the US overall. In the bottom chart, each bar shows the difference between the proportion of the Latino population that falls into each age group versus the proportion of the population overall. ispanics are much more likely to be young, and much less likely to be elderly, than the overall population.
FIGURE 11: AGE DISTRIBUTION OF HISPANICS VS. OVERALL US POPULATION
BY AGE GROUP (2015)
Source: US Census Population Estimates Program.
0
1
2
3
4
5
6
7
8
9
10
Perc
ent o
f Pop
ulat
ion
(%)
Hispanic
Overall
-3-2-101234
Diff
eren
ce
15
The younger profile of the Latino population has direct and significant implications for economic growth because economic research shows a clear link between the aging of a population and productivity growth. For example, one recent study found that a 10 percent increase in the fraction of the population age 60+ decreases growth in GDP per capita by 5.5 percent.9 Applying those results to the difference between the Latino and overall US age distributions, it is logical to calculate the effect of the relatively youthful Latino population on growth: If the age distribution of Latinos were the same as for the population overall, the rate of GDP growth would decline by 5.2 percent, meaning that in 2025 US GDP would be lower by $601 per capita, or $193 billion.10
9 Nicole Maestas, Kathleen Mullen and David Powell, “The Effect of Population Aging on Economic Growth,
the Labor Force and Productivity,” RAND Labor & Population Working Paper (August 2016) at 1 (hereafter Maestas et al. (2016)) (available at http://www.rand.org/pubs/working_papers/WR1063-1.html).
10 As of 2015, approximately 5.6 million Latinos (10 percent) were 60 years of age or older versus 51 million Latinos younger than 60. By comparison, 23 percent of non-Latinos (approximately 61 million people) were 60+. If the Latino population had the same age distribution as the non-Latino population, there would be 13 million Latinos age 60+, raising the proportion of the overall U.S. population age 60+ from 21 to 23 percent, or by 9.5 percent. Based on the results of the RAND paper, the effect would be to decrease the rate of growth of U.S. per capita GDP by 5.2 percent. GDP per capita in 2015 was $56,066. (See “Gross Domestic Product Per Capita, Bureau of Economic Analysis (July 19, 2016) accessed through FRED (Federal Reserve Bank of St. Louis) (available at https://fred.stlouisfed.org/series/A939RC0A052NBEA). The calculated decline in GDP assumes the increase in the older population takes place over a 10-year period and than annual growth in GDP per capita would otherwise have been 1.88 percent, which is the average annual growth of U.S. GDP per capita from 1960 to 2010. (Maestas et al. (2016) at 30).
16
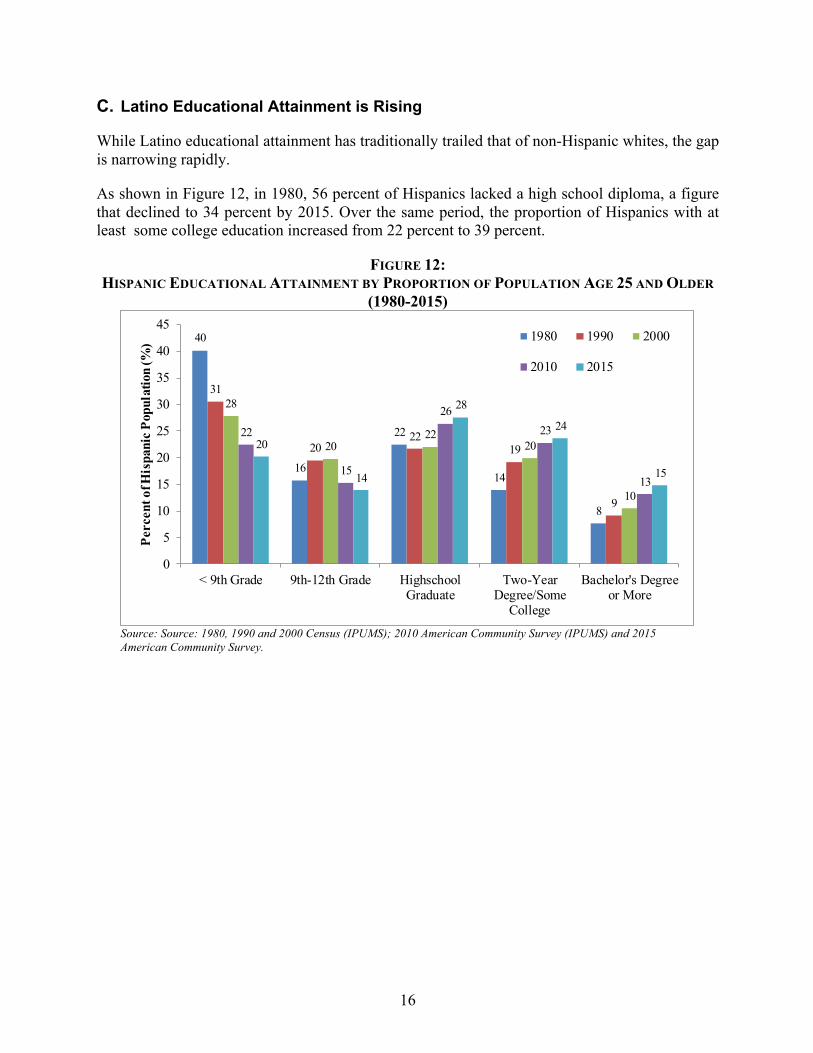
C. Latino Educational Attainment is Rising
While Latino educational attainment has traditionally trailed that of non-Hispanic whites, the gap is narrowing rapidly.
As shown in Figure 12, in 1980, 56 percent of Hispanics lacked a high school diploma, a figure that declined to 34 percent by 2015. Over the same period, the proportion of Hispanics with at least some college education increased from 22 percent to 39 percent.
FIGURE 12: HISPANIC EDUCATIONAL ATTAINMENT BY PROPORTION OF POPULATION AGE 25 AND OLDER
(1980-2015)
Source: Source: 1980, 1990 and 2000 Census (IPUMS); 2010 American Community Survey (IPUMS) and 2015 American Community Survey.
40
16
22
14
8
31
2022
19
9
28
2022
20
10
22
15
2623
13
20
14
28
24
15
0
5
10
15
20
25
30
35
40
45
< 9th Grade 9th-12th Grade HighschoolGraduate
Two-YearDegree/Some
College
Bachelor's Degreeor More
Perc
ent o
f His
pani
c Pop
ulat
ion
(%) 1980 1990 2000
2010 2015
17
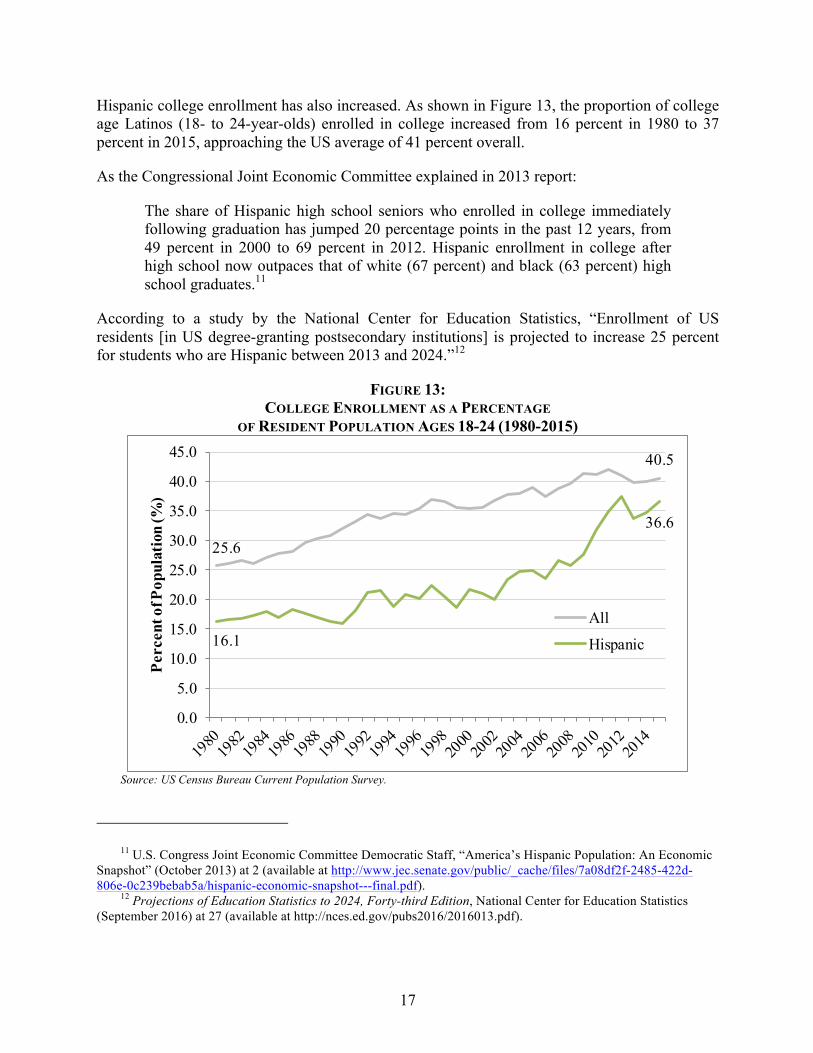
Hispanic college enrollment has also increased. As shown in Figure 13, the proportion of college age Latinos (18- to 24-year-olds) enrolled in college increased from 16 percent in 1980 to 37 percent in 2015, approaching the US average of 41 percent overall.
As the Congressional Joint Economic Committee explained in 2013 report:
The share of Hispanic high school seniors who enrolled in college immediately following graduation has jumped 20 percentage points in the past 12 years, from 49 percent in 2000 to 69 percent in 2012. Hispanic enrollment in college after high school now outpaces that of white (67 percent) and black (63 percent) high school graduates.11
According to a study by the National Center for Education Statistics, “Enrollment of US residents [in US degree-granting postsecondary institutions] is projected to increase 25 percent for students who are Hispanic between 2013 and 2024.”12
FIGURE 13: COLLEGE ENROLLMENT AS A PERCENTAGE
OF RESIDENT POPULATION AGES 18-24 (1980-2015)
Source: US Census Bureau Current Population Survey.
11 U.S. Congress Joint Economic Committee Democratic Staff, “America’s Hispanic Population: An Economic
Snapshot” (October 2013) at 2 (available at http://www.jec.senate.gov/public/_cache/files/7a08df2f-2485-422d-806e-0c239bebab5a/hispanic-economic-snapshot---final.pdf).
12 Projections of Education Statistics to 2024, Forty-third Edition, National Center for Education Statistics (September 2016) at 27 (available at http://nces.ed.gov/pubs2016/2016013.pdf).
25.6
40.5
16.1
36.6
0.0
5.0
10.0
15.0
20.0
25.0
30.0
35.0
40.0
45.0
Perc
ent o
f Pop
ulat
ion
(%)
All
Hispanic
18
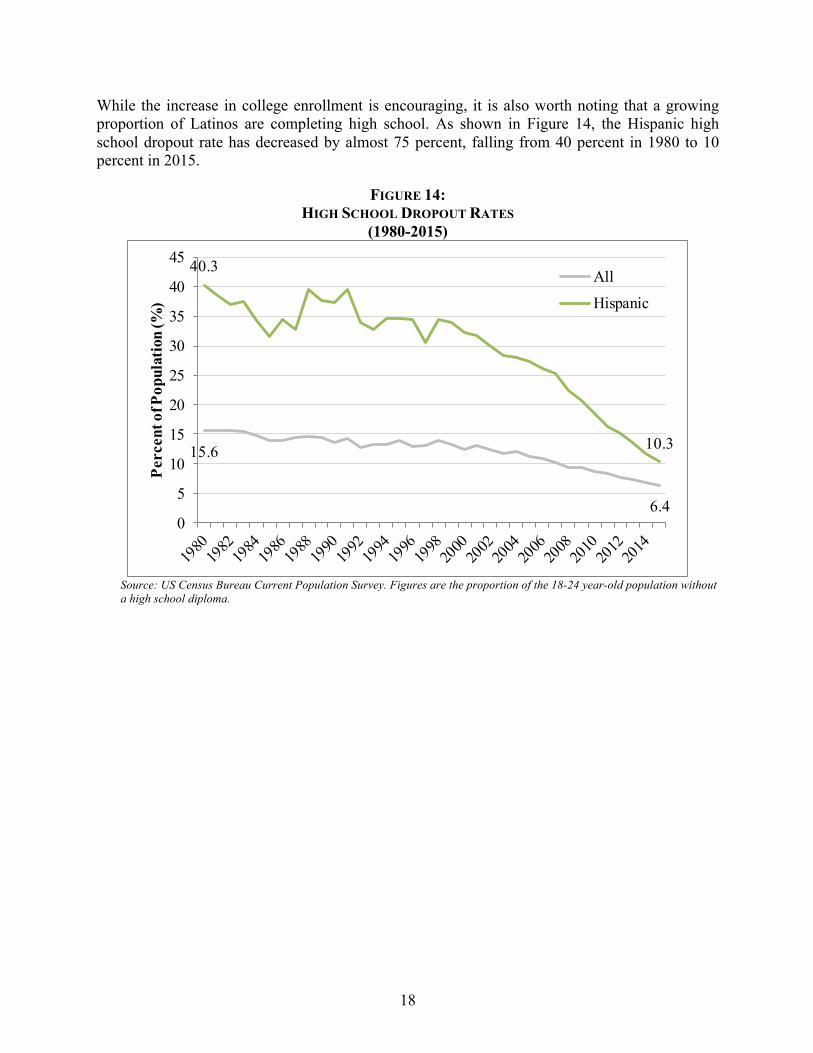
While the increase in college enrollment is encouraging, it is also worth noting that a growing proportion of Latinos are completing high school. As shown in Figure 14, the Hispanic high school dropout rate has decreased by almost 75 percent, falling from 40 percent in 1980 to 10 percent in 2015.
FIGURE 14: HIGH SCHOOL DROPOUT RATES
(1980-2015)
Source: US Census Bureau Current Population Survey. Figures are the proportion of the 18-24 year-old population without a high school diploma.
15.6
6.4
40.3
10.3
0
5
10
15
20
25
30
35
40
45
Perc
ent o
f Pop
ulat
ion
(%)
All
Hispanic
19
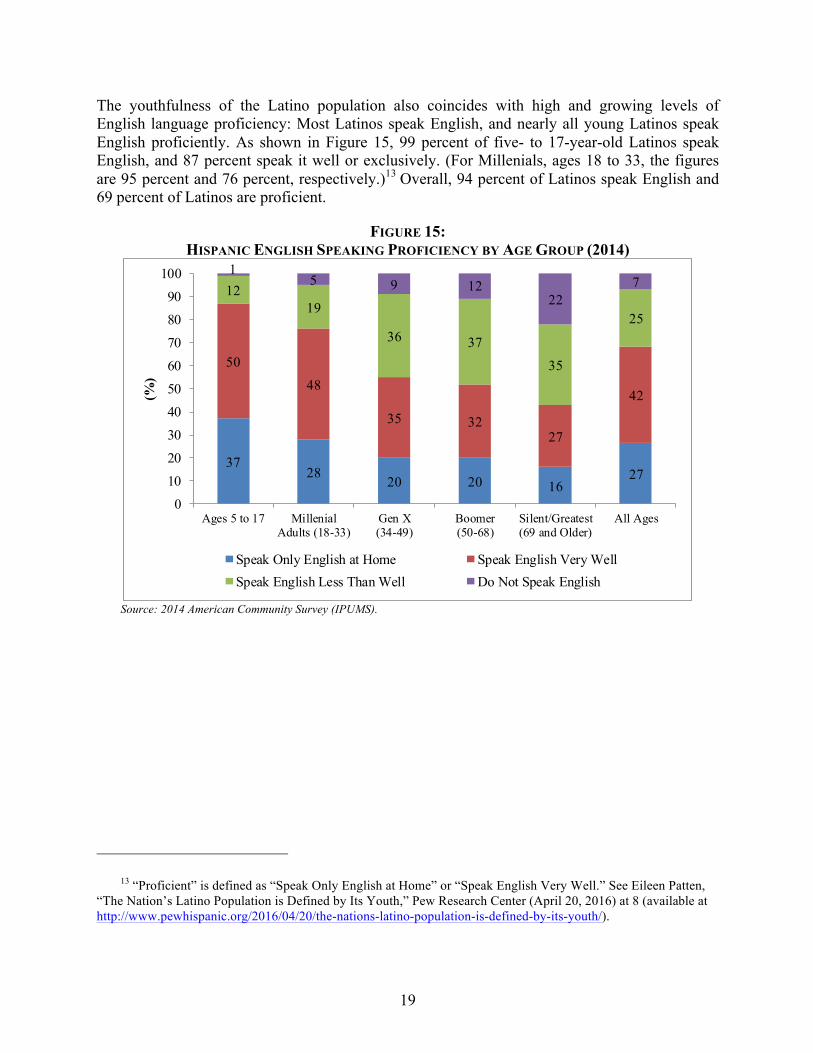
The youthfulness of the Latino population also coincides with high and growing levels of English language proficiency: Most Latinos speak English, and nearly all young Latinos speak English proficiently. As shown in Figure 15, 99 percent of five- to 17-year-old Latinos speak English, and 87 percent speak it well or exclusively. (For Millenials, ages 18 to 33, the figures are 95 percent and 76 percent, respectively.)13 Overall, 94 percent of Latinos speak English and 69 percent of Latinos are proficient.
FIGURE 15: HISPANIC ENGLISH SPEAKING PROFICIENCY BY AGE GROUP (2014)
Source: 2014 American Community Survey (IPUMS).
13 “Proficient” is defined as “Speak Only English at Home” or “Speak English Very Well.” See Eileen Patten,
“The Nation’s Latino Population is Defined by Its Youth,” Pew Research Center (April 20, 2016) at 8 (available at http://www.pewhispanic.org/2016/04/20/the-nations-latino-population-is-defined-by-its-youth/).
3728
20 20 1627
50
48
35 3227
42
1219
36 37
35
25
15 9 12
227
0
10
20
30
40
50
60
70
80
90
100
Ages 5 to 17 MillenialAdults (18-33)
Gen X(34-49)
Boomer(50-68)
Silent/Greatest(69 and Older)
All Ages
(%)
Speak Only English at Home Speak English Very WellSpeak English Less Than Well Do Not Speak English

20
Hispanics also have a higher life expectancy rate when compared to other ethnic groups. Figure 16 shows that Hispanic life expectancy exceeds the population average by about three years. The life expectancy of a Latino born in 2014 was 81.8 years, compared to 78.8 for other Americans.
FIGURE 16: LIFE EXPECTANCY AT BIRTH, BY ETHNIC GROUP (2006-2014)
Source: Health, United States, 2015, With Special Feature on Racial and Ethnic Health Disparities, US Department of Health and Human Services, Centers for Disease Control and Prevention (May 2016) at Table 15 (available at http://www.cdc.gov/nchs/data/hus/hus15.pdf#015).
80.3
81.8
78.2
77.8
78.8
75
76
77
78
79
80
81
82
83
2006 2007 2008 2009 2010 2011 2012 2013 2014
Life
Exp
ecta
ncy a
t Bir
th (Y
ears
)
Hispanic
White Non-Hispanic
All
21
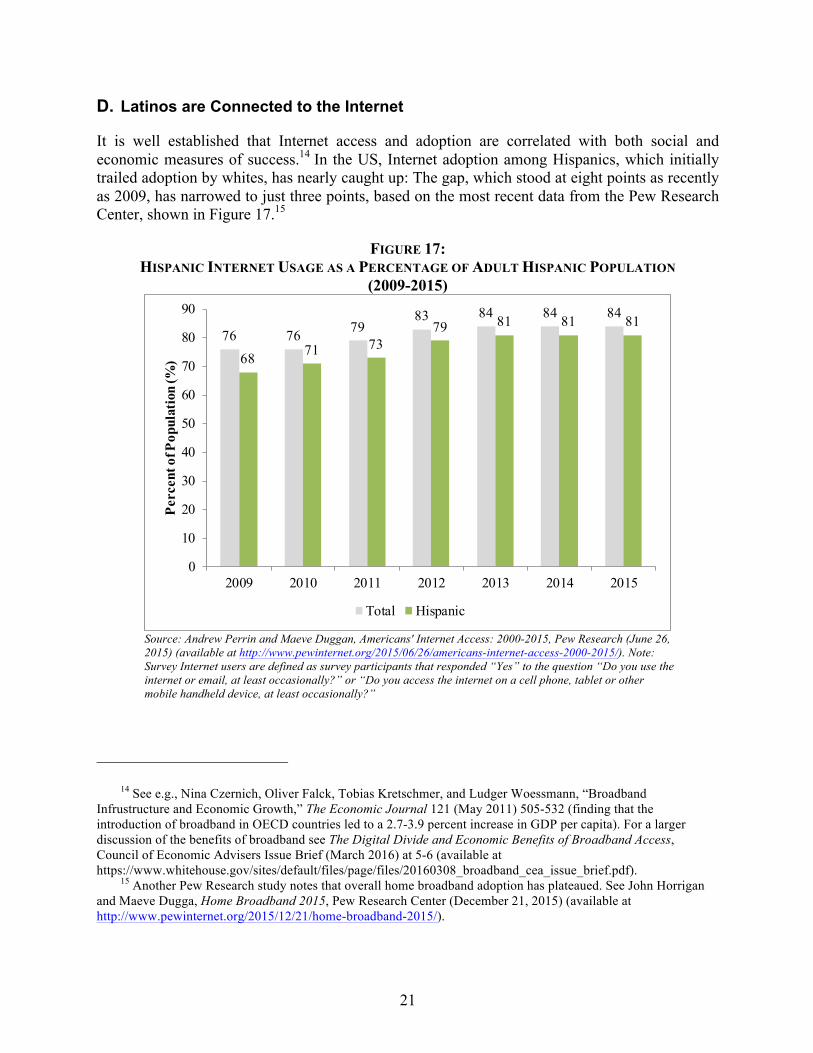
D. Latinos are Connected to the Internet
It is well established that Internet access and adoption are correlated with both social and economic measures of success.14 In the US, Internet adoption among Hispanics, which initially trailed adoption by whites, has nearly caught up: The gap, which stood at eight points as recently as 2009, has narrowed to just three points, based on the most recent data from the Pew Research Center, shown in Figure 17.15
FIGURE 17: HISPANIC INTERNET USAGE AS A PERCENTAGE OF ADULT HISPANIC POPULATION
(2009-2015)
Source: Andrew Perrin and Maeve Duggan, Americans' Internet Access: 2000-2015, Pew Research (June 26, 2015) (available at http://www.pewinternet.org/2015/06/26/americans-internet-access-2000-2015/). Note: Survey Internet users are defined as survey participants that responded “Yes” to the question “Do you use the internet or email, at least occasionally?” or “Do you access the internet on a cell phone, tablet or other mobile handheld device, at least occasionally?”
14 See e.g., Nina Czernich, Oliver Falck, Tobias Kretschmer, and Ludger Woessmann, “Broadband
Infrustructure and Economic Growth,” The Economic Journal 121 (May 2011) 505-532 (finding that the introduction of broadband in OECD countries led to a 2.7-3.9 percent increase in GDP per capita). For a larger discussion of the benefits of broadband see The Digital Divide and Economic Benefits of Broadband Access, Council of Economic Advisers Issue Brief (March 2016) at 5-6 (available at https://www.whitehouse.gov/sites/default/files/page/files/20160308_broadband_cea_issue_brief.pdf).
15 Another Pew Research study notes that overall home broadband adoption has plateaued. See John Horrigan and Maeve Dugga, Home Broadband 2015, Pew Research Center (December 21, 2015) (available at http://www.pewinternet.org/2015/12/21/home-broadband-2015/).
76 76 7983 84 84 84
68 71 7379 81 81 81
0
10
20
30
40
50
60
70
80
90
2009 2010 2011 2012 2013 2014 2015
Perc
ent o
f Pop
ulat
ion
(%)
Total Hispanic
22
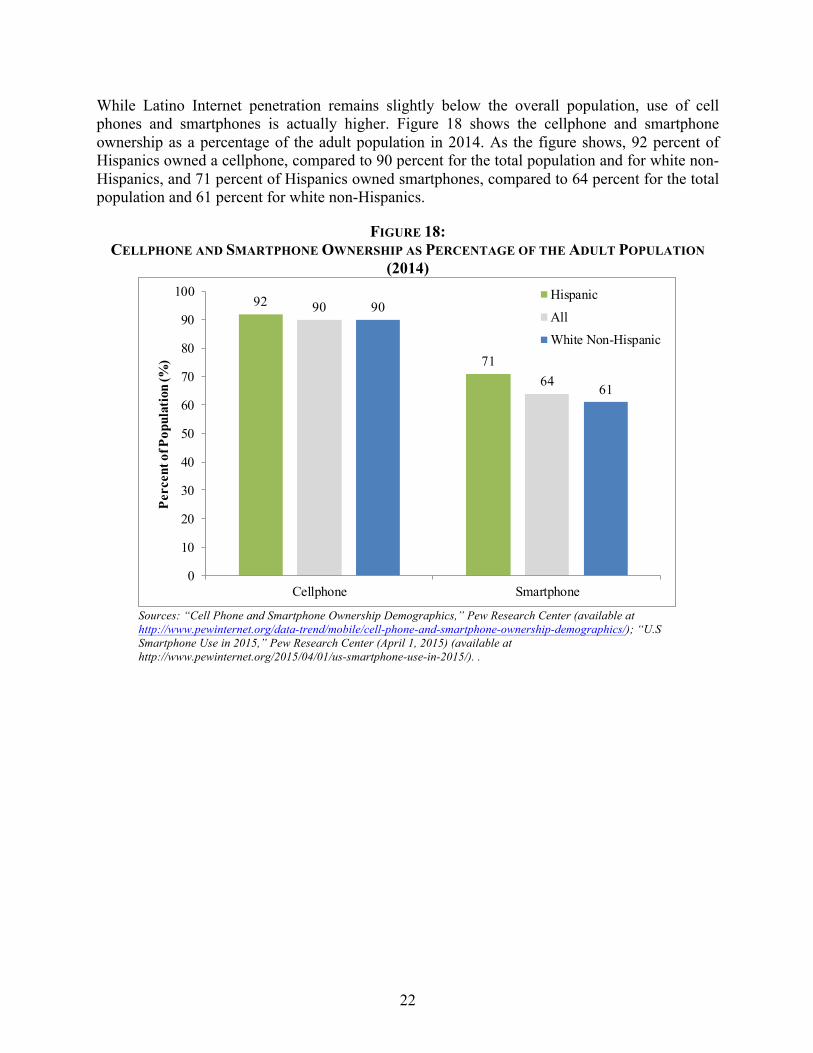
While Latino Internet penetration remains slightly below the overall population, use of cell phones and smartphones is actually higher. Figure 18 shows the cellphone and smartphone ownership as a percentage of the adult population in 2014. As the figure shows, 92 percent of Hispanics owned a cellphone, compared to 90 percent for the total population and for white non-Hispanics, and 71 percent of Hispanics owned smartphones, compared to 64 percent for the total population and 61 percent for white non-Hispanics.
FIGURE 18: CELLPHONE AND SMARTPHONE OWNERSHIP AS PERCENTAGE OF THE ADULT POPULATION
(2014)
Sources: “Cell Phone and Smartphone Ownership Demographics,” Pew Research Center (available at http://www.pewinternet.org/data-trend/mobile/cell-phone-and-smartphone-ownership-demographics/); “U.S Smartphone Use in 2015,” Pew Research Center (April 1, 2015) (available at http://www.pewinternet.org/2015/04/01/us-smartphone-use-in-2015/). .
92
71
90
64
90
61
0
10
20
30
40
50
60
70
80
90
100
Cellphone Smartphone
Perc
ent o
f Pop
ulat
ion
(%)
Hispanic
All
White Non-Hispanic
23
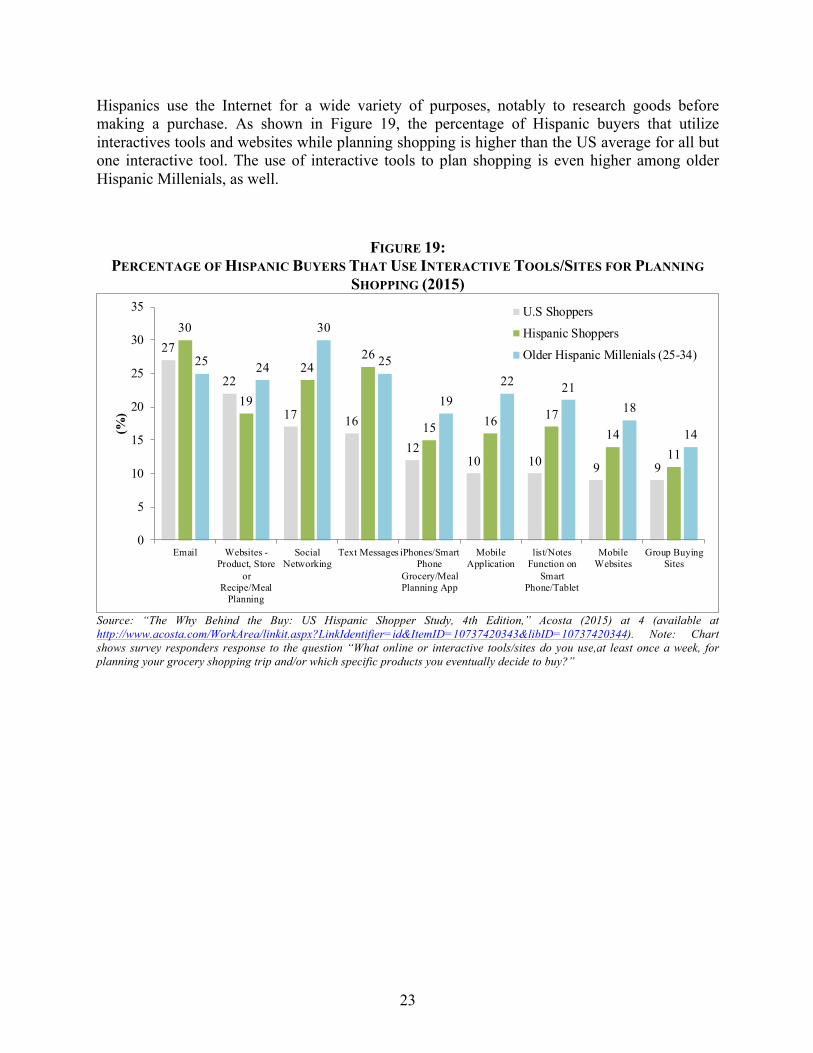
Hispanics use the Internet for a wide variety of purposes, notably to research goods before making a purchase. As shown in Figure 19, the percentage of Hispanic buyers that utilize interactives tools and websites while planning shopping is higher than the US average for all but one interactive tool. The use of interactive tools to plan shopping is even higher among older Hispanic Millenials, as well.
FIGURE 19: PERCENTAGE OF HISPANIC BUYERS THAT USE INTERACTIVE TOOLS/SITES FOR PLANNING
SHOPPING (2015)
Source: “The Why Behind the Buy: US Hispanic Shopper Study, 4th Edition,” Acosta (2015) at 4 (available at http://www.acosta.com/WorkArea/linkit.aspx?LinkIdentifier=id&ItemID=10737420343&libID=10737420344). Note: Chart shows survey responders response to the question “What online or interactive tools/sites do you use,at least once a week, for planning your grocery shopping trip and/or which specific products you eventually decide to buy?”
27
22
17 16
1210 10 9 9
30
19
2426
15 16 1714
11
25 24
30
25
1922 21
18
14
0
5
10
15
20
25
30
35
Email Websites -Product, Store
orRecipe/Meal
Planning
SocialNetworking
Text Messages iPhones/SmartPhone
Grocery/MealPlanning App
MobileApplication
list/NotesFunction on
SmartPhone/Tablet
MobileWebsites
Group BuyingSites
(%)
U.S Shoppers
Hispanic Shoppers
Older Hispanic Millenials (25-34)
24
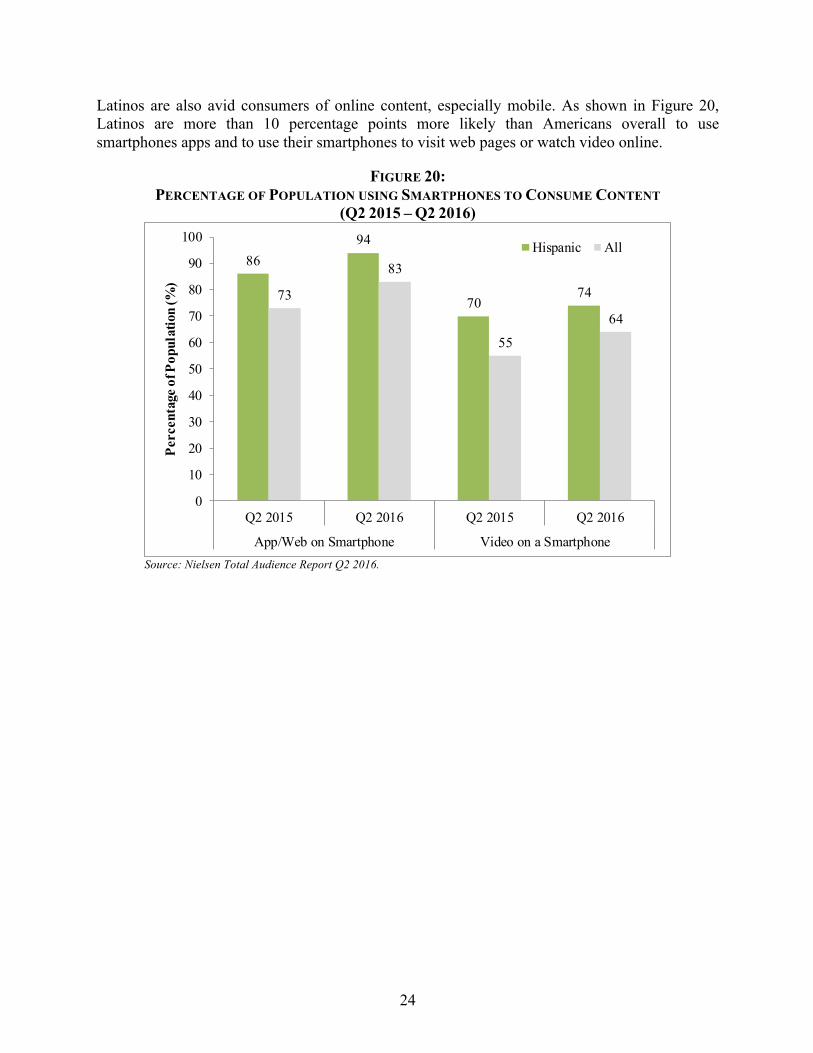
Latinos are also avid consumers of online content, especially mobile. As shown in Figure 20, Latinos are more than 10 percentage points more likely than Americans overall to use smartphones apps and to use their smartphones to visit web pages or watch video online.
FIGURE 20: PERCENTAGE OF POPULATION USING SMARTPHONES TO CONSUME CONTENT
(Q2 2015 – Q2 2016)
Source: Nielsen Total Audience Report Q2 2016.
8694
707473
83
55
64
0
10
20
30
40
50
60
70
80
90
100
Q2 2015 Q2 2016 Q2 2015 Q2 2016
App/Web on Smartphone Video on a Smartphone
Perc
enta
ge o
f Pop
ulat
ion
(%)
Hispanic All

25
Hispanics are also highly engaged in social networks. As shown, in Figure 21, eMarketer estimates that Hispanics accounted for 18.4 percent of social network users in 2016, rising to 20.3 percent in 2019.
FIGURE 21: HISPANICS AS A PERCENTAGE OF SOCIAL NETWORK USERS (2013-2019)
Source: "Hispanics Make Social a Crucial Part of Digital Lives," eMarketer (May 28, 2015) (available at http://www.emarketer.com/Article/Hispanics-Make-Social-Crucial-Part-of-Digital-Lives/1012534). Note: Social network users include Internet users who use social networks via any device at least once per month.
63.4 62.5 61.6 60.8 59.8 59.0 58.8
20.2 20.5 20.6 20.8 20.9 20.9 20.9
16.4 17.0 17.8 18.4 19.3 20.1 20.3
0
10
20
30
40
50
60
70
80
90
100
2013 2014 2015 2016 2017 2018 2019
Perc
ent o
f Soc
ial N
etw
ork
Use
rs (%
)
White Non-Hispanic Other Non-Hispanic Hispanic
26
III. Latinos in the Workforce: Engaged and Entrepreneurial
As noted above, economic growth is driven by two factors: growth of the labor force and growth in productivity.16 As noted above, Latinos are responsible for more than half of US population growth and are much younger than the population overall. As discussed below, they are also more likely to participate in the labor force and to be employed than other Americans; in addition they are disproportionately engaged in entrepreneurship.
A. Latinos are Working
Hispanics make up a growing share of the US labor force for two primary reasons. First, the Hispanic population is growing. Second, Hispanics are more likely than other Americans to participate in the labor force and, as a result, more likely to be employed.
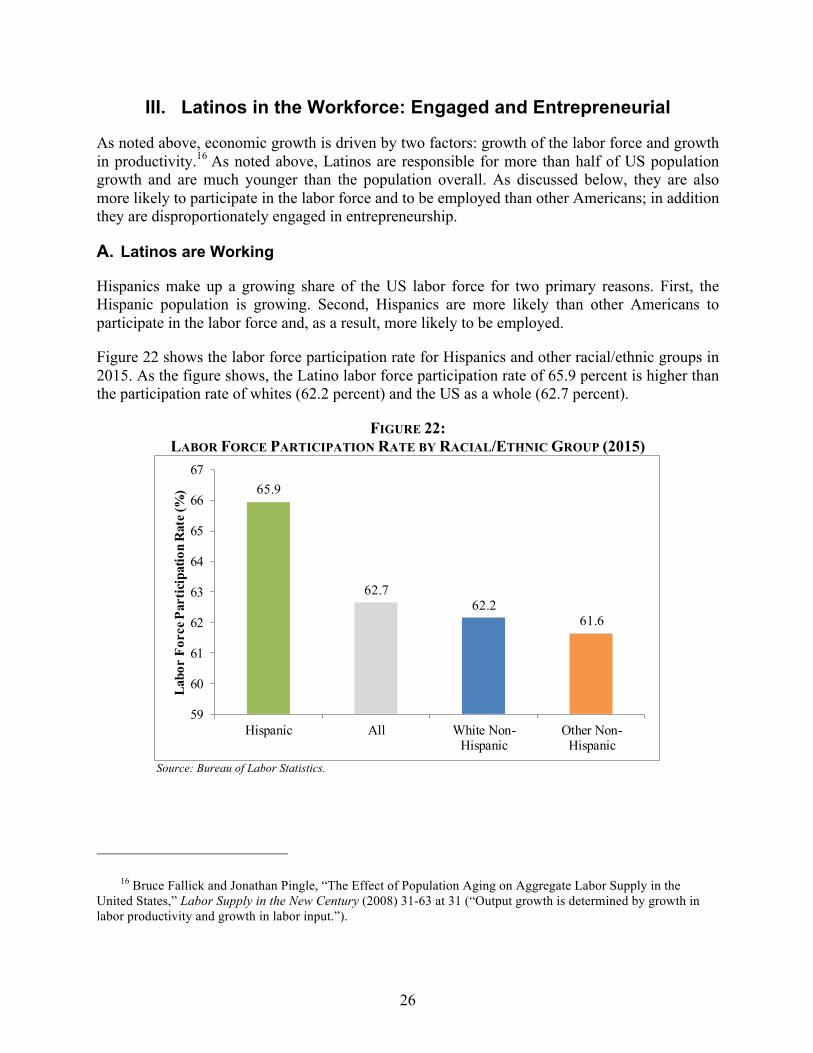
Figure 22 shows the labor force participation rate for Hispanics and other racial/ethnic groups in 2015. As the figure shows, the Latino labor force participation rate of 65.9 percent is higher than the participation rate of whites (62.2 percent) and the US as a whole (62.7 percent).
FIGURE 22: LABOR FORCE PARTICIPATION RATE BY RACIAL/ETHNIC GROUP (2015)
Source: Bureau of Labor Statistics.
16 Bruce Fallick and Jonathan Pingle, “The Effect of Population Aging on Aggregate Labor Supply in the
United States,” Labor Supply in the New Century (2008) 31-63 at 31 (“Output growth is determined by growth in labor productivity and growth in labor input.”).
65.9
62.762.2
61.6
59
60
61
62
63
64
65
66
67
Hispanic All White Non-Hispanic
Other Non-Hispanic
Labo
r Fo
rce P
artic
ipat
ion
Rat
e (%
)
27
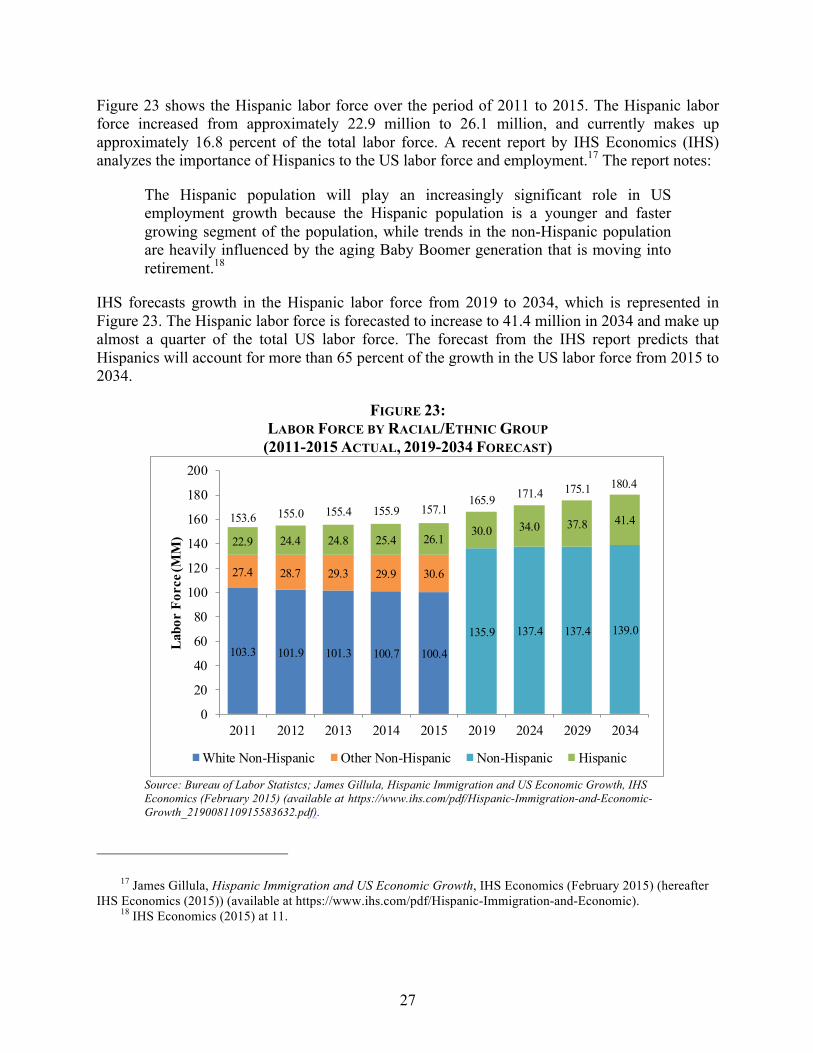
Figure 23 shows the Hispanic labor force over the period of 2011 to 2015. The Hispanic labor force increased from approximately 22.9 million to 26.1 million, and currently makes up approximately 16.8 percent of the total labor force. A recent report by IHS Economics (IHS) analyzes the importance of Hispanics to the US labor force and employment.17 The report notes:
The Hispanic population will play an increasingly significant role in US employment growth because the Hispanic population is a younger and faster growing segment of the population, while trends in the non-Hispanic population are heavily influenced by the aging Baby Boomer generation that is moving into retirement.18
IHS forecasts growth in the Hispanic labor force from 2019 to 2034, which is represented in Figure 23. The Hispanic labor force is forecasted to increase to 41.4 million in 2034 and make up almost a quarter of the total US labor force. The forecast from the IHS report predicts that Hispanics will account for more than 65 percent of the growth in the US labor force from 2015 to 2034.
FIGURE 23: LABOR FORCE BY RACIAL/ETHNIC GROUP
(2011-2015 ACTUAL, 2019-2034 FORECAST)
Source: Bureau of Labor Statistcs; James Gillula, Hispanic Immigration and US Economic Growth, IHS Economics (February 2015) (available at https://www.ihs.com/pdf/Hispanic-Immigration-and-Economic-Growth_219008110915583632.pdf).
17 James Gillula, Hispanic Immigration and US Economic Growth, IHS Economics (February 2015) (hereafter
IHS Economics (2015)) (available at https://www.ihs.com/pdf/Hispanic-Immigration-and-Economic). 18 IHS Economics (2015) at 11.
103.3 101.9 101.3 100.7 100.4
27.4 28.7 29.3 29.9 30.6
135.9 137.4 137.4 139.0
22.9 24.4 24.8 25.4 26.130.0 34.0 37.8 41.4153.6 155.0 155.4 155.9 157.1165.9 171.4 175.1 180.4
0
20
40
60
80
100
120
140
160
180
200
2011 2012 2013 2014 2015 2019 2024 2029 2034
Labo
r Fo
rce (
MM
)
White Non-Hispanic Other Non-Hispanic Non-Hispanic Hispanic
28
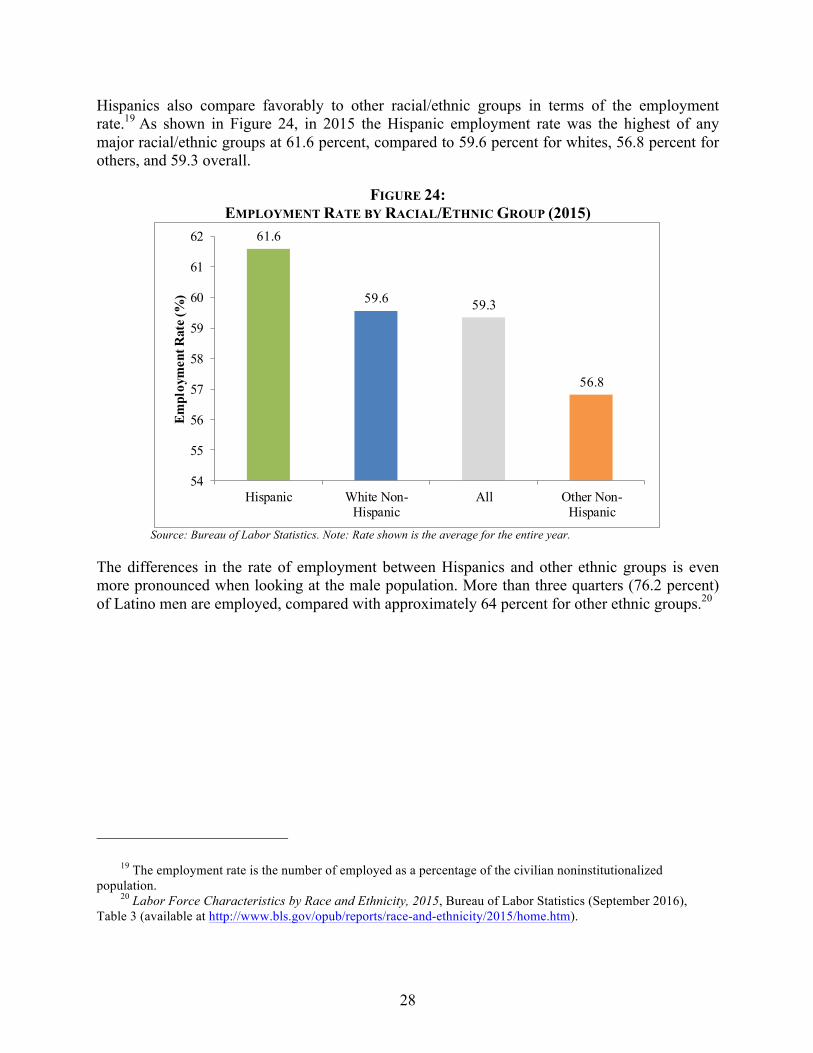
Hispanics also compare favorably to other racial/ethnic groups in terms of the employment rate.19 As shown in Figure 24, in 2015 the Hispanic employment rate was the highest of any major racial/ethnic groups at 61.6 percent, compared to 59.6 percent for whites, 56.8 percent for others, and 59.3 overall.
FIGURE 24: EMPLOYMENT RATE BY RACIAL/ETHNIC GROUP (2015)
Source: Bureau of Labor Statistics. Note: Rate shown is the average for the entire year.
The differences in the rate of employment between Hispanics and other ethnic groups is even more pronounced when looking at the male population. More than three quarters (76.2 percent) of Latino men are employed, compared with approximately 64 percent for other ethnic groups.20
19 The employment rate is the number of employed as a percentage of the civilian noninstitutionalized
population. 20 Labor Force Characteristics by Race and Ethnicity, 2015, Bureau of Labor Statistics (September 2016),
Table 3 (available at http://www.bls.gov/opub/reports/race-and-ethnicity/2015/home.htm).
61.6
59.6 59.3
56.8
54
55
56
57
58
59
60
61
62
Hispanic White Non-Hispanic
All Other Non-Hispanic
Empl
oym
ent R
ate (
%)

29
Hispanics have also seen a significant rise in employment levels. Figure 25 shows the number of employed Hispanics increased from 20.3 million in 2011 to 24.4 million in 2015, and Hispanics currently make up approximately 16.4 percent of employment. IHS forecasts Hispanic employment to increase to 39.2 million by 2034, when Latinos will account for nearly 25 percent of working Americans.
FIGURE 25: ANNUAL AVERAGE EMPLOYMENT BY RACIAL/ETHNIC GROUP
(2011-2015 ACTUAL, 2019-2034 FORECAST)
Source: Bureau of Labor Statistcs; James Gillula, Hispanic Immigration and US Economic Growth, IHS Economics (February 2015) (available at https://www.ihs.com/pdf/Hispanic-Immigration-and-Economic-Growth_219008110915583632.pdf).
95.8 95.2 95.2 95.7 96.2
23.8 25.4 26.2 27.1 28.2
129.0 130.7 130.7 132.2
20.3 21.9 22.5 23.5 24.428.1 32.1 35.6 39.2139.9 142.5 143.9 146.3 148.8157.1
162.7 166.3 171.4
0
20
40
60
80
100
120
140
160
180
2011 2012 2013 2014 2015 2019 2024 2029 2034
Empl
oym
ent (
MM
)
White Non-Hispanic Other Non-Hispanic Non-Hispanic Hispanic
30
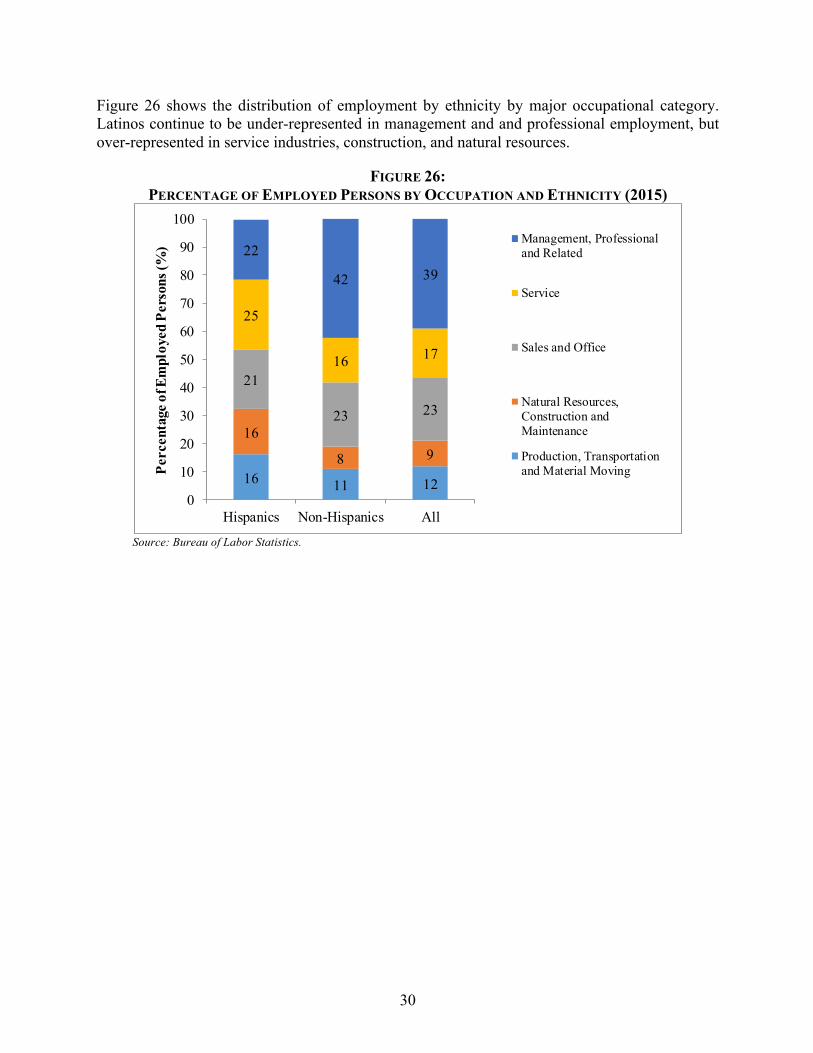
Figure 26 shows the distribution of employment by ethnicity by major occupational category. Latinos continue to be under-represented in management and and professional employment, but over-represented in service industries, construction, and natural resources.
FIGURE 26: PERCENTAGE OF EMPLOYED PERSONS BY OCCUPATION AND ETHNICITY (2015)
Source: Bureau of Labor Statistics.
16 11 12
16
8 9
21
23 23
25
16 17
22
42 39
0
10
20
30
40
50
60
70
80
90
100
Hispanics Non-Hispanics All
Perc
enta
ge o
f Em
ploy
ed P
erso
ns (%
) Management, Professionaland Related
Service
Sales and Office
Natural Resources,Construction andMaintenance
Production, Transportationand Material Moving

31
Figure 27 shows a more detailed breakdown of employment by industry. Hispanics are disproportionately employed in construction, agriculture, and service industries, where they make up more than one-fifth of the workforce.
FIGURE 27: PERCENTAGE OF EMPLOYED PERSONS THAT ARE HISPANIC BY INDUSTRY (2015)
Source: Bureau of Labor Statistics.
11.2
11.6
11.7
11.8
16.2
16.3
16.8
16.9
17.6
18.9
22.6
23.9
28.5
0 5 10 15 20 25 30
Information
Education and Health Services
Public Administration
Financial Activities
Manufacturing
Professional and Business Services
Wholesale and Retail Trade
Mining
Transportation and Utilities
Other Services
Leisure and Hospitality
Agriculture
Construction
(%)
Over Represented
Under Represented
32
B. Latino Entrepreneurs are Driving Job Creation and Growth
There is a growing consensus among modern economists that entrepreneurship and new business formation account for a disproportionate share of job creation and economic growth.21 For example, research by John Haltiwanger suggests the creation of new businesses is integral to sustaining a robust economy. In a 2012 report, Haltiwanger notes:
Business dynamism plays an important role in job creation and productivity growth in the United States. Business start-ups are an important contributor to that dynamism. Start-ups contribute disproportionately to job creation but are very heterogeneous in terms of productivity. The subsequent “up-or-out” dynamic of young businesses is an important source of job and productivity growth: exiting young businesses are of very low productivity, and the surviving young businesses exhibit rapid growth with above average productivity.22
21 For a more extensive review of the economic literature on business dynamism, see Jeff Eisenach, The Long-
Run Effects of Employment Regulation on California’s Economy, U.S. Chamber of Commerce (July 12, 2016) (available at https://www.uschamber.com/report/the-long-run-effects-employment-regulation-california-s-economy).
22 John Haltiwanger, “Job Creation and Firm Dynamics in the United States,” Innovation Policy and Economy 12 (April 2012) 17-38 at 20.
33
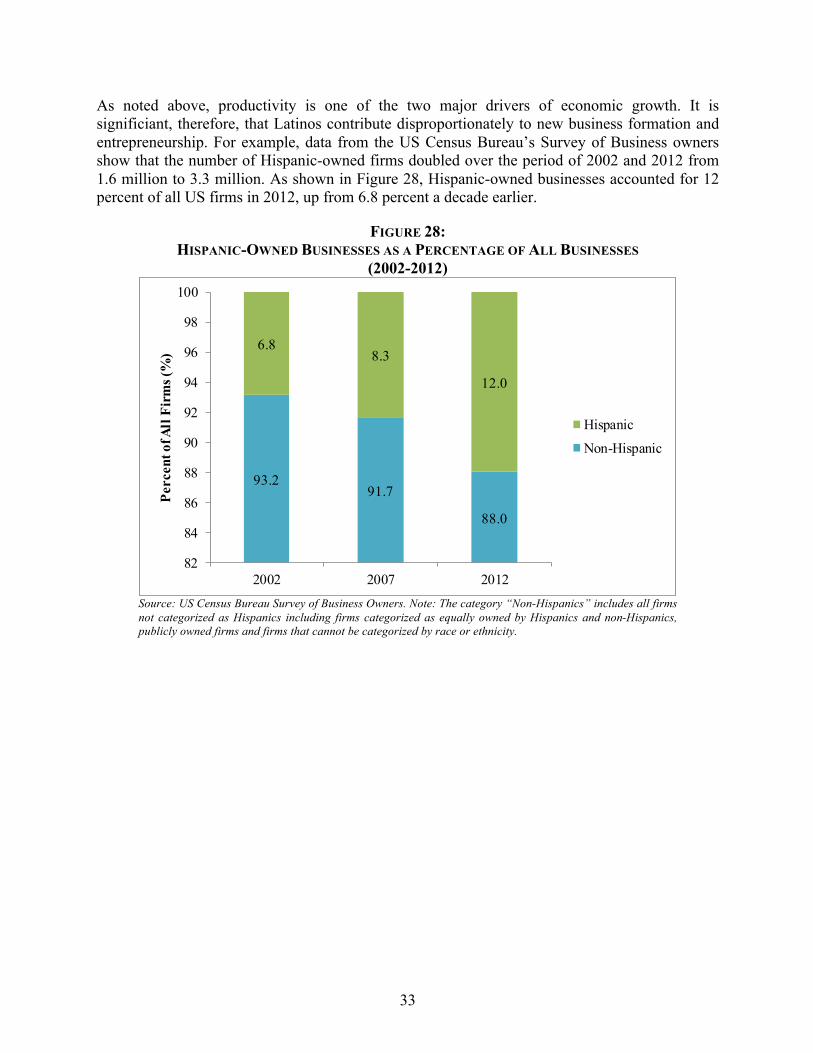
As noted above, productivity is one of the two major drivers of economic growth. It is significiant, therefore, that Latinos contribute disproportionately to new business formation and entrepreneurship. For example, data from the US Census Bureau’s Survey of Business owners show that the number of Hispanic-owned firms doubled over the period of 2002 and 2012 from 1.6 million to 3.3 million. As shown in Figure 28, Hispanic-owned businesses accounted for 12 percent of all US firms in 2012, up from 6.8 percent a decade earlier.
FIGURE 28: HISPANIC-OWNED BUSINESSES AS A PERCENTAGE OF ALL BUSINESSES
(2002-2012)
Source: US Census Bureau Survey of Business Owners. Note: The category “Non-Hispanics” includes all firms not categorized as Hispanics including firms categorized as equally owned by Hispanics and non-Hispanics, publicly owned firms and firms that cannot be categorized by race or ethnicity.
93.291.7
88.0
6.88.3
12.0
82
84
86
88
90
92
94
96
98
100
2002 2007 2012
Perc
ent o
f All
Fir
ms (
%)
Hispanic
Non-Hispanic
34
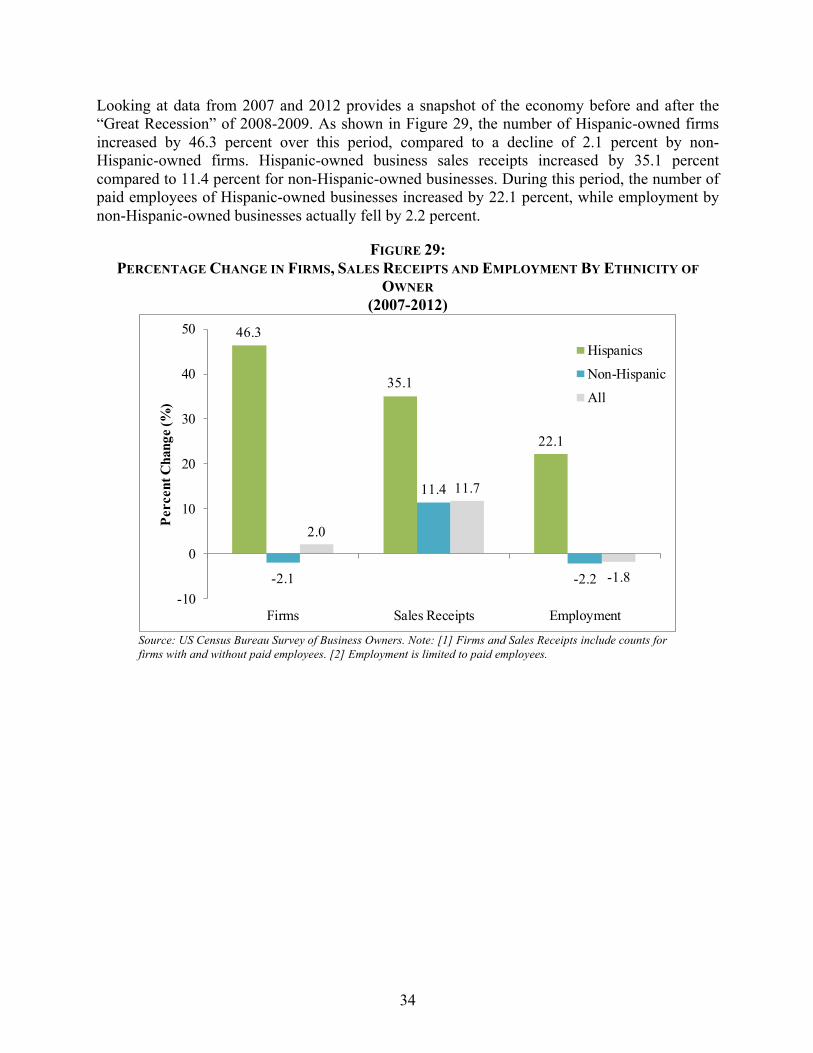
Looking at data from 2007 and 2012 provides a snapshot of the economy before and after the “Great Recession” of 2008-2009. As shown in Figure 29, the number of Hispanic-owned firms increased by 46.3 percent over this period, compared to a decline of 2.1 percent by non-Hispanic-owned firms. Hispanic-owned business sales receipts increased by 35.1 percent compared to 11.4 percent for non-Hispanic-owned businesses. During this period, the number of paid employees of Hispanic-owned businesses increased by 22.1 percent, while employment by non-Hispanic-owned businesses actually fell by 2.2 percent.
FIGURE 29: PERCENTAGE CHANGE IN FIRMS, SALES RECEIPTS AND EMPLOYMENT BY ETHNICITY OF
OWNER (2007-2012)
Source: US Census Bureau Survey of Business Owners. Note: [1] Firms and Sales Receipts include counts for firms with and without paid employees. [2] Employment is limited to paid employees.
46.3
35.1
22.1
-2.1
11.4
-2.2
2.0
11.7
-1.8-10
0
10
20
30
40
50
Firms Sales Receipts Employment
Perc
ent C
hang
e (%
)
Hispanics
Non-Hispanic
All
35
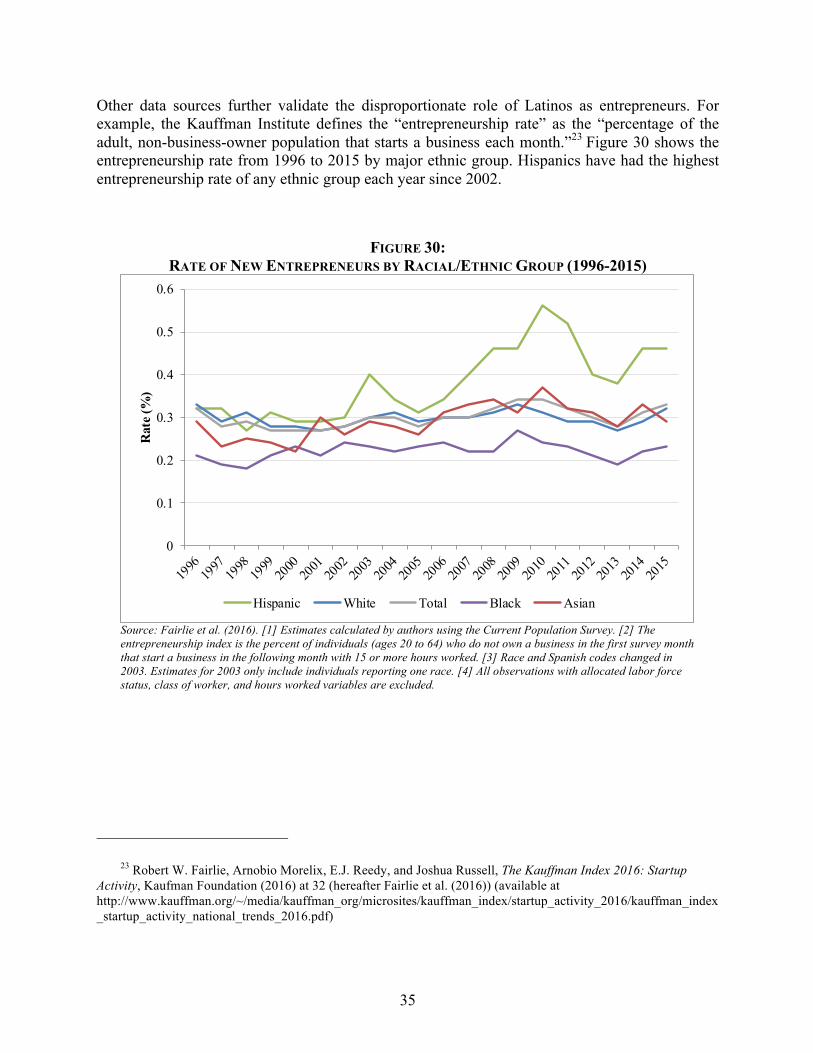
Other data sources further validate the disproportionate role of Latinos as entrepreneurs. For example, the Kauffman Institute defines the “entrepreneurship rate” as the “percentage of the adult, non-business-owner population that starts a business each month.”23 Figure 30 shows the entrepreneurship rate from 1996 to 2015 by major ethnic group. Hispanics have had the highest entrepreneurship rate of any ethnic group each year since 2002.
FIGURE 30: RATE OF NEW ENTREPRENEURS BY RACIAL/ETHNIC GROUP (1996-2015)
Source: Fairlie et al. (2016). [1] Estimates calculated by authors using the Current Population Survey. [2] The entrepreneurship index is the percent of individuals (ages 20 to 64) who do not own a business in the first survey month that start a business in the following month with 15 or more hours worked. [3] Race and Spanish codes changed in 2003. Estimates for 2003 only include individuals reporting one race. [4] All observations with allocated labor force status, class of worker, and hours worked variables are excluded.
23 Robert W. Fairlie, Arnobio Morelix, E.J. Reedy, and Joshua Russell, The Kauffman Index 2016: Startup
Activity, Kaufman Foundation (2016) at 32 (hereafter Fairlie et al. (2016)) (available at http://www.kauffman.org/~/media/kauffman_org/microsites/kauffman_index/startup_activity_2016/kauffman_index_startup_activity_national_trends_2016.pdf)
0
0.1
0.2
0.3
0.4
0.5
0.6
Rat
e (%
)
Hispanic White Total Black Asian

36
As shown in Figure 31, by 2015 Latinos accounted for more than one out of five new entrepreneurs, increasing from 10 percent in 1996.
FIGURE 31: CHANGES IN COMPOSITION OF NEW ENTREPRENEURS BY RACIAL/ETHNIC GROUP
(1996, 2015)
Source: Fairlie et al. (2016).
77%
10%
13%
1996
White
Latino
Other
61%
21%
19%
2015
White
Latino
Other
37
IV. Latinos are Prosperous and Upwardly Mobile
On average, Latinos earn and spend less than other Americans—but the gap is closing rapidly. Recent data shows Hispanic income growing faster than any other ethnic group—and with growing income comes increased buying power.
A. Latinos are Becoming More Affluent
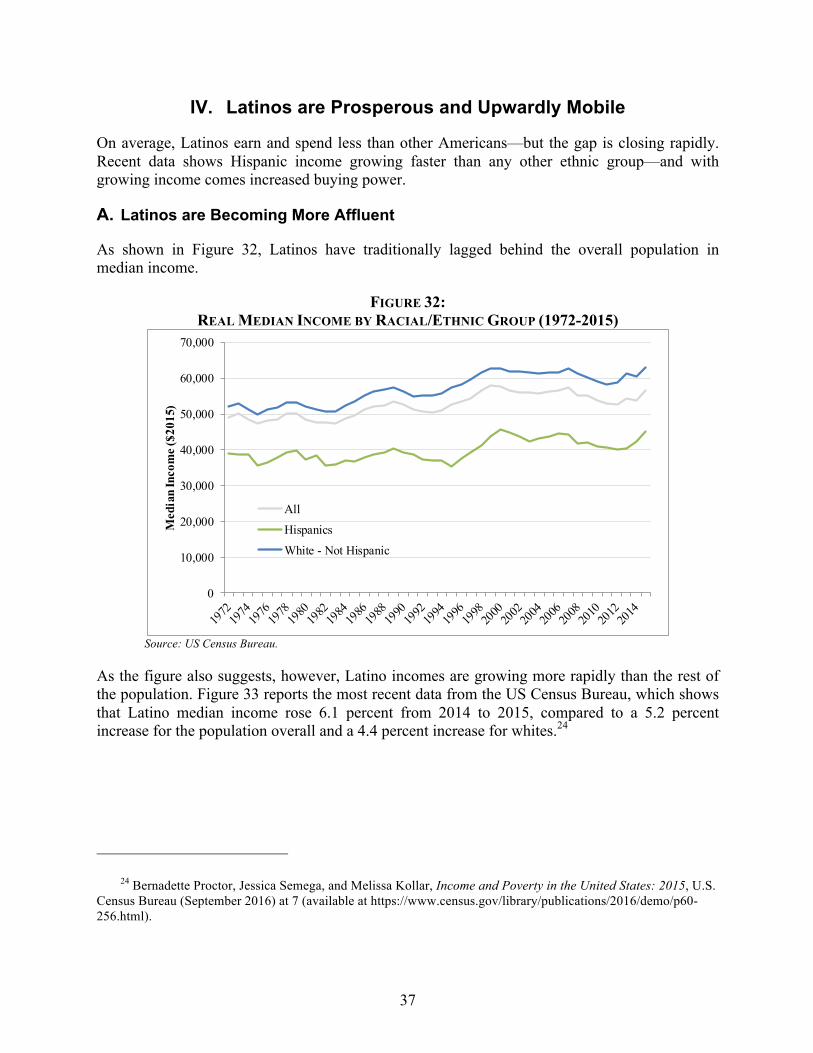
As shown in Figure 32, Latinos have traditionally lagged behind the overall population in median income.
FIGURE 32: REAL MEDIAN INCOME BY RACIAL/ETHNIC GROUP (1972-2015)
Source: US Census Bureau.
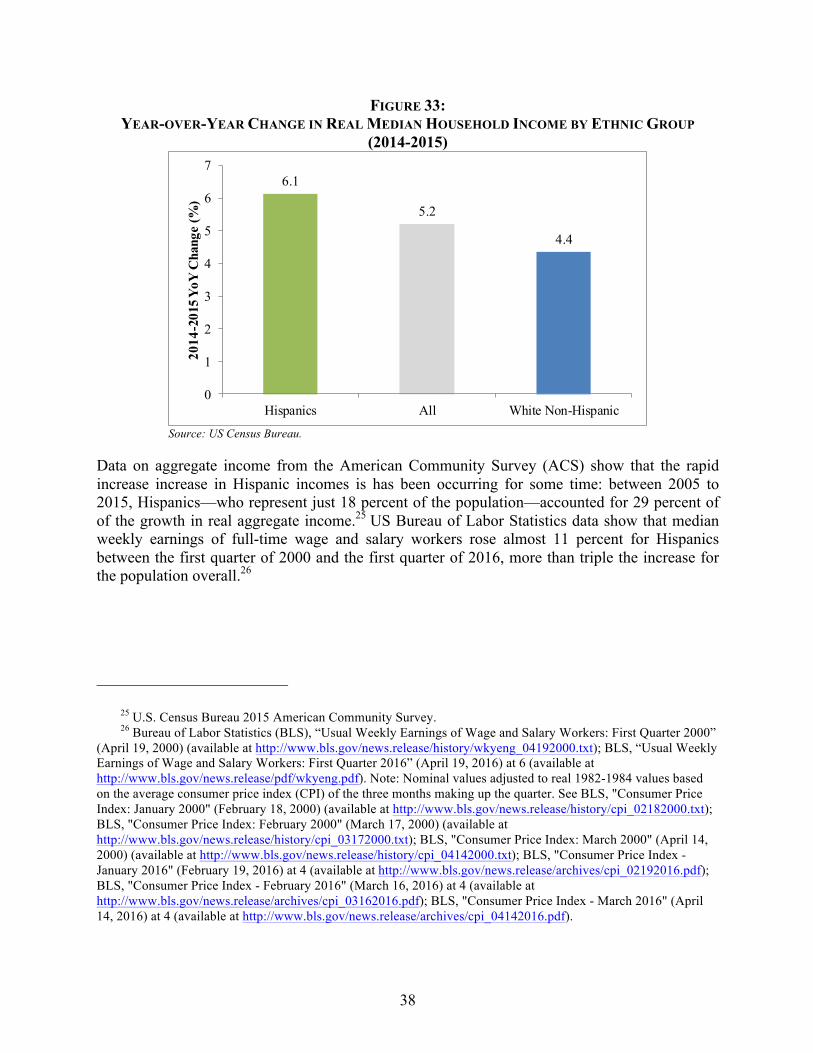
As the figure also suggests, however, Latino incomes are growing more rapidly than the rest of the population. Figure 33 reports the most recent data from the US Census Bureau, which shows that Latino median income rose 6.1 percent from 2014 to 2015, compared to a 5.2 percent increase for the population overall and a 4.4 percent increase for whites.24
24 Bernadette Proctor, Jessica Semega, and Melissa Kollar, Income and Poverty in the United States: 2015, U.S.
Census Bureau (September 2016) at 7 (available at https://www.census.gov/library/publications/2016/demo/p60-256.html).
0
10,000
20,000
30,000
40,000
50,000
60,000
70,000
Med
ian
Inco
me (
$201
5)
All
Hispanics
White - Not Hispanic
38
FIGURE 33: YEAR-OVER-YEAR CHANGE IN REAL MEDIAN HOUSEHOLD INCOME BY ETHNIC GROUP
(2014-2015)
Source: US Census Bureau.
Data on aggregate income from the American Community Survey (ACS) show that the rapid increase increase in Hispanic incomes is has been occurring for some time: between 2005 to 2015, Hispanics—who represent just 18 percent of the population—accounted for 29 percent of of the growth in real aggregate income.25 US Bureau of Labor Statistics data show that median weekly earnings of full-time wage and salary workers rose almost 11 percent for Hispanics between the first quarter of 2000 and the first quarter of 2016, more than triple the increase for the population overall.26
25 U.S. Census Bureau 2015 American Community Survey. 26 Bureau of Labor Statistics (BLS), “Usual Weekly Earnings of Wage and Salary Workers: First Quarter 2000”
(April 19, 2000) (available at http://www.bls.gov/news.release/history/wkyeng_04192000.txt); BLS, “Usual Weekly Earnings of Wage and Salary Workers: First Quarter 2016” (April 19, 2016) at 6 (available at http://www.bls.gov/news.release/pdf/wkyeng.pdf). Note: Nominal values adjusted to real 1982-1984 values based on the average consumer price index (CPI) of the three months making up the quarter. See BLS, "Consumer Price Index: January 2000" (February 18, 2000) (available at http://www.bls.gov/news.release/history/cpi_02182000.txt); BLS, "Consumer Price Index: February 2000" (March 17, 2000) (available at http://www.bls.gov/news.release/history/cpi_03172000.txt); BLS, "Consumer Price Index: March 2000" (April 14, 2000) (available at http://www.bls.gov/news.release/history/cpi_04142000.txt); BLS, "Consumer Price Index - January 2016" (February 19, 2016) at 4 (available at http://www.bls.gov/news.release/archives/cpi_02192016.pdf); BLS, "Consumer Price Index - February 2016" (March 16, 2016) at 4 (available at http://www.bls.gov/news.release/archives/cpi_03162016.pdf); BLS, "Consumer Price Index - March 2016" (April 14, 2016) at 4 (available at http://www.bls.gov/news.release/archives/cpi_04142016.pdf).
6.1
5.2
4.4
0
1
2
3
4
5
6
7
Hispanics All White Non-Hispanic
2014
-201
5 YoY
Cha
nge
(%)

39
ACS income data also show an increase in the affluence of Hispanic households during the past decade. Figure 34 shows the change in the number of households with an income of $200,000 or more from 2005 to 2015. Hispanics had the highest percentage increase, with the number of households increasing by 187 percent compared to 104 percent for the US as a whole and 89 percent for white non-Hispanics.27
FIGURE 34: GROWTH IN HOUSEHOLDS WITH INCOME OF $200,000 OR MORE
(2005-2015)
Source: 2005 and 2015 American Community Survey. Note: Data are in nominal dollars.
27 See U.S. Census Bureau 2015 American Community Survey.
187
10489
0
20
40
60
80
100
120
140
160
180
200
Hispanic All White Non-Hispanic
Perc
ent C
hang
e (%
)

40
Data on the distribution of households by income bracket also show increasing Latino affluence. In Figure 35, the top chart shows the percentage of total Hispanic households by income bracket for the years 2005 and 2015. The chart below shows the difference between the 2005 and the 2015 percentages by income bracket in percentage points. The percentage of Latino households within all income brackets under $50,000 has declined since 2005 and the percentage has increased for all income brackets of $50,000 or more.
FIGURE 35: CHANGE IN LATINO HOUSEHOLD COMPOSITION BY INCOME BRACKET
(2005-2015)
Source: 2005 and 2015 American Community Survey. Note: Data are in nominal dollars.
41
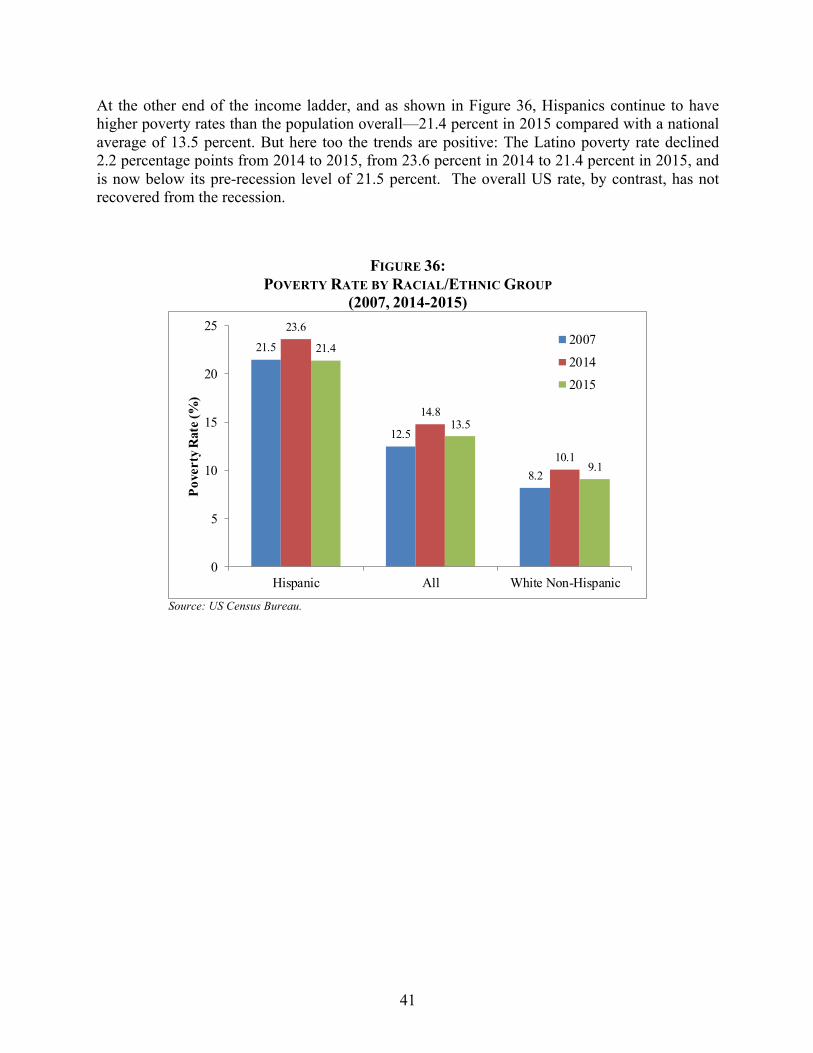
At the other end of the income ladder, and as shown in Figure 36, Hispanics continue to have higher poverty rates than the population overall—21.4 percent in 2015 compared with a national average of 13.5 percent. But here too the trends are positive: The Latino poverty rate declined 2.2 percentage points from 2014 to 2015, from 23.6 percent in 2014 to 21.4 percent in 2015, and is now below its pre-recession level of 21.5 percent. The overall US rate, by contrast, has not recovered from the recession.
FIGURE 36: POVERTY RATE BY RACIAL/ETHNIC GROUP
(2007, 2014-2015)
Source: US Census Bureau.
21.5
12.5
8.2
23.6
14.8
10.1
21.4
13.5
9.1
0
5
10
15
20
25
Hispanic All White Non-Hispanic
Pove
rty R
ate (
%)
2007
2014
2015
42
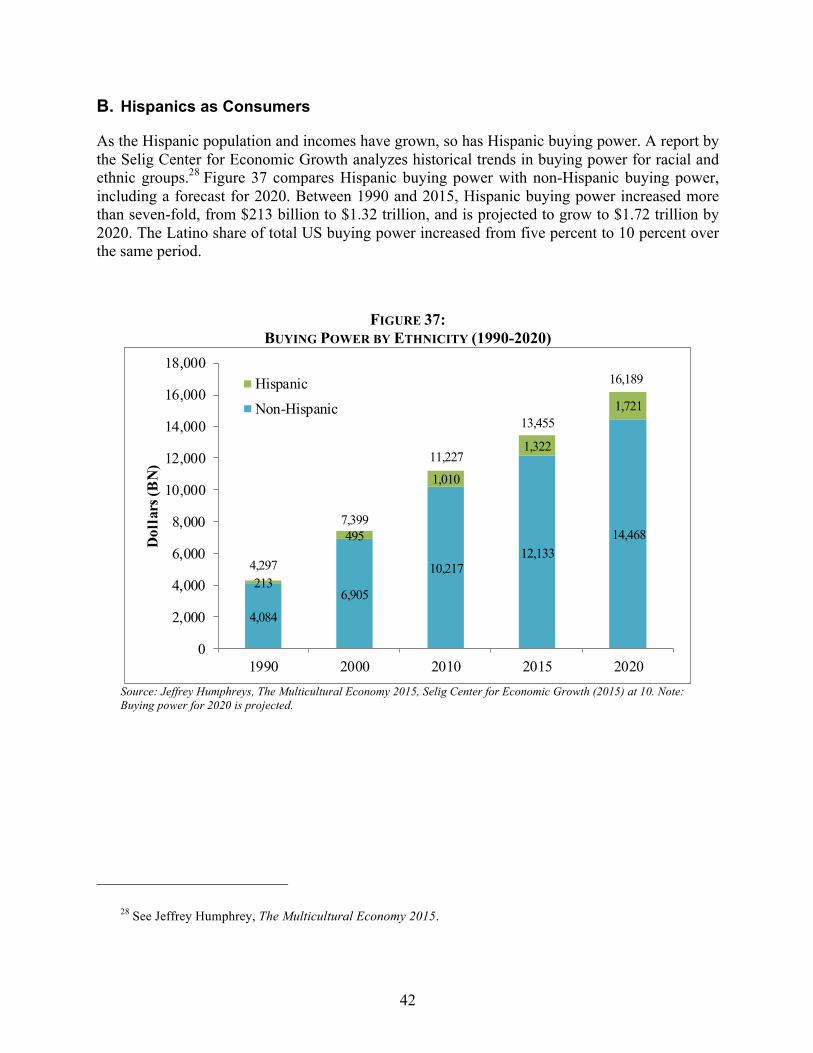
B. Hispanics as Consumers
As the Hispanic population and incomes have grown, so has Hispanic buying power. A report by the Selig Center for Economic Growth analyzes historical trends in buying power for racial and ethnic groups.28 Figure 37 compares Hispanic buying power with non-Hispanic buying power, including a forecast for 2020. Between 1990 and 2015, Hispanic buying power increased more than seven-fold, from $213 billion to $1.32 trillion, and is projected to grow to $1.72 trillion by 2020. The Latino share of total US buying power increased from five percent to 10 percent over the same period.
FIGURE 37: BUYING POWER BY ETHNICITY (1990-2020)
Source: Jeffrey Humphreys, The Multicultural Economy 2015, Selig Center for Economic Growth (2015) at 10. Note: Buying power for 2020 is projected.
28 See Jeffrey Humphrey, The Multicultural Economy 2015.
4,084
6,905
10,21712,133
14,468
213
495
1,010
1,322
1,721
4,297
7,399
11,227
13,455
16,189
0
2,000
4,000
6,000
8,000
10,000
12,000
14,000
16,000
18,000
1990 2000 2010 2015 2020
Dol
lars
(BN
)
Hispanic
Non-Hispanic
43
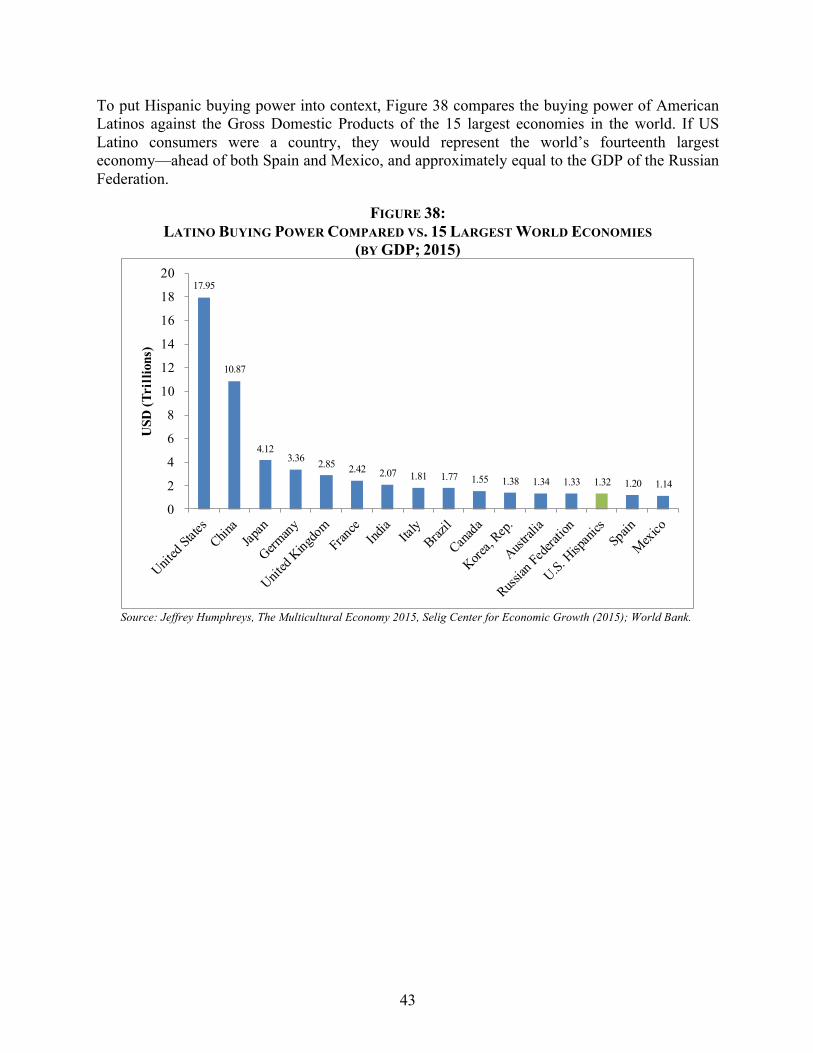
To put Hispanic buying power into context, Figure 38 compares the buying power of American Latinos against the Gross Domestic Products of the 15 largest economies in the world. If US Latino consumers were a country, they would represent the world’s fourteenth largest economy—ahead of both Spain and Mexico, and approximately equal to the GDP of the Russian Federation.
FIGURE 38: LATINO BUYING POWER COMPARED VS. 15 LARGEST WORLD ECONOMIES
(BY GDP; 2015)
Source: Jeffrey Humphreys, The Multicultural Economy 2015, Selig Center for Economic Growth (2015); World Bank.
17.95
10.87
4.123.36 2.85 2.42 2.07 1.81 1.77 1.55 1.38 1.34 1.33 1.32 1.20 1.14
0
2
4
6
8
10
12
14
16
18
20
USD
(Tri
llion
s)
44
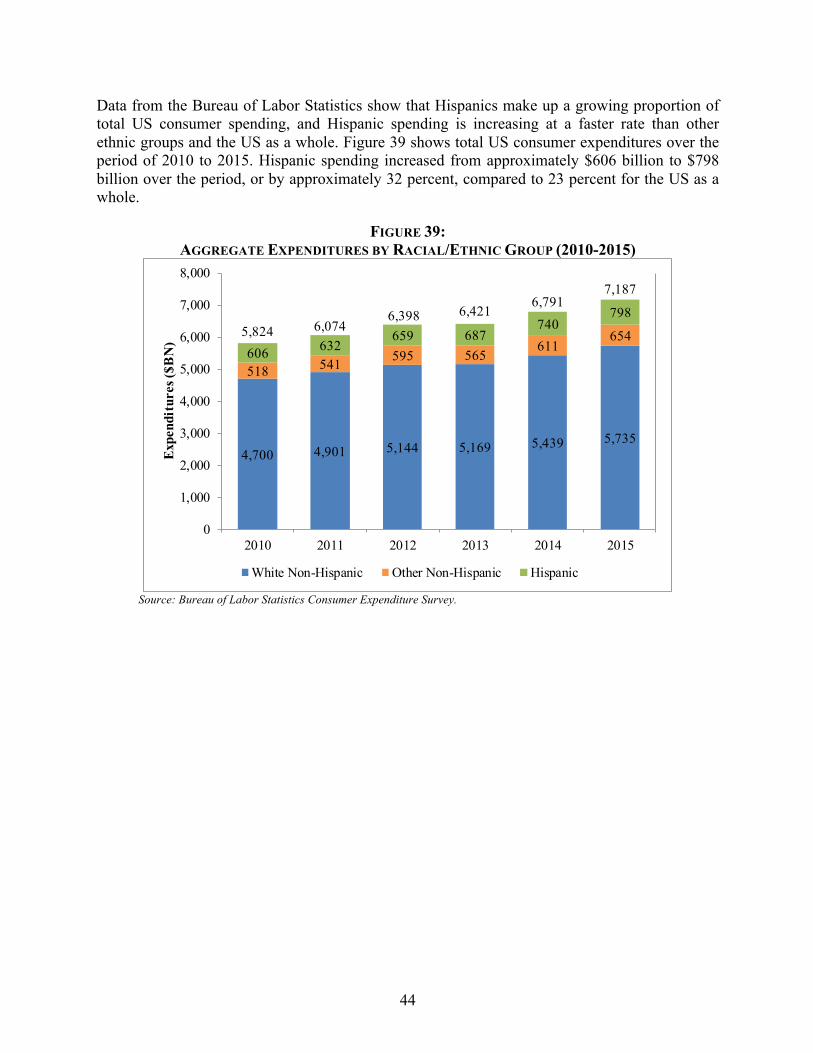
Data from the Bureau of Labor Statistics show that Hispanics make up a growing proportion of total US consumer spending, and Hispanic spending is increasing at a faster rate than other ethnic groups and the US as a whole. Figure 39 shows total US consumer expenditures over the period of 2010 to 2015. Hispanic spending increased from approximately $606 billion to $798 billion over the period, or by approximately 32 percent, compared to 23 percent for the US as a whole.
FIGURE 39: AGGREGATE EXPENDITURES BY RACIAL/ETHNIC GROUP (2010-2015)
Source: Bureau of Labor Statistics Consumer Expenditure Survey.
4,700 4,901 5,144 5,169 5,439 5,735
518 541 595 565611
654606 632
659 687740
7985,824 6,074
6,398 6,4216,791
7,187
0
1,000
2,000
3,000
4,000
5,000
6,000
7,000
8,000
2010 2011 2012 2013 2014 2015
Expe
ndit
ures
($B
N)
White Non-Hispanic Other Non-Hispanic Hispanic
45
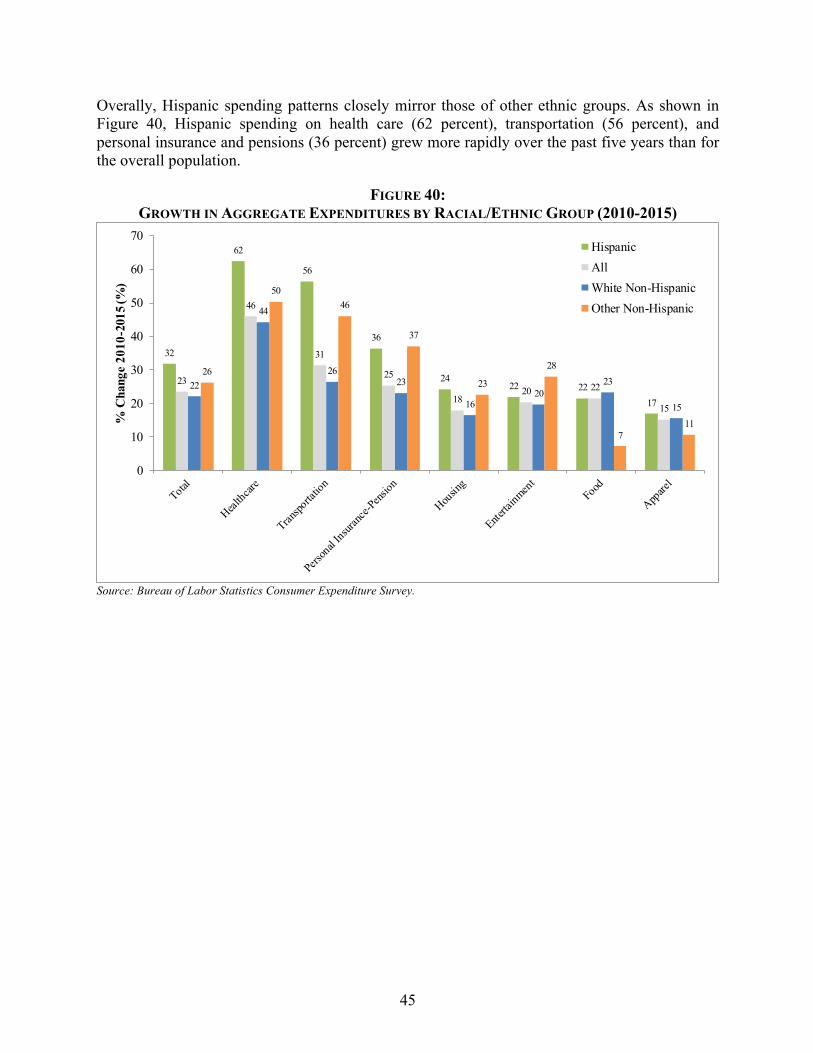
Overally, Hispanic spending patterns closely mirror those of other ethnic groups. As shown in Figure 40, Hispanic spending on health care (62 percent), transportation (56 percent), and personal insurance and pensions (36 percent) grew more rapidly over the past five years than for the overall population.
FIGURE 40: GROWTH IN AGGREGATE EXPENDITURES BY RACIAL/ETHNIC GROUP (2010-2015)
Source: Bureau of Labor Statistics Consumer Expenditure Survey.
32
62
56
36
2422 22
17
23
46
31
25
1820 22
15
22
44
2623
1620
23
15
26
5046
37
23
28
711
0
10
20
30
40
50
60
70
% C
hang
e 20
10-2
015 (
%)
HispanicAllWhite Non-HispanicOther Non-Hispanic

46
These differences aside, Hispanic shopping habits overall are very similar to those of other Americans. As shown in Figure 41, Latino consumers spend a slightly higher percentage of their total expenditures on housing, transportation, food, and apparel than non-Hispanics, and slightly less on personal insurance/pensions, healthcare, and entertainment.
FIGURE 41: PERCENTAGE OF TOTAL EXPENDITURES BY CATEGORY
(2015)
Source: Bureau of Labor Statistics Consumer Expenditure Survey.
33
1713
11
8
5310
U.S. Housing
Transportation
Food
PersonalInsurance-PensionsHealthcare
Entertainment
Apparel
Other
35
1914
10
644
7
Hispanic Housing
Transportation
Food
PersonalInsurance-PensionsHealthcare
Entertainment
Apparel
Other
47
V. The Top 25 Latino MSAs
As noted above, the Latino population is increasingly dispersed, with the fastest growth occurring in northern states like Alaska, Montana, New Hampshire, and North Dakota. This section presents data on the 25 MSAs with the largest Latino economies as measured by personal income. Together, the Latinos in these MSAs account for about 36 million people (63 percent of the overall US Latino population) and over $659 billion in personal income (67 percent of total Latino personal income). These communities are widely dispersed across the US They include both southwestern cities like Los Angeles and Phoenix; Midwestern hubs like Chicago and Denver; and northeastern metropolises like Boston, New York, and Philadelphia.
Latinos in these communities account for a disproportionate share of the growth in population and employment, as well earnings. And, as is the case nationally, they are younger than the population at large and increasingly affluent.
48
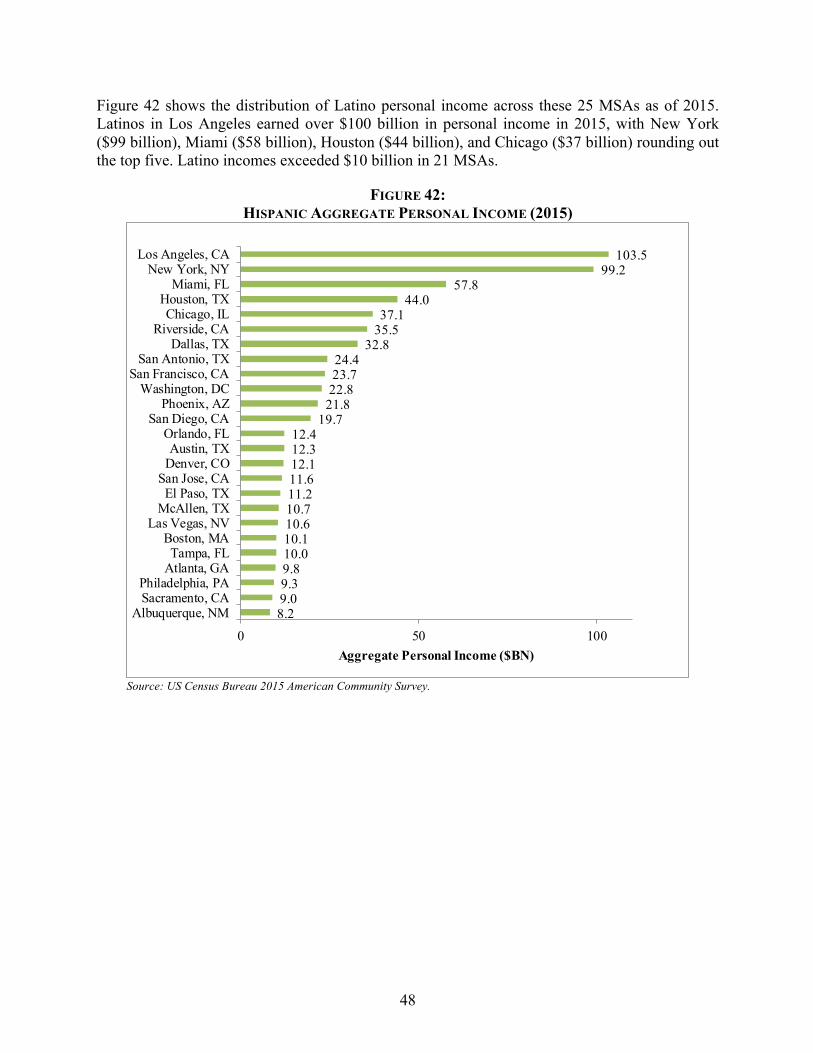
Figure 42 shows the distribution of Latino personal income across these 25 MSAs as of 2015. Latinos in Los Angeles earned over $100 billion in personal income in 2015, with New York ($99 billion), Miami ($58 billion), Houston ($44 billion), and Chicago ($37 billion) rounding out the top five. Latino incomes exceeded $10 billion in 21 MSAs.
FIGURE 42: HISPANIC AGGREGATE PERSONAL INCOME (2015)
Source: US Census Bureau 2015 American Community Survey.
8.29.09.39.810.010.110.610.711.211.612.112.312.4
19.721.822.823.724.4
32.835.537.1
44.057.8
99.2103.5
0 50 100
Albuquerque, NMSacramento, CAPhiladelphia, PA
Atlanta, GATampa, FL
Boston, MALas Vegas, NV
McAllen, TXEl Paso, TX
San Jose, CADenver, COAustin, TX
Orlando, FLSan Diego, CA
Phoenix, AZWashington, DC
San Francisco, CASan Antonio, TX
Dallas, TXRiverside, CA
Chicago, ILHouston, TX
Miami, FLNew York, NY
Los Angeles, CA
Aggregate Personal Income ($BN)

49
As shown in Figures 43 and 44, Latinos account for a disproproportionate share of both population growth and income growth in nearly every MSA.
Figure 43 compares Latino population growth over the last decade in each city to the growth of the overall population. The Latino population in these cities grew by 28 percent between 2005 and 2015, which is a somewhat slower pace than the US overall. Figure 43 also shows a growth rate that is 14 percentage points faster than the 14 percent overall population growth rate for these 25 MSAs. The Latino population grew fastest in Orlando, Philadelphia, and Washington; and slowest in Los Angeles, El Paso, and Chicago. The largest differences in population growth between Hispanics and the overall population occurred in Philadelphia, Boston, and Orlando; the smallest differences were in Los Angeles, McEllen, and El Paso.
FIGURE 43: COMPARISON OF HISPANIC AND TOTAL POPULATION GROWTH RATES
(2005-2015)
Source: US Census Bureau 2005 and 2015 American Community Survey.
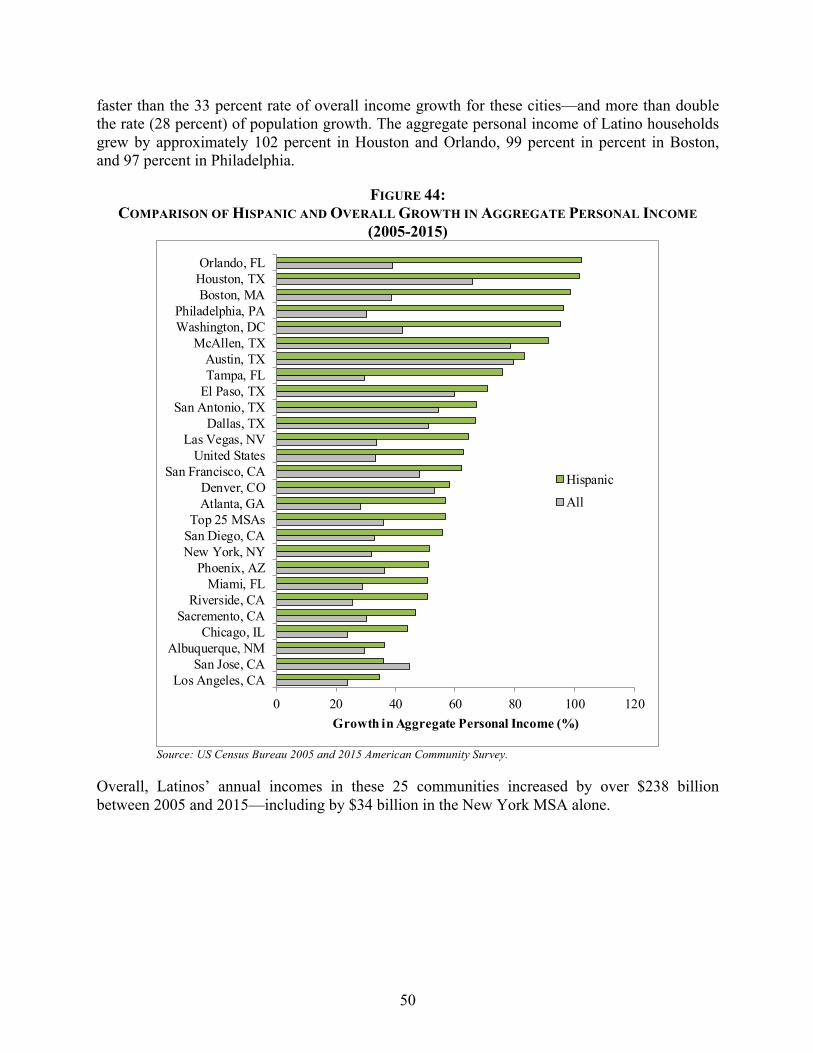
Figure 44 shows data comparable to Figure 43, but for growth in income rather than population. Latino incomes in the top 25 MSAs grew by 57 percent between 2005 and 2015, which is much
0 10 20 30 40 50 60 70 80
Los Angeles, CAEl Paso, TXChicago, IL
San Jose, CAPhoenix, AZ
New York, NYDenver, CO
McAllen, TXSan Francisco, CA
Top 25 MSAAlbuquerque, NM
San Diego, CAMiami, FL
San Antonio, TXUnited States
Riverside, CADallas, TX
Sacremento, CAHouston, TXAtlanta, GA
Las Vegas, NVAustin, TX
Boston, MATampa, FL
Washington, DCPhiladelphia, PA
Orlando, FL
Population Growth (%)
Hispanic
All
50
faster than the 33 percent rate of overall income growth for these cities—and more than double the rate (28 percent) of population growth. The aggregate personal income of Latino households grew by approximately 102 percent in Houston and Orlando, 99 percent in percent in Boston, and 97 percent in Philadelphia.
FIGURE 44: COMPARISON OF HISPANIC AND OVERALL GROWTH IN AGGREGATE PERSONAL INCOME
(2005-2015)
Source: US Census Bureau 2005 and 2015 American Community Survey.
Overall, Latinos’ annual incomes in these 25 communities increased by over $238 billion between 2005 and 2015—including by $34 billion in the New York MSA alone.
0 20 40 60 80 100 120
Los Angeles, CASan Jose, CA
Albuquerque, NMChicago, IL
Sacremento, CARiverside, CA
Miami, FLPhoenix, AZ
New York, NYSan Diego, CATop 25 MSAs
Atlanta, GADenver, CO
San Francisco, CAUnited States
Las Vegas, NVDallas, TX
San Antonio, TXEl Paso, TXTampa, FLAustin, TX
McAllen, TXWashington, DCPhiladelphia, PA
Boston, MAHouston, TXOrlando, FL
Growth in Aggregate Personal Income (%)
Hispanic
All
51
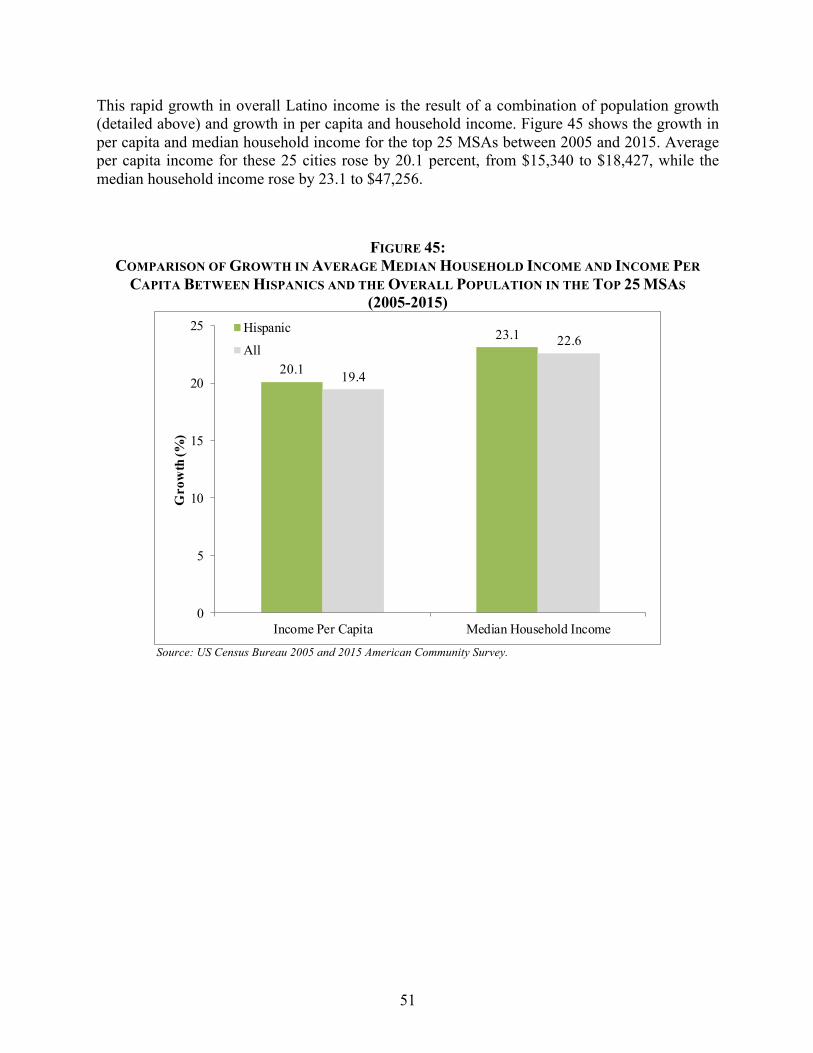
This rapid growth in overall Latino income is the result of a combination of population growth (detailed above) and growth in per capita and household income. Figure 45 shows the growth in per capita and median household income for the top 25 MSAs between 2005 and 2015. Average per capita income for these 25 cities rose by 20.1 percent, from $15,340 to $18,427, while the median household income rose by 23.1 to $47,256.
FIGURE 45: COMPARISON OF GROWTH IN AVERAGE MEDIAN HOUSEHOLD INCOME AND INCOME PER
CAPITA BETWEEN HISPANICS AND THE OVERALL POPULATION IN THE TOP 25 MSAS (2005-2015)
Source: US Census Bureau 2005 and 2015 American Community Survey.
20.1
23.1
19.4
22.6
0
5
10
15
20
25
Income Per Capita Median Household Income
Gro
wth
(%)
Hispanic
All
52
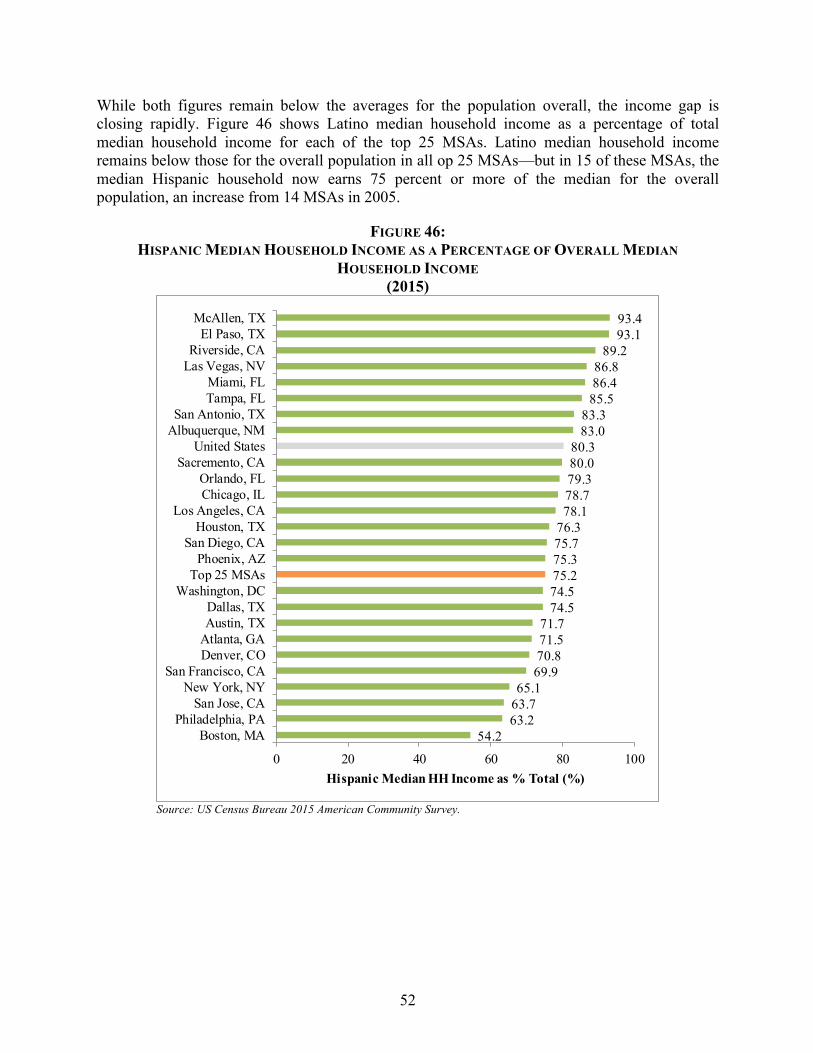
While both figures remain below the averages for the population overall, the income gap is closing rapidly. Figure 46 shows Latino median household income as a percentage of total median household income for each of the top 25 MSAs. Latino median household income remains below those for the overall population in all op 25 MSAs—but in 15 of these MSAs, the median Hispanic household now earns 75 percent or more of the median for the overall population, an increase from 14 MSAs in 2005.
FIGURE 46: HISPANIC MEDIAN HOUSEHOLD INCOME AS A PERCENTAGE OF OVERALL MEDIAN
HOUSEHOLD INCOME (2015)
Source: US Census Bureau 2015 American Community Survey.
54.263.263.765.1
69.970.871.571.7
74.574.575.275.375.776.378.178.779.380.080.3
83.083.3
85.586.486.8
89.293.193.4
0 20 40 60 80 100
Boston, MAPhiladelphia, PA
San Jose, CANew York, NY
San Francisco, CADenver, COAtlanta, GAAustin, TXDallas, TX
Washington, DCTop 25 MSAs
Phoenix, AZSan Diego, CA
Houston, TXLos Angeles, CA
Chicago, ILOrlando, FL
Sacremento, CAUnited States
Albuquerque, NMSan Antonio, TX
Tampa, FLMiami, FL
Las Vegas, NVRiverside, CA
El Paso, TXMcAllen, TX
Hispanic Median HH Income as % Total (%)
53
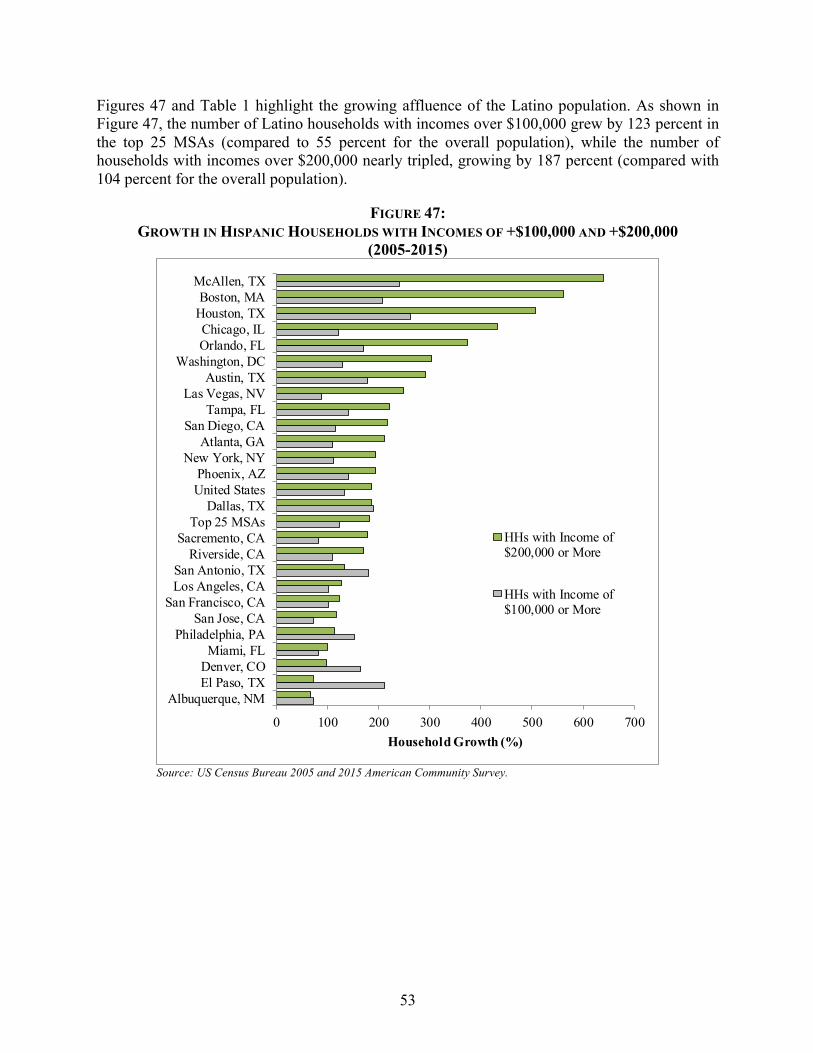
Figures 47 and Table 1 highlight the growing affluence of the Latino population. As shown in Figure 47, the number of Latino households with incomes over $100,000 grew by 123 percent in the top 25 MSAs (compared to 55 percent for the overall population), while the number of households with incomes over $200,000 nearly tripled, growing by 187 percent (compared with 104 percent for the overall population).
FIGURE 47: GROWTH IN HISPANIC HOUSEHOLDS WITH INCOMES OF +$100,000 AND +$200,000
(2005-2015)
Source: US Census Bureau 2005 and 2015 American Community Survey.
0 100 200 300 400 500 600 700
Albuquerque, NMEl Paso, TXDenver, COMiami, FL
Philadelphia, PASan Jose, CA
San Francisco, CALos Angeles, CASan Antonio, TX
Riverside, CASacremento, CA
Top 25 MSAsDallas, TX
United StatesPhoenix, AZ
New York, NYAtlanta, GA
San Diego, CATampa, FL
Las Vegas, NVAustin, TX
Washington, DCOrlando, FLChicago, IL
Houston, TXBoston, MA
McAllen, TX
Household Growth (%)
HHs with Income of$200,000 or More
HHs with Income of$100,000 or More
54
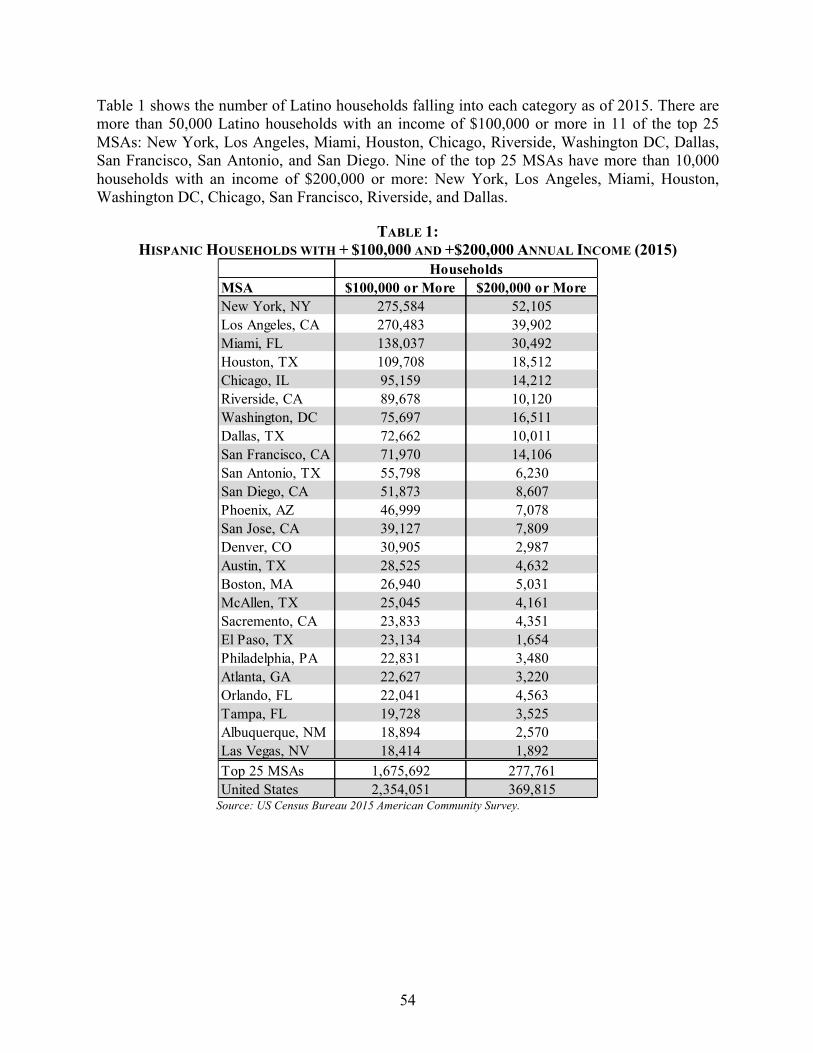
Table 1 shows the number of Latino households falling into each category as of 2015. There are more than 50,000 Latino households with an income of $100,000 or more in 11 of the top 25 MSAs: New York, Los Angeles, Miami, Houston, Chicago, Riverside, Washington DC, Dallas, San Francisco, San Antonio, and San Diego. Nine of the top 25 MSAs have more than 10,000 households with an income of $200,000 or more: New York, Los Angeles, Miami, Houston, Washington DC, Chicago, San Francisco, Riverside, and Dallas.
TABLE 1: HISPANIC HOUSEHOLDS WITH + $100,000 AND +$200,000 ANNUAL INCOME (2015)
Source: US Census Bureau 2015 American Community Survey.
MSA $100,000 or More $200,000 or MoreNew York, NY 275,584 52,105Los Angeles, CA 270,483 39,902Miami, FL 138,037 30,492Houston, TX 109,708 18,512Chicago, IL 95,159 14,212Riverside, CA 89,678 10,120Washington, DC 75,697 16,511Dallas, TX 72,662 10,011San Francisco, CA 71,970 14,106San Antonio, TX 55,798 6,230San Diego, CA 51,873 8,607Phoenix, AZ 46,999 7,078San Jose, CA 39,127 7,809Denver, CO 30,905 2,987Austin, TX 28,525 4,632Boston, MA 26,940 5,031McAllen, TX 25,045 4,161Sacremento, CA 23,833 4,351El Paso, TX 23,134 1,654Philadelphia, PA 22,831 3,480Atlanta, GA 22,627 3,220Orlando, FL 22,041 4,563Tampa, FL 19,728 3,525Albuquerque, NM 18,894 2,570Las Vegas, NV 18,414 1,892Top 25 MSAs 1,675,692 277,761United States 2,354,051 369,815
Households

55
VI. Conclusion
The data presented in this study demonstrate that the Latino community in the US is a source of both demographic and economic dynamism. Latinos are making America younger, more entrepreneurial, more likely to be employed, and increasingly affluent. They are contributing disproportionately to productivity and economic growth. Given the demographic profile of Hispanic Americans, it seems extremely likely these trends will continue in the years to come.

NERA Economic Consulting (www.nera.com) is a global firm of experts dedicated to applying
economic, finance, and quantitative principles to complex business and legal challenges. For half
a century, NERA’s economists have been creating strategies, studies, reports, expert testimony,
and policy recommendations for government authorities and the world’s leading law firms and
corporations. NERA serves clients from more than 25 offices across North America, Europe, and
Asia Pacific.
The Royal Bank of Canada (www.rbc.com), operating since 1869, is one of North America’s
leading diversified financial services companies and provides personal and commercial banking,
wealth management, insurance, investor services and capital markets products and services on a
global basis. The company employs approximately 80,000 professionals who serve more than 16
million personal, business, public sector and institutional clients through offices in Canada, the
U.S. and 36 other countries.
The Latino Donor Collaborative (www.latinodonorcollaborative.org), founded in 2010,
is a 501(c)(3) non-profit organization dedicated to reshaping the perception of Latinos as part
of the American social mainstream. The LDC is self-funded and independent, and created by an
accomplished group of Latino national leaders that generously donate their time to promote
friendly high-level dialogue, with the goal of finding best ways to grow revenue and market share
– by targeting and serving the Latino audiences. We do this through a nonpartisan agenda that
includes outreach to influential people in media, advertising, politics, corporate America, and
civil society by confronting stereotypes with data that brings understanding and appreciation
of the actual roles being played by Latinos in society, politics, and commerce. The LDC board
is passionate about empowering every Latino to be the best they can be, and know that by
empowering Latinos, they create a rich, united, and more powerful United States of America.

Visit www.nera.com to learn
more about our practice areas
and global offices.
© Copyright 2016
National Economic
Research Associates, Inc.
All rights reserved.
Printed in the USA.