making africa’s power sector sustainable
TRANSCRIPT

An Analysis of Power SectorReforms in Africa
United Nations Environment Programme
United Nations Economic Commission for Africa
Making Africa’s Power SectorSustainable


Making Africa’s Power SectorSustainable
An Analysis of Power Sector Reforms in Africa
United Nations Economic Commission for Africa
United Nations Environment Programme
A Joint UNECA and UNEP Report Published within the Framework of UN-Energy/Africa

ii
© United Nations Economic Commission for Africa, 2007Addis Ababa, Ethiopia
All rights reservedFirst printing September 2007
Material in this publication may be freely quoted or reprinted. Acknowledgement is requested, together with a copy of the publication.
The designation employed and the presentation of material in this publication do not imply the expression of any opinion whatsoever on the part of the Secretariat of the United Nations concerning the legal status of any country, territory, city, or area or of its authorities, or concerning the delimitation of its frontiers or boundaries.
Edited, designed and printed by the ECA Publications and Conference Management Section (PCMS).
Ordering Information
To order free copies of Making Africa’s Power Sector Sustainable, please contact
Publications Economic Commission for AfricaP.O Box 3001Addis Ababa, Ethiopia
Tel: +251-11-544-9900Fax: +251-11-551-0335
Email:[email protected] OR [email protected] download a copy from www.uneca.org
iii
Table of Contents
Abbreviations and Acronyms ..................................................................................vii
Acknowledgements ..................................................................................................ix
Executive Summary .................................................................................................xi
1. Introduction ................................................................................................. 1
1.1 Review of Past Work Done on Reforms ................................................ 11.2 What Does This Study Address? ............................................................ 21.3 Methodology Used in the Study ............................................................ 3
2. Overview of the Power Sector ....................................................................... 7
Installed Capacity and Electricity Generation ................................................ 82.1 Status of the Power Sector in Sub-Saharan Africa ................................... 92.2 Performance of the Power Sector .......................................................... 50
3. Status of Power Sector Reforms and Regulatory Measures ........................... 63
3.1 Description of Power Sector Reforms ................................................... 633.2 Status of Power Sector Reforms ............................................................ 66
4. Socio-Economic Impacts of Power Sector Reforms ...................................... 77
4.1 Socio-economic Benefits of Power Sector Reforms ................................ 784.2 Adverse Socio-economic Impacts of Power Sector Reforms .................. 85
5. Environmental Impacts of Power Sector Reforms ........................................ 91
6. Lessons Learnt and Key Findings ................................................................ 99
7. Policy Strategies for Making Power Sector Sustainable ............................... 105
7.1 Enhancing Access to Electricity among the Poor ................................ 1057.2 Technical Options for Improving Access to the Poor .......................... 1067.3 Ensuring the Use of Environmentally-Sound Electricity
Generation Options ........................................................................... 1097.4 Addressing Gaps and Barriers in the Legal and Regulatory
Framework ........................................................................................ 111Bibliography ....................................................................................................... 113
Appendix 1: Summary of the Status of Recent IPPs in Selected African Countries ........................................................................................ 131

iv
Figures
1. World Population without Electricity ............................................................ 3
2. Share of Installed Capacity in Africa (2004) .................................................. 7
3. Electricity Production in Africa (2004) .......................................................... 8
4. Installed Capacity by Countries (2003/2004)................................................ 9
5. The Structure of the Electric Power Sub-Sector after Reforms and Restructuring (Ca. 2002) ..................................................................... 11
6. Structure of the Power Sector in Uganda ..................................................... 16
7. Structure of the Power sector in Tanzania .................................................... 18
8. The current structure of the Zimbabwean power sector .............................. 25
9. Structure of the Power Sector in Namibia ................................................... 29
10. Structure of Power Sector in Ghana ............................................................ 33
11. Structure of the Power Sector in Ivory Coast ............................................... 40
12. Institutional Structure of the Power Sector in Cameroon ............................ 42
13. Electricity Consumption Per Capita in Cameroon ...................................... 43
14. Typical Institutional Structure of the Power Sector ...................................... 51
15. National Electrification Levels (2003/2004) ................................................ 54
16. Urban and Rural Electrification Levels (2003/2004) ................................... 55
17. Customers per Employee in Selected African Countries (2003/2004) ......... 56
18. Electricity Consumption per Capita (2003/2004) ....................................... 58
19. System Losses in Selected African Countries (2003/2004)........................... 59
20. Prevailing Average Tariff Levels in Selected Countries (2003/2004) ............. 61
21. Debtor Days (2003/2004) .......................................................................... 62
22. Sample Graph of Reform Options .....................................................6423. Transmission Infrastructure and Interconnection of the
Southern Africa Power Pool ......................................................................... 74
27. Summary of Status of reforms in the various countries ................................ 75
24. 5th Quintile – The Richest Population ......................................................... 86
25. Cost of Electricity to the End user in Kenya ................................................ 88
26. Proportion of Installed Capacity of IPPs By Fuel Used in Africa (2002) ...... 91

v
Tables
1. Indicators ...................................................................................................... 5
2. Number of customers connected to Electricity in Kenya ............................. 12
3. Per capita Electricity Consumption and GDP growth rates ......................... 13
4. Installed Capacity and Annual Electricity Generation ................................. 14
5. Percentage of Households connected to electricity in Kenya ........................ 14
6. Trends of Power Sector Performance in Uganda .......................................... 17
7. Trends of the Power Sector Performance in Tanzania ................................... 20
8. Trends of the Financial Performance of the Power Sector in Eritrea ............. 23
9. Trends of the Power Sector Performance in Eritrea ...................................... 23
10. Trends in the performance of the Zimbabwean power sector ....................... 26
11. Trends in the performance of the Zambian power sector ............................. 28
12. Trends of the power sector performance in Namibia ................................... 31
13. Progress of power sector reforms in Ghana .................................................. 34
14. Trends in the performance of Ghana’s power sector ..................................... 35
15. Trends in the performance of Burkina Faso’s power sector ........................... 38
16. Trends in the performance of the power sector in Cameroon ...................... 44
18. Trends in the Performance of the power sector in Niger .............................. 50
19. Key Economic and Electricity Industry Indicators (2003/2004) .................. 53
20. Electricity Consumption per Capita (2003/2004) ....................................... 57
21. Key Financial Indicators for the Electricity Industry Indicators (2003/2004) ............................................................................................... 60
22. Status of Power Sector Reforms in the Developing World (1998) ................ 65
23. Status of Reform Implementation ............................................................... 66
24. Recent Tariff Increases ................................................................................. 68
25. Changes in the Legal and Regulatory Framework ........................................ 69
26. Summaries of Electricity Regulatory Bodies in Sub-Saharan Africa ............. 70
27. Rural Electrification by REA - Case of Zimbabwe (Since 2002) .................. 81
28. Benefits of the Rural Electrification in Zimbabwe ....................................... 82
29. ZESA’s Performance Before & After Reform ............................................... 85
vi
30. Electricity Consumption Patterns of Urban Households ............................. 89
31. Significance of Electricity Subsidies ............................................................. 89
32. Drought and its effect on hydropower generation ....................................... 93
33. The Status of EIA Policies Laws and Guidelines in the Region .................... 95
34. Average cost of Load Limiters (US$)-1994 ................................................ 107
35. Estimation of Subsidies Distribution in Uganda (1999) ............................ 109
Boxes
1. Management Contract Experience in Africa ................................................ 67
2. Oshakati Premier Ltd .................................................................................. 73
3 Benefit of Electricity to SMEs in Kenya ...................................................... 80
4 Social Tariff in South Africa ........................................................................ 83
5 Cost of Electricity Among the Poor in Mali ................................................ 89
6 Case Study: Kenya ...................................................................................... 96
7 Case Study: Cameroon ................................................................................ 97

vii
Abbreviations and Acronyms
AFREPREN/FWD African Energy Policy Research Network/Foundation for Woodstove Dissemination
CCK Communication Commission of KenyaCAPCO Central African Power CorporationDANIDA Danish International Development Cooperation Agency DFID Department of International DevelopmentDGE Department of General EnergyEAIF Emerging Africa Infrastructure FundECG Electricity Company of GhanaEDM Energie Du MaliEEC Eritrea Electric CorporationEIA Environment Impact AssessmentEIA Environmental Investigating AgencyEIB European Investment Bank EIS Environmental Impact Statement ERA Electricity Regulatory AuthorityERB Electricity Regulatory BoardESC Electricity Supply CommissionESKOM Electricity Supply Commission of South Africa ESMAP Energy Sector Management Assistance Programme FINNIDA Finnish International Development Cooperation Agency FMO The Netherlands Development Finance CompanyGDP Gross Development ProductGEF Global Environment FacilityGNESD Global Network on Energy for Sustainable Development GNP Gross National ProductGWh Gigawatt HoursHGNP Hale’s Gate National Park ICT Information and Communication TechnologyIEA International Energy AgencyIPD Independent Power DistributorIPP Independent Power ProducerIPTL Independent Power Tanzania LimitedKenGen Kenya Electricity Generating Company Limited KPC Kenya Power CompanyKPLC Kenya Power and Lighting CompanyKPLC Kenya Power and Lighting CompanyKVDA Kerio Valley Development AuthoritykWh Kilo-Watt-HourLRMC Long Run Marginal Cost

viii
MCE Ministry of Mines, Quarries and EnergyMEM Ministry of Energy and MineralsMEM Ministry of Energy and MinesMINEF Ministry of Environment and Forestry MRLGH Ministry of Regional Local Government and Housing MW Megawatt NED Northern Electrification DepartmentNEP National Electrification ProjectNER National Electricity RegulatorNRECA National Rural Electric Cooperative Association OECD Organization for Economic Cooperation and DevelopmentPPA Power Purchase AgreementsPPA Power Purchase AgreementsPV PhotovoltaicREA Rural Electrification AgencyRED Regional Distribution CompaniesSADC Southern African Development CommunitySAPP Southern African Power PoolSHEP Self Help Electrification ProjectSHS Solar Home SystemsSTAMICO State Mining Corporation SWER Single Wire Earth ReturnTANESCO Tanzania Electric Supply Company TARDA Tana and Athi River Development AuthorityTPDC Tanzania Petroleum Development CorporationTRDC Tana River Development CompanyUEB Uganda Electricity BoardUEDCL Uganda Electricity Distribution Company Limited UNECA United Nations Economic Commission for Africa UNEP United Nations Environment ProgrammeUSc US CentsUSD US DollarsUShs Uganda ShillingsVRA Volta River AuthorityWRI World Resources InstituteZESA Zimbabwe Electricity Supply AuthorityZESA Zimbabwe Electricity Supply AuthorityZPA Zambia Privatization Agency

ix
Acknowledgements
This Report proceeds from a study commissioned jointly by the United Nations Environment Programme (UNEP) and United Nations Economic Commission forAfrica (UNECA), with the collaboration of members of UN-Energy/Africa. The study was conducted under the supervision of a Project Coordination Team composed of Mr. Pancrace Niyimbona and Mr. Jacques Moulot of the Sustainable Development Division of UNECA and Ms. Njeri Wamukonya of the UNEP Division of Policy and Law. Power sector stakeholders, including policy-makers, regulators, and utilities discussed the findings of the study during a forum co-organised by UNEP, UNECA and the United Nations Department for Economic and Social Affairs (UNDESA). The report benefited from the valuable comments from African countries targeted in the study. Findings were also presented during the first African Union Conference of Ministers in Charge of Electricity, organised in Addis Ababa, in Mach 2006. The study and report were conducted and written by the African Energy Policy and Research Network (AFREPREN).
Sincere thanks to all writers, reviewers, participants, and the members of the Project Coordination Team. Great appreciations to Mr. Josué Dioné, director of the Sustainable Development Division and to Mr. Antonio Pedro, leader of the Natural Resources Team for their overall supervision and guidance.


xi
Executive Summary
The biggest challenge facing sub-Saharan African countries today is to reach a sustainable rate of positive economic growth that will enable them to cope with soaring demographic and urban growth. In a bid to stimulate a genuine dynamic of development and to rise above the economic, social, political, and environmental crises that have beset the region more or less permanently since the late 1970s, the countries of the region together with the support of multilateral institutions introduced several sectoral reforms. Among these reforms are those related to the power sub-sector, which were, as analysed by energy experts, aimed at improving financial and technical efficiency of utilities, facilitating divestiture and guaranteeing future electricity supply in an open globalised energy market.
Electricity is needed both to industrialize and provide basic energy for the majority of the people living off the grid in rural areas. This situation needs major changes not only because of development demand but also for the region and its sub-regions is to be economically competitive with other developing regions of the world and is to realize its sustainable development goals – the subject of this study.
Traditionally, state owned power utilities in Africa have enjoyed a monopolistic hold over their national electricity industry. There is a growing consensus that the monopoly has contributed to the undeniable under-performance in the delivery of electricity services, particularly to the majority low-income groups. Power sector institutions as discussed in this report, are mainly characterised by unreliability of power supply, low capacity utilisation and availability factor, deficient maintenance, poor procurement of spare parts, and, high transmission and distribution losses among other problems. Consequently, the performance of the power sector was perceived as unsustainable which, in part, led to the advent of reforms in the African power sector.
The broad objectives of this study is to assess the sustainability of power sector in Africa by examining the socio-economic and environmental impacts of power sector reforms and use the results of the assessment to determine the extent to which reforms have made the power sector in the region sustainable. In particular, the study assesses the implementation of the process of power sector reforms in fourteen sub-Saharan Africa countries (Kenya, Zimbabwe, Senegal, Tanzania, Ghana, Burkina Faso, Zambia, Eritrea, Namibia, Cameroon, Cote d’Ivoire, Mali, Niger and Uganda). It then proposes options that could enhance the sustainability of the power sector.
In addressing the aforementioned broad objectives, the study focused on four specific objectives which include; the assessment of socio-economic and environmental impacts of past and current initiatives in the power sector; assessing the gaps in the legal and institutional framework of past power sector reform initiatives; demonstrate

xii
how to integrate environmental and socio-economic issues in power sector reforms and raise awareness among policy-makers on strategies to improve the sustainability of the power sector in Africa. The study involved examining power sector reforms in 14 African countries namely Kenya, Zimbabwe, Senegal, Tanzania, Ghana, Burkina Faso, Zambia, Eritrea, Namibia, Cameroon, Cote d’Ivoire, Mali, Niger and Uganda.
Based on the discussion and analysis presented in this report, several findings emerge. One of the key findings is that power reforms were not explicitly designed to ensure sustainability of the power sector. Reforms were primarily designed to bridge short-term generation shortfalls and enhance the financial health of state-owned power utilities.
This study regarded socio-economic impacts of reforms (especially electrification of the poor) as an important indicator of the power sector’s sustainability. In overall terms, socio-economic impacts of reforms on the poor appear to be negative or neutral. This is because, first and foremost, electrification of the poor was not significantly addressed in the reform process and was, in several cases, almost an afterthought with the exception of Cote d’Ivoire, Cameroon, Malawi, Burkina Faso, Senegal, Zimbabwe, South Africa and Mauritius.
Secondly, while reforms have led to the establishment of rural electrification funds and boards, these developments have not helped to increase electrification levels. In part, this is because the rural electrification funds and boards have not provided effective and innovative mechanisms that would ensure they achieved their objectives. Their design appears to have largely replicated that of past (and failed) mechanisms. Consequently, the rural electrification funds and boards have very little to show in terms of electrification of the poor.
Another important finding with regard to the impact of socio-economic impact of reforms on the poor is the increase in the cost of electricity and the associated reduction or removal of subsidies for the poor. Tariff increases were motivated by the desire to improve the financial health of the state-owned utilities as well as to attract private investors. While these are desirable attributes as far as the sustainability of the power sector is concerned, however, placing a heavy financial burden on the poor to the extent of leading to disconnections (e.g. in Ghana) is neither desirable nor does it contribute to a sustainable power sector.
Another key finding is that, in many countries in the region, power sector reforms appear to have marginalized local private investment in the power sector. Current trends seem to indicate that, in the medium term, the state is effectively handing over the entire electricity industry to non-national operators. In the long-term, this may be an unsustainable arrangement.
xiii
With regard to the financial sustainability of the electricity utilities, reforms appear to have largely met the objective of turning electricity utilities into profitable entities. This is important as it ensures that the resources that previously went into salvaging the utilities are utilized to meet other social and economic needs such as health, education and infrastructure. Furthermore, reforms have also provided for a more sustainable financing mechanism for rural electrification through the introduction of a levy mainly imposed on urban electricity consumers.
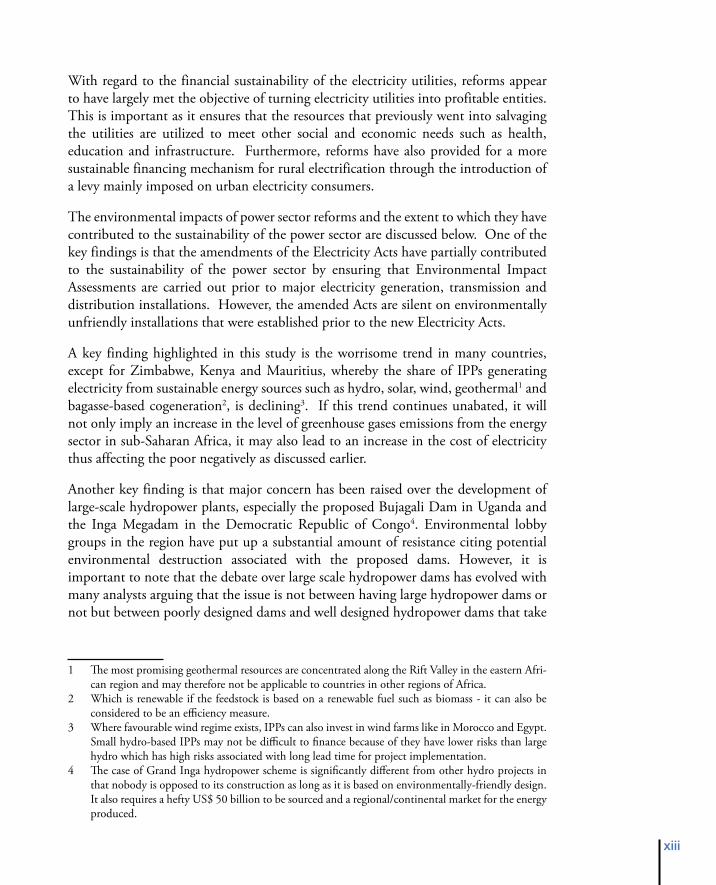
The environmental impacts of power sector reforms and the extent to which they have contributed to the sustainability of the power sector are discussed below. One of the key findings is that the amendments of the Electricity Acts have partially contributed to the sustainability of the power sector by ensuring that Environmental Impact Assessments are carried out prior to major electricity generation, transmission and distribution installations. However, the amended Acts are silent on environmentally unfriendly installations that were established prior to the new Electricity Acts.
A key finding highlighted in this study is the worrisome trend in many countries, except for Zimbabwe, Kenya and Mauritius, whereby the share of IPPs generating electricity from sustainable energy sources such as hydro, solar, wind, geothermal1 and bagasse-based cogeneration2, is declining3. If this trend continues unabated, it will not only imply an increase in the level of greenhouse gases emissions from the energy sector in sub-Saharan Africa, it may also lead to an increase in the cost of electricity thus affecting the poor negatively as discussed earlier.
Another key finding is that major concern has been raised over the development of large-scale hydropower plants, especially the proposed Bujagali Dam in Uganda and the Inga Megadam in the Democratic Republic of Congo4. Environmental lobby groups in the region have put up a substantial amount of resistance citing potential environmental destruction associated with the proposed dams. However, it is important to note that the debate over large scale hydropower dams has evolved with many analysts arguing that the issue is not between having large hydropower dams or not but between poorly designed dams and well designed hydropower dams that take
1 The most promising geothermal resources are concentrated along the Rift Valley in the eastern Afri-can region and may therefore not be applicable to countries in other regions of Africa.
2 Which is renewable if the feedstock is based on a renewable fuel such as biomass - it can also be considered to be an efficiency measure.
3 Where favourable wind regime exists, IPPs can also invest in wind farms like in Morocco and Egypt. Small hydro-based IPPs may not be difficult to finance because of they have lower risks than large hydro which has high risks associated with long lead time for project implementation.
4 The case of Grand Inga hydropower scheme is significantly different from other hydro projects in that nobody is opposed to its construction as long as it is based on environmentally-friendly design. It also requires a hefty US$ 50 billion to be sourced and a regional/continental market for the energy produced.

xiv
into account of key socio-economic and environmental concerns as outlined in the World Commission on Dams and Development.
Being in charge of regulating the newly reformed power sectors in the respective countries, the performance of the Electricity Regulatory Agencies was assessed. Preliminary findings of this assessment indicate that the regulatory agencies have done little to ensure the sector’s sustainability. In part this is attributed to the weakness of the regulatory agencies to enforce the Electricity Act as a result of two key factors: Firstly, the electricity regulatory agencies are relatively new entities and have, therefore, not built significant capacity. Secondly, in some instances, even where capacity exists, the ability of the regulatory agency to perform its duties has been compromised by its lack of the requisite independence as a result of politically motivated appointments of the members of the respective agencies’ boards.
Furthermore, the regulatory agencies have done little to promote an environmentally-sustainable power sector by reviewing electricity generation options. For example, there is no indication of regulatory agencies setting specific targets for the share of electricity generated from renewables energy technologies. In addition, with the exception of Mauritius, the regulatory framework in most of sub-Saharan African countries does not provide for attractive tariffs to sustainable energy generation options such as small-hydro, wind, bagasse-based cogeneration and geothermal.
Based on the assessments of the socio-economic and environmental impacts of power sector reforms, this study concludes that the reforms process does not provide for the adequate policy, institutional, legal and regulatory frameworks required to ensure the sustainability of power sector. To ensure the sector’s sustainability, reforms have to be redesigned to increase access to electricity among the majority poor of the region as well as increase the share of renewables in the power supply mix while encouraging more efficient use of electricity.
Having examined the extent to which reforms have contributed to the sustainability of the power sector, this study has compiled a number of recommendations. With respect to enhancing access to electricity among the poor, this study recommends:
Sequencing reforms: Sub-Saharan African countries whose reforms are not at advanced stages should ensure that they establish structures and mechanisms for increased rural electrification before (or parallel to) embarking on large-scale privatisation reforms.
Linking electrification targets to contract renewals REAs Board Members: The newly formed rural electrification agencies should have specific targets for electrifying the poor. This should be enforced through making the targets as part of the agencies’ annual reporting as well as renewal of the contracts of the board members as well as the executive employees of the agencies.

xv
Linking electrification targets to licenses renewals and tariff increments: The electricity regulatory agencies could also enforce the electrification of the poor through linking set targets to issuance of licenses and concessions to electricity distribution utilities. In addition, to ensure that the poor’s access to electricity is sustainable, the regulatory agencies should ensure that tariff increments do not adversely affect the poor by providing for subsidies as well as encouraging utilities to utilize low cost electrification options.
To ensure increased access to the poor at an affordable cost, the study recommends the use of the following low-cost electrification options:
• Longer distances between distribution transformers• Single pole transformer mounting• Shorter, smaller and fewer poles • Pre-fabricated wiring systems• Load limiters• Single Wire Earth Return (SWER) • Reduced conductor sizes• High-mast community floodlights• Equipment standardization
Another possible option of minimizing the cost of electricity among the poor is by providing subsidies to cushion them from the impacts of the high tariff increases triggered by reforms.
With regard to ensuring the environmental sustainability of the power sector, the study recommends:
Review of Electricity Acts: Electricity Acts should be amended to ensure environmentally harmful electricity generation, transmission and distribution entities that were installed prior to EIAs becoming mandatory are assessed and mitigating measures carried out.5 The electricity regulatory agencies could enforce this requirement by linking it to renewal of licenses and the review of tariffs.
Explicit targets for the share of renewables in the electricity generation mix: To mitigate the negative trend of having an excessively large share of IPPs generating electricity from fossil fuel-based power plants, it is proposed that the regulatory agencies in collaboration with the Ministries of Energy should set explicit targets for the share of electricity generation from proven renewable energy technologies such as hydro, wind, solar PV, bagasse-based cogeneration and geothermal6.
5 Existing power plants can be refurbished taking into account some cost-effective improvements in terms of environmental impacts.
6 As mentioned earlier, the most promising geothermal resources are concentrated along the Rift Val-ley in the eastern African region and may therefore not be applicable to countries in other regions of Africa.

xvi
Modular development of electricity generation facilities: In order to minimize the potential negative environmental effects of large scale electricity generation installations, power development planners in the region should consider including small to medium scale but reliable power plant that are also environmentally friendly.
With regard to addressing gaps and barriers in the legal and regulatory framework, there are several options that could ensure the power sector’s sustainability. Essentially, enforcing some of the options discussed earlier in this section could go along way in ensuring the sector’s sustainability:
Strengthening the regulatory agencies: Probably the most effective measure in addressing the gaps in the legal and regulatory framework is ensuring the independence of the regulatory agencies. This can be achieved by enhancing the representation among the board members.
Mobilizing local capital investment: The examples of Zimbabwe and Mauritius demonstrate the potential financial and technical capability and viability of local private investors in the power sector. However, appropriate policy and financial incentives such as lowering entry requirements and tax holidays should be enacted to encourage local private investment in a privatised electricity industry.
.Issuing licenses and Power Purchase Agreements (PPAs) covering a longer period: Issuing longer term licenses and PPAs can ensure that the selling price of electricity by IPPs is moderated. This is essentially because, longer term agreements allow for sufficient time for the investor to pay off project financing debts as well as provides adequate amortization period for the equipment.
Overcoming challenges of rural electrification: Perhaps the most common barrier of rural electrification identified is the high cost of grid extension. An immediate option to lower the cost of rural electrification is the use of proven low cost electrification options such as those identified in this study. Another option is the promotion of decentralized electricity generation in rural areas using hydro, wind, bagasse-based cogeneration and where applicable geothermal. This would greatly reduce the need for transmission lines to transverse long distances and sometimes difficult terrain. However, while these technical options are attractive, the policy framework has to provide adequate incentives to realize the benefits of these options.
Levelling the ‘playing field’: As mentioned earlier, electricity regulatory agencies could play a significant role in promoting proven environmentally friendly electricity generation options such as hydro, wind solar PV, bagasse-based cogeneration and geothermal. The regulatory agencies could promote these technologies through setting of specific targets as well as providing for preferential tariffs for their electricity sales. In addition, regulatory agencies could provide attractive incentives to investors willing to install electricity generation plants based on these energy sources.

xvii
This regional report is organized into 7 chapters. Chapter 1 provides the background on the study. Chapter 2 provides an overview and the status of the power sector. Chapter 3 provides the status of power sector reforms and regulatory measures. Chapter 4 provides an assessment of the socio-economic impacts of power sector reforms. Chapter 5 assesses environmental impacts of power sector reforms. Chapter 6 brings together the key findings of the study and, finally, Chapter 7 recommend possible policy options that could enhance the sustainability of the power sector.


�
Chapter 1: Introduction
1.1 Review of Past Work Done on Reforms
There is a large body of literature mainly comprising of status reports on power sector reforms undertaken by ESMAP, World Bank, Global Environment Facility (GEF), Department for International Development (DFID), Swedish International Development Co-operation Agency (SIDA), Finnish International Development Co-operation Agency (FINNIDA), Danish International Development Co-operation Agency (DANIDA) and Energy and Development Research Centre (SIDA, 1998; MFAF, 2004; DANIDA, 1991; Kjellstrom, 1994; Kjellstrom, et al, 1992; Gerger and Gullberg, 1997; Gullberg, et al, 1999). However, most of the studies undertaken by these institutions mainly cover reforms in Asia, Latin America or South Africa (Sanghvi and Barnes, 2001; Davidson and Mwakasonda, 2003; Cecelski, 2000), with an exception of a few studies undertaken by Dr. Wamukonya (Wamukonya 2003) and The African Energy Policy Research Network (AFREPREN). There is limited coverage of studies on sub-Saharan African countries.
A preliminary assessment of available global literature on power sector reforms, the World Bank and Energy Sector Management Assistance Programme (ESMAP) - considered as the key institutions behind reforms - have published extensively on the subject. However, most of the literature from these institutions mainly consists of reviews of the status of reforms in the countries region. (see Bacon, 1999; Brook, 2000; Bacon and Besant-Jones, 2001) There has also been some effort to assess the impacts of reforms on the poor but most the assessments of the World Bank and ESMAP appear to largely focus on the effects of reforms on the performance of power utilities and, to a limited extent, on electricity cost (Brook, 2000; Brook and Beasant-Jones, 2000; Foster, 2000). There is very limited assessment of the environmental impacts of power sector reforms in Sub-Saharan Africa (Wamukonya, 2003; Karekezi and Sihag, 2003; Karekezi, et al, 2003; Sarr, et al, 2003; Davidson and Mwakasonda, 2003; Edjekumhene & Dubash, 2002).
A number of recent global studies (including some sub-Saharan African countries) have attempted to examine the socio-economic impacts of power sector reforms. Initial results from these studies seem to reveal that few of these reform initiatives have resulted in significant improvement in the provision of electricity services to the poor, especially with regard to rural electrification.
Some analysts contend that, although power sector reforms have produced positive outcomes in a few sub-Saharan African countries, there is some evidence that in many countries, far from reducing energy poverty, market-oriented reforms in particular may have increased energy poverty (Wamukonya, 2003; Karekezi, et al, 2003; Sarr, et al, 2003; Davidson and Mwakasonda, 2003; Edjekumhene & Dubash, 2002). The

�
analysts argue that from the onset, the implementation of market-oriented reforms was not designed to address the electrification of the poor7, but were explicitly aimed at improving financial and technical efficiency of utilities, facilitating divestiture and guaranteeing future electricity supply in an open globalised energy market (Wamukonya, 2003; Byrne & Mun, 2003; Fall & Wamukonya, 2003; Agbemabiese, Byrne & Bouille, 2003; Lash, 2002; Bouille, Dubrovsky & Maurer, 2002; Dubash & Rajan, 2002; Edjekumhene & Dubash, 2002).
A few ongoing or recently concluded assessments of the “public benefits” (mainly socio-economic benefits) accrued from power sector reforms such as ensuring wider electricity access among the poor have mainly been undertaken by the World Resources Institute, International Energy Initiative, Department for International Development (DFID), Asian Development Bank, UNEP and the Global Network on Energy for Sustainable Development (GNESD). Although findings from these studies are not fully conclusive, they do indicate that reforms have resulted in some adverse impacts on the poor.
1.2 What Does This Study Address?
Traditionally, power utilities in Africa have enjoyed a monopolistic hold over their national electricity industry. There is growing consensus that the monopoly has contributed to the undeniable under-performance in the delivery of electricity services (Karekezi and Kimani, 2002). Power sector institutions are mainly characterised by unreliability of power supply, low capacity utilisation and availability factor, deficient maintenance, poor procurement of spare parts, and, high transmission and distribution losses among other problems. Consequently, the performance of the power sector was branded unsustainable which, in part, led to the advent of reforms in the African power sector.
Some proponents of the market-oriented power sector reforms have argued that by making utilities technically and financially efficient, power utilities would be then able to afford provision of electricity to the poor. However, when one compares the current pace of electrification with population growth rates in sub-Saharan Africa, it appears that the region will be the only region in the world whose population without electricity will increase by 20308 (see Figure 1). This is clearly a trend demonstrating that the power sector in the region is not yet a sustainable trajectory.
7 The lack of focus on the poor is demonstrated by the fact that few of the key institutions involved (Ministries of Energy, electricity utilities and regulatory agencies) keep track of the electrification of the poor.
8 The International Energy Agency (IEA) estimates that close to half of the population living in sub-Saharan Africa (about 650 million people) will have no access to electricity by 2030.

�
Figure �: World Population without Electricity
Source: IEA, World Energy Outlook, 2004
This study assesses the socio-economic and environmental impacts of power sector reforms especially on the poor and uses the results of the assessment to determine the extent to which reforms have made the power sector in sub-Saharan Africa sustainable. Furthermore, it proposes options that could enhance the sustainability of the power sector.
The study adds value to the limited but growing literature on power sector reforms in sub-Saharan Africa. While past studies have mainly assessed the status and outcomes of power sector reforms, this study adds value by assessing whether the reforms taking place are sustainable. Moreover, the study is one of the very few that have attempted to incorporate environmental concerns within the context of power sector reforms.
1.3 Methodology Used in the Study
Why focus on reforms? Over the past decade and a half, the power sectors of the respective sub-Saharan African countries have undergone major changes in institutional structure and ownership. These changes were a result of the performance of the power being deemed ‘unsustainable’ in terms of technical and financial performance; equity often
�
defined as electrification of the poor, and measured by the extent to which renewable and energy efficiency options are widely adopted. It is, therefore, appropriate to assess the extent to which reforms have made the power sector sustainable.
Key specific objectives of the study are to:
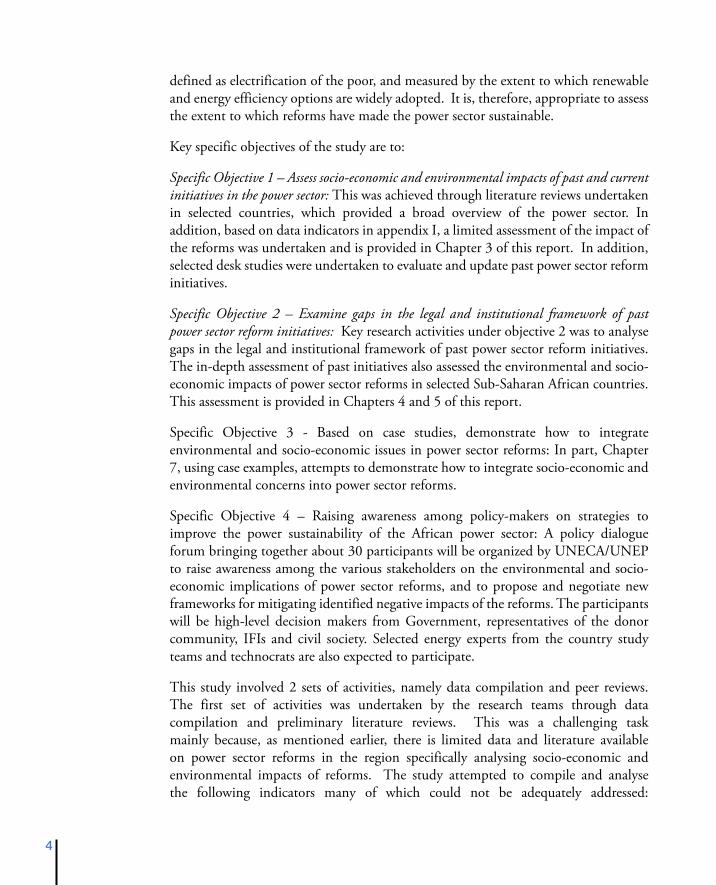
Specific Objective 1 – Assess socio-economic and environmental impacts of past and current initiatives in the power sector: This was achieved through literature reviews undertaken in selected countries, which provided a broad overview of the power sector. In addition, based on data indicators in appendix I, a limited assessment of the impact of the reforms was undertaken and is provided in Chapter 3 of this report. In addition, selected desk studies were undertaken to evaluate and update past power sector reform initiatives.
Specific Objective 2 – Examine gaps in the legal and institutional framework of past power sector reform initiatives: Key research activities under objective 2 was to analyse gaps in the legal and institutional framework of past power sector reform initiatives. The in-depth assessment of past initiatives also assessed the environmental and socio-economic impacts of power sector reforms in selected Sub-Saharan African countries. This assessment is provided in Chapters 4 and 5 of this report.
Specific Objective 3 - Based on case studies, demonstrate how to integrate environmental and socio-economic issues in power sector reforms: In part, Chapter 7, using case examples, attempts to demonstrate how to integrate socio-economic and environmental concerns into power sector reforms.
Specific Objective 4 – Raising awareness among policy-makers on strategies to improve the power sustainability of the African power sector: A policy dialogue forum bringing together about 30 participants will be organized by UNECA/UNEP to raise awareness among the various stakeholders on the environmental and socio-economic implications of power sector reforms, and to propose and negotiate new frameworks for mitigating identified negative impacts of the reforms. The participants will be high-level decision makers from Government, representatives of the donor community, IFIs and civil society. Selected energy experts from the country study teams and technocrats are also expected to participate.
This study involved 2 sets of activities, namely data compilation and peer reviews. The first set of activities was undertaken by the research teams through data compilation and preliminary literature reviews. This was a challenging task mainly because, as mentioned earlier, there is limited data and literature available on power sector reforms in the region specifically analysing socio-economic and environmental impacts of reforms. The study attempted to compile and analyse the following indicators many of which could not be adequately addressed:

�
Table �: Indicators
Category Essential Indicators Optional Indicators (which may not be available)
Economic & Social Indicators
• Electrification levels/rates (National Urban, Rural)
• Electricity access• Electricity consumption per capita• Electricity tariffs (lifeline tariff)• Sources of investments• Reported economic growth rates
• Share of local investment in sector
• Ownership of facility (shares –where possible)
• Private investment in the sector• Public investment
Technical/Managerial Indicators
• Installed capacity• Annual electricity generation• System losses• Number of customers• Number of employees• Customers per employee• Population growth rates
• % of total demand met• No. of unplanned outages• Numbers laid off• Packages for laid off workers• Other jobs created (number)
Financial • Annual revenue• Profit/loss• Tariff levels• Debt collection days• Taxes paid
• Bills collection ratio• Other financial ratios• REF collection• Amounts owed – by customer
type
Environmental • Share for RETs (including large hydro)• Share for RETs (excluding large hydro)• Share of fossil fuels• Availability of efficiency/DSM
programmes• Whether Environment Impact
Assessment (EIA) is a major requirement for new generation and transmission projects
• Is there an Environmental Act• Is power sector mentioned in the
Environmental Act• Is Environment mentioned in the
Electricity Act
• Size of displaced population• Amount of lost vegetation• Is there an electricity regulator
with the responsibility to monitor environment indicators
• Is there a dedicated power sector environmental Act or policy
• Have there been any environment-related complaints
Institutional • Extent of sector privatisation• Extent of sector unbundling• New Electricity Act• Establishment of Regulator &
responsibility• Independence of the Regulator
• Appointment procedure to the Board• Source of funding
• Staffing of regulator• Existence of Rural Electrification (RE)
agency• Role of the energy ministries• Capacity of ministries to meet roles
• Source of regulator staff (where they were working before?)
• Contractual stipulations (e.g. obligating increased access, etc)
The study covered a total of 12 out of the planned 14 sub-Saharan African countries within a period of 8 months. Country findings were incorporated into this regional report, which summarizes key findings, and, more importantly, draws emerging trends in the sub-Sahara African power sector. The regional report is organized into

�
7 chapters. Chapter 1 provides the background on the study. Chapter 2 provides an overview and the status of the power sector. Chapter 3 provides the status of power sector reforms and regulatory measures. Chapter 4 provides an assessment of the socio-economic impacts of power sector reforms. Chapter 5 assesses environmental impacts of power sector reforms. Chapter 6 brings together the key findings of the study and lessons learnt. Finally, Chapter 7 recommends possible policy strategies that could enhance the sustainability of the power sector.

�
Chapter 2: Overview of the Power Sector
The African power sector is characterized by small systems, with over three quarters of the continent’s installed capacity coming from South Africa and North Africa (Figure 2).
Figure �: Share of Installed Capacity in Africa (�00�)
South Africa
46%
Rest of
Africa
20%North Africa
34%
Source: IEA, 2005
Total electricity production for Africa in 2003 was 507 TWh (IEA, 2005). In overall terms, the bulk of the electricity produced in Africa is from thermal stations, because of the large coal plants in South Africa and oil fired generation units of Nigeria and North Africa (Figure 3). In spite of the massive exploitable hydropower capacity in Africa, its contribution to total power generation is relatively low. Hydropower contributes about 18% of the total power generation in Africa (Figure 3).

�
Figure �: Electricity Production in Africa (�00�)�
Nuclear2.52%
Hydro17.80%
Geothermal0.80%
Thermal78.88%
Source: IEA, 2005
Installed Capacity and Electricity Generation
As shown earlier in this chapter, the power systems in the countries covered in this study are relatively small ranging from about 100 MW to nearly 2,000 MW. Similarly, the amount of electricity generated is relatively small. The installed capacity in most of the countries is below 1,000 MW with only 4 countries registering an installed capacity above this figure. In fact, nearly half of the countries covered have an installed capacity below 500 MW as shown in the following graph (Figure 4).
9 Does not include cogeneration and other off-grid power generators which could total to a significant contribution to the region’s power supply. Many cogeneration plants especially in agro-processing industries are used for own consumption (used by plant/factory generating the electricity) and may not be registered in national electricity statistics. For example, in Mauritius, cogeneration accounts for 40% of the country’s power supply (Veragoo, 2003)

�
Figure �: Installed Capacity by Countries (�00�/�00�)
0 200 400 600 800 1,000 1,200 1,400 1,600 1,800 2,000
Zimbabwe
Zambia
Ghana
Kenya
Cote d'Ivoire
Cameroon
Tanzania
Senegal
Namibia
Uganda
Mali
Eritrea
Burkina Faso
Niger
Co
un
try
Total Installed Capacity
Sources: IEA 2004; World Bank 2004; Pineau 2005 a & b, Habtetsion 2005 a & b, Dube 2005 a & b, Kalumiana 2005 a & b, Nyang 2005 a & b, Diarra 2005 b, Bassirou 2005 a & b, Kayo 2005 a & b, Sarr & Sokona 2003, AFREPREN Energy Data Handbook 2004, Kahyoza 2005 a & b, Tse 2005 a & b, SOPIE 2005
2.1 Status of the Power Sector in Sub-Saharan Africa
2.1.1 Status of the Power Sector in the Eastern Africa Region
Kenya
Prior to reforms of the Kenyan power sub-sector in 199710, the sector was dominated by the de facto vertically integrated utility: Kenya Power and Lighting Company (KPLC) – started in 1983 - which owned some generation and transmission assets and the entire distribution network in Kenya. Other entities in the sub-sector that owned generation assets only or a combination of generation and transmission assets executed management contracts with KPLC for the management of these assets including the
10 The Kenya’s power sector reform was initiated following the enactment of the Electric Power Act, 1997 whereby the Act resulted in the separation of generation from transmission and distribution with public-owned generation assets invested in KenGen; and public-owned transmission assets invested in KPLC.

�0
Kenya Power Company (KPC)11 the Tana River Development Company (TRDC)12, the Tana and Athi River Development Authority (TARDA)13 and the Kerio Valley Development Authority (KVDA)14. For example, both KPC and TRDC were wholly owned by the Government, and were entirely managed and operated by KPLC while power stations from TARDA and KVDA were, however, operated and managed by KPLC under a lease agreement in which the power generated was sold in bulk to KPLC.
The Ministry of Energy had the oversight, co-ordination and management responsibility for all the sector entities in the power sub-sector including policy, regulatory, commercial transactions and the day-to-day operations of the entities. Owing to its non-commercial orientation the Ministry set the bulk and retail tariffs at sub-economic levels with a view to promote the political and welfare agenda of the Government without due regard to commercial and efficiency considerations. This plunged the power sub-sector into significant financial losses hence relied heavily on the exchequer for support.
Power sector reforms culminate in 1997 when the government amended the Electricity Act to enable the reform and restructuring of the sub-sector in order to prepare it to tackle the challenges facing it, in particular the need to attract adequate funding, especially from the private sector, for operations and development, improve financial and technical efficiency of entities involved, facilitating divestiture and guaranteeing current and future electricity supply to satisfy the increasing power demand particularly to the rural poor who form the majority of the population.
In the effort to reform and restructure the sub-sector, several reform options were implemented following the Electricity Act of 1997. Amongst the reforms carried out include a review of the legal and regulatory framework, pricing of electricity, sector management, and restructuring the industry, as well as the institutional framework.
With the implementation of reforms, KPLC is now transformed from the de facto vertically integrated structure into a single buyer (Purchasing Agency) model in which it purchases bulk power from IPPs and the public sector generation company under long term bilateral Power Purchase Agreements (PPAs). KPLC has however retained
11 KPC which was created in 1954 for transmitting power imports from Uganda through the 132 kV Jinja-Tororo-Nairobi transmission line, under the management of EAP&L (KPLC), became a separate entity responsible for public-funded power generation projects in 1997 and was then re-launched as KenGen in 1998. The company was also responsible for geothermal development at Olkaria, the operation of the Tana and Wanjii power stations on upper Tana River
12 TRDC is responsible for the development of major hydropower plants in the Seven Forks area of the Tana River.
13 TARDA was set up and mandated to develop the Masinga reservoir and power station as well as the Kiambere hydro-electric power project, both on the Tana river;
14 The authority was set up and mandated to develop the Turkwell Gorge hydroelectric power proj-ect.

��
the transmission and distribution functions all over the country as shown in the following figure (Figure 5).
Figure �: The Structure of the Electric Power Sub-Sector after Reforms and Restructuring (Ca. �00�)
KPLC TRANSMISSION
220 kV-1, 323 km; 132 kV-2, 035 km; Transmission Substations-2, 602
11 kv-66 kV = > 21,898 km; Distribution Substations-1,384
KPLC DISTRIBUTION
CUSTOMERS (594,000)
UETCL
IMPORTS
30 MW
GENERATION
43.5 MW
WESTMONTTSAVOGENERATION
74 MW
ORPOWER4GENERATION
13 MW
KENGENGENERATION (MW)
Hydro-677.3; Thermal-214.2Geothermal-115.0; Wind-0.4
IBERAFRICAGENERATION
56 MW
Source: Nyang’, 2005
Reforms also brought about separation of policy, regulatory and commercial functions. The policy formulation function was retained by the Minister for Energy, while regulatory functions were passed on to an autonomous regulator: Electricity Regulatory Board (ERB); and commercial functions in respect of generation, dispatch, transmission, distribution and supply to various commercial entities.
Generation is now liberalised thereby opening the way for Independent Power Producers (IPPs) to participate in generation with at least 174MW coming from the IPPs. Public sector generation was consolidated under a new generation company: Kenya Electricity Generation Company (KenGen), which took over all the generation assets formerly owned by KPLC, KPC, TRDC, TARDA, and KVDA comprising hydro, wind and geothermal power plants altogether 900 MW of installed capacity.

��
Prior to liberalisation all the electric power consumed was provided either by wholly state owned utilities, or utilities in which the state had a majority shareholding. Private sector participation in terms of ownership of generation facilities by Independent Power Producers (IPPs) was formalised after the new electricity law was promulgated. The IPPs were introduced into the sub-sector as a means of redressing the challenge of capacity shortfalls. The growth in supply capacity virtually came to a halt in the early 1990s while the suppressed demand continued to grow at 6-7% per annum thereby stretching the capacity of the existing system to the limit. The system was thus vulnerable to and could not withstand supply shocks and as a result performed poorly in terms of system availability and reliability.
The number of connections rose from 265,413 in 1990 to about 686,195 in 2004. In 1997 there were 426,500 connections, from which it is apparent that the number of connections had grown by about 61% from 1990. The growth in the number of connections in the period between 1997, which serves as the datum year of reform, and 2004 was 61%. Therefore growth in the connections maintained the same trend from the year 1997, which is the chosen benchmark year for the reforms.
Table �: Number of customers connected to Electricity in Kenya
Customers (KPLC)
Customers (REP)
Customers (TOTAL)
New Connections
1990 246,346 19,067 265,413
1991 262,521 24,491 287,012 21,599
1992 277,622 29,513 307,135 20,123
1993 294,520 34,561 329,081 21,946
1994 310,916 40,731 351,647 22,566
1995 326,738 43,718 370,456 18,809
1996 355,372 51,151 406,523 36,067
1997 371,258 55,242 426,500 19,977
1998 394,985 57,978 452,963 26,463
1999 411,235 61,436 472,671 19,708
2000 439,281 66,670 505,951 33,280
2001 465,361 71,718 537,079 31,128
2002 514,680 78,941 593,621 56,542
2003 556,099 87,175 643,274 49,653
2004 592,753 93,442 686,195 42,921
Source: Nyang’, 2005 Note: The year 1997, as highlighted above table and in the subsequent tables for this section, denotes the year when the Kenya’s power sector reform was initiated following the enactment of the Electric Power Act.
The growth in Rural Electrification Programme (REP) connections in the early 1990s i.e. pre-reform averaged 18.0%; however, in the period between 1997 and 2004 i.e.

��
post-reform period the growth in REP connections declined to an average of only 7.8%, despite of reforms introducing a 5% levy on all electricity sales which raised an average of about KShs. 1.2 billion annually for the REP kitty.
The per capita consumption of electricity showed a declining trend from a high of 134 kWh /capita in 1997 to 119 kWh/capita in 2003 following the institution of reform. This may be attributable to, among other factors, the general decline in economic performance in Kenya during that period and the mismatch between population growth and GDP growth. During the period under consideration Kenya experienced some of the lowest GDP growth rates including periods in which the economy shrank. The industrial and manufacturing sector, which accounts for nearly two thirds of the electricity consumption, and 25% of the GDP performed very poorly during the period under analysis. The correlation between electricity consumption and GDP growth for Kenya, whose industrial structure tends to be energy intensive, is thus fairly strong. The per capita consumption as a measure of sub-sector performance in the post-reform era paints a picture of decline and stagnation.
Table �: Per capita Electricity Consumption and GDP growth rates
Year 1994 1995 1996 1997 1998 1999 2000 2001 2002 2003 2004
Electricity Consumption KWh/capita
119.6 122.3 128.8 133.8 133.4 132.0 110.0 112.9 117.7 119.6 126.0
GDP Growth at constant prices
3.0% 4.8% 4.6% 2.4% 1.8% 1.4% 0.6% 4.4% 0.4% 2.8% 4.3%
Source: AFREPREN, 2002; AFREPREN, 2004, Nyang’, 2005
There has been an increase in the installed capacity as a result of the introduction of IPPs with Iberafrica Power Limited and Westmont Power together adding an extra 88 MW of capacity to the system in 1997 thereby providing much needed power to the capacity constrained system. In addition Iberafrica and OrPower4 Inc each added 12 MW in 2000 and Tsavo Power Ltd 74 MW in 2001. Public sector generation under KenGen added 74 MW of capacity in 1999 and a further 70 MW in 2003.

��
Table �: Installed Capacity and Annual Electricity Generation
Year 1994 1995 1996 1997 1998 1999 2000 2001 2002 2003 2004
Installed Capacity (MW)
820.8 821.7 817.9 815.0 887.1 885.6 1048.4 1173.1 1194.6 1162.6 1228.4
Annual Generation (GWh)
3732 3866 4119 4296 4516 4637 4461 4081 4564 4750 5035
AFREPREN, 2002; AFREPREN, 2004, Kinuthia, 2003, and Nyang’, 2005
There is however, low electrification levels which is attributed to stagnation in household connections. An analysis of an 11-year period between 1991 and 2002 shows that electrification nationwide only increased by approximately 2 percentage points (Table 5):
Table �: Percentage of Households connected to electricity in Kenya
1994 1995 1996 1997 1998 1999 2000 2001 2002
National 4.5 4.6 4.8 4.9 5.0 5.1 5.4 5.5 6.1
Urban 17.0 17.3 18.1 18.2 18.7 19.1 20.0 20.4 22.7
Rural 0.6 0.6 0.7 0.7 0.7 0.8 0.8 0.8 0.9
Sources: Calculations based on data from World Bank 2001, KPLC 1992, 1997, 2001/2002; Kinuthia, 2003
Uganda
The Ugandan power sector was previously dominated by a state-owned, vertically integrated Uganda Electricity Board, UEB, which has since been unbundled into three limited liability companies, namely, the Uganda Electricity Generation Company, the Uganda Electricity Transmission Company and the Uganda Electricity Distribution Company responsible for generation, transmission and distribution, respectively. In 1997, the Government of Uganda developed a Strategic Plan for transforming the Ugandan power sector into a financially viable electricity industry, in order to enable it to supply reasonably priced and reliable power. This new Strategic Plan placed special emphasis on the role of competition in promoting efficiency within the power sector and on private sector participation as a key driver for enhancing the performance of the country’s electricity industry.
The Electricity Act of 1999 that outlines the Government’s policy on electricity production makes specific provisions for rural electrification and empowers the Minister of Energy to plan and initiate strategies that promote electricity use in the rural areas. The Rural Electrification Fund recently established in line with provisions of the Electricity Act is expected to be instrumental in achieving equitable access to electricity throughout the country. The Ugandan government has been actively

��
pursuing active negotiations with various investors in effort to increase private investment levels in the sector and consequently in the access levels, Concessions for generation was awarded to Eskom Enterprises (EE) in 2002, while the concessions for distribution were given in late 2004 to Umeme Ltd (also a subsidiary of EE).
One of the aims of the reforms was to transform the sector into a profitable and financially viable industry with priority attention given to reducing system losses. Over the last five years the systems losses have averaged 34%. The bulk of the systems losses (on average over 60%) are due to technical losses resulting from the long distances between points of production and consumption and the need for network rehabilitation. As a result of the refurbishment and rehabilitation programs and the construction of new lines, the losses are expected to decline to about 10-15% by 2010.
In 1999, a new electricity legislation was enacted, providing for the liberalisation of the power sector, the introduction of new private sector electricity infrastructure providers and the privatisation of existing assets. The legislation also provided for the establishment of an autonomous authority to regulate the electricity industry and a Rural Electrification Trust Fund (RETF) to promote increased access to electricity, particularly for the poor. In 2001 the Uganda Electricity Board (UEB) is unbundled and three companies created and registered, namely: The Uganda Electricity Generation Company Ltd; The Uganda Electricity Transmission Company Ltd; and, The Uganda Electricity Distribution Company Ltd (UEDCL). Currently the electricity distribution system is managed and operated by UMEME, a distribution company in Uganda, under a 20-year concession agreement signed in May 2004 with UEDCL. UMEME is committed to invest capital to improve the network infrastructure and establish new connections (Globeleq, 2006). After the reforms, the entire institutional structure has been transformed as shown in Figure 6.

��
Figure �: Structure of the Power Sector in Uganda
ELECTRICITY REGULATORY AUTHORITY (ERA)
Generation
UgandaElectricity
DistributionCompany
- Uganda Electricity Transmission Company
- Transmission operator- System operator- Single buyer- Export/Import
Transmission Distribution
Distribution &Supply Concession
Current StructurePlayers
Current Players
Future Players
Future Structure Players
Customer
- Uganda Electricity Generation Company (Nalubaale & Kira Stations-Concessioning- AES Bujagali IPP- Eskom enterprises
27
Household electricity consumption was on the declined at all levels (national, urban and rural) until around the year 2000 when the trend picked up an upward turn. The utility’s inefficiency is partly to blame for the deterioration in consumption levels. Between 1997 and 2002, the electricity losses have been about 34% on average – almost 3 times the nominal target for utilities in developing countries. However, the introduction of a new management team to the UEB has led to a UShs 4 billion profit and an increase of 20% in debt collection (Bidasala, 2001) in less than 2 years, which has also considerably reduced the debt collection days. The total electricity sales in Uganda have been on the upward trend almost doubling to 1038GWh in 2003 from 522GWh in 1995. The following table (Table 6) shows the trends in the performance of the Uganda power sector. The table provides the trends of power sector performance in Uganda.

��
Table �: Trends of Power Sector Performance in Uganda
Year 1996 1997 1998 1999 2000 2001 2002 2003
Electricity consumptionPer capita (kWh)
35 34 34 32 38 40 42 44
Electricity installed capacity: Total (MW)
183.2 182.3 183.3 183.4 263.0 275.5 315.5 315.5
Hydro (MW) 181.3 180.3 181.3 181.3 261.0 261.0 301.0 301.0
Electricity generation: Total (GWh)
1,130.5 1,248.2 1,233.2 1,341.7 1,540.3 1,577.8 1,711.6 1,759.7
Hydro (GWh) 1,129.0 1,247.0 1,232.0 1,340.5 1,539.1 1,576.6 1,710.4 1,758.5
Electricity sales: Total (GWh)
677 701 706 702 843 922 877 1,038
Utility Data
Number of utility employees
3,283 2,993 2,028 2,025 1,903 1,346 1,325 1,429
Number of utility customers
123,049 142,327 159,205 164,225 180,234 200,217 224,863 244,245
Number of customers per employee
37 48 79 81 95 149 170 171
Electricity generation/employee (MWh/employee)
344 417 608 663 809 1,172 1,292 1,231
System losses (%) 31 33 34 40 34 34 37 28
Debt collection period (days)
330 259 322 363 369 281 224 194
Sources: Okumu, 2003; Opio, 2005, Kasangaki, 2005
Note: The year 1997, as highlighted denotes the year when the Uganda’s power sector reform was initiated following the enactment of the Electric Power Act.
Tanzania
The Ministry of Energy and Minerals (MEM) is in charge of the Minerals, Power and Petroleum development in the Tanzania. Three parastatals exist under this ministry, namely, State Mining Corporation (STAMICO) – responsible for mineral exploration and production activities, Tanzania Petroleum Development Corporation (TPDC) – currently responsible for exploration and production of petroleum products, and Tanzania Electric Supply Company Limited (TANESCO) – responsible for generation, transmission, distribution and sale of electricity. All of these were by law monopolies in their respective sectors. To date the monopoly has been abolished and private players have joined the sector, especially in the most attractive areas like mining and distribution of petroleum products. The role of the Ministry spans from policy formulation to regulation and control, including (a) overseeing activities of the utility, (b) appointing board members, (c) defining social policies, and (d) issuing licenses to IPPs and IPDs. The private sector, of course co-existed, but with generation for own use.

��
TANESCO, the only power utility in Tanzania, is wholly owned by the State, was established under the Company Ordinance Act of 1931 in 1964 after nationalization of the power supply industry by then under two private electricity distribution companies. It has been operating since then as a vertically integrated public utility responsible for generation, transmission, distribution and commercial services of electricity in the country. Following the 1992 policy change to abandon monopoly by TANESCO, IPPs have joined the generation segment of the sector and sell electricity to TANESCO through the Power Purchase Agreements.
Figure �: Structure of the Power sector in Tanzania
Imports- Zambia- Uganda
Own Generators
Vertically Integrated Power Company
Transmission
Distribution
CustomersBulk Supply- Zanzibar
IPPs- Songas- IPTL
Source: Norbert, 2005
The reform process in Tanzania was driven by the need to create enabling environment for an efficient and sustainable power sector. Amongst the reform efforts by the government include:
• Passing a declaration on policy change to abandon monopoly (1992) which provided for an individual, a cooperative or any private agency to engage in generation, distribution and selling of electricity to consumers (Kahyoza, 1994).
• Enactment of an Electricity Law (2004)-still in a draft form- which is to facilitate the development and promotion of, and increased private sector participation, in the expansion of electricity services;
• To promote enhanced efficiency in and to maintain the safe operation of the electricity sector;
• To facilitate the reorganization and restructuring of and to provide for a framework for the effective regulation of the electricity sector; and
• To provide for related matters.

��
In April 2000, the Government created an independent multi-sectoral regulatory agency, Energy and Water Regulatory Authority (EWURA) to regulate the energy and water utilities. In October 1999 the Government of Tanzania approved a new electricity industry policy and restructuring framework with the aim of unbundling the generation, transmission and distribution of electricity.
Following the policy change two independent power producers (IPPs) have been licensed, namely, Independent Power Tanzania Limited (IPTL)15 and Songas Limited. The former has constructed and operates a 100MW diesel-fired power plant near Dar es Salaam, while the latter has developed and operates the natural gas infrastructure with a throughput of 70 million standard cubic feet per day, generating 180MW and supplying 8 industrial customers in Dar es Salaam. There is also another IPP - Tanzania Wattle Company (TANWAT)-supplying electricity from a wood-wasted fired cogeneration power plant Njombe. TANWAT supplies 2.5MW to the mini-grid in Njombe.
It is estimated that about 39% of the urban population has access to electricity, and only about 2% of the rural population (ESMAP, 2005; HBS, 2000) do access electricity in Tanzania. Information from TANESCO indicates that normally TANESCO connects 20,000 to 30,000 customers per year. The Management Contractor has an ambitious plan to connect up to 100,000 customers per year (TANESCO, 2004). However, a much more aggressive connection strategy may be required to cope with the current population growth.
With the commissioning of the IPTL plant in 1999, and subsequent switching to the gas generation of the Ubungo turbines, per capita consumption of electricity picked up a steady increase to above 90 kWh in 2004. The number of customers in Tanzania has increased from about 221,000 in 1992 to 550,000 in 2004, an average of about 27,800 new connections per annum. The corresponding electricity access has increased from 5.1% in 1992 to 9.0% in 2004. The following table (Table 7) provides data on the performance of the Tanzanian power sector.
15 Establishment of the IPP gives an interesting case for the sector in the region. There have been dis-putes between the developer and the Government of Tanzania over the capital investment involved and the tariff which should have been agreed upon in the power purchase agreement (PPA) before the project commenced. This was resolved at the International Centre for the Settlement of Invest-ment Disputes (ICSID).

�0
Eritrea
The Eritrea Electric Corporation (EEC) is a public vertically integrated utility that operates two systems, namely the Interconnected System (ICS) that covers 89% of its electricity business and the Self contained Systems (SCS) accounting for the 11%. The total firm generating capacity of electricity at present is over 155 MW of which the national utility, the EEC, accounts for around 134 MW while the remaining comes from either public institutions like Assab Petroleum Refinery, Assab Port Administration, small municipalities in remoter towns, or private entrepreneurs with smaller gensets. There was an increase of about 5,500 of new customers every year between 1993 and 1997, but slowed down substantially in 1998-2000, indicating a low connection rate as a result of the war between Eritrea and Ethiopia during those years; this has improved significantly since 2001. The EEC firm capacity that stood at around 26 MW in 1991 was more than doubled by 1996, but showed little
Year 1997 1998 1999 2000 2001 2002 2003 2004Electrification Levels (%): National 7.2 7.3 7.5 8.0 8.1 8.4 8.8 9.0
Annual electricity generation (GWh)- (incl. Imports)
1954 2186 2356 2522 2782 2892 3179 3393
Electricity consumption per capita (kWh) 65.4 71.2 74.6 77.7 83.4 83.6 89.4 92.8
Total Installed Capacity (MW) 663.3 591.3 691.3 871.3 871.3 871.3 871.3 911.3
Hydro (%) 57.4 64.4 55.1 64.4 64.4 64.4 64.4 61.6
System Losses (%) 13.3 21.1 25.8 26.3 26.8 24.1 26.8 24.8
Total Electricity demand (GWh) 1,954 2,186 2,356 2,522 2,782 2,892 3,179 3,393
% of electricity demand met by supply 99.8 99.8 99.8 99.8 99.0 98.8 98.7 98.6
Number of employees 7,269 7,107 7,223 6,916 6,540 6,433 4,991 4,857
New jobs created -300 -162 116 -307 -376 -107 -1,442 -134
Number of customers 359,790 371,233 393,440 431,722 450,947 485,995 523,000 550,863
Customers per employee 49 52 54 62 69 76 105 113
Economic growth rate (%) 2.4% 1.9% 4.1% 3.4% 5.4% 3.0% 0.6% 6.5%
Population growth rate (%) 2.8 2.8 2.8 2.8 3.7 2.8 2.8
Annual revenue (M.US$) 171.0 177.0 170.0 164.0 159.0 153.0 168.8 181.0
Profit/Loss (M.US$) (5.0) (21.4) - (77.4) 9.0 (90.7) (180.8) (60.9)
Tariff Cost: (USc/kWh) 40 28 0 0 4 5 6 8
Debt collection days 315 336 413 337 208 179 0 0
Share of RETs of total electricity supply (including large hydro) (%)
57.4 64.4 55.1 64.4 64.4 64.4 64.4 61.6
Share of RETs of total electricity supply (excluding large hydro) (%)
1.3 1.5 1.3 1.0 1.0 1.0 1.0 1.0
Share of fossil fuels of total electricity supply -%
25% 5% 8% 15% 7% 6% 20% 39%
Table �: Trends of the Power Sector Performance in Tanzania
Source: AFREPREN, 2002; AFREPREN, 2004; Mbise, 2005
Note: The year 2000, highlighted in the table above denotes the year when the Government created an independent multi-sectoral regulatory agency, Energy and Water Regulatory Authority (EWURA) to regulate the energy and water utilities.

��
change in the years that followed. With the commissioning of the Hirgigo Power and Transmission Expansion Project in 2003, the EEC firm capacity has increased by 84 MW, bringing the total firm capacity of EEC to 134 MW.
Besides the national effort to develop conventional power generation and supply systems, due attention has been given to the introduction and development of renewable energy technologies. Although in the future the prospect could be good, the contribution of non-biomass renewable energy resources has so far been negligible in the national energy balance. In summary, the followings are the major achievements of the power sector since the Liberation of the country in 1991.
• Power generation has increased from < 30 MW in 1991 to around 134 MW by 2005 and per-capita electricity consumption increased from as low as 16 kWh to over 60 kWh at present;
• The length of transmission lines has increased from <150 km to over 350 km;
• The length of distribution lines has increased from 800 km to over 1300 km;
• Rehabilitation of power distribution system initiated in Asmara and completed in Massawa;
• Wind and solar resources assessment from 25 meteorological stations is underway;
• Over 2000 solar PV systems installed with an aggregate capacity of over 600 kW
• Pilot wind energy applications project is being implemented;• Dissemination of improved stove is in progress with 29,000 installed by
2004• Energy Laws, Regulations and Standards have been enacted.
Although it is expected that the Eritrea Electric Corporation will continue to provide generation, transmission and distribution of electricity in the medium term, the Government’s vision is for Independent Power Producers (IPPs) and Distributors (IPDs) to penetrate the generation and distribution systems. The transmission system will remain under public ownership with one system operator (SO). The Government has promulgated in May 2004 two Proclamations as the first steps towards reforming the power sector16. Electricity Proclamation No. 141/2004 has the objective of promoting efficiency, safety, environmental protection and private sector involvement in the power sector. Proclamation No. 142/2004 for the Establishment of the Eritrea Electric Corporation (EEC) has the purpose of commercialising the public utility to give it more autonomy in its operations and to contribute to the socio-economic development of Eritrea by providing efficient, dependable, cost-effective
16 Eritrea is an example of a country that has not put in place the institutional, legal and regulatory framework required to initiate its power sector reform and may therefore face difficulties similar to those encountered by Tanzania with IPTL with regard to entry of IPPs

��
and environmentally safe production, transmission and distribution of electricity to the public.
Eritrea is also embarking on an extensive rural electrification programme of which between 1999 and 2001, around 14,100 households in 27 villages and 4 towns benefited from electrification, which was partially financed by SIDA.
The steady growth of the power supply and per-capita consumption that has been witnessed in the last nine years is a manifestation of the post-liberation development trend in Eritrea. The reliability of EEC’s electricity supply is excellent compared with the institutional or private gensets erected in the rural areas of Eritrea. For instance, during 2003 the frequency of power interruptions was 42 with cumulative duration being only 9 hrs out of 8760 hours in a year. EEC’s financial performance has weakened largely because of oil price increases despite capital restructuring. The Government and EEC began to carry out the EEC’s capital restructuring in FY 2004 to reflect the actual level of assets employed to meet its business demand. In total the Government declared 800 Million Nakfa (53.3 Million USD) as equity capital for EEC, which was otherwise, a debt burden for EEC. The restructuring improved EEC’s financial position as expected. The following table (Table 8) provides the trends in the financial performance of the Eritrean power sector.

��
Table �: Trends of the Financial Performance of the Power Sector in Eritrea
Financial 1998 1999 2000 2001 2002 2003 2004
Annual revenue (US$ Millions) 19.73 18.33 18.48 22.44 28.4
Profit/Loss (US$ Millions) -1.086
Tariff Cost (Average): * US$ (cents)/kWh 8.6 8.52 11.21 8.51 8.31 11.3 11.7
Debt collection days (accounts Receivable in days) 109 51 77 50 67 89 108
Share of RETs of total electricity supply (including large hydro) - % 1.00 1.00 1.00 1.00 0.60 0.60 0.70
Share of RETs of total electricity supply (excluding large hydro)- % 1.00 1.00 1.00 1.00 0.60 0.60 0.70
Share of fossil fuels of total electricity supply - % 99 99 99 99 99.4 99.4 99.3
Source: AFREPREN, 2002, AFREPREN, 2004, Habtetsion, 2005b, Habtetsion, 2005a
Note: The year 2001, highlighted in the table above and the subsequent tables for Eritrea, denotes the year when the country started experiencing high electrification rate.
The following table (Table 9) provides the trends in the power sector performance in Eritrean
Table �: Trends of the Power Sector Performance in Eritrea
Year 1998 1999 2000 2001 2002 2003 2004
Electrification Levels (%): (National)
26.5 27.8 29.2 30.7 32.2 33.8 34.1
Annual electricity generation (GWh)
186.03 204.61 201.43 224.44 249.10 264.06 273.00
Electricity consumption per capita (kWh)
46.8 48 47.2 59 60 62.5 58
Total Installed Capacity 92 92 127.77 129.03 173.9 176.03
Total (%) 92 92 127.77 129.03 173.9 176.03
Hydro (%) 0 0 0 0 0 0 0
Thermal (%) 99 99 99 99.4 99.4 99.3
Others (%) 1.00 1.00 1.00 0.60 0.60 0.70
System Losses (%) 20.57 18.65 19.2
Number of employees 756 940 881 782 803 771 1031
Number of customers 94,380 96,003 96,186 102,424 103,169 109,351 113,103
Customers per employee 125 102 109 131 128 142 110
Staff costs as a percentage of revenue
10% 11.6% 10.70% 8.2% 7.4% 6.0% 8.00%
Economic growth rate (%) 4 0.8 -8.2 1.1 -1.2 NA NA
Population (Millions) 3.1 3.2 3.3 3.4 3.5 3.6 3.71
Source: AFREPREN, 2002, AFREPREN, 2004, Habtetsion, 2005b, Habtetsion, 2005a

��
2.1.2 Status of the Power Sector in the Southern Africa Region
Zimbabwe
Prior to the amalgamation process that took place in 1985, the power sector in Zimbabwe was vertically integrated and connected with the Zambian power system. The Central African Power Corporation (CAPCO) produced hydro electricity on behalf of the two countries. The Electricity Supply Commission (ESC) was the body responsible for the transmission of electricity in Zimbabwe and the municipalities were responsible for distribution in the major cities.
The Zimbabwe Electricity Supply Authority (ZESA) was established through the Electricity Act of 1985 as a vertically integrated monopoly responsible for generation, transmission and distribution. In October 1996 the Zimbabwe Power Company (ZPC) was formed as a wholly owned subsidiary of ZESA. Its major function was to enter into new generation projects or to act as an investment vehicle on generation projects on behalf of ZESA.
Since 1985 power sector reforms have been going on and the major driver has been the desire by Government to see the sector playing a key role as a catalyst to the economic growth of the economy. The Electricity White Paper (1999) formed a blue print of the reforms that have taken place in the Zimbabwean power sector. The White Paper envisaged that reforms in the power sector would be done in stages. A new regulatory environment was ushered and governed by three Acts of Parliament. The Commercialisation Act of 2001 empowered the responsible Minister to form successor companies to ZESA. The Rural Electrification Act 2001 enabled the establishment of the stand-alone Rural Electrification Agency responsible for the rural electrification expansion.

��
Figure �: The current structure of the Zimbabwean power sector
Ministry of Energy and Power Development
Rural ElectrificationAgency
ZESA Holdings (Pvt) Ltd
ZPC
ZPC
ZETC
ZETCO ZEDC
ZESA Enterprises
POWERTELCommunications
REGULATION OF THE POWER SECTOR
ZIMBABWE ELECTRICITY REGULATORYCOMMISSION
The Zimbabwe Electricity Regulatory Commission (ZERC) established in 2002, is at the centre of the electricity supply industry. It is responsible for licensing all the key players and building a competitive business environment, which allows the entry of private sector players.
In 2000 Zimbabwe was ranked second in terms of average national electrification in East and Southern Africa. In terms of regional performance it can be recognised that Zimbabwe and South Africa are doing well but in terms of total electrification of the country, however, a lot still needs to be done to make electricity accessible to the majority of the rural people.
ZESA’s general performance in early 1990s was constrained by operational inefficiencies as the utility sought to streamline its operations. The severe drought also worsened the situation. There was however, marked improvement in performance from 1995 following the programmes, which were put in place to improve technical and financial performance. It can be seen from the Table 10 that there has been a general reduction in the debt collection days. The electrification of rural areas increased steadily but the

��
rate of increase was slow with 60% of the population having no access to electricity. Table 10 below shows performance indicators, which show the general trend of the performance the power sector.
Zambia
The Zambian power sector has three main participants namely ZESCO, CEC and LHPC. ZESCO Limited is the largest utility with a 100% state ownership involved in generation, transmission and distribution of electricity. Its main generation stations are Kafue Gorge (900 MW), Kariba North Bank (600 MW) and Victoria Falls (108 MW). The utility also owns several small hydro stations (23.75 MW) as well as several isolated diesel stations (10.3 MW). The Copperbelt Energy Company (CEC) is a private transmission company that supplies power to the Zambian copper mines. The company procures bulk power from ZESCO for distribution to the mines. It also has hydro and thermal power plants of a combined generation capacity of 80 MW. CEC owns 220kV transmission lines from Kitwe to Luano on the Copperbelt Province.
Year 1996 1997 1998 1999 2000 2001 2002 2003 2004
Installed Capacity (MW)
1,961 1,961 1,961 1,961 1,961 1,961 2,045 2,045 2,045
Hydro (%) 666 666 666 666 666 666 666 666
Electricity Generation (GWh)
10,495 11,311 11,891 12,363 12,090 11,972
System Losses (%) 11 10.8 10.4 12.8 13.3 14.6
National Electrification Rate (%)
34 35 36 39 39 40
Electricity Consumption per capita
839 791 774 827 874 831 828 798
Number of employees
7,655 7,462 7,273
Number of customers 387,593 410,432 437,523 473,586 499,117 517,180 540,051 566,000 566,000
Customers per employee
32.94 25.29 20.77 21.98 30.74 33.41 21.51
Economic growth rate (%) (at factor cost)
9.7 0.2 -1.2 -2.1 -5.4 -3.4 -4.8
Population growth rate (%)
2.1 2.7 1.7 1.7 1.7 1.7
Annual revenue (US$ Million)
303.5 331.7 260.3 230.9 428.3 521.1 349.8 178.4 176.3
Debt collection days 56 32 25 32 33 39 52 52 56
Table �0: Trends in the performance of the Zimbabwean power sector
Source: AFREPREN/FWD 2004; Mangwengwende, 2005
Note: The year 1999, as highlighted in the table denotes the year when The Electricity White Paper (1999) the formed the blue print of the Zimbabwean power sector was passed.
��
The CEC transmission network forms the 220kV interconnection between Zambia and the Democratic Republic of Congo. CEC also owns some 66kV lines running to various mining areas within the Copperbelt although these are mainly treated as a distribution network to the mines. The Lunsenfwa Hydro Power Company (LHPC), a recently private generation company that sells its power to ZESCO Limited. It runs two small power stations with a total installed capacity of 38 MW on the Mulungushi River in Central Zambia.
ZESCO’s National Control Centre (NCC) is responsible for system operation of the national grid. Apart from the National Control Centre, ZESCO also operates Regional Control Centres in the various regions of the country. CEC has its own control centre for transmission and distribution of power to the mines.
With the adoption of an energy policy in 1994, the Zambian energy sector has undergone a series of reforms. The most significant of these have been the following:
• Established the Energy Regulatory Board (ERB) through the Energy Regulation Act No. 16 of 1995;
• Repeal of the Electricity Act that abolished the monopoly of ZESCO as power sector participant hence opening the way for other players in the sector, and
• Establishment of an Office for Promoting Private Power Investment in generation and transmission projects.
During this time, the Government has been undertaking an economic restructuring programme supported by the World Bank and International Monetary Fund. One of the conditions for external support to the Zambian economy has been the need for the Government to shed its shareholding in most sectors of the economy. Prior to 2002, the national electricity utility, ZESCO, had not been performing well. In 1998, for example, the company recorded an operating loss of K78 billion (US$17 million). The debtor days increased from 182 days in 1998 to 409 days in 2001. As part of the reform process, the national utility, ZESCO has also made strides in its commercialisation programme. One of the noticeable improvements has increases revenue collection and reduction of losses.
The Zambian power sector is an integral part of the Southern African Power. SAPP is characterized by heavy reliance on hydropower in the north and on thermal power (coal generated) in the south. Like for all SAPP countries, Zambia’s maximum demand patterns have been growing over the years (see Table 11).
The growth in the demand corresponds to the growth in Zambia’s Growth Domestic Product (GDP) which, over the years, has been doubled from 2.4% in 1999 to about 5% in 2004.

��
Table ��: Trends in the performance of the Zambian power sector
Year 1995 1996 1997 1998 1999 2000 2001 2002 2003/04
Electricity consumption per capita (MWh)
0.73 0.71 0.66 0.61 0.61 0.62 0.58 0.57
Electrification levels: National
18 18 18 19 20 20 20 20 20
Installed Capacity (Total) (MW)
1,786 1,786 1,786 1,786 1,786 1,786 1,786 1,786 1,748
Hydro capacity (%) 99.5 99.5 99.5 99.5 99.5 99.5 99.5 99.5 99.5
Annual electricity generation (GWh)
7924 7149 7941 7 604 7764 8 168 9 059 8 044 8 180
System losses 2.83% 1.93% 2.06% 2.24% 2.90% 5.20% 3.94% 2.78% 2.30%
Number of customers
165,860 170,694 188,434 200,248 242,240 293,071 277,724 303,995
Population growth rates
2.30% 2.30% 2.30% 2.30% 2.30% 2.30% 3.00% 3.00% 3.00%
Source: AFREPREN, 2002; AFREPREN, 2004; ERB, 2005
Note: Although the Energy Regulatory Act No. 6 was enacted in 1995, the significant reform period to be considered in table 11 is from 1998 when ZESCO recorded losses.

��
Namibia
NamPower - Namibia’s main power utility-is the only utility in Namibia that is engaged in generation and transmission services. It sources its power from a hydro power plant, thermal power plants, diesel generators and imports from neighbouring countries through bilateral agreements, and short-term energy markets in the Southern African Power Pool. NamPower also sells power to other entities such as municipalities, large customers (Namdeb) and newly created regional distribution companies as seen in the following figure (Figure 9).
Figure �: Structure of the Power Sector in Namibia��
Nampower
Generation
Transmission
Distribution
Customers
Nored
Erongo RED
Nam deb
Energy from Southern Africa Power Pool (SAPP) - Eskom
Bilateral Agreements (Angola, Zambia, Zimbabwe, RSA)
SAPP Short Term Energy Market(STEM) - Zambia, Zimbabwe, RSA
Ministry of Regional and LocalGovernment and Housing(MRLGH)
21 Municipalities and towns
In Namibia, municipal electricity departments largely undertake distribution of electricity in their respective proclaimed towns, which is a law under the Local
17 (i) Need to add Botswana to Bilateral Agreement Box, and draw arrows on both sides of the line to NamPower because in many cases Namibia also supplies to these countries’; (ii) Customers in Namibia do not buy directly from the SAPP Short-Term Energy Market (STEM), consequently, the line should be deleted; and (iii) there is need to add CENORED among the regional electricity distributors (REDs) by drawing a rectangle under Erongo RED.
�0
Authorities Act (Act No. 23 of 1992). Distribution to rural areas of Namibia is the responsibility of the Ministry of Regional, Local Government and Housing (MRLGH). The distribution networks within towns, villages and rural settlements are owned by MRLGH on behalf of local authorities (except Oshakati, which is fully responsible for service within its jurisdiction).
The Ministry of Mines and Energy facilitates and regulates the development and sustainable utilisation of energy and mineral resources. The Electricity Control Board established in 2000 has the objective of exercising control over the electricity supply industry and regulating the generation, transmission, distribution, use, import and export of electricity.
The reforms in Namibia started in earnest with the adoption of the 1998’s White Paper on Energy Policy which required the Government to provide access to electricity to 25% of the rural population and 95% of the urban population by the year 2010 (White Paper on Energy Policy, 1998) up from the current electrification levels of 15% in the rural areas and 80% in urban areas (Manyame, 2005). The policy promotes the participation of the private investors and entrepreneurs in the distribution and supply of electricity and it recommended IPPs on the supply side.
Namibia adopted the Single Buyer Model on the recommendation by a study carried out by SADELEC, which led to the transformation of NamPower into generation and transmission only company. The adoption of the single buyer model further liberalised the generation of electricity thereby opening the way for Independent Power Producers (IPPs) from whom NamPower now sources its supplies in addition to its own generation plants and imports.
Distribution of electricity is now left for the REDs (Regional Distribution Companies), which are the new entrants in the electricity distribution sector in Namibia. REDs are a result of a White Paper, which, amongst others, provides for the reorganization of the electricity distribution industry as a means of improving service delivery and efficiency in the electricity sector. A RED is a legal entity, which is tasked with the supply and distribution of electricity in a dedicated region, combining the electricity distribution departments of the Local Authorities, Regional Councils and NamPower.
The electrical energy consumption in Namibia has grown steadily over years, rising from 1,963 GWh in 1996 to 2,943 GWh in 2004. The average annual growth rate for the period 1992 to 2002 was 2.9%. However, with a stagnated installed capacity, an average system peak demand of 340 MW and demand increasing at the rate of 5% per annum, it is apparent that there is a serious power deficit in Namibia resulting in over reliance on imports.
Namibia dramatically reduced system losses from 14% in 1998 to the current 8%. This has been achieved through intensive investments in the infrastructure coupled

��
with efficient revenue collection and billing systems. The bulk of the energy in Namibia is consumed by municipalities and the mining sector. However, there was an incredible 185% increase in electrical energy consumption in rural areas for the years between 1988 and 2001 compared to 13% in municipalities and 6% in mining which is attributed to the government’s emphasis on rural electrification. The following table (Table 12) shows the trends in the performance of the Namibian power sector
Table ��: Trends of the power sector performance in Namibia
Year 1995 1996 1997 1998 1999 2000 2001 2002 2003 2004
Annual electricity generation (GWh) (local generation)
1004 1198 1407 1211 1429 1421 1329
Electricity consumption per capita (kWh) based on energy sales
1279 1067 1050 1093 945 1050 1060 1104 1122 1373
Total Installed Capacity (MW) 396 396 396 396 396 396 396 396 396 396
Hydro (%) 62.9 62.9 62.9 62.9 62.9 62.9 62.9 62.9 62.9 62.9
System Losses (%) 13.89 10.65 9.96 9.97 9.91 8.82 5.09
Total Electricity demand (GWh) 1963.3 1904 2085 2192 2277 2371 2466 2945
Number of employees 831 827 789 831 816 818 1566
Number of customers (main Utility) 2541 2374 2219 2723 2894 3265 3261
Customers per employee (main utility)
3.1 2.9 2.8 3.3 3.5 4.0 2.1
Economic growth rate (%) 4.1 3.2 4.5 3.3 3.4 3.5 2.4 3.3 3.7
Population growth rate (%) 2.98 3.02 2.99 3.02 3.00 2.74 2.74 2.10 1.50 1.50
Annual revenue (US$’000) (main utility)
96,324
87,058 77,958 67,528 46,296 66,145 79,874
Profit/Loss (US$’000) (main utility) after taxation
31,610 19,258 19,652 13,391 11,370 9,027
Exchange Rate N$/US$ 5.4855 6.1125 6.8259 7.8802 11.4943 8.0451 6.6622
Tariff Cost: US$ 1.47 2.96 2.77 2.62 1.92 3.25 3.97
Share of RETs of total electricity supply (including large hydro)
100 99.58 99.86 99.13
Share of fossil fuels of total electricity supply
0 0.42 0.14 0.87
Source: AFREPREN, 2002; AFREPREN, 2005; Dube, 2005a; Dube, 2005b
Note: The reform period considered is limited to 1998-2004, as the White Paper on Energy Policy was adopted in 1998

��
2.1.3 Status of the Power Sector in the Western Africa Region
Ghana
The Ghana Power sector is dominated by the Volta River Authority (VRA). VRA is a state-owned entity established in 1961 under the Volta River Development Act (Act 46). It is responsible for generation and transmission of electricity in Ghana. Another electricity utility, the Electricity Company of Ghana (ECG) is a state-owned entity responsible for distribution of electricity to consumers in southern Ghana. VRA performed well technically and financially, but ECG did not, with high system losses (>20%) and poor service quality (Williams and Ghanadan, 2005). There is also the Northern Electrification Department (NED) established in 1997, a subsidiary of VRA responsible for power distribution in northern Ghana. VRA therefore supplies ECG, Aluworks, AGC, Akotex, CEB, VALCO, VRA-NED, and some other mines with electricity for distribution (Abavana and Yankah, 2005).
The Public Utilities Regulatory Commission (PURC) was established in 1997 to oversee the performance of the public utilities and is mandated to protect the interest of consumers (this has led to a certain difficulty in the case of increasing electricity tariffs, where PURC has had to deny utility companies their requested increases in the interest of consumers’ ability to pay), and to examine and approve the rates chargeable by the utilities. The Energy Commission was also established in 1997 as an independent agency, with a mandate to license private and public entities that will operate in the electricity sector. The EC is the advisor to the government and is responsible for granting licenses to all power sector operators and controlling conduct of licensees through enforcement of electricity regulations, rules of practice, and standards of performance (Abavana and Yankah, 2005). The Energy Foundation (EF) was established in 1997 to promote sustainable development and efficient consumption of energy in Ghana. Ghana’s electricity sector also has IPPs comprising of a mix of domestic or international entities that sell their electricity to VRA or ECG. Currently there is only one major IPP, the Takoradi International Company (TICO) which owns a 220 MW thermal plant. It comprises 12.4% of total installed capacity The Ministry of Energy has the overall mandate of policy formulation and monitoring of the sector (Tse, 2005a,b).
Energy Commission (EC) Act 541 1997 defined new structure for power market through the (EC) Act 541 1997 which defined new structure for power market allowing for private sector investment in power generation and created “open access” transmission (EC) systems to provide non-discriminatory transmission services and enhance competition.

��
Figure �0: Structure of Power Sector in Ghana
Volta River Authority(Generation, Transmission
& Distribution (NED))
Electricity Company of Ghana Limited
(Distribution)
Bulk Supply CustomersTICO IMPORTS
EXPORTS
Technical RegulatorEnergy Commission(Licensing, Technical
Standards)
Ministry of Energy(Policy Formulation &
Monitoring)
Economic RegulatorPublic Utilities Regulatory
Commission(Rate Setting, Quality of Service
Monitoring and Enforcement)
The Ghana Power sector reforms were started in 1997 when the World Bank, in a policy shift, indicated that support would no longer be provided for electricity projects in developing countries unless there was a clear commitment by the Government in reforming the sector. The reforms were undertaken primarily to secure an IDA credit for the construction of the 330MW Aboadze plant, but there was also a view to secure private participation in the development of future electricity infrastructure. Broadly the reforms were aimed at responding to decline in traditional sources of concessionary funding for power sector, preparing grounds for private sector investment and participation in power infrastructure, facilitating more transparency in sector regulation, removing monopolistic system and improving utility services and management accountability
The establishment of the two bodies, EC and PURC are the most prominent development in the power sector reforms. The Government of Ghana gave-in to the reform conditionality and demonstrated its commitment to reforming the sector by establishing a Power Sector Reform Committee (PSRC) in 1994 to work out the modalities, milestones, and timetables for the reform process. By 2003, the ECA reviewed the progress in power sector reforms in Ghana and submitted the following findings:

��
Table ��: Progress of power sector reforms in Ghana
1997 Reform Proposal Status as of 2003
Create 5 distribution concessions (DistCos), privatise Not done
Large consumers. Rationalise and establish basis for bilateral contracts with IPPs
No progress; Energy Commission is considering new definitions for eligible consumers
VRA – unbundling into 4 main activities Almost no progress. VRA has started some work on separating accounts
ECG set up a holding company for 5 DistCos Not done
Establish separated activities as business units Not done
Put in place performance contracts for ECG and VRA Not done
Establish regulators and regulatory framework 2 regulators established with 2 Acts (Energy Commission and PURC). Limited development of regulatory framework (a few regulations issued)
Issue regulations and technical rules for the grid and creation of wholesale market
Not done.
Source ECA, 2003
The progress in rural electrification in Ghana is attributed to the government efforts in which reforms were separated rural electrification, house holds 10km from the grid are to be electrified, enabling environment for raising 50% of the electrification cost from community fund-raising, creating life-time tariffs by estimating consumption (50kWh) as well as examining social aspect e.g. households comprising of several families.
The following table (Table 14) shows the trends in the performance in Ghana’s power sector.

��
Table ��: Trends in the performance of Ghana’s power sector
Year 1995 1996 1997 1998 1999 2000 2001 2002 2003
Electrification Levels (%): National 24.61% 27.09% 29.16% 31.76% 35.84% 39.20% 41.20% 43.32% 47.55%
Annual electricity generation (GWh) 6,133 6,627 6,886 5,013 5,924 7,223 7,859 7,296 6,462
Electricity consumption per capita (GWh) 6,077 6,658 7,342 5,437 6,804 7,835 8,030 8,028 5,860
Total Installed Capacity (MW) (VRA) 1,102 1,102 1,212 1,322 1,432 1,678 1,704 1,715 1,726
Hydro (%) 97% 97% 88% 81% 75% 65% 66% 66% 66%
System Losses (%) 3.20% 2.80% 2.60% 2.30% 1.80% 2.80% 3.10% 4.40% 4.90%
Number of employees (VRA) 2,614 2,616 2,647 2,724 2,842 2,902 3,038 3,138
Number of employees (ECG) 3,011 3,164 3,374 3,613 3,808 4,026 4,166 4,146 4,484
Number of customers (ECG) 466,720 527,980 585,342 647,872 744,005 832,593 893,880 969,674 1,093,494
Customers per employee 155 167 173 179 195 207 215 234 244
Economic growth rate (%) 5.0% 5.0% 3.0% 3.0% 4.3% 3.0% 3.0% 5.8% 4.8%
Population growth rate (%) 2.6% 2.6% 2.6% 2.6% 2.6% 2.7% 2.6% 2.6% 2.6%
Annual revenue (¢ ‘000,000) (VRA) 187,838 234,509
298,572 433,983 632,936 940,048 1,477,210 2,097,378
Profit/Loss (¢ ‘000,000) (VRA) 73,991.14 92,807
61,243 18,698 79,203 (257,878) (220,043) (582,513) 391,105
Annual revenue (¢ ‘000,000) (ECG) 77,230 97,150
116,539 210,856 466,799 532,593 880,054.74 1,344,070 2,113,367.27
Profit/Loss (¢ ‘000,000) (ECG) (5,491.32) (26,227.52)
(33,980.22) 6,020.58 17,365.26 (13,629.47) 152,973.05
85,252.00
Tariff: (ECG) Local currency 42.83 42.9 43.74 127.12 163.72 186
Debt collection days (VRA) 131 152 161 194 205 204 163 195
Debt collection days (ECG) 138 133 133 133 161 177 168 175 169
Share of RETs of total electricity supply (including large hydro) 97% 97% 88% 81% 75% 65% 66% 66% 66%
Source: AFREPREN, 2002; AFREPREN, 2004; Abavana and Yankah, 2005
Note: The reform period considered in the table above is limited to the period from 1997-2004, as the Electricity Act was enacted in 1997.

��
Burkina Faso
Until 1995, the energy sector was under the supervision of the Ministry of Trade, Industry and Handicrafts in Burkina Faso. The Ministry of Energy and Mines was later formed with the following objectives:
• The elaboration and application of laws and regulation of research activities, the production and distribution of electricity;
• The control of energy infrastructure;• The promotion of sustainable energy systems.• The control of the production, supply, and distribution of conventional
energy sources.
During the formation of the Ministry of Energy and Mines (MEM), the Department of energy became the general department of energy (DGE). The responsibilities of the DGE were reinforced in order to ensure the development and the implementation of energy policies for all the sub-sectors including hydrocarbon, electricity, wood fuel and renewable energy. In order to widen the capacity of the MEM, the Ministry of Mines, Quarries and Energy (MCE) was formed in 2000.
SONABEL is the national power utility in Burkina Faso. However, under the decree N°2000-628/PRES/PM/M of 2000, the Government plans to privatise the national utility (SONABEL: Société Nationale Burkinabé de l’Electricité) and to design a new rural electrification strategy. Before the adoption of the aforementioned decree, Parliament had adopted the first restructuring of the electricity sector under the 17 December 1998 law (No 060/98/AN) related to the general regulation of Burkina Faso’s electricity supply. The key new features of this law were:
i) to end the monopoly of the electricity generation in the whole country, ii) the authorisation for electricity distribution in areas in which there are no
companies dealing with the distribution business, iii) the setting up a of fund for the electrification through of levy for each kWh
sold in the whole country, iv) the adoption by the parliament of a law authorising the government to
privatise the utility, v) the adoption by the Government of a decree in February 2003 setting
up a fund for rural electrification and the Burkinabé agency for rural electrification,
vi) the adoption by the government of a decree in May 2004 dealing with the privatisation practicalities of the SONABEL.
It also specified that a private operator would be in-charge of the electricity production, transmission and distribution activities. However, the ownership of the assets would remain with the State. The new privatisation agenda should be completed by 2007.
The reform process in the electricity sector in Burkina Faso is still very young. The only significant reform that was done was the creation of new ministry in 2000 - the Ministry of Mines, Quarries and Energy (MCE) - charged with the definition and

��
the implementation of the government energy policies. This was done with an aim to favour competition and attract private investors. However, SONABEL still remains unbundled and is in charge of generation, transmission and distribution.
The government has however formulated a Law No. 060/98/AN regarding the general regulation of the electric energy supply to Burkina Faso. This law aims at satisfying two objectives including the qualitative and quantitative security in energy supply while providing the reduction of production costs and eliminating the monopoly of the SONABEL. This is achieved by liberalization of electricity production and distribution, hence opening up the sector for the private sector participation.
In-spite of the existence of a few projects such as regional solar programme (PRS) financed by the European Development Fund (FED), and the solar electrification project of community centres in about 150 districts funded by Spain, rural electrification is still a new concept in Burkina Faso. At the village level, a few small private initiatives were set up to distribute solar photovoltaic panels, establish community centres to recharge batteries, and also establish mini grids.
The total installed capacity in Burkina Faso is about 172 MW while that of private independent producers (self producers) was estimated to 15 MW. Thermal power plants are estimated to be producing 75.3% of the capacity while four hydroelectric plants (Kompienga, Bagré, Tourni, and Niofila) are producing 15.1% with the remaining share being produced from other sources. As seen in the following table (Table 15), it is apparent that other sources of generating electricity are getting into the power sector with a steady growth rate while Hydro power is steadily decreasing, a situation attributed to the environmental degradation.
The electrification levels in Burkina Faso are very low with an estimated electrification level of 9%. In rural areas, rural electrification is less than 1%. This situation is a big constraint for the socio-economic development of the country and the quality of life leading to significant rural-urban migration.

��
Côte d’Ivoire
Energie Electrique de Côte d’Ivoire (EECI), the main electricity utility in Cote d’Ivoire was established in 1952 with the aim of ensuring electricity production, transmission and distribution in the country.
Electricity sector reforms in Côte d’Ivoire started in October 1990, when the state-owned power utility EECI nearly went bankrupted due to financial mismanagement. A privately-owned company, CIE (the Compagnie Ivoirienne d’Electricité), was awarded a 15-year concession for operation and management of publicly-owned infrastructure for electricity generation, transmission and distribution, as well as for import and export of electricity in Côte d’Ivoire. EECI’s role was then changed to ownership and management of state-owned power utility assets on behalf of the State of Côte d’Ivoire. In this regard, EECI was responsible for monitoring the implementation of the concession awarded to CIE.
The entry of a private operator, CIE, led to notable improvements in the performance of the electricity sector. In its first year of operation, CIE recorded a net profit of over 800 million FCFA, compared annual losses for the EECI during the whole decade. The apparent and highly visible successes of the electricity privatisation provided a
Year 1995 1996 1997 1998 1999 2000 2001 2002 2003
Annual electricity generation (GWh)
242.8 273.5 306.1 338.1 359.9 390 365 364.6 444
Total Installed Capacity 106.26 108.33 110.53 127.47 147.16 162.12 162 171
Hydro (%) 35.2 24.7 18.66 21.5 33.33 24 11.8 15.1
System Losses (%) 14.6 17.5 14.3 17 14.8 15.2 17.3 15.5 17
Total Electricity demand (GWh)
207.4 225.7 259.2 280 306.5 330.9 356.3 401.7 427.3
Number of employees 1292 1271 1249 1309 1335 1325 1375 1399 1452
Number of customers 11,3892 12,2814 13,6238 151126 163068 163577 191677 204170 226691
Customers per employee
88.152 96.628 109.08 115.45 122.15 123.45 139.4 145.94 156.12
Economic growth rate (%)
-4.54 -3.281 5.263 10 31.818
Population (Millions) 10.079 10.313 10.558 10.809 11.065 11.328 11.598 11.873 12.155
Population growth rate (%)
0.0227 0.0227 0.0232 0.0232 0.0232 0.0232 0.0232 0.0232 0.0232
Table ��: Trends in the performance of Burkina Faso’s power sector
Source: AFREPREN, 2002; AFREPREN, 2004; Bassirou, 2005a; Bassirou, 2005a,
Note: The reform period considered is limited to 1998-2004, because the Law No 060/98/AN related to the general regulation of Burkina Faso’s electricity supply was adopted by Parliament on 17 December 1998.

��
further impetus to the government to deregulate the economy, devalue the currency and privatise the telecommunication and agro-industry sectors.
The Government further created the FNEE (Fonds National de l’Energie Electrique) in 1994 to ensure financial support to the electric power sector. It is during this year that the first IPP (independent power producer), known as CIPREL (the Compagnie Ivoirienne de Production d’Electricité), entered into operation.
In December 1998, the Government took further reform measures by restructuring the electricity sector, including the creation of three (3) new state entities to replace EECI and FNEE. These are:
• ANARE (the Autorité Nationale de Régulation du Secteur de l’ Electricité); • SOGEPE (the Société de Gestion du Patrimoine du Secteur de l’Electricité);
and• SOPIE (the Société d’Opération Ivoirienne d’Electricité).
This new structure therefore created two entities, namely SOGEPE and SOPIE, to replace EECI as the institutions responsible for the financial management of state-owned assets and technical development of electric power infrastructure in Côte d’Ivoire respectively (Eddy, 2005). It also introduced a new entity, ANARE, responsible for regulating the electricity supply industry, and protecting the often conflicting interests of the various stakeholders in the sector, including the government, operators (CIE, IPPs (CIPREL and AZITO), fuel suppliers (gas for IPPs)) and the consumers. Reforms in the power sector in Côte d’Ivoire were mainly aimed at improving the financial and technical performance of the state-owned power utility, and attracting private investment for capacity expansion thereby improving security and reliability of electricity supply.
The mandates of the key players in the sector as spelt out in the December 1998 Decree are as follows (Eddy, 2005):
• ANARE (Autorité Nationale de Régulation du Secteur de l’Electricité) is responsible for monitoring and enforcing compliance with regulations and conventions, settling disputes between key actors in the sector and safeguarding consumers’ interests.
• SOGEPE, (Société de Gestion du Patrimoine du Secteur de l’Electricité) is responsible for the management of the state-owned electricity assets, recovery of concession charges paid by the private concessionaire CIE (Compagnie Ivoirienne d’Electricité) and keeping the accounts and managing financial flows and public investments in the electricity sector.
• SOPIE, (Société d’Operation Ivoirienne d’Electricité) is responsible for planning investment projects in electricity production, transmission and distribution, coordination of implementation of publicly funded power

�0
projects, and monitoring the management of electrical energy supply and distribution by the private concessionaire CIE
• CIE (Compagnie Ivcoirienne d’Electricité) is the private company, which was awarded a 15-year concession for operation and management of power utility and electricity supply throughout Côte d’Ivoire in October 1990.
• CIPREL (Compagnie Ivoirienne de Production d’Electricité) and AZITO-ENERGY (ex-CINERGY) are the two independent power producers (IPPs) who supply electricity to CIE under a “take or pay” power purchase agreement (PPA).
• OCEAN ENERGY, FOXTROT (ex-APACHE) and CNR (ex-Ranger Oil) are private companies who supply fuel to the two IPP gas-fired thermal power plants.
Ivory Coast has an effective installed capacity of 1,202 MW including 604 MW for the six (6) hydroelectric factories and 598 MW for the power stations functioning with natural gas of the Ivory Coast. About 510 MW of effective installed capacity comes from the private sector.
PLANIFICATION DE L’OFFREET DE LA DEMANDE ENENERGIE ELECTRIQUE
Politique énergétique
Gestion du patrimoineGestion des flux financiers
Réglementation
COMMERCIALISATION
EXPLOITATION / MAINTENANCEDES RESEAUX MT / BT
ET CENTRALES ISOLEES
MOUVEMENT D’ENERGIE/ EXPORT
EXPLOITATION / MAITENANCEDU RESEAU TRANSPORT
CIPREL 21 × 110 = 110 MW
THERMIQUE (ETAT)4 × 25 = 100 MW
AZITO 1 & 22 × 150 = 300 MW
CIPREL 13 × 33 = 99 MW
HYDRAULIQUE (ETAT)6 CENTRALES = 604 MW
ELECTRIFICATION RURALE
EXTENSION / RENFORCEMENTDES RESEAUX MT / BT
SUM DE LA GESTIONDES MOUVEMENTS D’ENERGIE
DEVELOPPEMENT DURESEAUX DE TRANSPORT
REHABILITATION/RENOUVELLEMENTS DES
OUVRAGES DE PRODUCTIONPROPIETES DE L’ETAT
MINISTERE D’ETATMINISTERE DE L’ECONOMIE
ET DES FINANCES
MINISTERE D’ETATMINISTERE DES MINES
ET DE I’ENERGIE
DIRECTIONDE L’ENERGIE
ANARESOGEPE CIE CIPREL AZITOSOPIE
PRIVESETAT
ORGANISATION DU SECTEUR DE L’ELECTRICITE
ACTEURS
ACTIVITES
PRODUCTIN
TRANSPORT
DISTRIBUTION
Figure ��: Structure of the Power Sector in Ivory Coast
Source: SOPIE, 2005.

��
Cameroon
Power sector reform in Cameroon was initiated in 1998 with the overall objective of reducing the financial burden of the sector on the State budget and improving its contribution to the economic and social development of the country (Tapamo and Bignom, 2005). Specifically reforms were initiated to seek the contribution of the private sector in order to raise funding required for investments in the sector; improve the quality of service as well as the provision of energy; improve efficiency in the generation, transmission and distribution of electricity; and supply electricity at competitive rates to industries and the population. Despite a legislative overhaul made in 1998 to introduce competition and there after privatisation in 2001, the Cameroonian power sector is structured as a regulated private monopoly. The vertically integrated company, AES-Sonel, is responsible for generation, transmission, distribution, system operations and sales. It is regulated by an electricity regulatory agency (ARSEL, standing for “Agence de régulation du secteur de l’électricité”) under a 20-year “main concession agreement”. The main concession agreement contains sub-sector specific concession agreements and licenses (for transmission, distribution, system operations and retail sales). The legislature also provides for electricity generation from renewables and compensation for added cost of generation.
The complexity of the Cameroonian power sector, beyond the relatively simple appearance of a regulated private monopoly, comes from two sources. First, the legal framework was not created for an integrated monopoly. It was rather developed for an unbundled power sector, with different companies holding concession contracts in different sub-sectors. Secondly, the gap between what institutions have to do in theory and what they can do in practice is significant. The real distribution of power among power sector players does not reflect what is intended in the legislature.
Consequently, the structure of the power sector, instead of mostly consisting of a private monopoly and its regulator, is a mix of multiple national and international players.

��
Figure ��: Institutional Structure of the Power Sector in Cameroon
ARSELAER
Yaoundé
Regulates, controlsand follows
World Bank & IMF
Washington, U.S.A.
Lend, advise
AES Corp.
Arlington, U.S.A.
Owns 56%Concessioncontract
Lend
International
Financial
Institutions
EAIFFMO
AfDGTZCIDACWE
…
Lend, advise
AES - SonelDouala
GenerationTransmission
System operationsDistribution
Sales
All consu mersexcept largest one
≈ 1,500 GWh
Largest consumer(Alucam)
≈ 1,500 GWh
Owns44%
Gov. of CameroonYaoundé
Electricity Admin.Min. of Mines,
Water and Energy
Decideselectricity policy
Appoints 5 ofthe 9 Board members
Owns 53%
SupplycontractsARSEL
AERYaoundé
World Bank & IMF
Washington, U.S.A.
AES Corp.
Arlington, U.S.A.
International
Financial
Institutions
EAIFFMO
AfDGTZCIDACWE
…
AES - SonelDouala
GenerationTransmission
System operationsDistribution
Sales
All consu mersexcept largest one
≈ 1,500 GWh
Largest consumer(Alucam)
≈ 1,500 GWh
Gov. of CameroonYaoundé
Electricity Admin.Min. of Mines,
Water and Energy
ARSELAER
Yaoundé
World Bank & IMF
Washington, U.S.A.
AES Corp.
Arlington, U.S.A.
International
Financial
Institutions
EAIFFMO
AfDGTZCIDACWE
…
AES - SonelDouala
GenerationTransmission
System operationsDistribution
Sales
All consu mersexcept largest one
≈ 1,500 GWh
Largest consumer(Alucam)
≈ 1,500 GWh
Gov. of CameroonYaoundé
Electricity Admin.Min. of Mines,
Water and Energy
Since the creation of Sonel in 1974 and until the 1998 reform, the power sector was the responsibility of various ministries (Lavalin International, 1990:90). The electricity policy was the responsibility of the Ministry of Mines, Water and Energy, prices were set by the Ministry of Industrial Development and Commerce, funding was secured through the Ministry of Finance and the accounting for state-owned enterprises was done by the Ministry of Public Service. This complex structure was prone to various inefficiencies and even contradictory policies. No consistent, integrated legislative framework existed and legal texts were not applicable.
After the 1998 Electricity Act, two decrees were passed in 1999 to set up the electricity regulatory agency and the rural electrification agency. In 2000, a decree governing the activities of the electricity sector was enacted and privatization eventually occurred in 2001.
Electricity consumption per capita in Cameroon has been about 200 kWh per year for the last fifteen years, with a tendency to decrease rather than increase, as Figure 13 illustrates.

��
Figure ��: Electricity Consumption Per Capita in Cameroon
0
50
100
150
200
250
1990 1991 1992 1993 1994 1995 1996 1997 1998Reform
1999 2000 2001Privatiz.
2002 2003 2004
kWh
per
capi
ta
Three different problems explain the stagnation or even decrease of per capita consumption in Cameroon in the last fifteen years:
i. the poor maintenance of existing electric equipment; ii. the lack of investment in new capacity to supply the growth of demand due
to economic and demographic growth; and iii. variations in hydrology. Severe droughts are indeed largely responsible for
the decrease in per capita consumption after 2001.
Since the privatisation in 2001, electricity supply quality has deteriorated significantly in Cameroon. Long blackouts have been usual between 2001 and 2005, firms have incurred important losses and citizens have demonstrated their anger in the streets, a situation that is attributed to (i) exceptionally “dry” years, limiting the availability of water to generate electricity; and (ii) concession contract specifications. All in all, Cameroon has put in place sufficient reforms to ensure a vibrant power sector but the outcome has not been satisfactory (Tapamo and Bignom, 2005). Table 15 provides the performance of the power sector in Cameroon before and after reforms.

��
Senegal
SENELEC (Société d’Electricité du Sénégal) is the main producer and supplier of energy in Senegal. The company is responsible for the generation transmission, distribution and supply of electricity throughout the country. The Senegalese government now has a 41 % share in the company after a consortium of foreign companies (Hydro-Quebec of Canada and Elyo of France) acquired a 34 % interest
Year 1995 1996 1997 1998 1999 2000 2001 2002 2003 2004
Annual electricity generation (GWh)
2,804 2,922 3,146 3,172 3,391 3,480 3,541 3,428 3,694, 3,928
Electricity consumption per capita (kWh)
198 170.8 204.63 204.31 213.08 215.62 213.48 191.26 172.59
Total Installed Capacity
627 820 820 817 817 819 897 902 902 987
Hydro (%) 84.53 88.17 88.17 88.49 88.49 88.52 89.52 89.58 89.58
Total Electricity demand (GWh)
2,608 2,717 2,926 2,950 3,154 3,256 3,288 3,022 2,779
Number of employees
3,795 3,802 3,751 3,751 3,823 3,802 3,443
Number of customers
420,995 428,269 447,936 452,192 452,994 452,000 488,895 505,359 507,840
Customers per employee
110.73 114.175 119.418 118.282 118.885 146.762
Economic growth rate (%)
4.39 4.2 5.3 4.2 4.7
Population growth rate (%)
2.31 2.23 2.15 2.07 2
Annual revenue (US$ millions)
117 120 109 191 191 147 203 284
Profit/Loss (US$ millions)
-4.5 13 20 43
Share of RETs of total electricity supply (including large hydro)
97.18% 97.16% 97.30% 97.26% 97.35% 97.34% 97.28% 96.94% 96.57%
Share of fossil fuels of total electricity supply
2.82% 2.84% 2.70% 2.74% 2.65% 2.66% 2.72% 3.06% 3.43%
Table ��: Trends in the performance of the power sector in Cameroon
Source: AFREPREN, 2002; AFREPREN, 2004; Tapamo and Bignom, 2005
Note: The reform period considered in the table above is limited to 1998-2004, because the Electricity Act was passed in 1998

��
in 1999. 10 % of the company’s shares have been set aside for company employees while the remaining 15 % are available to the public on the regional stock exchange, the Bourse Régionale des Valeurs Mobilières (BRVM).
The sources of electricity for SENELEC include generation (396 MW in 2003) and purchase of electricity from IPPs (e.g. GTI, Manantali). It holds the monopoly of electricity transmission in the whole country except for the inter-connected network of Manantali and also holds the monopoly of distribution.
GTI-Dakar18, is a the independent power producer (IPP) developed by a subsidiary of the US-based General Electric, General Electric-Capital, IFC of the World Bank and the Italian utility Sondel. In 1996 it signed an exclusive electricity supply agreement with SENELEC for a period of 15 years. It runs a combined cycle power plant of an installed capacity of about 56 MW, brought into service into 1998/1999.
Eskom-Energy-Manantali (EEM), a subsidiary of Eskom South Africa, signed a contract with the Company of Energy management of Manantali (SOGEM), for the development and management of the electrical works of the Organization of Development of the River Senegal (OMVS).
The reform process in the electricity sector in Senegal started in Ernest in 1997 with a drive to attract the private investments and to introduce competition into the sector. SENELEC underwent a re-privatisation of 51 % in 2001, following a recurrence of the power failures experienced prior to privatisation. The Hydro-Quebec-Elyo consortium had been managing the company for 18 months at the time the international tender for re-privatisation was offered. The government has estimated that a further 170 MW of thermal capacity will be required in the coming years at a cost of US$ 200 million. Private power companies are to be allowed to develop the majority of these projects. Senegal hopes to invest US$ 152 million in the power sector up to 2015 to make up deficits and reduce power cuts especially to the capital, Dakar.
Generation of electricity has been liberalised and IPPs are allowed to generate electricity on the basis of contracts of the “BOO” . Electricity transmission on the other hand is still monopolised by SENELEC for unspecified duration for the whole country except for areas within the framework of the international projects (e.g. OMVS, OMVG) . SENELEC has an exclusive geographic perimeter of distribution given under concession contracts. The Government, however, plans to open up transmission to private operators through concessions to encourage competition and increase the level of installed capacity.
During the last fifteen years, SENELEC’s average electricity production and sales have increased at a rate of 5.5 % and 5.7 %, respectively. In fact, during the period 1990
18 GTI-Dakar was co-financed by General Electric, Sondel and IFC of the World Bank for an installed capacity of 56MW in 1998/1999.

��
- 2004, produced energy grew from 902 GWh to 1,952 GWh, and the sold energy grew from 721.8 GWh to 1536.1 GWh.
Since the implementation of the reform of the sector of electricity in 1999 (Thiam, 2005), consumption of electricity has had an annual average growth of 10.4 % between 1999 and 2001 and 7.6 % between 1999 and 2004. During the period after reforms, the national rate of electrification has grown by 5.3 % (reaching 36.7% in 2004), against 3.0 % during the time 1990-1998; and for this same period the rate of rural electrification realised a growth rate of 14.3 % (reaching 12.5 % in 2004), against 11.5 % during the time 1990-1998. This is due, on one hand to the Government’s rural electrification programmes and on the other hand, it is attributed to the projects carried out by SENELEC within the framework of its obligations of electrification as a defined condition in the concession.
Year 1996 1997 1998 1999 2000 2001 2002 2003 2004
National Electrification Levels (%): 25.8 26.6 26.9 28.3 29.8 31.4 33.2 34.6 36.7
Annual electricity generation (GWh) 1155.9 1243.5 1304.3 1348 1476.3 1651.3 1724.4 1826.5 1952.1
Electricity consumption per capita (kWh/capita)
107.6 114.2 118.9 114.6 120.6 132.5 134.7 140.5 145.6
Total Installed Capacity (MW) 295.1 313.2 341.5 408.5 422.3 422.3 470.0 500.0 496.3
System Losses (%) 20.20 19.12 17.62 21.11 22.16 21.55 21.61 20.89 21.31
Total Electricity demand (GWh) 922.4 1005.8 1074.4 1063.4 1149.2 1295.4 1351.7 1444.9 1536.1
Number of employees 2184 2163 1759 1730 1726 1756 1723 1855 2083
Number of customers 311,853 329,814 343,853 369,108 398,533 431,432 469,995 502,847 551,102
Staff costs as a percentage of revenue (%)
18.4 16.8 14.9 14.1 15.0 13.8 12.9 13.8 14.7
Economic growth rate (%) 7.9 7.6 9.1 12.9 3.5 5.6 8.0 6.9 8.3
Population growth rate (%) 2.70 2.69 2.68 2.67 2.65 2.63 2.60 2.54 2.54
Annual revenue (Millions FCFA) 66258 72560 77649 78430 85154 94950 108146 119128 124634
Tariff: Local currency (FCFA/kWh) 71.8 72.1 72.3 73.8 74.1 73.3 80.0 82.4 81.1
Debt collection days 78 69 67 127 125 139 132 121 99
Share of RETs of total electricity supply (including large hydro)
0.0 0.0 0.0 0.0 0.0 0.0 12.8 12.0 12.1
Share of fossil fuels of total electricity supply
100.0 100.0 100.0 100.0 100.0 100.0 87.2 88.0 87.9
Table ��: Trends in the performance of the power sector in Senegal
Source: AFREPREN, 2002; AFREPREN, 2004;
Note: The year 1999 is highlighted, as it is the period when reforms commenced in Senegal

��
Mali
Energie du Mali (EDM) – the main energy utility in Mali - was created in the form of an industrial and commercial company – in which the Malian Government held 97.2% of the capital, with Electricité du France (EDF) holding the remaining 2.8%. EDM is responsible for almost all generation, transmission and distribution of electricity and providing water services. The company has undergone three phases in its reform process namely: (i) EDM as a mixed investment company; (ii) EDM in the period of temporary total delegation of management; and (iii) EDM as a limited private company.
The reform process in the electricity sector in Mali is attributed to the need by the Malian Government’s to provide electricity and water supply for the vast majority of the country’s population, under the best possible conditions, in terms of quality and cost. The Malian Government set the following objectives as means of achieving its goals:
• Improvement of the sector’s efficiency and productivity by disengaging itself in the running of the electricity industry; providing of potable water;
• allowing the participation of the private sector in the power sector. The government therefore planned to open up the electricity and water sectors to competition; privatise EDM;
• restructuring the electricity and water sectors and executing a rural electrification programme.
During the period of temporary total delegation of management, the Government of Mali committed EDM to a process of reform to overcome the difficulties of management and operation of the EDM. The first phase of this reform was the total delegation of management of EDM; this began in 1995 and lasted for a period of 4 years with a possibility for extension to a maximum of five years. The Malian Government transferred decision-making power to the professional partner body. This phase of total delegation of management ended in 1998, with mixed investment company management system continuing until 1999. During this stage, the process of privatising EDM began in earnest. The state-owned electricity companies or national utilities in Mali have been facing several difficulties including: poor management; lack of investment in the sector; poor quality of services, etc. This situation has impacted negatively to the development of the economy and the living standards of a majority of the population. As a result, the Government have embarked on a review of their energy policy and/or strategy, which includes electricity reforms implemented after 1998. However, in spite of these reforms, the rate of electrification remains low. The urban poor and the rural populations remain marginalized.Mali’s total electricity consumption remains far below the required level for sustainable economic growth. Over an entire decade, national consumption has only doubled but remained low, rising from 176.34 GWh in 1990 to 349.04 GWh in 2000. This low

��
consumption is partially due to the country’s low industrial base. Per capita electricity consumption has crept up between 1990 and 1995. It went up from 21.7 kWh per capita in 1990 to 34 kWh per capita in 2000, i.e. an average annual increase of 5.6%. During the period prior to the reforms, per capita consumption stood at 37.1 kWh in 2001, then reached 40.3 in 2002, reflected an increase of 8.6%. The post-reform period is marked by a sharp increase in the proportion of the population that has access to electricity mainly in the urban areas. The electrification level rose by 3%, from 9% in 1999 to 12% in 2002. The increase in electrification in 2001 and 2002 can be attributed to promotional connection offers in both the water and electricity networks, which encouraged many households in urban areas to connect.SAUR decided to pull out of the EDM’s shareholding and handed over its shares to the Government of Mali in October 2005. The Government of Mali has then decided to enter into a public-private partnership with IPS of the Aga Khan Group with 66% shareholding for Government of Mali and 34% by IPS (Toure, 2005).
Niger
The electricity sector in Niger is dominated by the Niger Electricity Company (NIGELEC), which is a Government-owned utility responsible for generation, distribution and transmission of electricity in the country. NIGELEC also sources electricity mainly from coal-fired power station, purchases from SONICHAR and imports from Nigeria. SONICHAR operate a coal-fired power station of 32 MW, which supplies NIGELEC and the uranium mining companies located in the extreme North of the country.
Supply of electricity in Niger is therefore assured through three distinct sources:
• Local production by NIGELEC, uninterrupted in the isolates centres and in help in the centres inter-connected with the network from Nigeria,
• SONICHAR production from which 90% is supplied to Uranium mining companies and 10% to NIGELEC,
• Interconnections with the networks of Nigeria, which ensure approximately 85% of the national electric demand.
The reform process in Niger was fuelled by the World Bank/International Monetary Fund, which required the Government to implement Structural Adjustment Programme of which the electric sector was included. The Government is in the process of privatising the National Electricity Utility (NIGELEC), which is currently identifying a strategic operator.The enactment of the Electricity Law (Law N° 2003-004” of January 31 2003) provided for the delegation of the public utility in generation, transmission and distribution of the electricity power on a purely exclusive basis with a private strategic operator. It also liberalised the sector and opened it up to IPPs.

��
Some of the electricity sector reform steps that the country has implemented include:
• The adoption of the document of sectoral policy in the field of electricity • The adoption of the Ordinance carrying creation, organization and operation
of the Authority of Multi-sector Regulation and• The adoption of the Law carrying Code of the Electricity and its decree of
application The Government has also implemented a rural electrification programme started in 2001 through NIGELEC in which a tax of 2FCFA is charged for every KWh and this money is directed towards increasing the grid network in the rural areas. The Government however plans to create an autonomous agency of rural electrification, which will, among other functions, subsidize investments from a national fund of rural electrification.
Ministry of Mining and Energy (MME) is in charge of the policies in the electricity sector. A regulatory authority - Multisectoral Regulation Authority (MRA) works with the MME for the regulation of the electricity sector. MRA has the objectives:
• Applying the legislature governing the sectors under objective, transparent and no-discriminatory conditions;
• Protecting the interests of the users and the operators, by taking any measurement suitable to guarantee the exercise of a healthy and fair competition in the sector;
• Promoting the effective development of the sector while paying attention to, in particular, the financial and economic balance and safeguarding the economic conditions necessary for its viability,
• Implementing the mechanisms of consultations for the users and the operators envisaged by the laws.
The following table (Table 18) shows the trends in the performance of the power sector in Niger.

�0
Table ��: Trends in the Performance of the power sector in Niger
Year 1998 1999 2000 2001 2002 2003
Installed Capacity (MW) 98.83 98.83 98.83 98.96 102.96 103.36
* Thermal capacity (%) 100 100 100 100 100 100
* Hydro capacity (%) 0 0 0 0 0 0
Useable capacity (MW) 96 96 96 96 98 99
Electricity generated (GWh) 185.8 170.19 204.77 180.18 184.28 191.47
Electricity supplied (GWh) 411.4 402.5 408.59 424.18 444.54 466.1
Electricity purchased from outside suppliers (GWh) (if any) 225.64 232.35 203.82 244 260.3 274.6
National Electricity Access Levels (% of total population) 4.9 5.1 5.4 5.55 6.3 6.49
Number of customers 68.409 73.721 80.295 90.066 98.707 107.15
Total staffing levels at the utility (including contractors) 1141 1107 1104 1074 1047
Source: AFREPREN, 2002; AFREPREN, 2004;
Note: The year 2003 is highlighted, as it is the period when reforms began in Niger.
2.2 Performance of the Power Sector
The performance of the power sector in the sub-Saharan African region varies widely depending on the level of economic development of a particular country, political conditions as well as the approach used to reform the electricity industry. This section provides a detailed assessment of the performance of the power sector in the region based on the findings of the country studies. The performance of the power sector can broadly be categorized into two: (i) Technical performance – taking into account indicators of utilities’ technical & management operations; and, (ii) Financial performance.
2.2.1 Institutional Structure of the African Power Sector
Figure 14 illustrates the typical institutional structure of the power sector prevailing in most of the countries covered in the study.

��
Figure ��: Typical Institutional Structure of the Power Sector
Coal
Petroleum
Hydro
Biom as s
Geotherm al
Wind
Solar PV
Agricu lture
Industry
Comm ercia l
Res idential /Hous ehold
Transpor tPower Sector
UTILITIES
Generation
Transmission
Dist ribution
Parliam ent(Elec tr ic ity Ac t)
Min is try ofFinance
Ma
jor
So
urc
es
of
Ele
ctr
icit
y
De
ma
nd
Se
cto
rs
Ministry of Ene rgy
IPPs
IPDs
ElectricityRe gulatory Agency
Rural Ele ctri fica tionAgency
Key: IPPs = Independent Power Producers; IPDs = Independent Power Distributors
Source: Compiled by authors
The institutional structure shown in the previous graph above depicts an idealized reformed power sector. Prior to power sector reforms, the Electricity Regulatory Agency, IPPs and IPDs were non-existent. With the on-going reforms, IPPs and IPDs appear in the institutional framework alongside the state-owned utility at generation and distribution levels. In addition, the Electricity Regulatory Agencies have been established as independent bodies with “arms-length” relationships with the Ministry of Energy as well as the state-owned and private utilities.
Another important development is the establishment of Rural Electrification Agencies whose responsibility is to enhance access to electricity among the rural population through investments in electricity transmission and distribution infrastructure and in some cases subsidising capital investment in rural electricity generation. While only a handful of Rural Electrification Agencies have been established these are likely to increase as more countries continue to reform their electricity industries.
Power sector reforms have transformed the Parliament into a crucial institution in the sector due to its mandate of formulating and amending the Electricity Act that governs

��
the power sector. The Ministry of Energy19 has continued playing a significant role in the reformed power sector by ensuring that the policies are in line with the overall objectives of power sector reforms. The Ministry of Finance is also an important institution in the framework playing the role of making key financing and investment decisions within the power sector.
As shown in the Figure 17, there are seven (7) major sources of electricity supplying electricity to the main demand sectors. However, the core source of electricity in the countries covered in this study is hydro except Senegal or Niger, which exclusively rely on fossil fuels for their power generation . This is in contrast to North African countries, which depend on petroleum-based electricity generation, and South Africa, which relies on coal in addition to hydro and fossil fuel power plants. In most of Sub Saharan African countries, biomass in the form of bagasse is used for co-generation in sugar industries. A few countries such as Kenya have a limited number of wind-turbines for power generation. Kenya is also the only country to commercially exploit geothermal energy for electricity generation. Solar PV systems are mainly used in rural areas to meet small electrical loads such as lighting, radio and television.
The major electricity demand sectors are industry, commerce and households. Use of electricity for transport is largely limited to electric trains in parts of southern and northern Africa. In agriculture, some electricity is used in large farms as well as in agro-industries.
2.2.2 Technical Performance
The following table summarizes the technical performance of the power sector in the respective countries covered in this study.
19 For some countries in Africa, the Ministries in charge of the energy sector may not always be the Ministry of Energy. Others could be: - Ministry of Natural resources or Ministry of Mines and Energy.

��
Table ��: Key Economic and Electricity Industry Indicators (�00�/�00�)
Population Growth
Rates (%)
Reported Economic
growth Rate
Electricity Consumption
per Capita
Installed Capacity
Annual Electricity Generation
System Losses
(%)
Number of Employees
Electricity Access Levels
Countries
Burkina Faso 0.02 3.9 19 *172 444 17 1,452 9
Zambia 3.00 2.9 537 1,786 8,180 2 **3,963 20
Eritrea 3.00 4.0 58 176 273 17 1,031 34
Namibia 1.50 3.7 1,373 396 1,329 9 1,566 **40
Cameroon 2.00 4.7 173 987 3,700 *35 3,443 46
Zimbabwe **1.7 -4.8 880 1,961 11,972 **15 6,000 **84
Senegal 2.54 8.3 146 496 1,952 21 2,083 37
Tanzania 2.80 6.5 93 911 3,393 25 4,857 9
Ghana 2.60 4.8 291 1,726 6,462 5 7,622 48
Kenya 2.75 4.3 126 1,229 5,035 19 6,216 9.1
Mali 2.9 4 *40 **186 **590 *12
Niger 3.6 3.5 28 103 191 1,047 6.4
Cote d’Ivoire 2.1 -1 172 1,202 4,075 71
Uganda 3.2 5 44 303 1,760 28 1,429 5
Note: 2002 data; ** 2001 data
Electrification Levels
National electrification levels in the countries covered in the survey are low with most countries registering levels below 30%, with the exception of Cote d’Ivoire, Ghana, Namibia, Senegal and Eritrea. This is a very low figure, compared to northern African countries and South Africa, which are able to supply more than 85% of their population with electricity.

��
Figure ��: National Electrification Levels (�00�/�00�)
0 10 20 30 40 50 60 70 80 90
Zimbabwe
Cote d'Ivoire
Ghana
Cameroon
Namibia
Senegal
Eritrea
Zambia
Mali
Kenya
Tanzania
Burkina Faso
Niger
Uganda
Co
un
try
National Electrification Levels
Sources: World Bank 2004; Pineau 2005 a & b, Habtetsion 2005 a & b, Dube 2005 a & b, Kalumiana 2005 a & b, Nyang 2005 a & b, Diarra 2005 b, Bassirou 2005 a & b, Kayo 2005 a & b, Sarr & Sokona 2003, AFREPREN Energy Data Handbook 2004, Kahyoza 2005 a & b, Tse 2005 a & b, SOPIE 2005
Rural electrification levels are even much lower with the majority of the countries covered recording electrification levels of less than 10% in the rural areas – where the majority of the poor in Africa reside. With the exception of Cote d’Ivoire, Ghana, Zimbabwe, Namibia and Eritrea, available data also shows that even in urban areas where most of the electricity connections are, less than half of the households have access to electricity (Figure 16).

��
Figure ��: Urban and Rural Electrification Levels (�00�/�00�)
0 10 20 30 40 50 60 70 80 90 100
Cameroon
Zimbabwe
Eritrea
South Africa
Namibia
Senegal
Zambia
Niger
Kenya
Burkina Faso
Malawi
Mozambique
Ethiopia
Co
un
try
% Electrified
Sources: World Bank 2004; Pineau 2005a&b; Habtetsion, 2005a&b; Dube, 2005a&b; Kalumiana, 2005a&b; Nyang, 2005a&b; Diarra, 2005a&b; Bassirou, 2005a&b; Sarr & Sokona, 2003, Kayo 2005a&b; Kahyoza 2005 a&b; Tse, 2005a&b
The high cost of providing electricity to disperse rural populations, limited affordability, and the lack of financial resources to meet the capital investment and operating costs continue to render these areas financially unattractive even after reform (Clark et al, 2005). Poor management of the rural electrification fund by the national utilities and agencies has also affected the electrification efforts to the majority rural population who cannot afford to pay for electricity. Consequently, in most of the countries, it is likely that the rural poor are unlikely to have access to electricity in the foreseeable future.
Number of Customers
In comparison to the national population in the respective countries, the number of customers is relatively low. While the number of customers has been growing steadily over time, its growth rate is much lower than the population growth rate. This also explains the low electrification levels discussed earlier.

��
An important indicator that partially corroborates the fact that utilities in the respective countries generally have low customer levels is the customers per employee ratio20. According to developing country norms, a utility with high customer levels should have a ratio of at least 125 customers per employee. However, with the exception of Burkina Faso, Cameroon and Ghana, the majority of the utilities in the countries covered in this study register ratios below the aforementioned norm which, in part, confirm low customer levels (see fig. 17).
Figure ��: Customers per Employee in Selected African Countries (�00�/�00�)
Note: * - 2000 data;
Sources: Okumu 2003, World Bank, 2004, Habtetsion 2005 a&b, Dube 2005 a&b, Kalumiana 2005 a&b, Nyang 2005 a&b, Bassirou 2005 a&b, Kayo 2005 a&b, AFREPREN Energy Data Handbook 2004, Kahyoza 2005 a&b, Tse 2005 a&b,
20 Partially corroborates because the same indicators is mainly used to check whether the staffing levels of a utility.
3503253002752502252001751501251007550250
Namibia
Lesotho*
Malawi
Mozambique*
Zambia
Ethiopia
Zimbabwe
Niger
South Africa
Kenya
Eritrea
Tanzania*
Ghana
Cameroon
Burkina Faso
Mauritius*
Uganda
Senegal
Co
un
try
Customer per Employee

��
Electricity Consumption
The average electricity consumption per capita in sub-Saharan Africa (excluding South Africa) is estimated to be about 124.4 kWh (World Bank, 2005). This level is well below the 3,860 kWh per capita in South Africa or even the 900 kWh per capita in North Africa (World Bank, 2005). Compared to northern African countries and South Africa, most of the countries covered in this study register low electricity consumption levels, with the exception of Namibia and Ghana as shown in the following table (Table 20):
Table �0: Electricity Consumption per Capita (�00�/�00�)
Country Electricity Consumption per Capita (kWh)
Namibia 1,373Zimbabwe 880Zambia 537Ghana 291Cameroon 173Cote d’Ivoire 172Senegal 146Kenya 126Tanzania 93Eritrea 58Uganda 44Niger 28Burkina Faso 19
Sources: World Bank 2004; Pineau 2005a&b; Habtetsion, 2005a&b; Dube, 2005a&b; Kalumiana, 2005a&b; Nyang, 2005a&b; Diarra, 2005a&b; Bassirou, 2005a&b; Sarr & Sokona, 2003, Kayo 2005a&b; Kahyoza 2005 a&b; Tse, 2005a&b

��
Figure ��: Electricity Consumption per Capita (�00�/�00�)
0 100 200 300 400 500 600 700 800 900 1,000 1,100 1,200 1,300 1,400 1,500
Namibia
Zimbabwe
Zambia
Ghana
Cameroon
Ivory Coast
Senegal
Kenya
Tanzania
Eritrea
Uganda
Mali
Niger
Burkina Faso
Co
un
try
Electricity Consumption per Capita (k Wh)
Sources: IEA 2004; World Bank 2004; CIA The World Factbook 2005, Pineau 2005 a & b, Habtetsion 2005 a & b, Dube 2005 a & b, Kalumiana 2005 a & b, Nyang 2005 a & b, Diarra 2005 b, Bassirou 2005 a & b, Kane 2005 a & b, Kayo 2005 a & b, Sarr & Sokona 2003, AFREPREN Energy Data Handbook 2004, Kahyoza 2005 a & b, Tse 2005 a & b, SOPIE 2005
In some countries, it is reported that the per capita consumption of electricity has been declining (Clark et al, 2005). For example, in Ghana, while overall electricity access in the northern part of the country increased by more than 500 percent between 1991 and 2000, per capita consumption fell by almost 20 kWh per person over that period. Many households could not afford to pay for electricity and were forced to rely on other power sources for many of their daily activities or even disconnect their households from the network altogether. On the other hand, in Mali, per capita consumption of electricity has increased from 22 kWh per person in 1990 to about 40 kWh in 2002 while at the same time access levels increased almost threefold (Sarr and Sokona, 2004; Clark et al, 2005).
System Losses
Partly due to poor maintenance on the transmission and distribution system, the countries covered in this study are characterized by high system losses when compared with the international target of about 10%-12%. The power systems in some countries record figures as high as 41% (Figure 19).

��
Figure ��: System Losses in Selected African Countries (�00�/�00�)
0 5 10 15 20 25 30 35 40 45
Sudan
Cameroon
Angola*
Uganda
Tanzania
Ethiopia
Senegal
Kenya
Malawi
Burkina Faso
Eritrea
Zimbabwe
Botswana
Lesotho*
Ghana
South Africa
Zambia
Co
un
try
System Losses (%)
Sources: World Bank 2004, Pineau 2005 a&b, Habtetsion 2005 a&b, Kalumiana 2005 a&b, Nyang 2005 a&b, Bassirou 2005 a&b, Kayo 2005 a&b, Sarr 2005 a&b, Kahyoza 2005 a&b, Tse 2005 a&b, AFREPREN Energy Data Handbook 2004; 2001 data
High levels of system losses such as those shown in the previous graph not only further constrain the amount of electricity delivered but also affect the financial performance of the electricity utilities discussed in the following section.
2.2.3 Financial Performance
The financial health of most of African electricity utilities such as those in the countries covered in this study is in part affected by their technical performance discussed in the previous section. One of the major drivers for power sector reforms in almost all the countries covered in this study is the poor financial performance of the utility. Prior to reforming their respective power sectors, a sizeable number of utilities recorded a string of loss-making experiences. Examples include electricity utilities in Zimbabwe, Kenya, Ghana, Uganda and Tanzania. In all the four countries, reforms brought a turnaround in the financial performance of their electricity utilities.
For the countries covered in this study, Table 21 provides an overview of their financial performance.

�0
Table ��: Key Financial Indicators for the Electricity Industry Indicators (�00�/�00�)
Annual Revenue (USD)
Profit/Loss (USD)
Tariff Levels (US¢/kWh)
Debtor Days
Countries
Burkina Faso 70,010,524 0.16
Zambia **111,000,000
Eritrea 28,400,000 -1,860,000 11.7 108
Namibia 79,874,364 9,027,314 3.97 34
Cameroon 284,000,000 43,000,000 0.11
Zimbabwe **465,585 1.6 56
Senegal 223,530 0.14 99
Tanzania 181,000,000 60,900,000 8 0
Ghana *2,097,378 391,105 ***0.02 195
Kenya 311,389,629 11,690 9
Uganda 158,038,404 8.53 194
Sources: World Bank 2004; Pineau 2005a&b; Habtetsion, 2005a&b; Dube, 2005a&b; Kalumiana, 2005a&b; Nyang, 2005a&b; Diarra, 2005a&b; Bassirou, 2005a&b; Sarr & Sokona, 2003, Kayo 2005a&b; Kahyoza 2005 a&b; Tse, 2005a&b, Note: 2002 data; ** 2001 data; *** 2000 data
As can be seen from Table 21, the amount of revenue collection by utilities is significant. This is mainly due to the monopoly status of the state owned electricity distribution utilities as well as tariff reforms and improved operations as a result of power sector reforms. Latest available data suggests that, compared to the early to mid-1990s when roughly 60% of sub-Saharan African utilities’ financial performance was inadequate (Covarrubias, et al, undated), most utilities have now become profitable with the exception of a few such as Eritrea that continue to register losses.
Controlling the high system losses and low electrification levels combined with higher tariff levels; electricity utilities should be able to realize higher revenue levels. Tariff reforms will particularly continue playing a significant role in the profitability of electricity utilities in sub-Saharan Africa. Essentially, tariff reforms comprise of two components: removal of subsidies and reflection of true cost of delivery by taking into account the cost of fuel used for electricity generation as well as changes in key national and global macro-economic factors e.g. inflation, foreign exchange fluctuation, world oil prices, etc. The following figure (Figure 20) shows the prevailing average tariff levels in the countries covered by this study.

��
Figure �0: Prevailing Average Tariff Levels in Selected Countries (�00�/�00�)
0 1 2 3 4 5 6 7 8 9 10 11 12 13
Eritrea
Kenya
Uganda
Tanzania
Namibia
Zimbabwe
Co
un
trie
s
Tar iff Levels
Sources: World Bank 2004; Habtetsion 2005 a & b, Dube 2005 a & b, Nyang 2005 a & b, Kayo 2005 a & b, AFREPREN Energy Data Handbook 2004, Kahyoza 2005 a & b, Tse 2005 a & b, Okumu, 2003, Opio, 2005
As shown in the Figure 20, the majority of the countries have raised their electricity tariff levels above the long-run marginal cost (LRMC) usually in the range of USc 6 - 8 in most sub-Saharan African countries - an indication of the establishment of tariff setting mechanisms to reflect the true cost of delivering electricity. It is noteworthy pointing out that while tariff reforms are critical to the financial health of the electricity utilities, for financial performance to be sustainable, these reforms should be complemented by system losses reduction and increasing the customer base through enhanced electrification. In addition, it is imperative that debt collection is also enhanced as a significant number of the utilities covered in this study register poor debtor days. With the exception of Namibia, the rest of the countries record debtor days are well above the international norm of 30 days (see Figure 21).

��
Figure ��: Debtor Days (�00�/�00�)
Debtor Days
0 20 40 60 80 100 120 140 160 180 200
Ghana
Uganda
Eritrea
Senegal
Zimbabwe
Namibia
Co
un
trie
s
Debtor Days
Sources: World Bank 2004; Habtetsion 2005 a & b, Dube 2005 a & b, Kayo 2005 a & b, AFREPREN Energy Data Handbook 2004, Kahyoza 2005 a & b, Tse 2005 a & b
To conclude, most of the power utilities in the countries covered in this study appear to record continued unsatisfactory technical but an improved financial performance. A tentative conclusion that can be drawn from this assessment is that power sector reforms in most of the sub-Saharan African countries have largely focused on improving the financial health of the electricity utility, perhaps at the expense of technical performance which includes, among others, improving the population’s access to electricity. The following section discusses the status of power sector reforms and regulatory measures instituted in sub-Saharan Africa.

��
Chapter 3: Status of Power Sector Reforms and Regulatory Measures
3.1 Description of Power Sector Reforms
Power sector reform is often equated with deregulation and reduction of government participation in the electricity industry. The major reforms that have been taking place in Africa are structural changes and privatization of power utilities. Structural changes refer to the process of unpackaging vertically integrated utilities into separate generation, transmission and distribution companies (vertical unbundling) and conversely unpackaging national utilities into smaller district or provincial utilities (horizontal unbundling). However, horizontal unbundling appears to be feasible in very large economies such as in the United States of America. In Africa, only Nigeria appears to be considering this option (Balla, 2003).
The privatisation process is essentially an issue of changing ownership of assets. It commences with bringing the assets of the state-owned utilities under a parastatal. The parastatal is thereafter commercialised (also referred to as corporatised) and it ultimately goes through several other steps to become a fully privately owned entity. The most common privatisation path undertaken by most African countries in power sector reforms has been the corporatisation, commercialisation, management contract and stop at allowing the entry of independent power projects (IPPs).
The following figure illustrates the typical restructuring and privatisation paths followed by the majority of the countries covered in the study. However, not all countries strictly follow the path nor do they also adopt all reform options. For example, management contract does not appear to be a popular reform option among the countries studied (see Table 22).

��
Figure ��: Sample Graph of Reform Options
1983 1997 1997 1997
Scenario1
Scenario 2
1995
2000
Restructuring
Privatization/Ownership Changes
Commercialization
Privatization ofgeneration anddistribution
Vertically IntegratedUtility (State OwnedUtility)
Unbundledgeneration anddistribution
Complete verticalunbundling
Unbundledgeneration,commontransmission anddistribution
CompleteGovernmentOwnership
MinistryDepartment
Parastatal
Corporatization(arms-length relationto Government
IPPs -Privatization ofgeneration
Privatization ofgeneration,transmission anddistribution
CompletePrivateOwnership
ContractManagement
Establishementof IndependentRegulatory body
Amendment of theElectricity Act
Scenario 1 and 2 = Possible future reform and possibly extreme options complete privatisation and unbundling.
Source: Compiled by authors
Figure 22, representative of trends in sub-Saharan African countries, appears to indicate that a lot more privatisation has been undertaken than restructuring. In addition, restructuring is, in most countries, implemented well after the entrenchment of privatisation.
Furthermore, Figure 22 also illustrates the long time lag between implementation of the different reform options. For example, there is often a bigger lag between commercialisation and the amendment of the Electricity Act. However, as soon as the Act is amended several other developments take place almost at the same time. For example, it is not uncommon to have the Electricity Regulatory Agency and IPPs established in the same year as the Act. As mentioned earlier, unbundling takes place much later mainly due to the legal changes to the utility that are required including asset transfers procedures as well as the legal establishment of the new institutions being formed. In addition, the long time lag is also partly due to lengthy appointment procedures for the new institutions.
In terms of restructuring, some countries such as Kenya have opted to only unbundle the generation segment. Others such as, Uganda and Zimbabwe, have taken the extreme option of completely unbundling the entire formerly integrated utility into generation, transmission and distribution.

��
In the case of West Africa, the reforms of the electricity sector were implemented at different time intervals in different countries: Côte d’Ivoire was the first to implement reforms in the early 1990s, followed by Senegal (1998), Mali, (The Gambia, and, finally in 2003, Benin. In all of these cases, the key objectives of the reforms were to enhance technical efficiency (renovation and extension of the grid, improvement of the quality of electricity), financial and managerial performance– none of them made explicit mention of improving the poor’s access to electricity or addressed environmental concerns such as increased use of renewables and efficiency options. This is in spite of the fact that many of the countries have listed poverty reduction as one of their national priorities by adopting Poverty Reduction Strategic Papers (Sarr, S., Fall, L., Togola, I. and Sokona, Y. 2003)
Comparing the reform process in Africa to the rest of the world, it appears that sub-Saharan Africa has been the slowest to implement power sector reforms. This is according to the latest and most comprehensive global survey of the status of power sector reforms in developing countries conducted in 1998 by ESMAP (Bacon and Besant-Jones, 2002). The survey included 48 sub-Saharan African countries and revealed that, in contrast to other regions in the developing world, in overall terms, sub-Saharan Africa’s power sector was the least reformed (see Table 22).
Table ��: Status of Power Sector Reforms in the Developing World (����)��
Key StepRegion (number of countries)
SSA (48) MNA (8) EAP (9) ECA (27) SAR (5) LCC (18)
Corporatisation/ Commercialisation 15 (31%) 2 (25%) 4 (44%) 17 (63%) 2 (40%) 11 (61%)
Independent Power Producers 9 (19%) 1 (13%) 7 (78%) 9 (33%) 5 (100%) 15 (83%)
New Electricity Act 7 (15%) 1 (13%) 3 (33%) 11 (41%) 2 (40%) 14 (78%)
Establishment of Regulator 4 (8%) 0 (0%) 1 (11%) 11 (41%) 2 (40%) 15 (83%)
Unbundling 4 (8%) 3 (38%) 4 (44%) 14 (52%) 2 (40%) 13 (72%)
Privatisation of Distribution 1 (2%) 1 (13%) 1 (11%) 8 (30%) 1 (20%) 8 (44%)
Privatization of Generation 0 (0%) 1 (13%) 2 (22%) 10 (37%) 2 (40%) 7 (39%)
Reform indicator 0.83 (12%) 1.13 (19%) 2.44 (41%) 2.96 (49%) 3.20 (53%) 4.61 (77%)
Source: Adopted from Bacon and Besant-Jones, 2002
Note 1: SSA = Sub-Saharan Africa; EAP = East Asia and Pacific; ECA = Europe and Central Asia; LCC = Latin America and Caribbean; MNA = Middle East and North Africa; SAR = South Asia.
Note 2: Reform indicator = Average number of reform options implemented per country (see key reform steps in table 3)
Note 3: Data on SSA slightly differs from the ESMAP data provided in Bacon 2001, due to the difference in the implied meaning of Privatisation of Generation and Distribution
21 It is, however, important to note that the current status of reforms might have changes significantly from the 1998 situation.

��
3.2 Status of Power Sector Reforms
The following table (Table 23) summarises the status of implementation of the various power sector reform options. It includes the status of legal, regulatory and institutional reforms in the countries covered in the study.
Table ��: Status of Reform Implementation
Commercialisation/ Corporatisation
New/Amended Electricity Act
IPPs IPDs Regulation Agency
Rural Electrification
Agency
Kenya √ √ √ × √ §
Namibia √ √ √ √ √ ×Tanzania √ § √ √ § §
Uganda √ √ √ √ √ √Zambia √ √ √ × √ √Zimbabwe √ √ § § √ √Cote d’Ivoire √ √ √ √ √ ×Niger √ √ § × √ §
Mali √ √ √ × √ √Ghana √ √ √ √ √ ×Eritrea √ √ § § √ §
Cameroon √ √ § § √ √Burkina Faso √ √ § × √ √Senegal √ √ § § √ √
Note: √ = Implemented; × = Not Implemented; § = Pending
The following section briefly discusses the status of each of the reform options mentioned in the Table 22.
3.2.1 Commercialisation/ Corporatisation
Commercialisation/corporatisation (hereinafter simply referred to as commercialisation) appears to be the first reform option executed in the countries covered in the study as the utilities in all the countries have implemented the option. (see Table 22). Essentially this is because this is normally the first step in the reform of state owned utilities. The key objective of this option is to ensure the utility runs its operations based on business principle of profit-maximization. In Africa, there have been two key forms of commercialisation reforms, namely: management contract and tariff reforms.

��
Management Contract22
Management contract is increasingly becoming a common feature in state-owned power utilities, particularly in West African countries. A number of countries have attempted to introduce management contract to improve efficiency and profitability of their utilities. Countries in the study that have incorporated this option include Uganda, Tanzania and Ghana. Other countries in the continent include Malawi, Guinea Bissau, Morocco and Togo. Most of these contracts involve an agreement through which operational management of the utility or part of it is delegated to a firm of management consultants, but the assets and investment decisions remain under the Government.
Box 1. Management Contract Experience in Africa
The foreign firms involved in management contract in Africa have mainly been dominated by French entities. More recently, South African firms (Net Group Solutions and Eskom Enterprises – a subsidiary of the South African utility, Eskom), have begun showing interest in the African power utility management contract market. South-African led management contract initiatives are now underway in Malawi, Uganda and Tanzania.
Tariff Reforms
Prior to the advent of electricity regulatory agencies and power sector reforms in general, electricity tariffs were approved and, in some cases, determined by Government. This was during the period when provision of electricity was perceived as a social welfare service rather than a commercial service. Governments, therefore, strived to ensure that electricity was affordable to all by keeping the tariffs low and, to a large extent, subsidised.
Power sector reforms in the region have led to, among other developments, increases in the tariff levels in line with the following objectives:
• To recover the cost of electricity generation, transmission and distribution;• To fairly and equitably spread the above costs to consumers based on the true
cost of service delivery, consumption levels & patterns, and affordability to pay, and;
• To promote the efficient use of electricity.
22 According to a recent study of the World Bank Group entitled “L’électricité au service du développe-ment: Examen de l’action menée par le groupe de la Banque Mondiale pour promouvoir la partici-pation privée dans le secteur de l’électricité” by Rafael Domingez, Fernando Manibog and Stephan Wegner (2003), the management contract in most parts of the world have failed.

��
Table 24 shows recent tariff increases in the region including countries covered in this study.
Table ��: Recent Tariff Increases
Country Average Tariff Increase Year of Tariff Review Reason for Tariff Review
Ghana 326 % 1998 General tariff review
Zimbabwe 70% 2000 Annual tariff review
Uganda 56 % 2001 General tariff review
Malawi 35% 2000 Effect of foreign exchange adjustment
Kenya 25 % 1999 General tariff review
Ethiopia 26 % 1998 General tariff review
Eritrea 18% 2003 Annual tariff review
Namibia 10% 2001 Annual tariff review
Cameroon 7.5% 2004 Annual tariff review
Niger 6.0% 2002 Annual tariff review
S. Africa 5.5 % 2001 Annual tariff review
Sources: Pineau, 2005; Dube, 2005; Kayo, 2005; Habtetsion, 2005; Mamadou, 2005; Gboney, 2001; AFREPREN/FWD, 2001a; 2000c; Nyoike and Okech, 2001; Teferra, 2001; UEDCL, 2001; NER, 2000; NER, 2001.
While an increase in tariffs has affected the poor, however, in some countries, for example, Kenya, Uganda and South Africa, tariff reforms have provided provisions to ensure electricity is affordable for the poor. In Kenya for instance, the tariff structure provides for a life line tariff for the first 50 kWh aimed at the poor. The lifeline tariff is essentially below the true cost of delivery of electricity and therefore subsidized. In South Africa, the poor greatly benefit from a newly introduced tariff structure, which provides for free 50 kWh of electricity per month (Davidson and Mwakasonda, 2004).
3.2.2 New/Amended Electricity Act
In the countries covered under this study, the Electricity Act often provides the legal and regulatory framework. In these countries, the legal and regulatory framework was originally designed for state-owned or Government-regulated power utilities, with little or no provision for private sector participation. Recently, with the exception of Tanzania, all other countries covered in this study have amended their Electricity Acts leading to a number of important regulatory changes as shown in the following table (Table 25):

��
Table ��: Changes in the Legal and Regulatory Framework
Provision in the Electricity Act
Previous Legal and Regulatory Framework
New Legal and Regulatory Framework
Regulatory agency Regulation by the Ministry in conjunction with the public utility
Regulation by an independent regulatory body
Rural electrification agency Rural electrification programme administered by Ministry and/or utility
Rural electrification administered by an independent body
Licensing of IPPs: - For own use
- For sale to public utility
Application to Ministry through the public utility.
Nonexistent. Generation sole responsibility of utility.
In most countries by ERB. Others (e.g. Kenya) by Minister on advice from ERB.
Power purchase agreement approved by ERB.
Licensing of IPDs Nonexistent. Distribution sole responsibility of utility.
By the regulatory body.
Gazette of license application and license granted
Not mandatory since private power generation was licensed for applicant’s own use.
A requirement for the regulatory body (and in some countries the applicant) for applications and in some countries for license granted.
Tariff setting Proposed by public utility and approved by Ministry.
Proposed by utility and approved by the regulatory body. In some countries (e.g. Kenya) the regulatory body can also review tariff without request by utility.
Appeals and dispute resolution On a point of law, the law courts. The regulatory body, Minister, Arbitration tribunals and law courts.
IPPs – Independent power producers; IPDs – Independent power distributors
NOTE: In countries where there is no regulatory body established, the Minister concerned continues to be the main regulator.
Sources: Pineau 2005b; Habtetsion, 2005b; Dube, 2005b; Kalumiana, 2005b; Nyang, 2005b; Diarra, 2005a; Bassirou, 2005b; Sarr & Sokona, 2003, Kayo 2005b; Kahyoza 2005a; Tse, 2005b; NARUC, 2003; Government of Ghana, 1997; Government of Kenya, 1997; Government of Uganda, 1999; Government of Zambia, 1995; Federal Government of Ethiopia, 1997; Federal Government of Ethiopia, 1999
3.2.3 Establishment of Electricity Regulatory Agencies
As shown in Table 25, the establishment of independent regulatory bodies for the power sector alongside the amendment/enactment of new Acts is the second most popular reform options implemented in the countries under study. Available records indicate that the establishment of the Electricity Regulatory Agencies is a rapidly adopted reform option. For instance, by the end of 1997, only Ghana, Kenya, Malawi and Zambia had set up independent regulatory agencies. Since then, nine other countries have established regulatory agencies including Cote d’Ivoire, Uganda, Namibia, Zimbabwe, Niger, Mali, Eritrea, Cameroon, Burkina Faso and Senegal.
However, although the regulatory bodies are expected to be independent, past developments in some countries cast doubt over the autonomy of these bodies,

�0
notably in Kenya, Malawi and Uganda (Okech and Nyoike, 2001; Matinga, 2001 and Kafumba, 2001, AFREPREN/FWD, 2001a).
The problem of inadequate autonomy for the regulatory agencies can be traced back to the process of appointment of their board members. Apart from the Ghanaian regulatory agency whose process of board members appointment appears to be consultative and transparent (see Table 26), the board members in other regulatory agencies are Presidential and/or Ministerial appointees which inhibit the regulatory agencies’ autonomy.
��
23 At the time of writing this report, Act allowing for the establishment of the Regulatory Agency in Tanzania had been passed. However, the physical set up of the Agency is still pending awaiting ap-pointment of the required Board members and personnel.
Country No. of Members
Sector(s) Regulated Appointment of Board Members Primary source of funding
Degree of Autonomy
Ghana 7 Electricity,Petroleum, Water
By President in consultation with the Council of State
Parliament appropriation.
Autonomous
S. Africa* 7 (min) to 9 (max)
Electricity By Minister of Minerals and Energy, after public nomination process
Levies. Autonomous
Kenya 7 Electricity Chairman appointed by President, other members appointed by the Minister for Energy
Levies. Semi - autonomous
Malawi 13 Electricity By President Levies. Semi - autonomous
Namibia 5 Electricity By Minister of Mines and Energy Levies. Semi - autonomous
Uganda 5 Electricity.
By the Minister for Energy and approved by Cabinet
Levies. Semi - autonomous
Eritrea 5 Electricity By President Parliament appropriation and licensing fees.
Semi - Autonomous
Zambia 7 Electricity,Petroleum.
By Minister of Energy Parliament appropriation.
Semi - autonomous
Rwanda 8 Electricity, Gas, Water, Transport, Telecommunications & Waste management
By Prime Minister Parliament appropriation and licensing fees.
Cameroon 9 Electricity Government Levies Semi - autonomous
Table ��: Summaries of Electricity Regulatory Bodies in Sub-Saharan Africa
Sources: Electricity Acts of Ghana, Kenya, Malawi, Namibia, South Africa, Uganda, Eritrea, Zambia; IDURI, 2001; National Electricity Regulator (S. Africa) Website;; NARUC, 2003; Encodivoire.com, 200; Pineau, 2004
* A new energy regulatory body - National Energy Regulator of South Africa (NESRA) - is soon to be launched to regulate not only the electricity sector, but also the gas and oil sectors.

��
It is worth highlighting that regulatory bodies are necessary when the sector is open to several competing or closely complementary but independent actors. Unless these actors are themselves independent, one cannot expect the establishment of an independent and effective regulatory body. Therefore, further assessment of the various actors, their mandates, functions and ownership structures is proposed in order to better understand the role of the regulatory body.
3.2.4 Independent Power Producers (IPPs)
Independent Power Producers (IPPs) constitute an important form of private sector participation in Africa’s power sector. With demand outstripping supply in many African countries, independent power projects are becoming a major source of new power generation capacity in these countries. By the end of 2002, about 35% of the planned IPPs were operational. The balance were either in progress or their dates of implementation were not yet due. The status of more recent IPPs in selected sub-Saharan African countries is provided in Appendix 1.
In the region, except in a few countries such as Mauritius, reforms appear to favour large and centralised power projects. In spite of significant potential, IPP developments have not considered small to medium scale local private investments through decentralised options such as mini-grids and cogeneration in the sugar and wood industries.
In many African countries, power sector reform appears to have involved limited local private participation in IPP development. Current trends seem to indicate that, in the medium term, the exit of the state from electricity generation (and eventually from the entire electricity industry), would effectively hand over the industry to non-national operators. In political terms, this may be an unsustainable arrangement. Without significant local involvement, it is possible that reforms may be reversed in the future mainly because there would be no significant local stakeholder group.
Local private participation in IPP development has mainly been hampered by the emphasis on large-scale investment. In most African countries, the size of IPPs (both implemented and proposed) is greater than the prevailing installed capacity (largely from the state-owned utilities), an indication of heavy emphasis on large-scale investments. Large-scale IPP developments may have several drawbacks with regard to local private participation in the region.
Firstly, large-scale IPP development is generally a high-tech capital-intensive endeavour, which requires heavy capital investment, which dissuades local investors. Small-scale IPP development, for example, a cogeneration plant, involves technology that can easily be locally managed. In addition, the capital requirements are modest and can be sourced locally.

��
Secondly, large-scale capital-intensive IPP developments invariably attract the politically connected rent-seeking class. The controversial IPP projects in Zimbabwe involving YTL (a Malaysian company), in Tanzania involving IPTL (another Malaysian company) and Kenya are classic examples of the disarray that the rent-seeking class can cause. There could, therefore, be a case to examine smaller IPPs, which may be less capital intensive and would not attract the interests of the local rent-seeking class.
Mauritius provides a model example of the potential of local private participation in the power sector. About 40% of annual electricity generation comes from local privately-owned and operated bagasse-based cogeneration plants within the sugar industry (Veragoo, 2003). Overtime, the local bagasse-based cogeneration industry has made steady progress in technology development, starting with modest investments of about US$ 4 million in bagasse-based cogeneration power plants comprising of conventional low-pressure boilers with installed capacity in the range of about 10-15 MW. After steady growth, local private investors in partnership with foreign investors have recently made an investment of about US$ 100 million in a hi-tech high-pressure bagasse-based cogeneration power plant with an installed capacity of 70 MW (Quevauvilliers, 2001).
The Mauritian example demonstrates the potential financial and technical capability and viability of local private investors in IPP development. Appropriate policy and financial incentives could encourage the development of locally owned IPPs. The ideal entry point, as in the case of Mauritius, is likely to be renewable energy options such as bagasse-based cogeneration, mini/micro hydro, off-grid and photovoltaic that can be developed by IPPs and local organizations in a decentralized manner.
3.2.5 Independent Power Distribution
In the countries covered in the study and indeed in the sub-Saharan African region, very few independent power distribution (IPD) utilities have been established. The only countries where IPDs have been established are Namibia, Uganda, Cote d’Ivoire and Ghana. When coupled with the establishment of Rural Electrification Agencies (REAs), privatisation of distribution is likely to benefit the often forgotten urban poor whereas IPDs would cover urban areas while rural areas would be covered by REAs.

��
Box 2: Oshakati Premier Ltd
Oshakati Premier Electric (Pty) Ltd is a Namibian IPD that is touted to be a good model for the region. It is a 50/50 joint venture established in 2000 between the Oshakati Town Council and NamPower’s business arm Premier Electric (Pty) Ltd. The entity is governed by a Board of Directors and run by a management team appointed by the Board. Oshakati Premier Electric is committed to the development of the town on business and economic principles and is responsible for supplying power to the people of Oshakati, maintaining and upgrading the street and traffic lights, existing and future networks, as well as providing other related services including accounts payments, power applications, electricity tokens, etc.
3.2.6 Institutional and Regional Reforms
There are a number of important institutional reforms that have taken place in the region. First and foremost, the establishment of Electricity Regulatory Agencies has enable Ministries of Energy focus on policy development. Some of the policies developed have a direct bearing on the poor. For example, in most of the countries covered in the study, there are newly developed policies to enhance rural electrification through the establishment of Rural Electrification Agencies (REAs). The REAs have the mandate of implementing rural electrification programmes. Already there are operational REAs in Uganda, Zambia, Zimbabwe, Mali, Eritrea, Cameroon, Burkina Faso and Senegal.
Another important development is the establishment of power pools as well as the introduction of cross-border electricity distribution. These developments present clear opportunities to reduce the uneven geographical distribution of energy resources (especially hydropower) in the region, reduce dependency on importation of fossil fuel and improve energy security.
The earliest power pools in sub-Saharan Africa is the Southern African Power Pool (SAPP) was created in 1995 to spearhead regional energy trading through the development of interconnections and a coordinated generation expansion programme. The pool comprises the 12 SADC member countries (see map) represented by their national power utilities, all of which aim to optimize regional energy resources and support each other during emergencies.

��
Figure ��: Transmission Infrastructure and Interconnection of the Southern Africa Power Pool
Gabon
PlannedExisting
Pumped storage schemeHydro Station
Thermal Station
MbabaneSwaziland
Lesotho
Pretoria
Johannesburg
Cape Town
SouthAfrica
Gaborone
Botswana
Windhoek
Lilongwe
Malawi
Zimbabwe
Harare
Lusaka
Zambia
Luanda
Angola
Maputo
Mozambique
Dar es Salaam
Tanzania
NairobiKenya
Burundi
RwandaCongo
KinshasaBrazzaville
Congo
Namibia
H
H
H
HH
H H
H
H
H
HH
H
H
P
P
P
P
P
P
P
P
P
PP
P
P
P
P
T
TT
T
T T TTTT
T
T
T
T
T
T
Source: Dube, 2005
Chief executives of the participating utilities make up an executive committee that reports to SADC energy ministers. Meanwhile, senior managers from the transmission system operators, energy trading, planning and environmental divisions of each utility form a management committee that feeds planning, operating and environmental information into the executive committee. The pool sets rules that have to be adhered to by members in planning and operating their systems. This means that apart from meeting the national performance expectations and regulatory requirements within their respective countries, electricity utilities have obligations to meet requirements imposed by virtue of its membership of the Southern African Power Pool. The existence of the power pool has also influenced the performance of the power sector in some of the member countries.
For member countries, their membership to SAPP has meant that security of electricity supply is guaranteed though availability of imports from within the region. The countries also benefit from sharing generation reserves. This means that investments on capacity additions to meet reserves are minimized, as in contingency situations,

��
member countries can call for emergency supplies from other members of the pool. Noting the benefits of the SAPP, other power pools have since emerged in other regions of the continent such as the East African power poor and the West African power pool.
To sum up, full privatisation of generation and distribution, implying that all generation and distribution entities in the country are wholly private owned, has not taken place in any of the countries under study. Instead, privatisation of generation and distribution has mainly taken the form of partial private ownership of utility assets through equity, the awarding of concessions and management contract - which again very few African countries have implemented (see Figure 24).
Figure ��: Summary of Status of reforms in the various countries
Ele
ctric
ity In
dust
ry S
truc
ture
Competitive Generation and Distribution
Fully Unbundled Utility . Zimbabwe . Uganda
Multiple Generation with Single Buyer(Monopsony)
. Kenya
. Niger
. Senegal
. Mali
. Zambia
. Cameroon
. Cote d’Ivoire
. Tanzania
. Namibia
. Ghana
Monopoly(Vertically Integrated Utility)
. Eritrea
. Burkina Faso
Sector wholly owned and managed by Government
Public Corporations without management contract with private sector
Public Corporations with management contract with private sector
Sector wholly owned and managed by private sector
Source: Compiled by authors
Ownership changes /Management

��
However, while a significant number of countries are planning the sale of Government shares in the power utilities in the future, some countries such as Senegal and Mali24 have reverted back to state ownership from privatisation of their electricity utilities. There are important lessons that can be drawn from these developments. First and foremost, it appears that privatisation of the distribution appears to be more difficult to implement than privatisation at generation. Secondly, by examining well performing utilities in the region such as those in Zimbabwe, Mauritius and South Africa, it can be concluded that privatisation has its benefits but it is not the ultimate solution to good performance of the utility. The utilities in the aforementioned countries appear to have performed relatively well even without privatisation. Consequently, the development in Senegal and Mali might deter other countries in the region from privatising their utilities. Instead, the trend might be to implement other reform options that address specific challenges to the performance of the utilities.
24 Mali’s EDM, currently benefits from a public-private partnership between the Government of Mali and IPS of Aga Khan Group with share holding of 66% and 34%, respectively.

��
Chapter 4: Socio-Economic Impacts of Power Sector Reforms
The combination of low-income levels and inadequate access to cleaner energy sources such as electricity implies that the rural poor in sub-Saharan Africa face a vicious cycle. While traditional biomass energy is harmful to the poor who predominantly use it, their low incomes make it difficult for them to obtain electricity and other clean fuel services as well as limits the scope of income generating activities that they can be engaged in25. Consequently, the most rural people have to rely on biomass, which is harmful to their health, and which contributes to keeping them in a state of poverty (GNESD, 2003).
There are a limited number of studies assessing the socio-economic impacts of power sector reforms in sub-Saharan Africa. In part, the limited number of assessments on the impact of power sector reforms, especially on the poor, can be linked to the scanty and poor data on the electrification of the poor. Power utilities, Ministries/Departments of Energy and regulatory agencies appear not to keep track of electrification of the poor. Available data sets on electricity consumers do not specifically categorize the data according to income groups (“poor” and “non-poor”). The study, therefore, used proxies to distinguish the two groups. The proxy used for the poor is electricity data for rural areas. The rationale for using this proxy is that income and expenditure levels in rural areas are significantly lower than for those in urban areas. The rural-urban divide used in the report is also recognized by ECOWAS as an important poverty indicator in West Africa. This is because, among ECOWAS member countries, poverty levels are two to three times higher in rural areas than in urban areas (ECOWAS, 2005).
In essence, the report assumes that virtually all the inhabitants of rural areas in sub-Saharan African countries are poor. The authors, however, realise that this assumption has some limitations as it effectively ignores the urban poor and ignores the fact that not all rural households are poor. In addition, it fails to recognise that the majority of the rural population with access to electricity are probably not poor (Bailis, 2003).
Generally in sub-Saharan Africa, rural area dwellers are worse-off than their urban area counterparts. This can be demonstrated by comparing the welfare of these two broad sections of the population along the parameters of expenditure, income and proportion of those living under the World Bank defined poverty thresholds of $ 1 and $ 2 a day per capita. The parameters confirm that rural dwellers are on average poorer than urban dwellers. For example, rural households spend much less than their urban counterparts. Estimates from a Welfare Monitoring Survey conducted in
25 For the poor, up-front costs of electricity connection and associated electrical devices are often pro-hibitive.

��
Kenya shows that rural areas in Kenya have a mean monthly household expenditure of approximately US$ 63.82. The absolute poverty line for rural areas used by the same survey stood at US$ 94.8726. This is contrasted with urban figures, where the absolute poverty line stood at US$ 147.8027 against a mean monthly household expenditure of approximately US$ 151.56. This implies a significantly higher prevalence of poverty in rural areas, compared to urban areas where the mean household expenditure is above the absolute poverty line.
In assessing access to electrification, it is worth noting that the presence of electricity service in a residence does not by itself give the residents the ability to make use of the electricity28. If the electricity service being provided is not affordable by the residents, their access is limited. Thus, due consideration to the issue of the affordability of electricity service is of essence. It is recognized in this study that affordability is not only a function of the price of the electricity service, as affordability is influenced by people’s income
Based on the limited data available, the following discussion assesses the socio-economic impacts of power sector reforms. This discussion examines both positive and adverse impacts of power sector reforms.
4.1 Socio-economic Benefits of Power Sector Reforms
Access to low-cost electricity services can deliver significant economic benefits29 to sub-Saharan Africa especially among the rural poor. Notable benefits include (Clancy and Redeby, 2000; IEA, 2002):
• Enhanced income from agricultural products due to the establishment of agro-processing industries30 attracted by the availability of electricity in rural areas. Proximity to these industries encourages growth in agricultural production, which in turn increases the incomes of the rural poor.
• Rural electrification enables preservation of agricultural produce. This improves the income levels of the poor as access to electricity reduces post-harvest losses. For fishing communities, access to electricity can dramatically reduce volumes of spoilt fish as well as allow storage of fish for sale at times when prices are high.
26 This is calculated using Adult equivalent figures and an average household size of 4.827 This is calculated using Adult equivalent figures and an average household size of 3.528 Evidence from some countries with high access rates such as China and Venezuela show that high
access rates only does not impact significantly poverty rate29 In Namibia, a study noted that in newly electrified areas, small businesses were rapidly established
(Clark, et al, 2005).30 Examples include coffee factories, tea factories, food processing plants and milk coolers. Proximity
to milk coolers, for instance, could nearly double the income of the rural poor.

��
• Electricity in rural areas enables support services such as research laboratories and artificial insemination to be brought closer to the poor.
• Electrification of rural trading centres creates opportunities for job creation and income generation activities. For example, electrification enables establishment of welding, battery charging and electronics repair businesses. In addition, electrified trading centres can extend their hours of business thereby providing opportunities for the rural poor to increase their income.
Arguably, the majority of the rural poor may not directly benefit from electrification, as they cannot afford the cost of connection to the grid. However, they are likely to indirectly benefit from electricity services through enhanced services obtained from rural market centres, schools, health centres, water pumping and Government administration offices. Community participation in the electrification process is essential as it ensures ownership and commitment. They may also benefit from better returns on the cash crops that they produce. For example, in Kenya, the European Union recently concluded a project for electrifying rural coffee factories to minimize the cost of processing coffee. It is anticipated that by reducing the cost of coffee processing, the farmers (most of them who are relatively poor) will benefit from higher returns.

�0
Box 3: Benefit of Electricity to SMEs in Kenya
A recent survey conducted in Kenya indicates that the electrification of the rural areas have numerous benefits to the small and micro enterprises. The following are potential benefits of electricity services to the rural poor identified during the aforementioned survey:
• Value addition to agricultural and dairy products: Reduced post-harvest loses and improved processing of grains, milk, fish and fruits through wider use of electricity-powered machinery for grinding, cooling, and heating.
• Increased household incomes due to income generation activities that can be undertaken beyond daylight hours when electricity becomes available
• Small-scale businesses like hair-cutting, welding, battery charging that use electricity create more employment and reduce time wasted travelling long distances to access these services.
• Improved health and sanitation through provision of water pumped with electricity, refrigeration for health clinics, longer hours available for surgical operations and better access to more advanced health facilities.
• Mortuary services to be provided to local health facilities that will allow local communities adhere to their customs and cultures of honouring their dead for a number of days before they are buried.
• Medical and educational personnel are attracted to work and stay in the rural areas because of availability of electricity and associated modern services and communication facilities.
• Improved communication and educational media through electricity-powered radios, mobile phones and ICT.
• School lighting to allow evening classes.• Youths enjoying entertainment in Youth Centres powered with
electricity.• Electricity-driven water pumps allow women and girls to have more
time to undertake income generating activities and study because less time will now be spent fetching water from long distances.
• Electric-powered public lighting in market places, social centres and compounds improves security and reduces crime rates.
• Better safety through replacement of kerosene lamps/ wicks and candles that cause burns, accidents, house fires with safer electric lighting.

��
In South Africa, many of the rural population who cannot afford electricity directly to their residence can access the electricity services inform of other potential benefits that electricity can offer. Electrification of clinics and schools has resulted in significant benefits for communities, ranging from improved health-care service provision, battery charging and enabling schools to be involved in evening adult education as well as improving the efficiency of school operations, through use of equipment such as photocopiers and computers, longer study hour for children that has been indicated to have greater impact on their performance. In certain cases electric street lighting may have contributed to reduced crime levels.
An important positive outcome of power sector reforms is the establishment of Rural Electrification Agencies and associated Rural Electrification Funds. These have already begun delivering benefits to the rural areas in some countries. For example, in Zimbabwe, the Rural Electrification Agency (REA) established in 2002 has designed a program to expand rural electrification dubbed the Accelerated Rural Electrification Program with End Use Infrastructure Development. The programme covers the eight regions in Zimbabwe.
This programme provides a 100% electrification capital subsidy for the electrification of rural institutions that serve communities. Other electrification projects are given a 50% electrification capital subsidy and favourable repayment terms. The Accelerated Rural Electrification Program with End Use Infrastructure has made remarkable progress from the time of its inception to present. Table 27 below highlights the progress that has been made so far.
Table ��: Rural Electrification by REA - Case of Zimbabwe (Since �00�)
Type of Institution Total Electrified to date
Schools 1,625
Business Centres 718
Rural Health Centres 358
Government Extension Offices 235
Chiefs Homesteads 148
Small Scale Farms 453
Villages 369
Irrigation Schemes 85
Borehole/Dam Points 47
Others 191
Total 4,229
Source: National Electrification Statistics REA 2005; Mangwengwende, 2005

��
It can be seen that REA under the Accelerated Rural Electrification Program with End Use Infrastructure, has managed to electrify 4,229 institutions within a period of less than three years following the introduction of reforms. The benefits of the rural electrification in Zimbabwe are highlighted below.
Table ��: Benefits of the Rural Electrification in Zimbabwe
Institution Benefits
Rural schools • Improved education facilities such as lighting and clean water• Richer curriculum• ICT facilities• Better quality of life for teachers
Rural Clinics • Improved water and sanitation • Refrigeration• Improved health facilities includes X-rays and diagnostic machines etc• Reduced referrals of patients
Irrigation schemes • Increase in productivity in dry lands• Increase in crop variety
Rural Business Centres
• Increase in income generating projects• Increase in social services to the rural communities e.g. banks, recreational facilities etc
Villages • Improved lighting facilities enabling extension of working hours• Where electricity is used for cooking there is a clean form of energy and reduction in deforestation• Increase income-generating projects.
Source: Kayo, 2005; Mangwengwende, 2005
While increased access to electricity especially in rural areas is important, its affordability is widely recognized as an important impetus to economic development. Rural sub-Saharan Africa and low-income urban areas lack significant economic development not only due to limited access to electricity but also due to the fact that where access is not an impediment, its effective use in wealth creation is hampered by high electricity tariffs, especially during the post reforms period. In some of the countries covered in the study, reforms have made an attempt to address this issue.

��
Box 4: Social Tariff in South Africa
The South African Government has introduced a new policy providing for supplying free basic electricity services in the amount of 50kWh of free electricity to the poor in selected areas. It had some positive impact on poverty alleviation following the reduction in electricity expenditure. Consumers not connected to the electricity grid, such as those using solar systems, are also allocated up to R48 per month to offset the operational and maintenance costs of the systems.
The subsidy for the poor connected to the grid has started showing positive signs although the programme is still in its early stages. The results of an evaluation by the University of Cape Town show an increase in average monthly saving in household income of about ZAR 21.0 per person per month (UCT, 2002), a slight saving but one which can be significant in communities with limited monetary transactions. In some communities, it has been reported that about 30 per cent of the households have added lights in previously non-electrified rooms. It is also reported that some households started using appliances they owned but were not able to use before the programme was implemented. Responses to queries about the benefits of the electricity subsidy have been as follows:
• Able to use more electric light;• Able to cook more efficiently;• Able to use electricity for the whole month;• Able to use more electrical appliances;• Schoolchildren can study for longer periods with better lighting;• Able to use radio and television for longer periods;• Able to spend money saved from electricity on food;• Reduced indoor pollution due to fuel substitution; and• Reduced anxiety about electricity being an expensive source of energy.
However, this is a very recent development and additional studies may be required to assess the feasibility of the subsidy due to the significance of its impact on the Government’s coffers – the programme at present is costing the South African Government about ZAR 630 million annually.
Other significant benefits to the poor include reduction of upfront costs of electrification as well as the institution of levies on urban electricity consumers to finance rural electrification. However, a drawback for low-income electricity consumers with no pre-payment meters is that tariff reforms have introduced penalties for late payments as well as reconnection fees whenever the consumer is disconnected for non-payment.
In Zimbabwe, South Africa, Malawi, Kenya and Uganda, the electricity utilities have reduced the upfront costs to enable the poor afford connection especially for productive

��
uses. In Zimbabwe, South Africa and Malawi, use of low cost electrification options such as load limiters and pre-payment meters has led to significant electrification of the poor especially those in peri-urban areas. In addition, in most of the countries covered in the study with Rural Electrification Agencies (or agencies pending) such as in Kenya, Uganda, Zambia, Zimbabwe, Mali, Cameroon, Burkina Faso and Senegal, reforms have led to the urban consumers being levied to finance the implementation of rural electrification.
In some countries, subsidies on electrification infrastructure as well as cross-subsidies on electricity consumption have been introduced. Reforms, through the amended Electricity Acts, have provided for the establishment of Rural Electrification Funds to subsidize the cost of grid extension to the rural areas. In Senegal, cross-subsidies have been introduced to minimise the cost of electricity among domestic consumers especially the poor (Sarr, et al., 2003).
At the macro-economic level, while there is insufficient data to analyse the direct impact of power sector reforms on the economy, for example, on GDP, reforms might have indirectly impacted on the economy through enhanced power supply. In Kenya and Ghana, for example, IPPs have contributed to increased generation capacity, which has reduced load shedding, and power shortages in the industrial sector. Furthermore, reforms have contributed to job creation especially during the installation of IPPs and to a lesser extent in their operation. In addition, during commercialisation of the electricity utilities, some of the non-core activities have been outsourced to the private sector thereby providing additional opportunities for job creation. Where utility employees were inevitably laid-off, some utilities such as those in Zimbabwe and Kenya encouraged the affected former employees to form companies to compete for the outsourced activities.
Another important development with macro-economic benefits is that reforms have contributed to the profitability of electricity utilities. This is the case in Uganda, Zimbabwe, Kenya and Ghana. Profitability of the utilities is crucial for sustainability of the utilities. It also enables Governments to spend available resources on other social and economic needs such as on health, education and infrastructure. The Zimbabwean case provides a good illustration of how reforms contributed to the utility’s turnaround in financial performance (see Table 29).

��
Table ��: ZESA’s Performance Before & After Reform
Indicator 1990 1991 1992 1993 1994 1995 1996 1997 1998 1999
Self-financing ratio -112.0 -65.0 -102.0 -28.0 27.0 31.0 47.0 37.6 37.6 40.0
Debtor days 72 74 85 99 61 50 56 37 32 32
Note: 1992-1993 = Reform period for the utility
Source: ZESA, 1997; Mapako, 1998; Kayo, 2001
4.2 Adverse Socio-economic Impacts of Power Sector Reforms
Some of the most recent assessments of socio-economic impacts of power sector reforms especially on the poor include research studies carried out by the Global Network on Energy for Sustainable Development (GNESD), UNEP, World Resources Institute (WRI) and more recently by ESMAP. (See. Karekezi and Sihag, 2003: Wamukonya, 2003; Byrne & Mun, 2003; Fall & Wamukonya, 2003; Agbemabiese, Byrne & Bouille, 2003; Lash, 2002; Bouille, Dubrovsky & Maurer, 2002; Dubash & Rajan, 2002; Edjekumhene & Dubash, 2002: Clark, et al, 2005. Following an assessment of available empirical evidence, the studies by GNESD tentatively conclude that the current set of reforms have either had a neutral or adverse impact on the poor and should be redesigned especially if the reforms are to be justified under a poverty-reduction agenda (Karekezi and Sihag, 2003). This finding appears to concur with the assessments of recent ESMAP studies (see Clark, et al, 2005; Estasche, 2005) as well as others (albeit non-empirical) recently undertaken by UNEP and WRI (see Wamukonya, 2003; Byrne & Mun, 2003; Fall & Wamukonya, 2003; Agbemabiese, Byrne & Bouille, 2003; Lash, 2002; Bouille, Dubrovsky & Maurer, 2002; Dubash & Rajan, 2002; Edjekumhene & Dubash, 2002). The key negative impacts on the poor identified all the four sets of the aforementioned studies include:
• Reduction in electrification/connection rates31;
• Increased tariff levels; and,
• Decline in electricity consumption.
Perhaps the most outstanding social impact of power sector reforms is the inability of reforms to increase access to electricity among the poor after 15 years of reform! The results of an assessment of electricity access levels in the countries covered in this study by Estache (2005) corroborate the findings of the aforementioned empirical study carried out by GNESD. Both studies make a resounding conclusion that power sector reforms have not delivered electricity to the poor. To illustrate these findings, the following (Figure 25) graph compares electricity access levels between the poor and the non-poor. Invariably, almost the entire population of the non-poor in most 31 Refers to the pace of electrification.

��
countries enjoys electricity services whereas the poor appear to have no access to electricity at all.
Figure ��: �th Quintile – The Richest Population
5th Quintile - The Richest Population
Bur
kina
Faso
Cam
eroo
n
Cot
ed'
Ivoi
re
Gha
na
Ken
ya
Mal
i
Nam
ibia
Nig
er
Sen
egal
Tan
zani
a
Uga
nda
Zam
bia
Zim
babw
e
53 %
99 % 100 % 99 %
57 %
48 %
100 %
52 %
91 %
75 %
61 %
71 %
99 %
0 %
10 %
20 %
30 %
40 %
50 %
60 %
70 %
80 %
90 %
100 %
In most countries in the region, reforms appear to have failed to link increased electricity access to the poor and rural electrification to the overall strategy of improving the power sector performance. For example, the issue of licenses and concessions are not closely linked to the ability of the licensee/concessionaire to increase electricity access among the poor. In addition, the newly unbundled (and privatised) distribution utilities do not appear to have rural electrification targets that are linked to future tariff adjustments. Furthermore, even in cases where there exists explicit electrification targets entrenched in the concession of the private electricity distribution utility, such as in Cameroon, the targets have not been met. Worse still in Cameroon, the plight of rural households with electricity connections is uncertain as it is reported that the private electricity distribution utility might discontinue serving rural areas citing unfavourable returns (Pineau, 2005). It is unclear whether the role of the regulatory agency and the Electricity Act in terms of the responsibilities of the various players is explicit.
One of the outcomes of power sector reforms is the amendment of the Electricity Acts. A fundamental amendment to the Acts is the provision for enhancing rural electrification as a strategy for reaching the poor. However, a textual analysis of the

��
amended Electricity Acts in several countries indicates that most of the Acts do not provide new and innovative initiatives to ensure increased electrification of the poor. For example, the Ugandan Electricity Act appears to provide for a rural electrification agency resembling the conventional rural electrification programmes, which have been unsuccessful in other countries, such as Kenya and Zambia.
Consequently, nearly 6 years after the establishment of the Ugandan rural electrification agency through the aforementioned Act, the agency has not had any significant impact on rural electrification levels. By contrast, in Zimbabwe, the establishment of the Rural Electrification Agency (REA) has accelerated rural electrification. For example, in only 3 years, rural electrification levels in Zimbabwe have increased from 20% in 2001 to 25% in 2004 (Mangwengwende, 2005; Kayo, 2005).
The sequence of power sector reform measures in a number of African countries appears to have been detrimental to electrification of the poor, particularly in rural areas. With the exception of South Africa and Zimbabwe, initiatives aimed at increasing rural electrification in a several countries were started at the end of the reform process. By contrast, other developing countries such as Thailand, Bangladesh and Philippines, initiated reforms after establishing structures and mechanisms for increased electrification, particularly of rural areas, before embarking on large-scale privatisation (AIT, 2003; Sihag, Chaurey and Sihag, 2003). Eritrea is reported to be in the process of adopting rural electrification structures such as those in the aforementioned Asian countries on a pilot basis (Habtetsion, 2005).
Preliminary assessments indicate that reforms have resulted in increasing tariffs, and a reduction in cross-subsidies, in order to attract private investors in electricity generation and distribution.
Tariff increases associated with tariff reforms render electricity too expensive for micro and small businesses to afford. For households, tariff increases have resulted in the poor facing similar charges as the non-poor in some countries (see Figure 26).

��
Figure ��: Cost of Electricity to the End user in Kenya��
0
2
4
6
8
10
12
1993
1994
1995
1996
1997
1998
1999
2000
2001
Years
US
cts
Cost of Electricity (Non-poor) Cost of Electricity (Poor)
Act Ammended in December 1997
Source: Computed using data from KPLC, 1992; 1997; 2001/2002; Kinuthia, 2003
In some cases, increased electricity tariffs may have contributed to disconnections (including on a voluntary basis) among the rural poor. One such example is reported in Ghana where, in spite of making a remarkable increment in rural electrification levels, there is some anecdotal evidence that many rural households have discontinued the use of electricity due to their inability to service their electricity bill - partly attributed to the increase in the cost of electricity (World Bank, 2005). In other countries, such as in Zimbabwe, there is the possibility of removal of subsidies from electricity tariffs. However, according to a study on electricity expenditure in urban areas (Dube, 2003), poor households spent a higher proportion of their income on electricity than non-poor households (Table 29). Based on electricity consumption patterns and the available subsidies to domestic consumers, it was observed in the study that the removal of subsidies would negatively affect the poor. The study shows that the removal of subsidies would result in an increase in the share of electricity expenditure in total household income by 41 per cent for the non-poor, 87 per cent for the moderately poor and 77 per cent for the extremely poor (Table 30).
32 The end-user cost of electricity takes into account inflation at constant 1995 prices and foreign exchange losses.

��
Table �0: Electricity Consumption Patterns of Urban Households
Household Category Electricity consumption (kW)
Monthly cost as % of income
All households 426 6.4
Non-poor households 574 4.6
All-poor households 335 7.6
Moderately poor households 350 5.2
Extremely poor households 302 10.4
Adapted from Dube (2003)
Table ��: Significance of Electricity Subsidies
Household Category Electricity Cost Without Subsidy
(ZBD)
Subsidy Amount (ZBD)
Subsidy as % of Energy Expenditure
Subsidy as % of Total Income
All households 1,695 681 67 4
Non-poor households 2,285 662 41 2
All poor households 1,333 600 84 7
Moderately poor households
1,393 666 87 6
Extremely poor households 1,202 527 77 8
Source: Adapted from Dube (2003).
Box 5: Cost of Electricity Among the Poor in Mali
The Republic of Mali has one of the highest electricity tariffs in West Africa, notably for the Class 1 bracket (0 – 50 kWh per month), while the Class 2 and 3 brackets (51 – 100 kWh), are exempted from the VAT and other regulatory royalties. The normal connection fee depends on the type of meter, the power supplied and electrical consumption. For a single cable, 5 amperes meter, the subscription fee should have been US$ 8.50 in 2002. In reality, however, the actual fee demanded from a customer is in the order of US$ 166.60, irrespective of the customer’s consumption bracket. This can be explained by the fact that, in addition to the subscription fee for drawing electricity from the electrical grid, the customer (who receives no subsidy whatsoever) also has to pay for the materials used in connecting him to the electric grid. When one compares these fees with income and poverty levels in Mali, with a net annual national per capita income of around US$ 305. This situation has left some analysts wondering whether the poor have not been further marginalized by on-going electricity access reforms.

�0
Another important development with macro-economic implications is the fact that, in many countries in the region, power sector reforms appear to have marginalized local private investment in the power sector. Current trends seem to indicate that, in the medium term, the exit of the state from the electricity industry would effectively hand over the entire electricity industry to non-national operators. In the long-term, this may be an unsustainable arrangement. Without significant local involvement, it is possible that reforms may be reversed in the future (as already witnessed in Senegal and Mali) mainly because there would be no significant local stakeholder group. In addition, a well-thought-through strategy for local participation could provide the basis for developing a robust local private electricity industry. This may assist in reversing the drastic de-industrialisation of the region that has taken place over the last two decades.Local private participation, especially in IPPs, has mainly been hampered by the emphasis on large-scale investment. The total capacity of IPPs (both implemented and proposed) is greater than the prevailing installed capacity (largely from the state-owned utility), which is an indication of heavy emphasis on large-scale investments. For example, in a relatively small economy such as Swaziland currently with an installed capacity of 131 MW, an IPP nearly 10 times the existing capacity (about 1,000 MW) is envisaged in the short to medium term (Shongwe, 2005). However, there are examples in Zimbabwe and Mauritius that indicate that potential exists for local private investment in the power sector especially using small-hydro, wind and bagasse-based cogeneration and as long as the entry requirements are designed to accommodate local investors.To sum up, available data and information indicates that, among the countries covered in this study, very little electrification of the poor is taking place. Based on current trends, electrification for the poor is unlikely to take place in the foreseeable future. In addition, the current reforms in most countries do not seem to provide special incentives for the electrification of the poor. The poor also appear to be paying higher charges (certainly not significantly lower) for electricity than the non-poor, while the non-poor largely captures subsidies meant for the poor. Consequently, only a drastic transformation of power sector reforms could improve the situation and lead to greater electrification of the poor.The foregoing discussion highlights key negative economic impacts that reforms appear to have had on the poor. However, not all forms of reforms have been detrimental, especially to the electrification of the poor33. Reforms in several African countries have produced some benefits especially for the poor. The following section highlights these benefits.
33 Some of the reforms with anticipated positive impacts on the poor are yet to be implemented. For example, a number of the rural electrification agencies stipulated in the amended Electricity Acts are not yet operational.

��
Chapter 5: Environmental Impacts of Power Sector Reforms
One of the drivers of power sector reforms is to increase generation capacity through private investment. This means allowing Independent Power Producers (IPPs) to generate electricity. This development has a significant environmental implication, notably: Prior to reforms, in the countries covered in this study, most of the electricity generation came from non-fossil fuel-based sources, mainly hydro. However, this proportion is rapidly decreasing because most of the IPPs (implemented and proposed) are fossil fuel-based as shown in Figure 27. For example, recent estimates by AFREPREN show that only 37% of the total installed capacity of all the implemented and planned IPP investments are using environmentally friendly electricity generation options such as hydro, wind, bagasse-based cogeneration and geothermal (see Figure 27):
Figure ��: Proportion of Installed Capacity of IPPs By Fuel Used in Africa (�00�)
Fuel used by IPPs
Naptha2%
Gas25%
Other RETs21%
Diesel Oil17%
Hydro16%
Gas/Oil11%
Coal8%
Sources: Karekezi and Mutiso, 1999; Daniel, 2000a; Daniel,, 2000b; Daniel, 2001a; Daniel, 2001b; Daniel, 2001c; Daniel, 2001d; Marks,2002a; Marks,2002b; Marks,2002c; Marks,2002d; Marks,2002e; Marks,2002f; Marks,2002g; Marks,2002h; Marks,2002i; Marks,2002j; Marks,2002k; Marks,2002l.
Promoting proven environmentally friendly electricity generation options such as hydro, wind, bagasse-based cogeneration and geothermal can have a positive impact on the sustainability of the power sector.
First and foremost, they are modular in nature (i.e. they can be developed incrementally) and the consequent low and progressive nature of investment requirements makes

��
them particularly suitable for capital-constrained African countries. This implies that, if well designed, their implementation can be planned such that their development is in tandem with the growth in electricity demand - thereby minimizing incidences of power shortfalls and the attendant rationing of electricity supply.
Secondly, the significant growth in fossil fuel-based IPPs in numerous sub-Saharan African countries is characterised by an increase in the levels of imports of petroleum products - which account for a significant proportion of export earnings. Such high imports make countries in the region vulnerable to external oil price shocks, fluctuations in the exchange rates of hard currencies and have adverse implications for balance of payments as well as the associated tariff increments. Sustainable electricity generation options such as hydro, wind, bagasse-based cogeneration and geothermal could play a vital role in minimizing fuel imports by providing an alternative to fossil fuel-based electricity - thereby minimizing tariff increases. They also offer diversification in electricity generation, thus strengthening energy security. Furthermore, countries with natural gas reserves such as Cote d’Ivoire, Tanzania and Rwanda, IPPs should rely on this energy source which is environmentally-friendly.
Thirdly, diversification of electricity generation options by developing advanced, cleaner, more efficient, affordable and cost-effective energy technologies is of importance for the sector. However, electricity generation through large hydro in Africa has posed a clear and present threat to the sustainability of the power sector as it has proven unreliable. This is because hydropower is dependent on rainfall, and is therefore vulnerable to drought. Many sub-Saharan African countries have experienced serious droughts in the past, which have affected hydropower generation (see Table 32). Droughts are likely to become more frequent in the future.

��
Table ��: Drought and its effect on hydropower generation
Country Drought period Consequences
Uganda 2004/2005 Reduction in water levels at Lake Victoria resulting in reduction in hydro-power generation by 50MW
Kenya 1992 Failure of rains led to power rationing in April–May 1992
Kenya 1998–2001 Massive drought decreased hydro generation (25% in 2000), which had to be replaced by more expensive fuel-based generation. Power rationing in 1999–2001.
Lesotho 1992 Hydro operation limited to 6 months, leading to 20% reduction compared to 1991.
Malawi 1997–1998 Engineering operations affected by drought. Amount of hydro energy generated was 6% less than in years of normal rainfall.
Mauritius 1999 Massive drought led to70% drop in normal annual production of electricity.
Tanzania 1997 The Mtera dam reached its lowest ever level resulting in a 17% drop in hydro generation, use of thermal generation to meet the shortfall, and power rationing.
Zambia 1992 Poor rainfall resulted in a 35% reduction in hydro generation in relation to the previous year.
Zimbabwe 1993 Drought led to a drop of over 9% in energy production compared to 1992.
Sources: AFREPREN 2004; KPLC, 1999, 2001; LEC, 1993; CEB, 1999; ESCOM, 1998; TANESCO, 1997; ZESCO, 1992; ZESCO, 1993; ZESA, 1993; KenGen, 2000, www.irinnews.org.
However, wind, geothermal and bagasse-based cogeneration34 energy source are not reliant on rainfall and can therefore reduce the weather related risks associated with heavy reliance on hydroelectric schemes. For instance, in Kenya, during the drought period of 1998–2000, Kenya’s geothermal plants offered almost 100 per cent availability to cover base load deficits regardless of prevailing weather conditions while bagasse-based cogeneration was used to meet the power deficits caused by drought in Mauritius in 1999.
Finally, hydro, wind, bagasse-based cogeneration and geothermal plants tend to be located in remote rural areas, some of which have not access to electricity supplied by distribution utilities. Therefore, encouraging investment in these energy options appears to be an attractive option as it enhances opportunities for rural electrification.
A significant result of power sector reforms is the liberalization of generation, which has in turn opened up regional electricity trading. Consequently, a few IPPs have shown interest in constructing large-scale hydropower dams. This development has met severe resistance from environmental lobby groups citing potential environmental destruction associated with the proposed dams. Notable hydropower dams that have attracted significant attention of the aforementioned lobby groups are the proposed
34 However, if drought affects the growth of sugarcane it may in turn affect the level of electricity gen-eration using cogeneration.

��
200 MW Bujagali Dam by AES in Uganda and the 40,000 MW Inga Megadam35 in the Democratic Republic of Congo which Eskom hopes to take lead in mobilizing the financial investment (Vasagar, 2005).
However, the gap between the environmental lobby groups and hydropower developers appears to be reducing. There now appears to be a consensus between environmental lobby groups and developers that the key concern is whether specific dams are well designed to minimize negative environmental impacts. For example, the Inga Megadam can be developed with minimum environmental impact. This project may, for instance, be very attractive given its potentially low electricity generation costs compared to fossil fuel-based generation. Furthermore, refurbishment of existing hydropower plants can be undertaken to return them to full production without any significant environmental impacts.
On the other hand, there are also a number of IPP power plants that are environmentally-friendly. Notable examples include Ormat Inc. which operates a 100 MW geothermal plant (still under development) in Kenya and at 70 MW cogeneration plant operated by Compagnie Thermique de Belle Vue Limitee’ in Mauritius. Both power plants have very attractive environmental characteristics. For example, the geothermal power plant in Kenya incorporates a hi-tech air-cooling and the re-injection system of all geothermal fluid thereby avoiding an estimated 200,000 tons of CO2 emissions per year (Partnerships Central, undated). In Mauritius, the use of the cogeneration power plant is estimated to save about 45,000 tons of CO2 emissions each year (GEF, 2001).
In overall terms, one of the most significant environment-related outcomes of power sector reform is the amendment of the Electricity Acts in several African countries to provide for Environmental Impact Assessments (EIAs)36. Prior to the aforementioned amendments, new power generation installations were not required to conduct environmental impact assessments before carrying out new installations.
The requirements of the EIAs include the identification of potential environmental and social problems and the design of appropriate mitigation measures. Most African countries have instituted environmental policies (Table 33). This has had the effect of incorporating environmental and social costs which had hitherto been ignored to the disadvantage of environmentally benign sources. In the post-reform period, planners have devised means of incorporating the social and environmental costs in the planning process to ensure that these costs are incorporated in the project costs
35 Due to its enormous size, this project is like to be a state-led initiative. It may, therefore, not be a conventional IPP but is likely to involve private investors and have significant characteristics of an IPP.
36 It worth noting that the need to carry out Environmental Impact Assessments (EIAs) in energy and industrial projects was first recommended in Agenda 21 (Chapter 9 on Protection of the Atmo-sphere – 9.12(b) and 9.18(d)).

��
and ultimately by the consumers along the production and consumption chain. It can, therefore, be argued that reforms have partially contributed to the increase in the cost of power generation by incorporating social environmental costs which had previously been ignored by the power sector. This increase is associated with the tariff reforms discussed earlier in this document.
Table ��: The Status of EIA Policies Laws and Guidelines in the Region��
Country EIA policy Specific EIA (or framework) law
Regulatory Institution Number of Staff No. of EIA Completed
Malawi National Environmental Policy, 1996
Environmental Management Act, No. 23 of 1996
Ministry of Natural Resources and environment Affairs
3 professionals 82 EIAs between 1998 and 2002 in Infrastructure (including power), tourism and water projects)
Namibia National Environmental Policy, 1995
Environmental management Bill in progress
EIA Unit, Directorate of Environmental Affairs, Ministry of Environment and Tourism
1 professional, 1 donor funded assistant
82 EIAs completed between 1980 to 2002
Tanzania National Environmental Policy, 1997
Environmental Management Bill in progress
National Environmental Management Council (Vice President’s Office) administers EIA process, Local authorities are mandated to implement environmental policies and regulations
Unknown An estimated 26 EIAs have been completed since 1980.
Zambia National Conservation Strategy
Environmental protection and Control Act, No. 12 of 1990, and amended in Act No. 13 of 1994Regulations of 1997
EIA Directorate, Environmental Council of Zambia
5 professionals Since 1997, 134 projects briefs have been completed, of which 23 resulted in full EIAs in mining, power and infrastructure
Zimbabwe Environmental Impact Assessment Policy, 1994
National Conservation Strategy, 1987
Environmental Management Act, 2002
EIA Unit in the Department of Natural Resources, Environmental Management Agency being currently put in place
In the Department of Natural Resources 1officer and 8 regional assistantsIn the new Agency numbers not yet known
197 EIAs have been conducted since 1995
Source: The Southern Africa Institute of Environmental Assessment
On the other hand, amendments to the Electricity Acts have contributed to more environmentally friendly electricity generation. This is well illustrated in the case of Kenya’s (see following case study) geothermal installations by comparing the so-called Olkaria I - a pre-reform installation with Olkaria II and III which are post-reform installations.
37 It is important to note that most of the EIA policies, laws and guidelines in the region were enacted prior to power sector reforms and may therefore not have captured essential elements required for carrying out EIAs for the power sector.

��
Box 6: Case Study: Kenya
The environmental impacts of using geothermal power that are of concern include: air quality, water pollution, land disturbance, aesthetic or visual impacts, and noise emissions. Being within the Hale’s Gate National Park (HGNP) means that the issue of human disturbance or resettlement did not arise. However, with regard to disturbance to the fauna and flora, the experience from Olkaria I showed a minimal impact on the flora provided any disturbed sites were restored to as near their original states as possible. Olkaria II and III have made major improvements in respect of possible disturbance to the flora in accordance to the Electricity Act of 1997, which clearly stipulates the provisions for the environmental assessments before construction. By piping and re-injecting all wastewater rather than using open ditches, as was the case with Olkaria I, the new approach in Olkaria II and III prevents new vegetation from colonising the neighbouring areas. This issue is discussed further in the following paragraph.
The visual impacts associated with the power plant itself and the steam gathering pipes, of which there are considerable lengths, have been minimised by using a colour scheme that blends in with the surroundings. The purpose of this is to maintain the natural beauty of the Park. The EIA report indicates that this has not affected tourist activities in HGNP adversely. The socio-economic and environmental impact in this regard can therefore be considered neutral.
With regard to air quality, the gaseous emissions from geothermal power production that are of interest in this context are mainly carbon dioxide - CO2 (96%), hydrogen sulphide - H2S (~4%) and tiny quantities of hydrogen - H2, methane - CH4 and nitrogen - N2. The most hazardous of these is hydrogen sulphide of which the ground level concentrations in the Olkaria area have been determined in the EIA for the Olkaria II and III project to be below hazardous levels for workers and the local population. Further the design for Olkaria II and III projects will result in better dispersion of the gaseous emissions than was the case with Olkaria I.
The disposal of residual waters for Olkaria II and III project is by re-injection through re-injection wells into the geothermal reservoir, which is a vast improvement over disposal into gullies and natural water ways as practiced in the Olkaria I project. Re-injection ensures that the spent brine does not come into contact with surface water consumed by humans and livestock; further it cannot alter the natural composition of surface waters and upset the natural balance of the local eco-system. A further advantage of re-injection is the recharge of the reservoir and maintenance of reservoir pressure and steam rates over a longer period of time.
These two cases serve to illustrate the major departure in the way electric power is produced and supplied in the two eras: with the Olkaria I project illustrating pre-reform practices and Olkaria II and III projects illustrating post-reform practices. It is apparent that the reform process has had a markedly different and positive impact on the environment.

��
Box 7: Case Study: Cameroon
The milestone of the Cameroonian environmental policy is the 96/12 environmental law, enacted in August 1996 (see Republic of Cameroon, 1996). It is in this law (article 17) that requirements for an environmental impact assessment (EIA) are established for every important project. The Ministry of Environment and Forestry (MINEF) is responsible for the environment and the application of this law. However, in the 1999 decree creating ARSEL, it is explicitly mentioned that the regulatory agency has the responsibility to monitor the application of environmental regulation (article 3). In practice, this means that ARSEL has the responsibility to ensure that EIAs are prepared for all new power projects. Since few new projects have been developed after the reform, its environmental impact can only be limited. The
followingdiscussionreviewsthetwomainpowerprojectsthathavebeenimplementedsince2001;Limbéheavyfuel
oil85MWpowerproject(ledbyAES-Sonel);and,theLom-Pangar51MWhydroelectricdampowerproject(ledby
theGovernmentofCameroon).
The Limbé power plant is the first major addition to the generation capacity of Cameroon since the 1996 environmental law and 2001 privatisation. AES-Sonel hired the American consultants Black & Veatch to undertake the EIAs and write the environmental impact statement (EIS) for this project. The EIS was completed in 2003 (see AES-Sonel, 2003a for the main text and AES-Sonel (2003b) for the appendices).** The EIS was made according to guidelines of potential lenders for this project: the World Bank’s IFC, the European Investment Bank (EIB), Proparco, EAIF and FMO. Eventually, EAIF and the FMO financed the Limbé power plant project, commissioned in September 2004.
The EIS for the Limbé power plant is an exhaustive 288-page document, with almost equally long appendices, covering the background of the project, its possible alternatives, the baseline conditions (social, natural and physical environment), the technical description of the project itself, the public consultations undertaken, the impacts and mitigation measures for the construction and operations of the project, its decommissioning and the proposed environmental action plan.
TheLimbepowerplantishailedforitscontributiontoreducingCameroon’sdependenceonhydroelectricpower.The
plantisalsoconsideredanexceptionally‘clean’oil-firedpowerplantasitmeetsEuropeanenvironmentalrequirements.
TheexhauststackhasevenbeenelevatedtocomplywiththeseEuropeanregulations(FMO,undated).
Plansareunderwaytoconstructagas-firedpowerplant.Thegas-firedthermalpowerplantisveryattractive,asitwill
contributetoreducinggasflaringifthegasassociatedwithoilproductionisused.
For the Lom-Pangar 51 MW hydroelectric dam power project, the Government of Cameroon acts as the promoter of the project. A consortium of consulting firms (ISL-OREADE-BRECHE-SOGREAH) is in charge of the EIA, under the direction of an independent panel of experts. The panel is composed of international environmental and hydroelectric experts and ensures the reliability of the EIA. The EIA is made to satisfy the requirements of the 1996 environmental law, of the World Commission on Dams and of potential lenders such as the World Bank, European Union development agencies, the African Development Bank, etc. (Independent Expert Panel, 2004:58). The EIA will cover equivalent issues to the ones covered in the Limbé EIA.
ARSELandtheWorldConservationUnion(IUCN)aretechnicalpartnersinthisprojectthatstartedinDecember2003,
whilefinancialpartnersaretheGovernmentofCameroonandtheFrenchandGermandevelopmentagencies(UICN-
BRAC,2005).Theconstructionofthedamissettostartin2006,foroperationsstartingin2010.However,ARSELhas
acquiredlimitedexperienceinenergyregulationsinceitscreationin1999andhasevenlessexposuretoenvironmental
issuesintheenergysector.Thisweakenstheregulator’sabilitytoenforceenvironmentalregulation.
** Surprisingly, these documents (AES-Sonel, 2003a and b) are not available on AES-Sonel website nor on any government of Cameroon website, but on the World Bank Documents & Reports website (www-wds.worldbank.org).


��
Chapter 6: Lessons Learnt and Key Findings
Based on the discussion and analysis presented in the foregoing chapters of this report, several findings emerge. One of the key findings is that power reforms were not explicitly designed to ensure sustainability of the power sector. It is, therefore, not surprising that reforms have marginally contributed to the sustainability of the power sector. Reforms were primarily designed to bridge short-term generation shortfalls and enhance the financial health of state-owned power utilities. However, assessing the socio-economic and environmental impacts of reforms - the two key factors of the sector’s sustainability - it largely appears that reforms have not produced significant positive outcomes, as indicated in the following discussion highlighting the lessons learnt as a result of the Stakeholders’ Dialogue Forum38 held in 2005 and key findings of the study.
Lessons Learnt
Perhaps the most important lesson learnt is that reforms do not appear to have solved the power sector’s problems. With the exception of increased profitability of the utilities, key issues that provided the impetus for reforms continue to prevail long after reform have been implemented. For example, generation capacity shortfalls still persist in most sub-Saharan African countries. Furthermore, several countries have put in place the requisite reform measures but that has not guaranteed the desired results. Good examples of such countries include Cameroon and Malawi. In Malawi, for instance, in spite of the reforms in place, not a single independent power producer has invested in the country (Mloza-Amri, 2005).
Another important lesson learnt is that private sector involvement in the power sector is not the ultimate solution. Developments in the management contracts in Mali, Senegal, Cameroon and to a lesser extent Cote d’Ivoire indicate a significant degree of dissatisfaction in the private sector involvement. In Mali and Senegal, for example, the involvement of the private sector in the power sector has been reversed.
Sub-Saharan African countries that have implemented power sector reforms, especially privatisation, at a slower pace appear to have produced better results than those that have carried out reforms in a rush. This is another important lesson. Zimbabwe, Ghana, Botswana, South Africa and Mauritius are good examples of countries that
38 The Forum was co-hosted by UNECA, UNEP and UN Department of Social and Economic Af-fairs (UNDESA) and was held on 15-16 December 2005 in Addis Ababa. It was attended by energy experts and senior representatives of regulators, Energy Ministries and power utilities. The participants were drawn from the AU, African regional economic communities (ECOWAS, SADC and COMESA) and from Ethiopia, Lesotho, Malawi, Mali, Namibia, Nigeria, Senegal, Sudan, Swaziland, Tanzania, Uganda, Zambia, Zimbabwe, Kenya, Ghana, Cote d’Ivoire, Cameroon and Burundi.

�00
have not rushed into privatisation of their power sector. In these countries, the power sector has performed relatively well particularly in terms of increased access to electricity among the population, including the poor. Other countries such as Kenya, Uganda and Malawi where reforms appear to have implemented in a hurried fashion, the outcomes have not been satisfactory. In Kenya and Uganda, reforms have, for instance, let to a significant increase in tariff levels as well as stagnation and indeed reduction (e.g. Uganda) in the electrification levels.
Another important lesson learnt is that Government involvement and commitment in the reform process is critical, especially with regard to providing long-term strategies for the power sector. Invariably, countries that have implemented reforms at a slower pace appear to be those with long-term strategies and the commitment to realize the set objectives. In South Africa, Zimbabwe and Ghana for example, their long-term strategy includes significant rural electrification. In these countries, Government involvement and commitment has been significant and it is only after achieving relatively high rural electrification levels have they begun privatising their power sector.
Finally, an important lesson learnt is that it is possible to separate rural electrification and electrification of the poor from utility reform. However, rural electrification and the electrification of the poor cannot be alienated from power sector reform. As discussed earlier in this report, it is only in countries where power sector reforms have been designed to carry out privatisation in parallel or after undertaking massive electrification of the population that have produced desirable outcomes. Examples include Ghana, South Africa, Mauritius and Zimbabwe.
Key Findings
This study regarded socio-economic impacts of reforms (especially electrification of the poor) as an important indicator of the power sector’s sustainability. In overall terms, socio-economic impacts of reforms on the poor appear to be negative or neutral. This is because, first and foremost, electrification of the poor was not significantly addressed in the reform process and was, in several cases, almost an afterthought with the exception of Cote d’Ivoire, Cameroon, Malawi, Burkina Faso, Senegal, Zimbabwe, South Africa and Mauritius. As a result, electrification levels of the poor (especially in rural areas) in many reforming sub-Saharan countries, except in the aforementioned countries, have either stagnated or declined altogether.
However, in urban areas, reforms appear to hold some benefits for the urban poor. In countries where there exists a separate Electrification Agency such as in Uganda, the advent of independent power distributors appears to provide an opportunity for the electrification of the often forgotten urban poor as in such a case IPDs’ mandate includes the expansion of electricity services to the peri-urban.

�0�
Secondly, while reforms have led to the establishment of rural electrification funds and boards, these developments have not helped to increase electrification levels. In part, this is because the rural electrification funds and boards have not provided effective and innovative mechanisms that would ensure they achieve their objectives. Their design appears to have largely replicated that of past (and failed) mechanisms. Consequently, the rural electrification funds and boards have very little to show in terms of electrification of the poor. This assertion is well demonstrated by the comparison between Uganda and Zimbabwe where in Uganda no significant progress in terms of electrification of the poor has been reported 6 years after the advent of the Rural Electrification Authority while in Zimbabwe, in only 3 years, rural electrification levels rose from 20% to 25%.
Another important finding with regard to the impact of socio-economic impact of reforms on the poor is the increase in the cost of electricity and the associated reduction or removal of subsidies for the poor. Tariff increases were motivated by the desire to improve the financial health of the state-owned utilities as well as to attract private investors. While these are desirable attributes as far as the sustainability of the power sector is concerned, however, placing a heavy financial burden on the poor to the extent of leading to disconnections (e.g. in Ghana) is neither desirable nor does it contribute to a sustainable power sector. It is for this reason that the World Bank has in its recent study on subsidies for the poor, advocated for continued subsidization of the poor, however, more targeted (Komives, et al, 2005). Furthermore, with the exception of Malawi, Zimbabwe and South Africa, there is little evidence of power utilities introducing low cost electrification options at a significant scale to minimize the cost of electricity among the poor.
It is also important to note that, in part, the involvement of IPPs has led to aforementioned increase in tariffs. Based on the experiences of Kenya and Ghana, this is mainly due to three key reasons: Firstly, most of the IPPs use fossil fuel based electricity generation plants39. Therefore, the high and rising cost of fuel has been transferred to the consumers. Secondly, a significant number of IPPs have been invited in on an emergency basis thereby escalating the cost. Thirdly, the licenses and Power Purchase Agreements (PPAs) issued to the IPPs appear to have a short time span leaving IPPs with no choice but to ensure that they recover their investment costs and make attractive returns within the limited time. In Kenya, for instance, the selling price of electricity from one IPP fell by about a half when the license and PPA was renewed but for a much longer period.
39 It could be that most IPPs favour fossil fuel based electricity generation due to the fact that fuel sup-ply is borne by the host government (i.e. through a Fuel Supply Agreement) and the lead-time for developing thermal power stations, including return on investment, is shorter than for a hydropower plant for example.

�0�
The power systems in the region have over the past few years been overstretched due to a shortfall in generation capacity to match growing demand. The general response to the unfolding crises has been to increase generation capacity by allowing IPPs into the sector. In extreme cases where generation from IPPs has still not been sufficient to meet demand, load shedding has ensued (e.g. Tanzania and Uganda). This has led to significant loss to the economy and has generally pushed up the cost of electricity, as electricity generated from IPPs has not been cheap. However, an effective way of reducing the gap between electricity supply and demand is by encouraging efficient use of electricity - an option that has not received adequate attention in the region.
Another key finding is that, in many countries in the region, power sector reforms appear to have marginalized local private investment in the power sector. Current trends seem to indicate that, in the medium term, the state will be effectively handing over a significant share of electricity industry to non-national operators. In the long-term, this may be an unsustainable arrangement. In part, local private participation, especially in IPPs, has mainly been hampered by the emphasis on large-scale investment. However, there are examples in Zimbabwe and Mauritius that indicate that potential exists for local private investment in the power sector especially using decentralized energy systems based on small-hydro, wind, solar, and bagasse-based cogeneration and as long as the entry requirements are designed to accommodate local investors.
With regard to the financial sustainability of the electricity utilities, reforms appear to have largely met the objective of turning electricity utilities into profitable entities. Good examples include Ghana, Zimbabwe, Kenya and Uganda. This is important as it ensures that the resources that previously went into salvaging the utilities are utilized to meet other social and economic needs such as health, education and infrastructure. Furthermore, have reforms also provided for a more sustainable financing mechanism for rural electrification through the introduction of a levy mainly imposed on urban electricity consumers.
The environmental impacts of power sector reforms and the extent to which they have contributed to the sustainability of the power sector are discussed below. One of the key findings is that the amendments of the Electricity Acts have partially contributed to the sustainability of the power sector by ensuring that Environmental Impact Assessments are carried out prior to major electricity generation, transmission and distribution installations. However, the amended Acts are silent on environmentally unfriendly installations that were established prior to the new Electricity Acts.
Another key finding highlighted in this study is the worrisome trend in many countries, except for Zimbabwe, Kenya and Mauritius, whereby the share of IPPs generating electricity from sustainable energy sources such as hydro, solar, wind, geothermal40
40 The most promising geothermal resources are concentrated along the Rift Valley in the eastern Afri-can region and may therefore not be applicable to countries in other regions of Africa.

�0�
and bagasse-based cogeneration, is declining41. If this trend continues unabated, it will not only imply an increase in the level of greenhouse gases emissions from the energy sector in sub-Saharan Africa, it may also lead to an increase in the cost of electricity thus affecting the poor negatively as discussed earlier.
Another key finding is that major concern has been raised over the development of large-scale hydropower plants, especially the proposed Bujagali Dam in Uganda42. Environmental lobby groups in the region have put up a substantial amount of resistance citing potential environmental destruction associated with the proposed dams. However, although environmental lobby groups appear to gradually accept well-designed hydropower dams, continued resistance might, in part, affect the sustainability of the hydropower sector.
Being in charge of regulating the newly reformed power sectors in the respective countries, the performance of the Electricity Regulatory Agencies was assessed. Preliminary findings of this assessment indicate that the regulatory agencies have done little to ensure the sector’s sustainability. In part this is attributed to the weakness of the regulatory agencies to enforce the Electricity Act as a result of two key factors: Firstly, the electricity regulatory agencies are relatively new entities and have, therefore, not built significant capacity (e.g. Cameroon). Secondly, in some instances, even where capacity exists, the ability of the regulatory agency to perform its duties has been compromised by its lack of the requisite independence as a result of politically motivated appointments of the members of the respective agencies’ boards (e.g. Kenya and Malawi). The fact that limited intervention has been made by the regulatory agencies to protect the poor from negative impacts of the high cost of electricity and ensuring their electrification is a clear indication of the regulatory agencies’ disinterest among the poor.
Furthermore, the regulatory agencies have done little to promote an environmentally sustainable power sector by reviewing electricity generation options. For example, there is no indication of regulatory agencies setting specific targets for the share of electricity generated from renewables energy technologies. In addition, with the exception of Mauritius, the regulatory framework in most of sub-Saharan African countries does not provide for attractive tariffs to sustainable energy generation options such as small-hydro, wind, bagasse-based cogeneration and geothermal.
41 Where favourable wind regime exists, IPPs can also invest in wind farms like in Morocco and Egypt. Small hydro-based IPPs may not be difficult to finance because of they have lower risks than large hydro which has high risks associated with long lead-time for project implementation.
42 The case of Grand Inga hydropower scheme is significantly different from other hydro projects in that nobody is opposed to its construction as long as it is based on environmentally-friendly design. It involves the mobilization of more than US$50 billion and a regional/continental market for the energy produced.


�0�
Chapter 7: Policy Strategies for Making Power Sector Sustainable
Having examined the extent to which reforms have contributed to the sustainability of the power sector in the previous chapter, this section proposes possible policy strategies by highlighting opportunities and options for making the power sector sustainable by focusing on three key issues: Enhancing access to electricity among the poor; Technical Options for Improving Access to the Poor; Ensuring the use of environmentally-sound electricity generation options; and, Addressing gaps and barriers in the legal and regulatory framework.
7.1 Enhancing Access to Electricity among the Poor
The need for enhancing access to electricity among the poor cannot be overemphasized. In sub-Saharan Africa, the poor - especially in rural areas, form the majority of the population. Therefore, access to electricity is likely to widen their scope of income generating opportunities. There several options for enhancing the poor’s access to electricity and these are discussed below.
Sequencing reforms: Sub-Saharan African countries whose reforms are not at advanced stages should ensure that they establish structures and mechanisms for increased rural electrification before embarking on large-scale privatisation reforms. Evidence from Ghana, Zimbabwe, South Africa, Mauritius and other developing countries indicates that higher levels of access to electricity among the poor, especially in rural areas, have been achieved when rural electrification initiatives precede major market oriented reforms such as privatisation.
Linking electrification targets to contract renewals REAs Board Members: The newly formed rural electrification agencies should have specific targets for electrifying the poor. This should be enforced through making the targets as part of the agencies’ annual reporting as well as renewal of the contracts of the board members as well as the executive employees of the agencies. A similar system is already in place in Kenya through the newly instituted performance contracts for public institutions including key officials in Ministry of Energy and the Heads of the electricity utilities.
Linking electrification targets to licenses renewals and tariff increments: The electricity regulatory agencies could also enforce the electrification of the poor through linking set targets to issuance of licenses and concessions to electricity distribution utilities. Linking the number of connections to licenses and concessions is critical to ensuring the electrification of the poor. This approach has successfully been implemented in the licensing of mobile telephone operators in Kenya. The licensing

�0�
of the operators is based on, among other prerequisites, a demonstration of the firm’s ability to significantly increase the number of mobile telephone connections and areas of geographical coverage. The license awarded to successful operators includes a target number of new connections and geographical coverage over a specified period. Subsequent renewal of the operator’s license largely depends on the extent to which it meets the target indicated on its license (CCK, Personal Communication, 2003). As a result of stringent regulatory enforcement, mobile telephony in has dramatically increased and has also lead to enhanced access and affordability of communication services among the poor. Kenya now registers one of the highest penetration rates in Africa in mobile telephony (Tse, 2005).
In addition, to ensure that the poor’s access to electricity is sustainable, the regulatory agencies should ensure that tariff increments do not adversely affect the poor by providing for subsidies as well as encouraging utilities to utilize low cost electrification options.
7.2 Technical Options for Improving Access to the Poor
To ensure increased access to the poor at an affordable cost, low-cost electrification options are an ideal solution. Some African countries have already adopted low-cost electrification options. South Africa, Zimbabwe, Uganda, Botswana, Cote d’Ivoire, Malawi, Gabon, Eritrea, Morocco and Tunisia are case examples of countries that have successfully adopted low cost electrification options. These options include the following:
Longer distances between distribution transformers: In Kenya, a standard of 600 metres is used irrespective of consumer density or load demand. By contrast, Uganda’s transformer locations are determined on a line-by-line basis depending on current and future demand growth. In rural Uganda where demand is low and characterized by slow growth, distances between transformers of up to 1,000 meters are common. Optimal design criteria should therefore be adopted in this project without ignoring voltage drop problems.
Single pole transformer mounting: Another possible option for lowering the costs of rural electrification is to mount smaller transformers serving rural communities on single pole structures. These will not only reduce the number of poles but also eliminate the need for other components like cross-arms, as well as reduce associated labour and transport costs. This option is already in use in several sub-Saharan African countries such as Uganda, Zimbabwe and Kenya.
Shorter, smaller and fewer poles may also be used in some rural areas subject to design criteria such as climatic conditions, terrain and safety factors. On average, for grid extension, extra poles are often required for a distance of more than 30m.
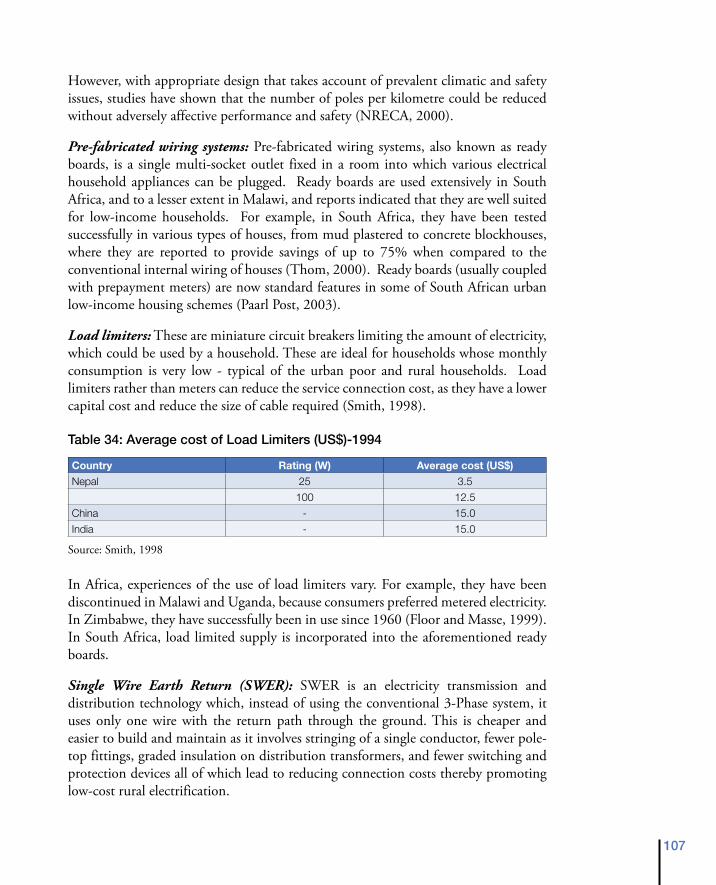
�0�
However, with appropriate design that takes account of prevalent climatic and safety issues, studies have shown that the number of poles per kilometre could be reduced without adversely affective performance and safety (NRECA, 2000).
Pre-fabricated wiring systems: Pre-fabricated wiring systems, also known as ready boards, is a single multi-socket outlet fixed in a room into which various electrical household appliances can be plugged. Ready boards are used extensively in South Africa, and to a lesser extent in Malawi, and reports indicated that they are well suited for low-income households. For example, in South Africa, they have been tested successfully in various types of houses, from mud plastered to concrete blockhouses, where they are reported to provide savings of up to 75% when compared to the conventional internal wiring of houses (Thom, 2000). Ready boards (usually coupled with prepayment meters) are now standard features in some of South African urban low-income housing schemes (Paarl Post, 2003).
Load limiters: These are miniature circuit breakers limiting the amount of electricity, which could be used by a household. These are ideal for households whose monthly consumption is very low - typical of the urban poor and rural households. Load limiters rather than meters can reduce the service connection cost, as they have a lower capital cost and reduce the size of cable required (Smith, 1998).
Table ��: Average cost of Load Limiters (US$)-����
Country Rating (W) Average cost (US$)
Nepal 25 3.5
100 12.5
China - 15.0
India - 15.0
Source: Smith, 1998
In Africa, experiences of the use of load limiters vary. For example, they have been discontinued in Malawi and Uganda, because consumers preferred metered electricity. In Zimbabwe, they have successfully been in use since 1960 (Floor and Masse, 1999). In South Africa, load limited supply is incorporated into the aforementioned ready boards.
Single Wire Earth Return (SWER): SWER is an electricity transmission and distribution technology which, instead of using the conventional 3-Phase system, it uses only one wire with the return path through the ground. This is cheaper and easier to build and maintain as it involves stringing of a single conductor, fewer pole-top fittings, graded insulation on distribution transformers, and fewer switching and protection devices all of which lead to reducing connection costs thereby promoting low-cost rural electrification.

�0�
Although in Africa the current status of SWER systems is unknown, they are reported to have been implemented in Botswana, Cote d’Ivoire, Gabon, Morocco, Uganda, Eritrea and South Africa (Habtetsion, 2005; Chapman, 2001; Da Silva and Kyokutamba, 2002; Armstrong, 2002). SWER systems are popular in rural Australia where nearly 200,000 km of SWER lines are already in use (Floor and Masse, 1999).
In spite of a number of inherent disadvantages are associated with the SWER option (for example, problems with load balance on the primary distribution line, restricted load capacity, and the inability to provide a three-phase supply), there are many advantages to using SWER in sparsely settled areas, for instance (Chapman, 2001; Armstrong, 2002; Rural Power, 2002):
• Low capital cost — through fewer conductors, fewer pole-top fittings, graded insulation on distribution transformers, and fewer switching and protection devices. Although every new project will vary, savings of up to 30% per customer are common for long, lightly loaded feeders.
• Simplicity of design, which allows for speed of construction. This particularly applies to the stringing of a single conductor.
• Reduced maintenance costs, because there is only one conductor and no cross arm.
• Fewer bush-fire hazards, because conductor clashing cannot occur in high winds.
Reduced conductor sizes: Due to the low power demand in rural areas, it is sometimes possible to use smaller sizes of conductors. Smaller conductor sizes imply that they cost less hence could contribute to lowering the overall costs of rural electrification. Technologies such as aerial bundled conductors have been used to reduce the cost of distribution networks by as much as 15% in Zimbabwe (Dube, 2003).
High-mast community floodlights: Though not well documented, in South Africa and Zimbabwe, high-mast floodlight systems are prevalently used for providing light to centralized groups of households especially in low-income urban areas43. For the proposed intervention, this application can be used in the project areas to provide lighting in market places and fish landing sites. These would have the positive impact of extending useful hours of operation for the community, thus leading to higher household incomes that in turn, reduce levels of poverty. In addition, area floodlighting improves security.
Equipment standardization: Standardising equipment lowers costs as it allows for bulk procurement of parts and components for rural electrification.
43 In Kenya, a pilot programme is underway to use high-mast community floodlights to light up slum areas in Nairobi.

�0�
A possible option of minimizing the cost of electricity among the poor is by providing subsidies to cushion them from the impacts of the high tariff increases triggered by reforms. However, available data on subsidies indicates that the non-poor are absorbing most of the subsidies. This is well illustrated by the Ugandan case where more than 90% of the total electricity subsidies are captured by the non-poor. In Kenya, however, the Electricity Regulatory Board plans to revise policies pertaining to electricity tariffs and tariff structure to ensure that subsidies are better targeted and largely captured by the poor.
Table ��: Estimation of Subsidies Distribution in Uganda (����)
Indicator Value
Total amount of subsidy (Ushs) 7,725,246,270
Total domestic electricity consumption (kWh) 307,100,000
Average subsidy per unit (Ushs/kWh) 25.16
Electricity consumption by poor (kWh) 21,200,000
Estimated subsidy captured by poor (Ushs) 533,392,000
Estimated proportion of total subsidy (%) 6.90
Electricity consumption by non-poor (kWh) 285,900,000
Estimated subsidy captured by non-poor (Ushs) 7,193,244,000
Estimated proportion of total subsidy (%) 93.10
Sources: Calculations based on Kyokutamba, 2003; Okumu, 2003
7.3 Ensuring the Use of Environmentally-Sound Electricity Generation Options
With regard to ensuring the sustainability of the power sector from an environmental perspective, the following are possible options:
Review of Electricity Acts: Electricity Acts should be amended to ensure environmentally harmful electricity generation, transmission and distribution entities that were installed prior to EIAs becoming mandatory are assessed and mitigating measures carried out44. The electricity regulatory agencies could enforce this requirement by linking it renewal of licenses and the review of tariffs.
Explicit targets for the share of renewables in the electricity generation mix: To mitigate the negative trend of having an excessively large share of IPPs generating electricity from fossil fuel-based power plants, it is proposed that the regulatory agencies in collaboration with the Ministries of Energy should set explicit targets for the share of electricity generation from proven renewable energy technologies such as
44 Existing power plants can be refurbished taking into account some cost-effective improvements in terms of environmental impacts.

��0
hydro, wind, solar PV, bagasse-based cogeneration and geothermal45. Kenya provides a model example where such targets have been set. In Kenya, the Government has set a target of 25% of electricity generation to come from geothermal by the year 2020. There is already an IPP actively exploiting this option as part of the process aiming at meeting the year 2020 target.
Modular development of electricity generation facilities: In order to minimize the potential negative environmental effects of large scale electricity generation installations, power development planners in the region should consider including small to medium scale but reliable power plant that are also environmentally friendly. Small hydro, wind, solar, bagasse-based cogeneration and geothermal energy sources appear to fit into these criteria. In addition, modular development of electricity generation facilities can ensure an incremental growth in generation capacity to meet the increase in demand in an economically and cost-effective fashion.
Promotion of energy efficiency: Energy efficiency is one area that power sector reforms have not addressed. In most sub-Saharan African countries, demand for power invariably significantly exceeds supply. With the exception of Ghana, the only solution applied so far in most countries has been increasing generation capacity through the introduction of IPPs. However, implementation of energy efficiency measures could reduce power demand thereby reducing the deficiency gap between power supply and demand. In addition, it could minimize the need for huge electricity generation installations thereby providing opportunities smaller generation installations that could be met through small hydro, wind, solar, bagasse-based cogeneration and geothermal energy sources.
In Ghana, the Government is implementing an energy efficiency programme whereby free 10W energy-saving compact fluorescent lamps (CFLs) to replace the inefficient 60W incandescent lamps. The motivation of the Ghana Government is that, for every million CFLs handed out, they lead to a 50 MW reduction in demand thereby delaying the need for investing in additional generation capacity (Abavana and Yankah, 2005).
45 As mentioned earlier, the most promising geothermal resources are concentrated along the Rift Val-ley in the eastern African region and may therefore not be applicable to countries in other regions of Africa.

���
7.4 Addressing Gaps and Barriers in the Legal and Regulatory Framework
With regard to addressing gaps and barriers in the legal and regulatory framework, there are several options that could ensure the power sector’s sustainability. Essentially, enforcing some of the options discussed earlier in this section could go along way in ensuring the sector’s sustainability:
Strengthening the regulatory agencies: Probably the most effective measure in addressing the gaps in the legal and regulatory framework is ensuring the independence of the regulatory agencies. This can be achieved by enhancing the representation among the board members. For example, having representatives of various segments of consumers, including rural on the board of the regulatory agency could ensure that the plight of the disadvantaged is heard especially with respect to electrification and review of electricity tariffs.
Mobilizing local capital investment: The examples of Zimbabwe and Mauritius demonstrate the potential financial and technical capability and viability of local private investors in the power sector. This is corroborated by findings from recent AFREPREN studies which seem to indicate that local private investors can own and operate small to medium scale entities in the power sector, either on their own or with foreign partners (see Marandu and Kayo, 2004). Appropriate policy and financial incentives such as lowering entry requirements and tax holidays should be enacted to encourage local private investment in a privatised electricity industry. The ideal entry point, as in the case of Zimbabwe and Mauritius, is likely to be in small hydro and wind energy sources as well as through local cogeneration in the agro-based industries.
Issuing licenses and Power Purchase Agreements (PPAs) covering a longer period: Issuing longer term licenses and PPAs can ensure that the selling price of electricity by IPPs is moderated. This is essentially because, longer term agreements allow for sufficient time for the investor to pay off project financing debts as well as provides adequate amortization period for the equipment.
Overcoming challenges of rural electrification: Perhaps the most common barrier of rural electrification identified is the high cost of grid extension. An immediate option to lower the cost of rural electrification is the use of proven low cost electrification options such as those identified in this study. Another option is the promotion of decentralized electricity generation in rural areas using hydro, wind, bagasse-based cogeneration and where applicable geothermal. This would greatly reduce the need for transmission lines to transverse long distances and sometimes difficult terrain. However, while these technical options are attractive, the policy framework has to provide adequate incentives to realize the benefits of these options.

���
Levelling the ‘playing field’: As mentioned earlier, electricity regulatory agencies could play a significant role in promoting proven environmentally friendly electricity generation options such as hydro, wind solar PV, bagasse-based cogeneration and geothermal. The regulatory agencies could promote these technologies through setting of specific targets as well as providing for preferential tariffs for their electricity sales. In addition, regulatory agencies could provide attractive incentives to investors willing to install electricity generation plants based on these energy sources.
To sum up, based on preliminary assessments of the socio-economic and environmental impacts of power sector reforms, this study concludes that reforms have not done enough to ensure the sustainability of power sector. To ensure the sector’s sustainability, reforms have to be redesigned to ensure that access to the majority of the population - the poor - is enhanced. In addition, the sustainability of the power sector can also be enhanced by ensuring a favourable share of renewables in electricity generation mix. Above all, the electricity regulatory agencies must carry out their mandate by protecting the poor by ensuring increased access to electricity and provision of subsidies as well as promoting proven renewable energy options for electricity generation. There is also need to address need to address the identified gaps and barriers in the legal and regulatory framework as proposed in this study to ensure that the power sector is sustainable.

���
Bibliography
Abavana, C., and Yankah, E. 2005. ‘Making the African Power Sector Sustainable – Ghana Country Presentation’. Presentation made at the Power Sector Reform Stakeholders’ Dialogue Forum. 15 – 16 December 2005, Addis Ababa.
African Energy Policy Research Network (AFREPREN) 2004. African Energy Data Handbook, Version 10, AFREPREN, Nairobi.
African Energy Policy Research Network (AFREPREN) 2004. African Energy Data Handbook, version 9, AFREPREN, Nairobi.
African Energy Policy Research Network (AFREPREN) 2002. African Energy Data Handbook, Version 8, AFREPREN, Nairobi.
Agbemabiese, L., Bayrne, J. and Bouille, D. 2003. ‘Stakeholder Roles in Promoting Equity and Enviromental Protection’. In: Wamukonya, N. (Ed): Electricity Reform: Social and Environmental Challenges. United Nations Environmental Programme, Roskilde. pp. 227-241
Ahmed, A.S. 2005. ‘Sudan Power System and Plan’. Presentation made at the Power Sector Reform Stakeholders’ Dialogue Forum. 15 – 16 December 2005, Addis Ababa.
Asian Institute of Technology (AIT), 2003. Institutional Reforms and Their Impact on Rural Electrification: Case Studies in South and South East Asia. Paper prepared for the Global Network on Energy for Sustainable Development. Asian Institute of Technology, Pathumthani (unpublished).
Bacon, R.W. and Besant-Jones, J. 2002. Global Electric Power Reform, Privatization and Liberalization of the Electric Power Industry in Developing Countries. Energy & Mining Sector Board Discussion Paper Series, Paper No. 2, June 2002. Washington D.C: World Bank.
Bailis, R. 2003. External Review of GNESD Reports: AFREPREN East Africa Region.
Bailis, R. 2003. External Review of GNESD Reports: AFREPREN East Africa Sub-regional Study.
Bala, J. 2003. Presentation to the Economic Team. Bureau of Public Enterprises. http://www.bpeng.org/CGI-BIN/publications/Presentations/Dr.Julius%20Jubril%20Bala-Presentation%20to%20Economic%20Team%2022%20Oct%202003.ppt

���
Bidasala, H. I., 2001. “Power Sector Restructuring and Privatisation in Uganda” in AFREPREN Occasional Paper No. 5. AFREPREN/FWD, Nairobi.
Bonfils, S. 2005. ‘Actions dans le Domaine des Reformes du Secteur Electrique Africain’. Presentation made at the Power Sector Reform Stakeholders’ Dialogue Forum. 15 – 16 December 2005, Addis Ababa.
Borchers, M., N. Qase, T. Gaunt, J. Mavhungu, H. Winkler, Y. Afrane-Okese and C. Thom, 2001, National Electrification Programme Evaluation: Summary Report, evaluation commissioned by the Department of Minerals & Energy and the Development Bank of Southern Africa, Energy and Development Research Centre, University of Cape Town, Cape Town.
Bouille, D, 2002, Personal Communication.
Bouille, D., Dubrovsky, H. and Maurer, C. 2002. ‘Argentina: Market-Driven Reform of the Electricity Sector’. In: Dubash, N. (Ed): Power Politics: Equity and Environment in Electricity Reform. World Resource Institute, Washington, D.C. pp. 11-30
Bouille, D., Kozulj, R., and Di Sbroiavacca, N., (2003). Personal Communication
Byrne, J. and Mun, Y. 2003. ‘Rethinking Reform in the Electricity Sector: Power Liberalisation or Energy Transformation?’. In: Wamukonya, N. (Ed): Electricity Reform: Social and Environmental Challenges. United Nations Environmental Programme, Roskilde. pp. 48-76
Covarrubias, A. et al, undated. ‘Bank Lending for Electric Power in Africa: Time for a Reappraisal’. Washington, DC: World Bank. http://lnweb18.worldbank.org/oed/oeddoclib.nsf/DocUNIDViewForJavaSearch/BFE1EE92251A628E852567F5005D8A9E
Central Bureau of Statistics (CBS), 2003. Geographical Dimensions of Well-Being in Kenya: Where are the Poor?. Vol. 1. Regal Press Ltd., Nairobi.
Central Statistical Office, 2001, Wage Distribution Data Base, Government of Zimbabwe, Harare.
Chaurey, A., 2003. Personal Communication.
2004, Personal Communications.
Clark et al, 2005. Power sector reform in Africa: assessing the impact on poor people
2001, Annual Report 2000 - 2001, Department of Minerals and Energy, Government of South Africa, Pretoria.

���
2002, ‘Power Sector Reforms in Zimbabwe: Will Reforms Increase Electrification and Strengthen Local Participation?’, in Energy Policy 30.
2002a, An Integrated Electricity Outlook for South Africa, National Electricity Regulator, Pretoria, South Africa
2002b, Lighting up South Africa. National Electricity Regulator, Pretoria, South Africa
2003, ‘Options for a Basic Electricity Support Tariff: Supplementary Report’, for the Department of Minerals and Energy, and Eskom, Cape Town.
2003, Electricity Basic Services Support Tariff Policy, Department of Minerals and Energy, Government of South Africa, Pretoria.
AFREPREN/FWD 2005, Occasional Paper 25, ‘Do the Poor Benefit from Power Sector reform? Evidence from East Africa’, 2005
Bacon, R. 1999, Global Energy Sector Reform in Developing Countries: A Scorecard. Report No. 219-99. Washington, D.C: UNDP/The World Bank
Bacon, R. and Besant-Jones, J., 2001, Global Electric Reform: Privatization and Liberalization of the Electric Power Industry in Developing Countries. In: Annual Review of Energy and Environment 26: 331-359
Bassirou B. 2005, ‘Data and Statistics on the Power Sector in Burkina Faso’, 2005b.
Bassirou B. 2005, ‘Making the African Power Sector Sustainable – The Case of Burkina Faso’, 2005a.
Bouille, D., Dubrovsky, H. and Maurer, C. 2002, ‘Argentina: Market-Driven Reform of the Electricity Sector’. In: Dubash, N. (Ed): Power Politics: Equity and Environment in Electricity Reform. Washington DC, USA: World Resource Institute. Pp. 11-30
Byrne, J. and Mun, Y. 2003, ‘Rethinking Reform in the Electricity Sector: Power Liberalisation or Energy Transformation?’. In: Wamukonya, N. (Ed): Electricity Reform: Social and Environmental Challenges. United Nations Environmental Programme, Roskilde. Pp. 48-76
Cecelski, E., 2000, Electricity in Households and Micro-enterprises. London: Intermediate Technology Publications Ltd.
CIA, 2005, World Factbook, 2005
Clarke, G.C., Woodhall, D.G., Allen, D. and Darling, G. (1990). Geological, Volcanological and Hydrogeological Controls on the Occurrence of Geothermal
���
Activity in the Area Surrounding Lake Naivasha, Kenya. BGS/Government of Kenya Report.
Communications Commission of Kenya (CCK), 2003. Personal Communication, Nairobi.
Cowan, B, 2003, ‘Understanding Electricity and Rural Electrification in South Africa’, Energy and Development Research Centre, University of Cape Town, Cape Town.
Dakkina, A. 2005. Study on the Impact of the Effective Use of Donor Loans and Government Levies on the Electrification of the Rural Population: Case Study of Morocco. AFREPREN, Nairobi.
DANIDA, 1991, Sector Evaluation of Electrification Projects: Synthesis. Copenhagen: Danish International Development Agency.
Davidson, O. and Mwakasonda, S. 2003, Southern Africa Sub-regional Study: South Africa and Zimbabwe. Paper prepared for the Global Network on Energy for Sustainable Development. Cape Town (unpublished): University of Cape Town
Davidson, O. and Y. Sokona, 2002, ‘A New Sustainable Energy Path for African Development: Think Bigger, Act Faster’, Energy and Development Research Centre, University of Cape Town, Cape Town.
Davies, P., 2003. Personal Communication.
Davis, M & Ward, S 1995. Household Energy Use Patterns in Rural Areas: the Effects of Access to Electricity. REIPERA project. Energy & Development Research Centre: University of Cape Town.
Demographic and Health Surveys (DHS), 2004. www.measuredhs.com
Diarra M. 2005, ‘Data and Statistics on the Power Sector in Niger’, 2005b
DME, 1998, ‘White Paper on Energy Policy for South Africa’, Department of Minerals and Energy, Government of South Africa, Pretoria.
Dubash, N. and Rajan, S. 2002, ‘India: Electricity Reform under Political Constraints’. In: Dubash, N. (Ed): Power Politics: Equity and Environment in Electricity Reform. Washington D.C: World Resource Institute. Pp. 51-74
Dubash, N. and Rajan, S. 2002. ‘India: Electricity Reform Under Political Constraints’. In: Dubash, N. (Ed): Power Politics: Equity and Environment in Electricity Reform. World Resource Institute, Washington, D.C. pp. 51-74
Dube I. 2005, ‘Data and Statistics on the Power Sector in Namibia’, 2005b.

���
Dube I. 2005, ‘Making the African Power Sector Sustainable – The Case of Namibia’, 2005a.
Dube, I, 2003, ‘Impact of Energy Subsidies on Energy Consumption and Supply in Zimbabwe: Do the Urban Poor Really Benefit?’ in Energy Policy 31: 1635-1645.
Dube, I., 2002. Zimbabwe Country Data and Statistics Compilation. AFREPREN, Nairobi.
Economic Organisation of West African States (ECOWAS). 2005. White Paper for a Regional Policy for Increasing Access to Energy Services for Populations in Rural and Peri-uban Areas in Order to Achieve the Millennium Development Goals. ECOWAS.
Edjekumhene, I. and Dubash, N. 2002, ‘Ghana: Achieving Public Benefits by Default’. In: Dubash, N. (Ed): Power Politics: Equity and Environment in Electricity Reform. Washington DC, USA: World Resource Institute. Pp. 117-138
Edjekumhene, I. and Dubash, N. 2002. ‘Ghana: Achieving Public Benefits by Default’. In: Dubash, N. (Ed): Power Politics: Equity and Environment in Electricity Reform. World Resource Institute, Washington, D.C. pp. 117-138
Eddy, S. 2005. ‘Organisation de Secteur de l’Electricite de la Cote d’Ivoire’. Presentation made at the Power Sector Reform Stakeholders’ Dialogue Forum. 15 – 16 December 2005, Addis Ababa.
Energy Research Institute, 2003. Policy Options for Cleaner Energy Services for the Poor: China Case Study. Paper prepared for the Global Network on Energy for Sustainable Development. Energy Research Institute (unpublished).
Engorait, P., 2002. Energy Sector Reform: Uganda Research Report, AFREPREN/FWD, Nairobi.
Engurait, P., 2001. Uganda Country Data and Statistics Compilation. AFREPREN, Nairobi.
Environnement et Developpement du Tiers Monde, 2005. Focus on Electrification Strategies for the Poor: Lessons for West Africa: Paper prepared for the Global Network on Energy for Sustainable Development Dakar (unpublished).
Electricity Regulatory Board (ERB). 2005. “Overview of the Electricity Industry in Zambia” a background paper prepared for the Power Sector Reform Stakeholders’ Dialogue Forum. 15 – 16 December 2005, Addis Ababa.

���
Eremu, J. 2003. ‘Government Lets Sh676b for Rural Power’. Article in The New Vision, 12th July, 2003. The New Vision, Kampala
Eskom, 2002, Annual Report 2002, Eskom, South Africaandton.
ESMAP, 2000, Zimbabwe Rural Electrification Study, Energy Sector Management Assistance Programme, UNDP-World Bank, Harare.
Ewbank Preece Limited (1989). Feasibility Study for a Geothermal Power Station at NE Olkaria - Report No. 80216 by Ewbank Preece Ltd, Consulting Engineers, Prudential North Street, Brighton Bn1 1RZ, UK.
Fall, A. and Wamukonya, N. 2003. ‘Power Sector Reform in Senegal’. In: Wamukonya, N. (Ed): Electricity Reform: Social and Environmental Challenges. United Nations Environmental Programme, Roskilde. pp. 193-199
Ferreira, C. 2004. African IPP Experience. Independent Power Producers and Power Purchase Agreements: Frontiers in International Experience. Fieldstone Africa (PTL) Ltd.
FINNIDA (Finnish International Development Agency), 1990. Evaluation Report of the FINNIDA Rural Electrification Programme in Kenya November 1990” with planning mission’s proposals. Helsinki, FINNIDA.
FINNIDA (Finnish International Development Agency), 1992. The GoK (Ministry of Energy) and The Republic of Finland (FINNIDA) “Rural Electrification Programme: Phase IV, Years 1993-1996.” Project Document: Draft II. Nairobi: Ministry of Energy.
FMO, Undated, ‘Power Plant in Cameroon; Reliable Electricity Benefits Everyone’, http//www.fmo.nl/en/projects/case.php
French Global Environment Facility (FGEF), 2001. Project Details: Bagasse-Coal Power Plant. http://ttclear.unfccc.int/ttclear/jsp/PrDetails.jsp?db=TTProjects&prid=499
Gboney, W. (2001), Power Sector Reform in Ghana. In AFREPREN Occasional Paper No. 5: Power Sector Reform in Africa - Proceedings of a Regional Policy Seminar, eds. S. Karekezi, J. Kimani and J. Wangeci, pp. 26 - 34, African Energy Policy Research Network (AFREPREN/FWD), Nairobi.
Geotermica Italiana (1987). Geothermal Reconnaissance Survey in the Menengai-Bogoria Area of the Kenya Rift Valley. Final Report, Parts I-V UN/DTCD Contract No. 7/85 KEN 82/002.

���
Geotermica Italiana (1989). Supplement of Surface Investigations within the Calderas of Longonot and Suswa Volcanoes. Vol. 1. A UN/DTCD and MERD Report.
Gerger, A. and Gullberg, M., 1997, Rural Power Supply With Local Management: Examples from Bolivia, India and Nepal. Stockholm: Stockholm Environment Institute
Global Network on Energy for Sustainable Development (GNESD), 2003a. Summary for Policy Makers. Unpublished.
Global Network on Energy for Sustainable Development (GNESD), 2003b. Common Approach Paper (unpublished).
Globeleq, 2006. Generating Power for Emerging Markets: http://www.globeleq.com/fw/main/default.asp?DocID=1615, Uganda.
Goldemberg, J., Rovere, E., Coelho, S., Muylaert, M, Simoes, A., Zilles, R., Guardabassi, P. and Paletta, C. 2003. Expanding the Access to Electricity in Brazil. Paper prepared for the Global Network on Energy for Sustainable Development. Federal University of Rio de Janeiro, Rio de Janeiro (unpublished).
Gullberg, M., Katyega, M. and Kjellstrom, B., 1999, Local Management of Rural Power Supply: A New Approach in Tanzania. Energy, Environment and Development Series No. 46. Stockholm: Stockholm Environment Institute
Habetsion S. 2005, ‘Data and Statistics on the Power Sector in Eritrea’, 2005b.
Habetsion S. 2005, ‘Making the African Power Sector Sustainable – The Case of Eritrea’, 2005a.
Hansmann, C, Van Gass, M, Annecke, W, Despins, PM & Kargas, S 1996. Post Electrification Study of Loskop –Appendices. REIPERA project. Energy & Development Research Centre: University of Cape Town.
Hurdowar, N. 2005. Ring-fencing World Bank Loans and Government Funds for Electrification: Country Report on the Island of Mauritius. AFREPREN, Nairobi.
IEA, 2002, Energy Balances for Non OECD Countries, 2000 IEA, Paris
IEA, 2002, Key World Energy Statistics from the IEA, International Energy Agency, Paris.
IEA, 2004, Key World Energy Statistics, 2004
IMF, 2002, ‘Zimbabwe Statistical Appendix’, Country Report No. 02/126, International Monetary Fund, Washington D.C.

��0
International Energy Agency (IEA). 2002. World Energy Outlook 2003: Energy and Poverty. IEA, Paris.
Kahyoza N. 2005, ‘Data and Statistics on the Power Sector in Tanzania’, 2005b.
Kahyoza N. 2005, ‘Making the African Power Sector Sustainable – The Case of Tanzania’, 2005a.
Kalumiana O. 2005, ‘Data and Statistics on the Power Sector in Zambia’, 2005b.
Kalumiana O. 2005, ‘Making the African Power Sector Sustainable – The Case of Zambia’, 2005a.
Kamau, S. 2005. Kenya Country Study. AFREPREN, Nairobi.
Karekezi, S and Mutiso, D (2000). Power Sector Reform: A Kenya Case Study in Power Sector Reform in Sub-Saharan Africa, Macmillan Press Limited, London.
Karekezi, S. and Sihag, A.R, 2003, Final Synthesis/Compilation Report. Risoe : Global Network on Energy for Sustainable Development.
Karekezi, S. and T. Ranja, T, 1997, Renewable Energy Technologies in Africa., Zed, London.
Karekezi, S., Kimani, J., Mutiga, A. and Amenya, S., 2003, Energy Services for the Poor in Eastern Africa: Sub-regional “Energy Access” Study of East Africa. Paper prepared for the Global Network on Energy for Sustainable Development. Nairobi (unpublished): AFREPREN/FWD
Karekezi, S., Kimani, J., Mutiga, A. and Amenya, S., 2003. Energy Services for the Poor in Eastern Africa: Sub-regional “Energy Access” Study of East Africa. Risoe: Global Network on Energy for Sustainable Development.
Karekezi, S., Kimani, J., Mutiga, A. and Amenya, S., 2003. Energy Services for the Poor in Eastern Africa: Sub-regional “Energy Access” Study of East Africa. Paper prepared for the Global Network on Energy for Sustainable Development. AFREPREN/FWD, Nairobi (unpublished).
Karekezi, S., Mapako, M. and Teferra, M., 2002, ‘Africa: Improving Modern Energy Services for the Poor, Vol. 30, Nos. 11-12, 2002.
Karekezi, S., Mapako, M., and Teferra, M., (eds) 2002(b). Energy Policy Journal – Special Issue, Vol 30, No. 11-12, Elsevier Science Limited, Oxford, UK.

���
Kasangaki, V., 2005. “Status of the Electricity Sector in Uganda” a background paper prepared for the Power Sector Reform Stakeholders’ Dialogue Forum. 15 – 16 December 2005, Addis Ababa.
Kayizzi, R. 2003. ‘Bbumba Appoints Board’. Article in The New Vision, Kampala
Kayo D. 2005, ‘Data and Statistics on the Power Sector in Zimbabwe’, 2005b.
Kayo D. 2005, ‘Making the African Power Sector Sustainable – The Case of Zimbabwe’, 2005a.
Kayo, D., 2002. Zimbabwe Country Data and Statistics Compilation. AFREPREN, Nairobi.
Kayo, D., 2001, ‘Power Sector Reform in Zimbabwe’, proceedings of a regional policy seminar on power reforms in Africa, African Energy Policy Research Network, Nairobi.
Kenya Power and Lighting Company (KPLC), 1992. Report and Accounts for the year ended 30th June 1992. KPLC, Nairobi.
Kenya Power and Lighting Company (KPLC), 1997. Report and Accounts for the year ended 30th June 1997. KPLC, Nairobi.
Kenya Power and Lighting Company (KPLC), 1997. Report and Accounts for the year ended 30th June 1997. Nairobi: KPLC
Kenya Power and Lighting Company (KPLC), 1999. Annual Report. Nairobi: KPLC
Kenya Power and Lighting Company (KPLC), 2001/2002. Annual Report and Accounts 2001/2002. KPLC, Nairobi.
Kenya Power and Lighting Company (KPLC), 2002. Annual Report. Nairobi: KPLC
Khagham, S. 2004. Dams and Development: Transitional Struggles for Water and Power. Cornell Univerisity Press. New York.
Kinuthia, P., 2003. Kenya Country Data and Statistics Compilation. AFREPREN, Nairobi.
Kjellstrom, B., 1994, Rural Electrification in Tanzania. London: Intermediate Technology Development Group.

���
Kjellstrom, B., Katyega, M. and Kadete, H., 1992, Rural Electrification in Tanzania: Past Experiences - New Approaches. Energy, Environment and Development Series No. 15. Stockholm: Stockholm Environment Institute.
Komives, K., Foster, V. Halpern, J. and Wodon, Q. 2005. Water, Electricity, and the Poor: Who Benefits from Utility Subsidies? Washington, D.C.: World Bank.
Kozulj, R., Sbroiavacca, N. and Bouille, D. 2003. Assessment of Energy Reforms: Case Studies for Latin America and Caribbean. Paper prepared for the Global Network on Energy for Sustainable Development. Fundacion Bariloche, Bariloche (unpublished).
Kubo, B. (1999). Environmental Issues Related to the Proposed Development Olkaria III. KenGen Internal Report No. Geo/08/009b.
Kyokutamba, J., 2002. Improving access to Modern Energy Services to the Poor through Small and Micro Enterprises: The Case Study of Uganda. AFREPREN, Nairobi.
Kyokutamba, J., 2003b. Uganda Country Data and Statistics Compilation. AFREPREN, Nairobi.
Lash, J. 2002, ‘Foreword’. In: Dubash, N. (Ed): Power Politics: Equity and Environment in Electricity Reform Pp. VII-VIII.Washington DC: World Resource Institute.
Lash, J. 2002. ‘Foreword’. In: Dubash, N. (Ed): Power Politics: Equity and Environment in Electricity Reform. World Resource Institute, Washington, D.C. pp. VII-VIII
Macdonald, R. (1994). Petrological Evidence Regarding the Evolution of the Kenya Rift Valley. Tectonophysics, 236: 373-390.
Manyame, R. 2005. “Summary of Power Sector Reform Process in Namibia” a background paper prepared for the Power Sector Reform Stakeholders’ Dialogue Forum. 15 – 16 December 2005, Addis Ababa.
Mangwengwende, S. E., 2005. “Status of the Electricity Sector in Zimbabwe” a background paper prepared for the Power Sector Reform Stakeholders’ Dialogue Forum. 15 – 16 December 2005, Addis Ababa.
Mangwengwende, S. E., 2002, ‘Tariffs and Subsidies in Zimbabwe’s Reforming Electricity Industry: Steering a Utility Through Turbulent Times’, in Energy Policy 30: 947-958.

���
Mapako, M. C. and Y. Afrane-Okese, 2002, ‘Experiences and Lessons in the Implementation of Solar Home Systems from Zimbabwe’, Conference Proceedings, DUEE, Cape Technicon, April 2002, Cape Town
Marani, M., Tole, M.P., and Ogallo, L.J. (1995). Concentration of H2S in the Air around the Olkaria Geothermal Field, Kenya. Discovery and Innovation, 5: 2, 67-76.
Mariita, O, N., Otieno, C, O. and Shako, J., W. (1998). Micro-gravity Monitoring at the Olkaria Geothermal Field, Kenya. KenGen Internal Report. 15 p.
Mbise. H.A., 2005. “Power Sector Reforms in Africa” a background paper on Tanzania prepared for the Power Sector Reform Stakeholders’ Dialogue Forum. 15 – 16 December 2005, Addis Ababa.
MFAF, 2004, Identification Mission for Energy Sector in Kenya. Ministry of Foreign Affairs of Finland, Helsinki: Ministry of Foreign Affairs of Finland
Ministry for Foreign Affairs of Finland (MFAF), 2004. Identification Mission for Energy Sector in Kenya. Helsinki MFAF
Ministry of Energy (MoE), 1997. Rural Electrification Master Plan. Nairobi: MoE
Ministry of Energy, 2002. Study on Kenya’s Energy Demand, Supply and Policy Strategy for Households, Small Scale Industries and Secure Establishments. Ministry of Energy, Nairobi.
Ministry of Energy, 2003. Energy Sector Development Strategy. Rural Energy Task Force Final Report. Ministry of Energy, Nairobi
Ministry of Energy, 2004. Sessional Paper No. 4 on Energy. Ministry of Energy, Nairobi.
Mloza-Amri, G. 2005. “Towards Restructuring of the Electricity Utility in Malawi” a background paper prepared for the Power Sector Reform Stakeholders’ Dialogue Forum. 15 – 16 December 2005, Addis Ababa.
Mogusu, T. 2004. ‘Govt Okays KPLC Plan’. East African Standard, 6 January 2004. The Standard Ltd., Nairobi.
Molnar, L. (Year not specified). Social and Environmental Impacts of Power Sector Reform in Hungar. Energy Centre, Budapest.
Muchemi, J. (1994). Geological Interpretation of the Olkaria Geothermal Field. KenGen Internal Report, 25pp.

���
Muna Z. W. (1998). Conceptual Model of the Greater Olkaria Geothermal Field. KenGen Internal Report, First Edition.
Mungania, J. (1995). Tephra Deposits in Olkaria and the Surrounding Areas. KenGen Internal Report. 7 pp.
Munjeri, K., 2002, ‘Sustainability Indicators for Zimbabwe’s Energy Sector’, in The Sustainable Energy Watch Indicators 2002, Helio International, Paris.
Nakhooda, F. 2005. Kakira Sugar Works Cogeneration Project. Presentation made at Partners for Africa Policy Conference 23 June 2005, Dar es Salaam.
National Electricity Regulator (NER) 2002. National Electricity Regulator Annual Report 2001/2002. National Electricity Regulator, Sandton.
National Electricity Regulator (NER) 2003. National Electricity Regulator Annual Report 2002/2003. National Electricity Regulator, Sandton.
NER (National Electricity Regulator), 2001, Electricity Supply Statistics for South Africa 2001, National Electricity Regulator, Pretoria, South Africa
NER (National Electricity Regulator), 2001, Electricity Supply Statistics for South Africa 2001, National Electricity Regulator, Pretoria, South Africa
Njenga, J.N., (1994). Hydrology and Water Levels of the Lake Naivasha. KenGen Internal Report. 27 pp.
Nyang F. 2005, ‘Data and Statistics on the Power Sector in Kenya’, 2005b
Nyang F. 2005, ‘Making the African Power Sector Sustainable – The Case of Kenya’, 2005a.
Nyoike, P., 2002. “Is the Kenya Electricity Regulatory Board Autonomous?” in the Energy Policy Journal – Special Issue, Vol 30, No. 11-12, Elsevier Science Limited, Oxford.
Nzoyihera, S. 2005. ‘REGIDESO Power System Information – Burundi Country Presentation’. Presentation made at the Power Sector Reform Stakeholders’ Dialogue Forum. 15 – 16 December 2005, Addis Ababa.
Ogunlade, D. and Mwakasonda, S. 2003. Southern Africa Sub-regional Study: South Africa and Zimbabwe. Paper prepared for the Global Network on Energy for Sustainable Development. University of Cape Town, Cape Town (unpublished).
Ogunlade, D., 2003. Personal Communication.

���
Okumu, D., 2003. Assessment of the Impact of Reforms on the Poor. AFREPREN, Nairobi.
Okumu, D., 2003. Uganda Country Data and Statistics Compilation. AFREPREN, Nairobi.
Oldach R, Louineau J-P, Purcell C, Taylor S & Montwedi M 2001. Economics and Project Management Interventions in a Large Scale EU Funded PV Project in South Africa. 17th European Photovoltaic solar energy conference, Munich, 22-26 October.
Omenda, P. A., (1998). The Geological Structure of the Olkaria Geothermal Field. Geothermics, 19: 125-130.
Omenda, P.A., (1994). Up-date of the Geology of Olkaria West and Central Fields. KenGen internal report.
Omondi, J. (1987). Environmental Aspects of Geothermal Energy Development - A Case Study for Olkaria Geothermal Prospects. A Kenya Power Company report no. Geo/8/11.
Ouma, P.A. (1998). Performance of East Olkaria Geothermal Field during Ten Years of Production. Trans. Int. Conf. Industrial Uses of Geothermal Energy, Reyk, Iceland, 2-4 Sept., 10 pp.
Ounalli, A. 2005. Rural Electrification Experience in Tunisia. AFREPREN, Nairobi.
Partnerships Central, undated. Kenya Olkaria III Geothermal IPP. http://partnershipscentral.org/mainpages/realportal/displayobject.php?object_id=19
Phuroe, T. 2005. “Electricity Sector Reform and Regulation in Lesotho”. Presentation made at the Power Sector Reform Stakeholders’ Dialogue Forum. 15 – 16 December 2005, Addis Ababa.
Pineau P. 2005, ‘Data and Statistics on the Power Sector in Cameroon’, 2005b.
Pineau P. 2005, ‘Making the African Power Sector Sustainable – The Case of Cameroon’, 2005a.
Radka, M, 2002, Personal Communication
Republic of Kenya, 1997. Electric Power Act (1997). Government Printer, Nairobi.
Republic of Kenya, 2000. Economic Survey, 2000. Central Bureau of Statistics, Ministry of Finance and Planning, Nairobi.

���
Republic of Kenya, 2000; 2nd Report on Poverty in Kenya - Volume II: Poverty and Social Indicators, Ministry of Finance and Planning, Nairobi.
Republic of Kenya, 2002. Economic Survey, 2002.Central Bureau of Statistics, Ministry of Finance and Planning, Nairobi.
Republic of Kenya, 2003. Energy Sector Development Strategy. Rural Energy Task Force Final Report. Ministry of Energy, Nairobi.
Sanghvi, A. and Barnes, D., 2001, Rural Electrification: Lessons Learned. Findings No. 177. Washington, D.C: The World Bank
Sarr S. 2005, ‘Data and Statistics on the Power Sector in Senegal’, 2005b.
Sarr S. 2005, ‘Making the African Power Sector Sustainable – The Case of Senegal’, 2005a.
Sarr, S., Fall, L., Togola, I. and Sokona, Y. 2003, Energy Access for the Poor in West Africa. Paper prepared for the Global Network on Energy for Sustainable Development (unpublished). Dakar: Environnement et Developpement du Tiers Monde.
Sarr, S., Fall, L., Togola, I. and Sokona, Y. 2003. Energy Access for the Poor in West Africa. Paper prepared for the Global Network on Energy for Sustainable Development. Environnement et Developpement du Tiers Monde, Dakar (unpublished).
Shongwe, H. 2005. ‘Approaches to Energy Sector Reform – Swaziland Country Presentation’. Presentation made at the Power Sector Reform Stakeholders’ Dialogue Forum. 15 – 16 December 2005, Addis Ababa.
Shrestha, R., 2003. Personal Communication.
Shrestha, R.M., Kumar, S., Todoc, M. and Sharma, S., 2003. Institutional Reforms and Their Impact on Rural Electrification: Case Studies in South and South East Asia. Paper prepared for the Global Network on Energy for Sustainable Development. Asian Institute of Technology, Pathumthani (unpublished).
Sihag A., Chaurey A. and Pachauri R. K., 2003. Impact of Power Sector Reform on the Poor- A Case of South and South East Asia. Paper prepared for the Global Network on Energy for Sustainable Development. The Energy Research Institute, New Delhi (unpublished).
Simiyu S.M. (1999). Seismic Velocity Application to Geothermal Evaluation and Exploitation, Southern Lake Naivasha. 24th W/shop on Geothermal Res. Engineering. Stanford, SGP-TR-162.

���
Simiyu, G. M., and Tole M.P. (1995). Concentrations of Trace Elements in Water, Soils, and Plants of Olkaria Geothermal Field, Kenya. Discovery and Innovation, 5: 2, 46-55.
Sinclair Knight (1992). Environmental Assessment Draft Report on North East Olkaria Power Development Project. A KPC report No. Geo/8/10b.
Sinclair Knight and Partners (1994). Environmental Assessment for Northeast Olkaria Power Development Project. Report for the KenGen Company LTD.
Statistics South Africa, 2002, Earning and Spending in South Africa, Government of South Africa, Pretoria, South Africa
Swedish International Development Co-operation Agency (Sida), 1998. Socio-economic Study and Gender Impact Assessment on Rural Electrification Project in Debarwa and Adi-Teclesan Areas, Eritrea. Stockholm: Sida
Tapamo, H.D. and Bignom, B. 2005. ‘Making the African Power Sector Sustainable – Cameroon Country Presentation’. Presentation made at the Power Sector Reform Stakeholders’ Dialogue Forum. 15 – 16 December 2005, Addis Ababa.
Teferra, M. (2002). Power Sector Reform in Ethiopia: Implications for Rural Electrification. African Energy Policy Research Network (AFREPREN/FWD), Nairobi.
Thiam, I. 2005. ‘Renforcer le Secteur Electrique en Afrique dans Une Perspective de Developpment Durable’. A background paper on Senegal for the Power Sector Reform Stakeholders’ Dialogue Forum. 15 – 16 December 2005, Addis Ababa. Commission de Regulation du Secteur de l’Electricite: Dakar.
Thom C. and Mohlakoana N, 2001, ‘Use and Impact of Electricity in a Rural Village in the Northern Province’, in AMEU Conference, February 2001
Tole, M. P. (1996). Geothermal Energy Research in Kenya: A Review. J. African Earth Science 23: 4, 565-575
Tole, M. P. (1997). Environmental Impact Assessment in Kenya: Theory and Practice. “Proceedings of the Environmental Impact Assessment Seminar, July/August 1996”. Academy Science Publishers, Nairobi, Kenya. 89pp.
Toure, M. 2005. ‘Mise en Oeuvre des Instruments de Regulation. Problemes Practiques Cas du Mali’. Presentation made at the Power Sector Reform Stakeholders’ Dialogue Forum. 15 – 16 December 2005, Addis Ababa.
Tse M. 2005, ‘Data and Statistics on the Power Sector in Ghana’, 2005b

���
Tse M. 2005, ‘Making the African Power Sector Sustainable – The Case of Ghana’, 2005a.
Turkson, J. K., 2002, Power Sector Reforms in Sub-Saharan Africa, Macmillan, London.
UCT, 2002, ‘Options for a Basic Electricity Support Tariff: Analysis, Issues and Recommendations’, University of Cape Town, for the Department of Minerals and Energy and Eskom, Cape Town.
Uganda Bureau of Statistics (UBOS) 2001. Statistical Abstract 2001 Uganda, UBOS, Kampala
Uganda Electricity Board (UEB), 1999. Report and Accounts of 1999, UEB, Kampala.
UN Habitat, 2004. Kenya. http://www.unhabitat.org/habrdd/conditions/eafrica/kenya.htm.
United Nations Development Programme (UNDP) 2002. Deepening Democracy in a Fragmented World, Human Development Report 2002, UNDP, Nairobi.
United Nations Development Programme (UNDP), 2001. Addressing Social and Economic Disparities -Kenya, Human Development Report 2001, UNDP, Nairobi.
UNPOP, 2001. World Urbanization Prospects: The 2001 Revision. http://www.esa.un.org/unpp.
UNPOP, 2002. World Population Prospects: The 2002 Revision. http://www.esa.un.org/unpp.
Vasagar, J. 2005. ‘Could a $50bn plan to tame this mighty river bring electricity to all of Africa?’ The Guardian, February 25, 2005.
http://www.guardian.co.uk/congo/story/0,12292,1425023,00.html
Veragoo, D., 2003. Cogeneration: The Promotion of Renewable Energy and Efficiency in Mauritius. ‘Paper presented at the Eastern Africa Renewable Energy and Energy Efficiency Partnership (REEEP) Regional Consultation Meeting, 9th - 10th June 2003, Nairobi, Kenya. AFREPREN, Nairobi.
Wamukonya, N. 2003, ‘Power Sector Reform in Developing Countries: Mismatched Agendas’. In: Wamukonya, N. (Ed): Electricity Reform: Social and Environmental Challenges. United Nations Environmental Programme, Roskilde. Pp. 7-47

���
Wamukonya, N. 2003. ‘Power Sector Reform in Developing Countries: Mismatched Agendas’. In: Wamukonya, N. (Ed): Electricity Reform: Social and Environmental Challenges. United Nations Environmental Programme, Roskilde. pp. 7-47
Williams, R. and Ghanadan, R. 2005. ‘Electricity Reform in Developing and Transition Countries: A Reappraisal. Elsevier Science Limited, London.
World Bank 2003(a). African Development Indicators 2003. World Bank, Washington DC.
World Bank, 2001. African Development Indicators, 2001. World Bank, Washington DC
World Bank, 2003. World Bank Website: http://www.worldbank.org
World Bank, 2003a. World Development Report 2003, World Bank, Washington DC.
World Bank, 2003b. African Development Indicators, 2003. World Bank, Washington DC.
ZESA, 1993, Annual Report, Zimbabwe Electricity Supply Authority, Harare.
ZESA, 2001, Annual Report, Zimbabwe Electricity Supply Authority, Harare.

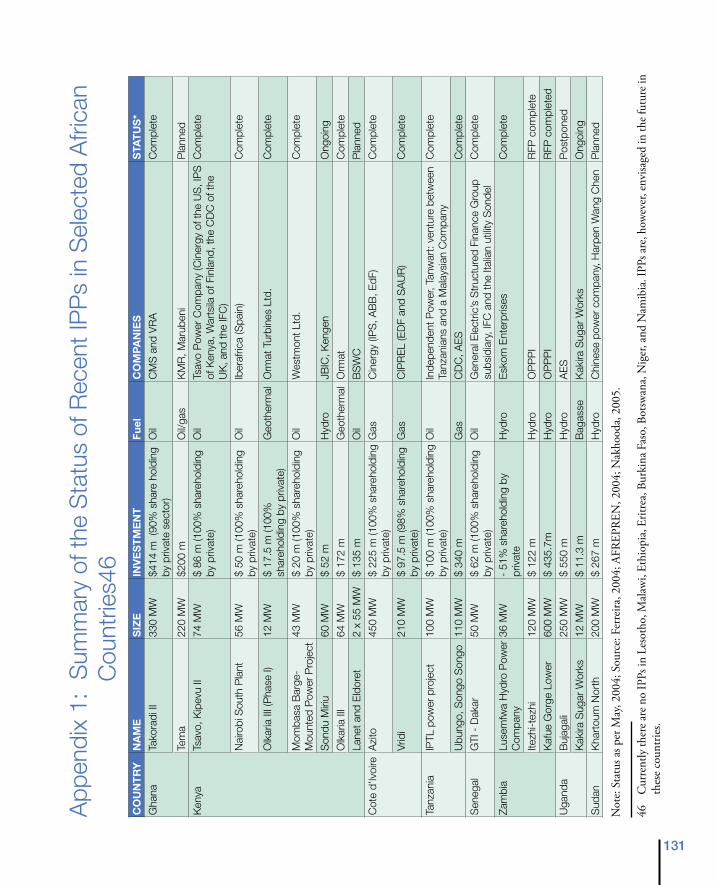
���
App
endi
x 1:
Sum
mar
y of
the
Sta
tus
of R
ecen
t IP
Ps
in S
elec
ted
Afri
can
C
ount
ries4
6C
OU
NT
RY
NA
ME
SIZ
EIN
VE
ST
ME
NT
Fuel
CO
MPA
NIE
SS
TAT
US
*
Gha
naTa
kora
di II
330
MW
$414
m (
90%
sha
re h
oldi
ng
by p
rivat
e se
ctor
)O
ilC
MS
and
VR
A
Com
plet
e
Tem
a22
0 M
W$2
00 m
Oil/
gas
KM
R, M
arub
eni
Pla
nned
Ken
yaTs
avo,
Kip
evu
II74
MW
$ 86
m (1
00%
sha
reho
ldin
g by
priv
ate)
Oil
Tsav
o P
ower
Com
pany
(Cin
ergy
of t
he U
S, I
PS
of
Ken
ya, W
arts
ila o
f Fin
land
, the
CD
C o
f the
U
K, a
nd th
e IF
C)
Com
plet
e
Nai
robi
Sou
th P
lant
56 M
W$
50 m
(100
% s
hare
hold
ing
by p
rivat
e)O
ilIb
eraf
rica
(Spa
in)
Com
plet
e
Olk
aria
III (
Pha
se I)
12 M
W$
17.5
m (1
00%
sh
areh
oldi
ng b
y pr
ivat
e)G
eoth
erm
alO
rmat
Tur
bine
s Lt
d.C
ompl
ete
Mom
basa
Bar
ge-
Mou
nted
Pow
er P
roje
ct43
MW
$ 20
m (1
00%
sha
reho
ldin
g by
priv
ate)
Oil
Wes
tmon
t Ltd
.C
ompl
ete
Son
du M
iriu
60 M
W$
52 m
Hyd
roJB
IC, K
enge
nO
ngoi
ng
Olk
aria
III
64 M
W$
172
mG
eoth
erm
alO
rmat
Com
plet
e
Lane
t and
Eld
oret
2 x
55 M
W$
135
mO
ilB
SW
CP
lann
ed
Cot
e d’
Ivoi
reA
zito
450
MW
$ 22
5 m
(100
% s
hare
hold
ing
by p
rivat
e)G
asC
iner
gy (I
PS
, AB
B, E
dF)
Com
plet
e
Vrid
i21
0 M
W$
97.5
m (9
8% s
hare
hold
ing
by p
rivat
e)G
asC
IPR
EL
(ED
F an
d S
AU
R)
Com
plet
e
Tanz
ania
IPTL
pow
er p
roje
ct10
0 M
W$
100
m (1
00%
sha
reho
ldin
g by
priv
ate)
Oil
Inde
pend
ent P
ower
, Tan
war
t: ve
ntur
e be
twee
n Ta
nzan
ians
and
a M
alay
sian
Com
pany
Com
plet
e
Ubu
ngo,
Son
go S
ongo
110
MW
$ 34
0 m
Gas
CD
C, A
ES
Com
plet
e
Sen
egal
GTI
- D
akar
50 M
W$
62 m
(100
% s
hare
hold
ing
by p
rivat
e)O
ilG
ener
al E
lect
ric’s
Str
uctu
red
Fina
nce
Gro
up
subs
idia
ry, I
FC a
nd th
e Ita
lian
utilit
y S
onde
lC
ompl
ete
Zam
bia
Luse
mfw
a H
ydro
Pow
er
Com
pany
36 M
W-
51%
sha
reho
ldin
g by
pr
ivat
eH
ydro
Esk
om E
nter
pris
esC
ompl
ete
Itezh
i-tez
hi12
0 M
W$
122
mH
ydro
OP
PP
IR
FP c
ompl
ete
Kaf
ue G
orge
Low
er60
0 M
W$
435.
7mH
ydro
OP
PP
IR
FP c
ompl
eted
Uga
nda
Buj
agal
i25
0 M
W$
550
mH
ydro
AE
SP
ostp
oned
Kak
ira S
ugar
Wor
ks12
MW
$ 11
.3 m
Bag
asse
Kak
ira S
ugar
Wor
ksO
ngoi
ng
Sud
anK
hart
oum
Nor
th20
0 M
W$
267
mH
ydro
Chi
nese
pow
er c
ompa
ny, H
arpe
n W
ang
Che
nP
lann
ed
Not
e: S
tatu
s as p
er M
ay, 2
004;
Sou
rce:
Fer
reira
, 200
4; A
FREP
REN
, 200
4; N
akho
oda,
200
5.
46
Cur
rent
ly th
ere a
re n
o IP
Ps in
Les
otho
, Mal
awi,
Ethi
opia
, Erit
rea,
Bur
kina
Fas
o, B
otsw
ana,
Nig
er, a
nd N
amib
ia. I
PPs a
re, h
owev
er, e
nvisa
ged
in th
e fut
ure i
n th
ese
coun
trie
s.