making ad effectiveness make sensenymetro.chapter.informs.org/prac_cor_pubs/05-2014 robert...
TRANSCRIPT
PREPARED FOR INFORMS
MAY 20, 2015
MAKING AD EFFECTIVENESS MAKE SENSE
Co
pyr
igh
t ©
2012
Th
e N
iels
en C
om
pan
y. C
on
fid
enti
al a
nd
pro
pri
etar
y.
2 Copyright ©2015 The Nielsen Company. Confidential and proprietary.
AGENDA
• Background
• Review Nielsen’s 3 R Framework
o Reach - Digital (Digital Campaign Ratings)
o Resonance - TV Brand Effect
o Reaction - Nielsen Buyer Insights
• Wrap up/ Questions

Co
pyr
igh
t ©
2012
Th
e N
iels
en C
om
pan
y. C
on
fid
enti
al a
nd
pro
pri
etar
y.
3 Copyright ©2015 The Nielsen Company. Confidential and proprietary.
OUR HERITAGE
global servicing model
100 countries in traditional and modern trade
comparable metrics across all media
world-class analytics
leading innovation

Co
pyr
igh
t ©
2012
Th
e N
iels
en C
om
pan
y. C
on
fid
enti
al a
nd
pro
pri
etar
y.
4 Copyright ©2015 The Nielsen Company. Confidential and proprietary.
Reach the right people
REACH Influence their opinion
RESONANCE Impact their behavior
REACTION
Did my intended audience see my campaign?
How can I best allocate ad spend to reach my target
consumers?
Did my campaign deliver the desired brand impact?
How can I optimize my
campaign?
Did my campaign deliver the desired consumer response?
How can I measure and maximize the ROI of my
advertising spend?
NIELSEN’S 3R FRAMEWORK: MAKING AD EFFECTIVENESS MAKE SENSE
Co
pyr
igh
t ©
2012
Th
e N
iels
en C
om
pan
y. C
on
fid
enti
al a
nd
pro
pri
etar
y.
5 Copyright ©2015 The Nielsen Company. Confidential and proprietary.
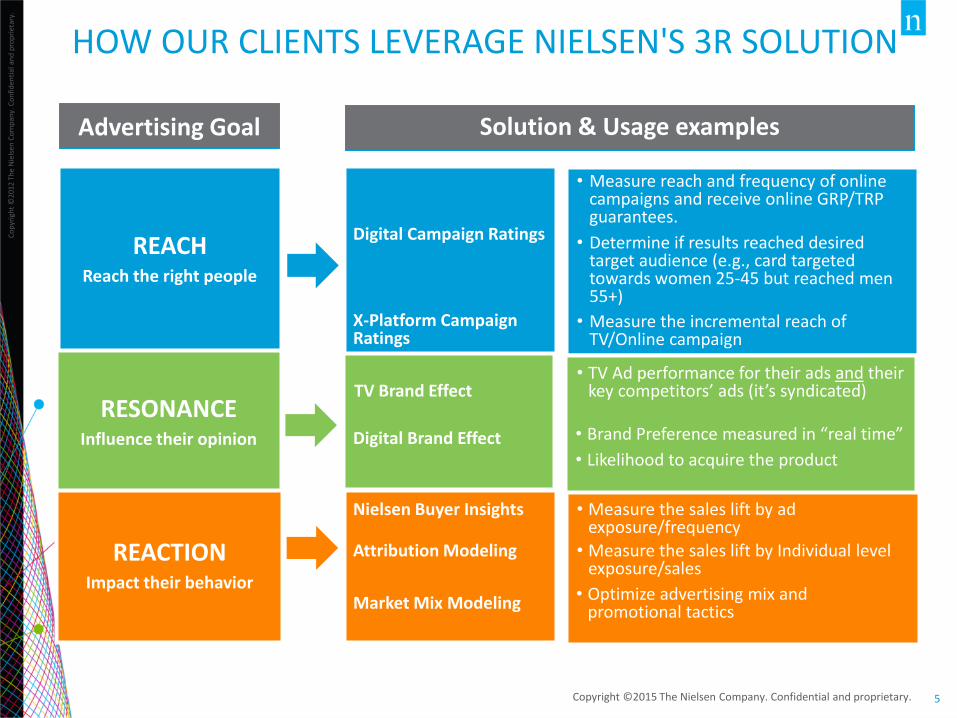
Advertising Goal Solution & Usage examples
REACH Reach the right people
RESONANCE Influence their opinion
REACTION Impact their behavior
Digital Campaign Ratings
• Measure reach and frequency of online campaigns and receive online GRP/TRP guarantees.
• Determine if results reached desired target audience (e.g., card targeted towards women 25-45 but reached men 55+)
X-Platform Campaign Ratings
• Measure the incremental reach of TV/Online campaign
• TV Ad performance for their ads and their key competitors’ ads (it’s syndicated)
Digital Brand Effect
TV Brand Effect
• Brand Preference measured in “real time”
• Likelihood to acquire the product
Attribution Modeling
Market Mix Modeling
• Measure the sales lift by Individual level exposure/sales
• Optimize advertising mix and promotional tactics
HOW OUR CLIENTS LEVERAGE NIELSEN'S 3R SOLUTION
Nielsen Buyer Insights • Measure the sales lift by ad exposure/frequency

REACH: DIGITAL CAMPAIGN RATINGS

Co
pyr
igh
t ©
2012
Th
e N
iels
en C
om
pan
y. C
on
fid
enti
al a
nd
pro
pri
etar
y.
7 Copyright ©2015 The Nielsen Company. Confidential and proprietary.
NIELSEN DIGITAL AD RATINGS (OCR) – FIRST TRUE MEASUREMENT OF DIGITAL & CROSS-PLATFORM CAMPAIGN REACH. ENABLES ADVERTISERS AND AGENCIES TO…
Measure digital media with metrics consistent with TV • Reach, Frequency, GRPs, Viewability metrics by demographics, DMA,
publisher, and placement
• Improved marketing mix modeling inputs
Negotiate more strongly with publishers and optimize digital plans in-flight
• Only MRC accredited approach for online demographic reach measurement
• Daily tracking of audience and on-target %
• Strong support among both buyers and sellers
Explore and affect cross-platform synergy across online and TV or mobile advertising
• Strategically maximize your unduplicated reach or reinforce your message across mediums to best meet your marketing objectives

Co
pyr
igh
t ©
2012
Th
e N
iels
en C
om
pan
y. C
on
fid
enti
al a
nd
pro
pri
etar
y.
8
>23,000 EXTERNAL CAMPAIGNS MEASURED TO DATE
WITH
>600 UNIQUE OWNERS
DIGITAL LEARNINGS – EFFICIENTLY REACHING AUDIENCE TARGETS CAN BE CHALLENGING
43% AVERAGE PERCENTAGE OF ON-TARGET IMPRESSIONS FOR NARROWLY DEFINED AGE GROUPS (<15 YEARS)
64% AVERAGE PERCENTAGE OF IMPRESSIONS SERVED OUT OF VIEW OR TO BOTS ACROSS THE INDUSTRY
59% AVERAGE PERCENTAGE OF ON-TARGET DEMO IMPRESSIONS OVERALL

Co
pyr
igh
t ©
2012
Th
e N
iels
en C
om
pan
y. C
on
fid
enti
al a
nd
pro
pri
etar
y.
9 Copyright ©2015 The Nielsen Company. Confidential and proprietary.
LEADING ADVERTISERS OPTIMIZE IN-FLIGHT WITH DCR AND ENSURE EFFECTIVE CAMPAIGN DELIVERY
ON-TARGET PERCENT
VIEWABILITY
16% On-Target
48% On-Target
• Identify under-performing publishers/sites/placements
• Understand how different categories of ad placements perform with different demos
• Understand what percent of your campaign had the opportunity to be seen by a user in a viewable portion of the screen
• Identify fraudulent views 24%
Viewable Impressions
52% Viewable
Impressions
Optimize campaign reach in-flight and negotiate viewable on-target reach guarantees to maximize ROI

Co
pyr
igh
t ©
2012
Th
e N
iels
en C
om
pan
y. C
on
fid
enti
al a
nd
pro
pri
etar
y.
10 Copyright ©2015 The Nielsen Company. Confidential and proprietary.
Immediately maximize ROI, tie publisher pay to true delivery, and ensure quality placements with DCR-based reach guarantees
MAJOR PUBLISHERS OFFERING AUDIENCE GUARANTEES BASED
ON NIELSEN OCR INCLUDE…
DCR EMPOWERS CLIENTS TO NEGOTIATE GUARANTEED AUDIENCE DELIVERY

RESONANCE: TV BRAND EFFECT (TVBE)

Co
pyr
igh
t ©
2012
Th
e N
iels
en C
om
pan
y. C
on
fid
enti
al a
nd
pro
pri
etar
y.
12 Copyright ©2015 The Nielsen Company. Confidential and proprietary.
• Daily surveying of consumers about the National TV Shows they watched the day before and the ads we know they were exposed to
• Based on in-home exposure to reflect natural viewing environment
• Weighted daily to align with US TV population
• It’s syndicated… continuous measurement of nearly all ads on TV
• Ad effectiveness is always measured in the context of the media environment
• Key Performance Dimensions: Ad Memorability, Brand and Message Memorability and Appeal
TV BRAND EFFECT IS AN IN-MARKET PERFORMANCE ASSESSMENT TOOL
Co
pyr
igh
t ©
2012
Th
e N
iels
en C
om
pan
y. C
on
fid
enti
al a
nd
pro
pri
etar
y.
13
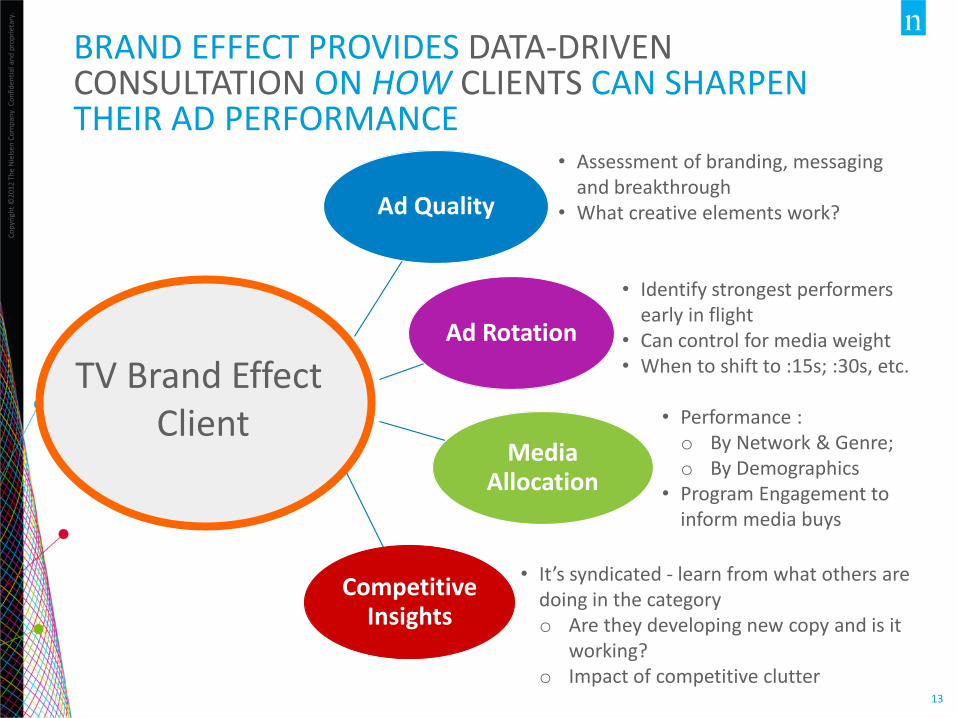
Ad Quality
Ad Rotation
Media Allocation
Competitive Insights
• Assessment of branding, messaging and breakthrough
• What creative elements work?
• Identify strongest performers early in flight
• Can control for media weight • When to shift to :15s; :30s, etc.
• Performance : o By Network & Genre; o By Demographics
• Program Engagement to inform media buys
• It’s syndicated - learn from what others are doing in the category o Are they developing new copy and is it
working? o Impact of competitive clutter
TV Brand Effect Client
BRAND EFFECT PROVIDES DATA-DRIVEN CONSULTATION ON HOW CLIENTS CAN SHARPEN THEIR AD PERFORMANCE

Co
pyr
igh
t ©
2012
Th
e N
iels
en C
om
pan
y. C
on
fid
enti
al a
nd
pro
pri
etar
y.
14 Copyright ©2015 The Nielsen Company. Confidential and proprietary.
THE IMPACT OF TV ADS ARE MEASURED VIA SURVEYS ONLINE
2 Nielsen records TV ads within coverage
4 Panelists chooses the shows viewed the previous day 5 Panelist answers 5 core
questions about the ads that appeared in those shows
1 Viewers watch TV in normal, real-world environment—NOT FORCED EXPOSURE
3 Nielsen editorial teams write surveys for all covered content nightly
HOURS
24
HOURS
24
6 Data is available for ad performance analysis within 48-hours
NIESEN TV BRAND EFFECT: HOW IT WORKS

Co
pyr
igh
t ©
2012
Th
e N
iels
en C
om
pan
y. C
on
fid
enti
al a
nd
pro
pri
etar
y.
15 Copyright ©2015 The Nielsen Company. Confidential and proprietary.
• Over 6 million registered users weighted align with the US TV viewing population
• Diverse set of panelists acquired through various sources
• ~26K unique individuals participate weekly and take 4+ quizzes per week on average
• Data is reweighted daily to the TV Viewing Population
• High panel turnover rate (~65% new each month)
REWARD TV PANEL SNAPSHOT

Co
pyr
igh
t ©
2012
Th
e N
iels
en C
om
pan
y. C
on
fid
enti
al a
nd
pro
pri
etar
y.
16 Copyright ©2015 The Nielsen Company. Confidential and proprietary.
AMONG AD VIEWERS THAT HAD THE OPPORTUNITY TO SEE ADS
2
WHO WAS BEING
ADVERTISED?
3
WHY SHOULD I BUY
IT?
WHAT
1
HAPPENED IN THE AD?
IF CORRECT
IF CORRECT
LIKE DID I
THE AD?
4
BUY AM I GOING 2
IT?
5
TVBE METRICS
AD MEMORABILITY
BRAND MEMORABILITY
MESSAGE MEMORABILITY
LIKEABILITY
PURCHASE INTEREST
[BREAKTHROUGH] [NET IMPACT] [TOP 2 BOX] [TOP 2 BOX]
AD PERFORMANCE IS DEFINED BY 5 SIMPLE QUESTIONS

Co
pyr
igh
t ©
2012
Th
e N
iels
en C
om
pan
y. C
on
fid
enti
al a
nd
pro
pri
etar
y.
17 Copyright ©2015 The Nielsen Company. Confidential and proprietary.
AD MEMORABILITY
In a commercial during this show, who discussed a financial services Web site with a man who looked at himself in a mirror while preparing to go to the bank? • Green puppet wearing only his underwear who stated that was how he dressed to
get a mortgage • Pale vampire who appeared from a puff of smoke and desperately needed to extend
his line of credit • Alien who wanted to lower his interest rates to pay off debts and showed a picture of
his growing family • Clumsy clown who had a car accident and was trying to find out if he could take out a
loan for expenses
BRAND MEMORABILITY
What was this a commercial for? • LendingTree.com • Fannie Mae Foundation • Champion Mortgage • H&R Block
MESSAGE MEMORABILITY
According to this commercial, why should you call or visit LendingTree.com? • Provides you with multiple competitive offers • Waives your application fee immediately
• Has payoff programs designed for your needs
LIKEABILITY
How much did you like this advertisement? • I liked it a lot • I liked it somewhat • I am neutral • I disliked it somewhat • I disliked it a lot
SAMPLE SURVEY: LENDING TREE “UNDERWEAR (:30)”

Co
pyr
igh
t ©
2012
Th
e N
iels
en C
om
pan
y. C
on
fid
enti
al a
nd
pro
pri
etar
y.
18
Of those viewers who remember an ad’s content, the
percentage that are able to identify the advertised brand
Of all ad viewers, the percentage that remember
both the ad’s content and the advertised brand
The percentage of an ad’s natural in-home viewers who
are able to remember its content the next day
• LendingTree’s ad performance in 2014 has improved significantly from 2013 o Brand association was very strong among the viewers who recalled the ads
• LendingTree and Quicken at parity on advertising resonance in 2014 so far
Ad Breakthrough & Branding Performance (Cumulative)
A letter above a number indicates a significant difference at the 90% Level of Confidence
Source: Nielsen TV Brand Effect LendingTree, Quicken 1/1/14 – 7/31/14. Based on A18+
TVBE HELPS EVALUATE IN-MARKET PERFORMANCE AGAINST COMPETITORS AND HISTORICAL NORMS
C 40%
BCD 72%
CD 29%
C 42%
D 68%
CD 29%
35%
D 67%
23%
C 41%
56%
23%
General Recall Brand Linkage Brand Recall
LendingTree - A Quicken - B 2013 LendingTree - C 2013 TVBE Norm - D

Co
pyr
igh
t ©
2012
Th
e N
iels
en C
om
pan
y. C
on
fid
enti
al a
nd
pro
pri
etar
y.
19
• LendingTree did a much better job of communicating its message as compared to Quicken
• Appeal can be used to track wear out
Among those who recall the ad and the brand, the percentage who could liked the ad “a lot”
or “somewhat”
Among those who recall the ad and the brand, the percentage who could recall the message
Messaging and Appeal (Cumulative)
KEEP TABS ON HOW WELL VIEWERS PLAY BACK VARIOUS MESSAGES AND WHETHER THEY LIKE THE ADS
B 75%
45%
56%
43%
B 73%
43%
B 73%
ABC 53%
Message Linkage Likeability Linkage
LendingTree - A Quicken - B 2013 LendingTree - C 2013 TVBE Norm - D
A letter above a number indicates a significant difference at the 90% Level of Confidence
Source: Nielsen TV Brand Effect LendingTree, Quicken 1/1/14 – 7/31/14. Based on A18+

Co
pyr
igh
t ©
2012
Th
e N
iels
en C
om
pan
y. C
on
fid
enti
al a
nd
pro
pri
etar
y.
20
35%
25%
18%
13%
7%
Mortgage - Glen -Underwear (:30)
Mortgage - Glen - BreakUp (:30)
Mortgage - First Kiss(:15)
Mortgage - Geln -Marriage (:30)
Mortgage - Dummy (:15)
2014 LendingTree Brand Recall by Ad
Sample too low to report on Mortgage – Death Contract Source: Nielsen TV Brand Effect 1/1/14 – 7/31/14. Based on A18+
USE TVBE TO INFORM AD ROTATION • Underwear and Break Up were the heaviest supported spots in the year, and also the key drivers
of LendingTree’s Brand Recall performance • TVBE also has the ability to level set ad performance by controlling for GRP level

Co
pyr
igh
t ©
2012
Th
e N
iels
en C
om
pan
y. C
on
fid
enti
al a
nd
pro
pri
etar
y.
21
Minimum sample shown = 100
Source: Nielsen TV Brand Effect 1/1/13 – 7/31/14. Based on A18+
0%
10%
20%
30%
40%
50%
60%
70%
Jan Feb Mar Apr May Jun Jul Aug Sep Oct Nov Dec Jan Feb Mar Apr May Jun Jul
LendingTree Quicken 2013 TVBE Norm
2013 2014
Trended Brand Recall: LendingTree vs. Competitors
ONGOING BRAND AND COMPETITOR TRACKING FOR WHEN OPTIMIZATION IS NEEDED • Use TVBE to track LendingTree and competitor brands on a bi-weekly/monthly
basis to make performance improvement decisions in real time
Co
pyr
igh
t ©
2012
Th
e N
iels
en C
om
pan
y. C
on
fid
enti
al a
nd
pro
pri
etar
y.
22
USA
HGTV
HISTORY
SYFY
COMEDY
NGC
Fox Sports 1
0%
10%
20%
30%
40%
50%
60%
70%
80%
90%
100%
0% 10% 20% 30% 40% 50% 60% 70% 80% 90% 100%
Bra
nd
Lin
kage
General Recall
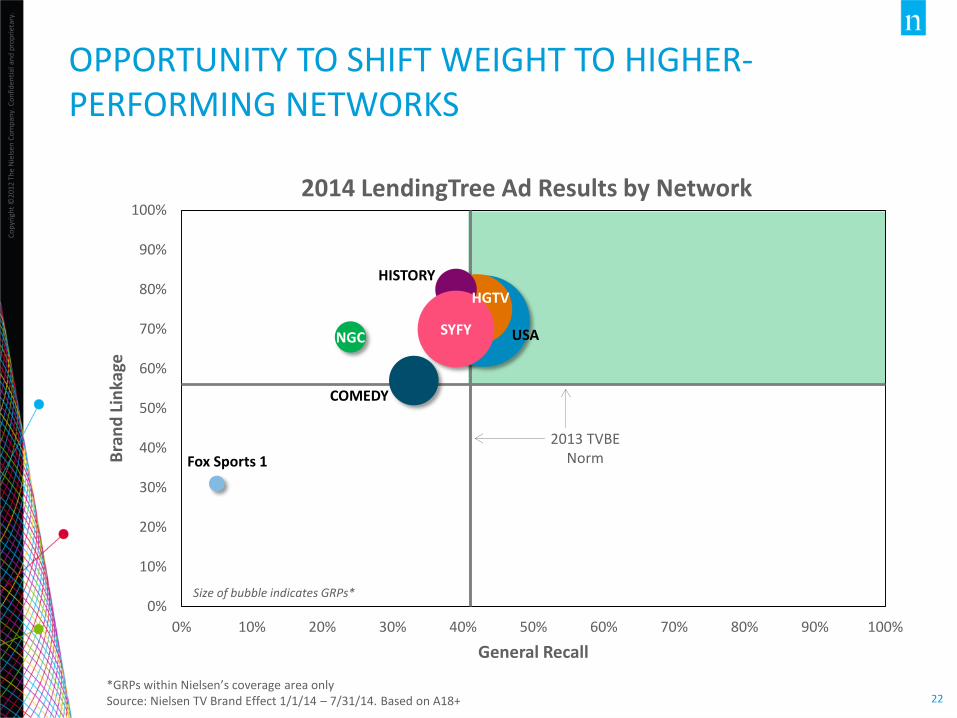
OPPORTUNITY TO SHIFT WEIGHT TO HIGHER-PERFORMING NETWORKS
2013 TVBE Norm
2014 LendingTree Ad Results by Network
*GRPs within Nielsen’s coverage area only Source: Nielsen TV Brand Effect 1/1/14 – 7/31/14. Based on A18+
Size of bubble indicates GRPs*

Co
pyr
igh
t ©
2012
Th
e N
iels
en C
om
pan
y. C
on
fid
enti
al a
nd
pro
pri
etar
y.
23 Copyright ©2015 The Nielsen Company. Confidential and proprietary. Source: Cumulative cross-client learning, and multiple publicly shared TV Brand Effect (TVBE) meta studies
Common Creative Characteristics of Highly Memorable Ads Branding
Drivers
Brand Cues Early & Often,
Visual & Verbal
Leverage Brand Icon
Integrate Brand In Storyline
‘Ownable’ Creative Concept
Message as Brand Cue
Upbeat & Simple Storyline
to engage viewers from start-to-finish
(avoid quick-cut montages)
Relatable Characters &
Situations
Build an Emotional Connection (humor or sentimentality)
Novel/Striking Visual Imagery
Ad Memorability Drivers
SUMMARY OF TVBE’S UNIVERSAL CREATIVE BEST PRACTICES OF HIGHLY MEMORABLE TELEVISION ADS

REACTION: NIELSEN BUYER INSIGHTS (NBI)

Co
pyr
igh
t ©
2012
Th
e N
iels
en C
om
pan
y. C
on
fid
enti
al a
nd
pro
pri
etar
y.
25 Copyright ©2015 The Nielsen Company. Confidential and proprietary.
MEASURE CONSUMER REACTION TO A CLIENT’S ADS Nielsen Buyer Insights is an innovative single source database provides new opportunities for measuring media impact and improving media efficiency.
Nielsen Buyer Insights integrates:
Consumer Media behavior
Actual online and offline transaction activity
• Representing credit card purchases and deposit account activity
• Sortable category code and outlet type • Comprehensive coverage across
banks/card issuers
• Based on actual TV, online ad schedules and exposure
• Cut at creative and campaign level • Sortable by demo, media type, timing • Across range of competitors

Co
pyr
igh
t ©
2014
Th
e N
iels
en C
om
pan
y. C
on
fid
enti
al a
nd
pro
pri
etar
y.
26 Copyright ©2014 The Nielsen Company. Confidential and proprietary.
NBI - A POWERFUL, YET FLEXIBLE TOOL
NBI has been used by a number of large Financial Institutions (and others) to measure the impact of their advertising. We have measured the impact of advertising on:
• Card ownership
• Sales penetration
• Balance penetration
• End of period balance
• Spend per card user
• Transactions per card user
• Dollars per transaction on card
• Share of spend
• Card primacy (top of wallet)
• Total credit card category dollars
• Total credit card category transactions

Co
pyr
igh
t ©
2012
Th
e N
iels
en C
om
pan
y. C
on
fid
enti
al a
nd
pro
pri
etar
y.
27 Copyright ©2015 The Nielsen Company. Confidential and proprietary.
MEASURE AD IMPACT AND COMPARE TO OTHERS
MEASURE: AD LIFT ON CARD
USAGE
MEASURE: AD LIFT ON CARD
USAGE
Bank ABC’s ads have not been as successful as competition in driving share of spend.
Source: Nielsen NBI
3.6%
-1.2%
5-BANK BENCHMARK(2012)
BANK ABC(2012)
AD IMPACT ON SHARE OF SPEND
Recommend leveraging NBI to evaluate the recent Bank ABC card campaign and compare against a competitive benchmark.

Co
pyr
igh
t ©
2012
Th
e N
iels
en C
om
pan
y. C
on
fid
enti
al a
nd
pro
pri
etar
y.
28
• Independence and 3rd party credibility
• Broadest “Spend” data access – ~80% of credit card transaction data
• “Watch” data – gold standard Nielsen panels and near census data sets
• Long standing “Single Source” experience via Nielsen Catalina Solutions (~5 years) and Nielsen Buyer Insights (~2 years)
• Deep Modeling Expertise -- Largest Mix Modeling business in the world
• Data Science –To address inherent data biases
• Highest level standards and protocols to ensure privacy compliance
WHAT MAKES NIELSEN DIFFERENT

Copyright ©2015 The Nielsen Company. Confidential and proprietary.
THANK YOU!

Copyright ©2015 The Nielsen Company. Confidential and proprietary.
APPENDIX

Co
pyr
igh
t ©
2012
Th
e N
iels
en C
om
pan
y. C
on
fid
enti
al a
nd
pro
pri
etar
y.
31 Copyright ©2015 The Nielsen Company. Confidential and proprietary.
Broadcast Network Coverage
• FOX is measured Monday thru Friday 8-10pm and Saturday thru Sunday 12-10pm.
• CW is measured Monday thru Friday 8-10pm and Sunday 7-10pm.
• Telemundo and Univision are measured Monday thru Sunday 7-11pm.
• ABC, NBC, CBS are measured Monday thru Friday from 8-11pm and Saturday thru Sunday from 12-11pm with the following exceptions: – Nightline – Jimmy Kimmel Live – Tonight Show with Jay Leno – Saturday Night Live – Nightly National News – All networks – Late Late Show with Craig Ferguson – Late Show with David Lettermen – Late Night with Jimmy Fallon
Cable Network Coverage
All Cable Networks (listed below) are measured Monday thru Sunday from 6-12 pm.
• Comedy Central • VH1 • TNT • USA • Food Network • Lifetime • Discovery Channel • Bravo • TLC • History • TBS • Nick@Nite • ESPN
• HGTV • MTV • F/X • SyFy • Speed • A & E • OWN (2011 only)
• National Geographic (as of 6.1.12)
• TruTV (as of 7.1.12)
• AMC (as of 10.1.12)
• Cartoon Network (as of 7.1.12)
Syndication Coverage
• Jeopardy • Insider • Extra • Entertainment Tonight • Wheel of Fortune • Access Hollywood
Sports
• Weekend Sports • Regional 4pm NFL • Selected 1pm NFL
International Coverage
• Syndicated coverage in the UK: 6 PM to Midnight (Channel 4, Channel 5, Sky, ITV) • Client-Specific Coverage: Germany, France, Russia, Australia, China, Mexico, Italy
BROADCAST & CABLE NETWORK COVERAGE
TV BRAND EFFECT OVERVIEW

Co
pyr
igh
t ©
2012
Th
e N
iels
en C
om
pan
y. C
on
fid
enti
al a
nd
pro
pri
etar
y.
32
DCR/XCR DELIVERY EXAMPLES • Depending on the products included in contract and the size of the media plan, the
delivery of data varies by campaign.
Dashboard Delivery Formal Delivery (PPT)
DCR/XCR are designed to be agency/advertiser dashboard tools.
Available API for MMM.
Integrated Digital Deliverables will include formal presentations.

Co
pyr
igh
t ©
2012
Th
e N
iels
en C
om
pan
y. C
on
fid
enti
al a
nd
pro
pri
etar
y.
33
OBE DASHBOARD: PURCHASE INTENT INSIGHT
Ad exposure drove a 22% lift in Top 2 Box
Purchase Intent
SAMPLE Visual indication that the sample is highly stable with a data
tolerance of +/-5% at the 95% confidence
interval

Co
pyr
igh
t ©
2013
Th
e N
iels
en C
om
pan
y. C
on
fid
enti
al a
nd
pro
pri
etar
y.
34
OBE NORMS: HOW GOOD IS YOUR BRAND LIFT?
20% Higher than the
Average purchase Intent brand lift

Co
pyr
igh
t ©
2012
Th
e N
iels
en C
om
pan
y. C
on
fid
enti
al a
nd
pro
pri
etar
y.
35
OBE DASHBOARD: CREATIVE STRENGTH INSIGHT:
By slicing the 22% brand lift at the
creative level, you can see that pre-roll ads were most effective.
Nearly 50% of respondents indicated
purchase intent

Co
pyr
igh
t ©
2012
Th
e N
iels
en C
om
pan
y. C
on
fid
enti
al a
nd
pro
pri
etar
y.
36
OBE DASHBOARD: SITE DRIVERS
IMPLICATIONS: Couple the insights from OBE together to drive some actionable strategy. In this case, it looks like ACME product probably resonates with males who are watching sports highlight videos online. There could be an optimization opportunity to have the ad network reallocate impressions to heavier video sites that aggregate male skewing content.
INSIGHT: By analyzing brand lift at the site level, you
can see which publishers are driving the largest lifts. In this case, sports.com, has
an 81% brand lift.
INSIGHT: Also take into
consideration the sample sizes.
Sports.com has the largest control and exposed sample, which is the best indicator of data
reliability

Co
pyr
igh
t ©
2013
Th
e N
iels
en C
om
pan
y. C
on
fid
enti
al a
nd
pro
pri
etar
y.
37
OBE DASHBOARD: BRAND LIFT BY FREQUENCY
67% 5-9 Exposures
Brand Lift