make your data beautiful!
TRANSCRIPT
Make your data beautiful

Let’s set the expectations!
intro Part 1
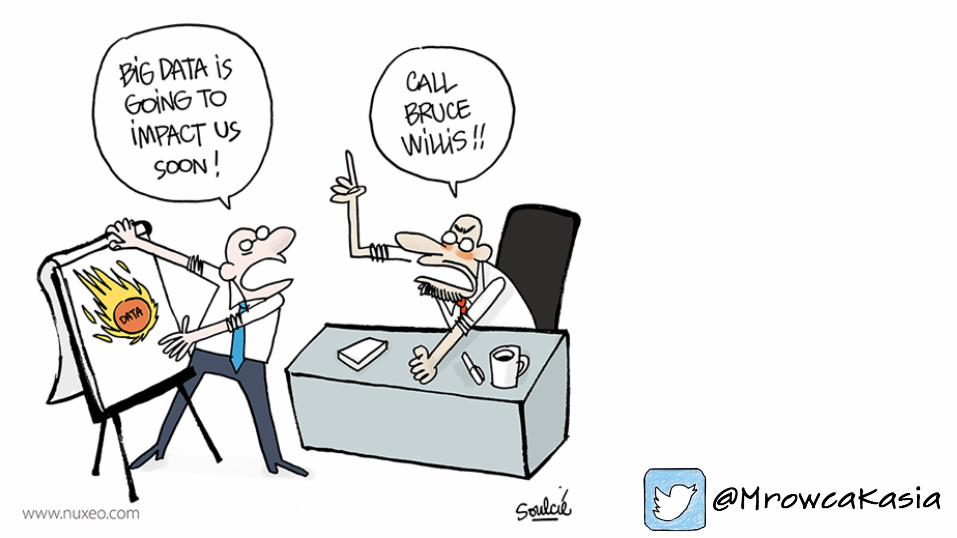
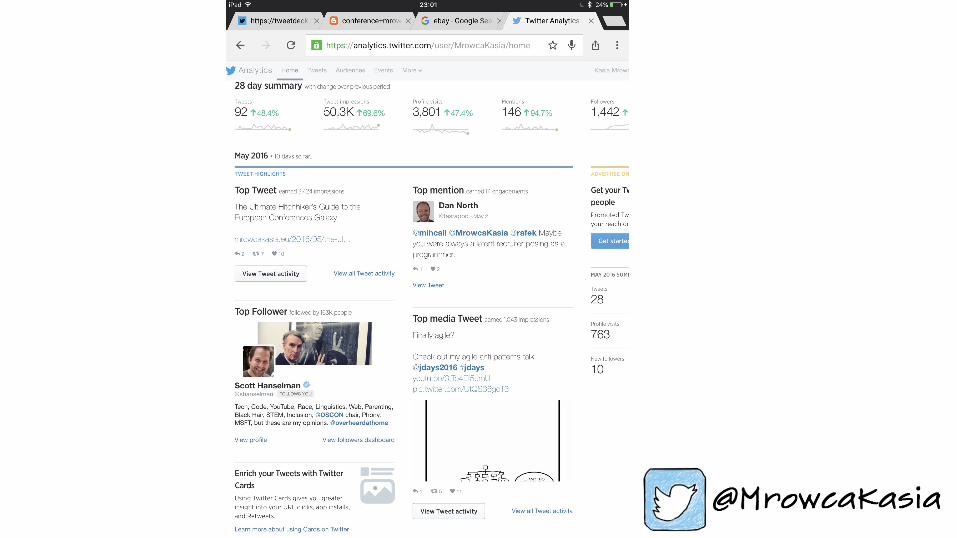
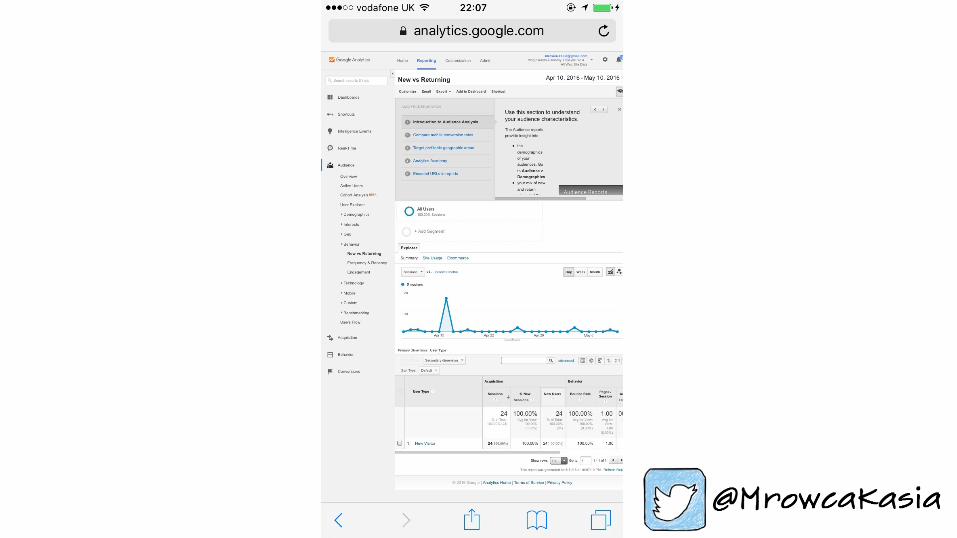
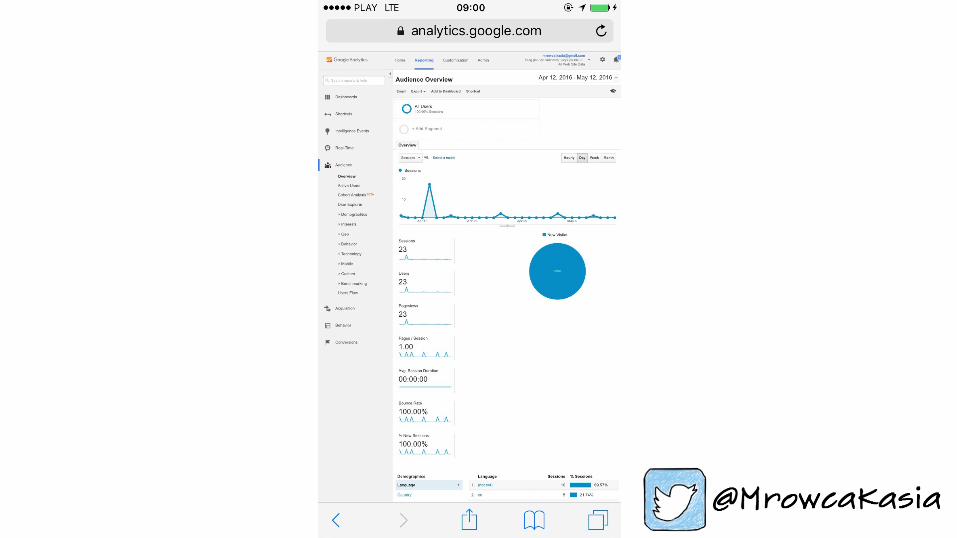
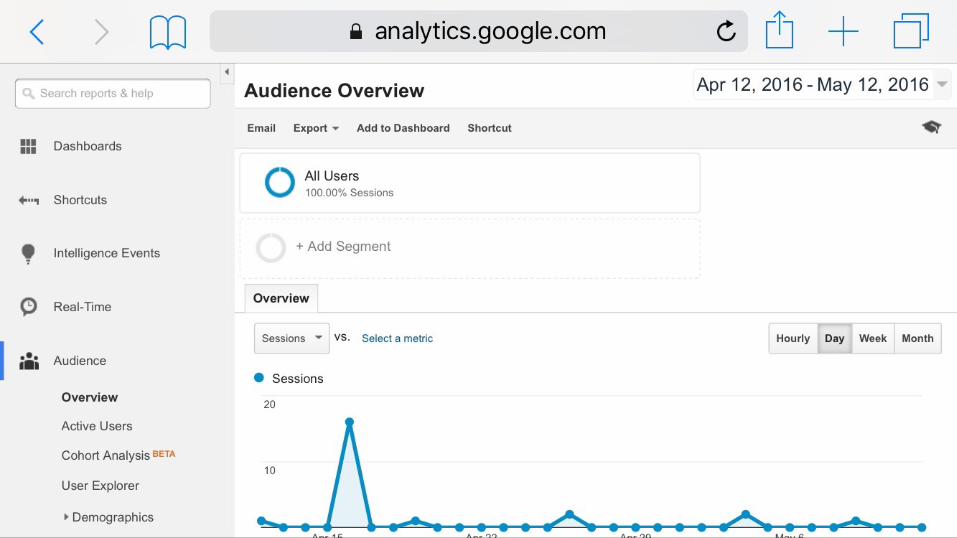
Data are everywhere!
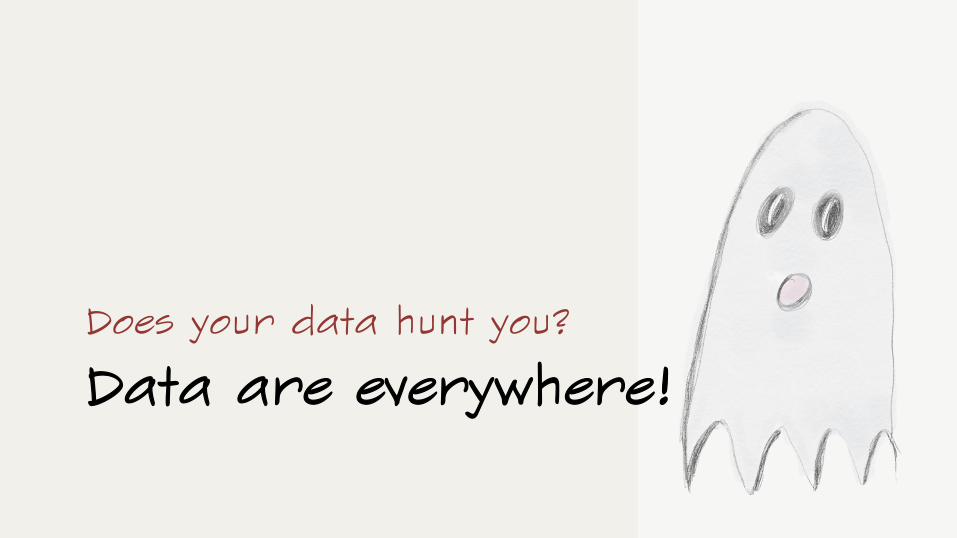
Data are everywhere! Does your data hunt you?
Cool data in YOUR systems! Discover
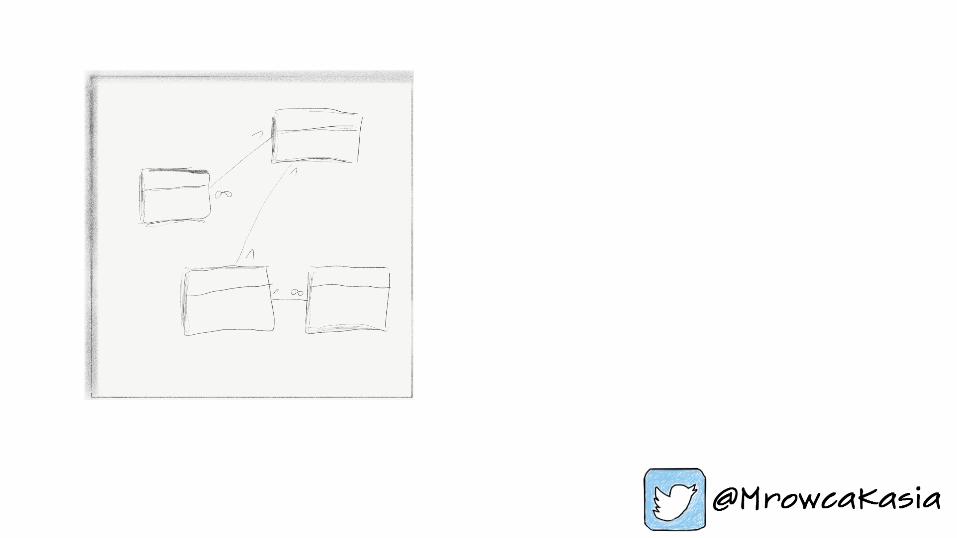
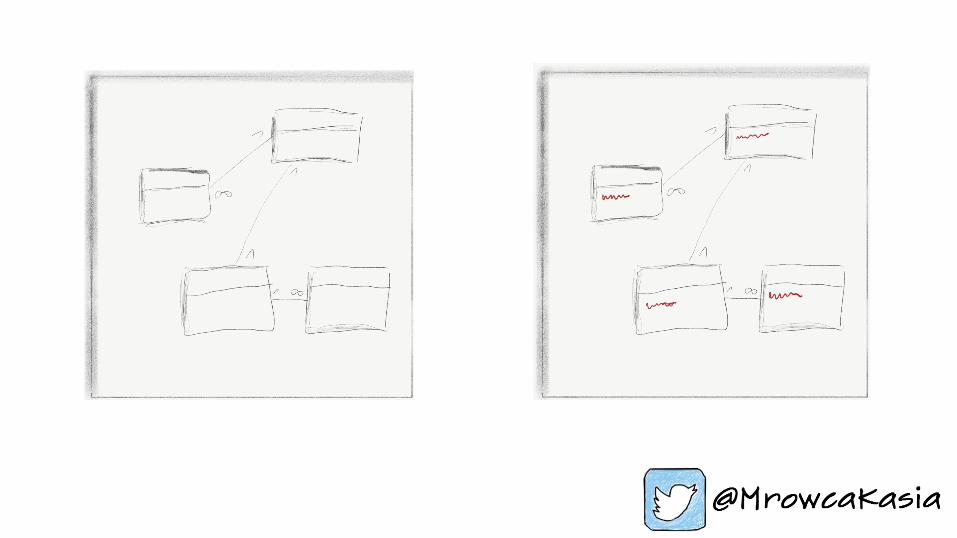
… lets connect the dots!

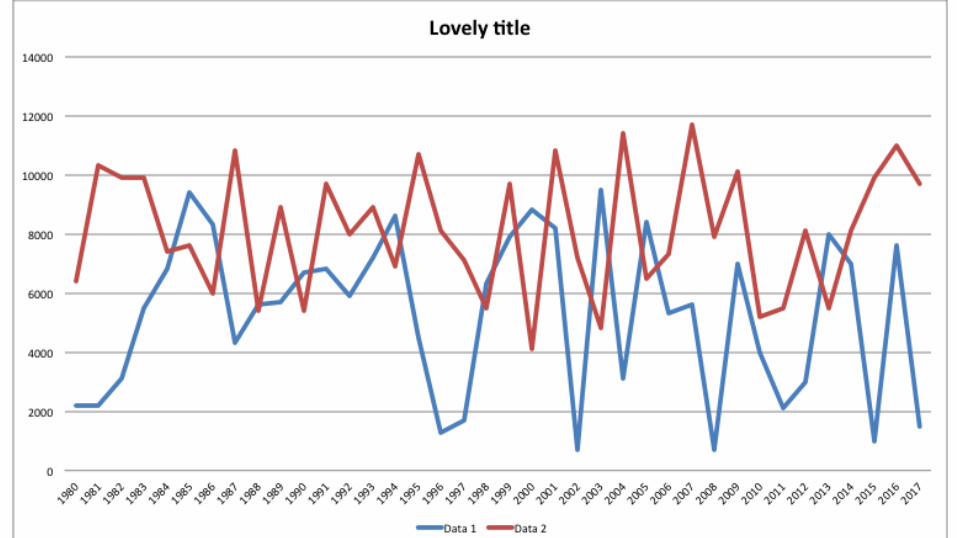
What can go wrong? Meaningful or meaningless?
Clean the data!
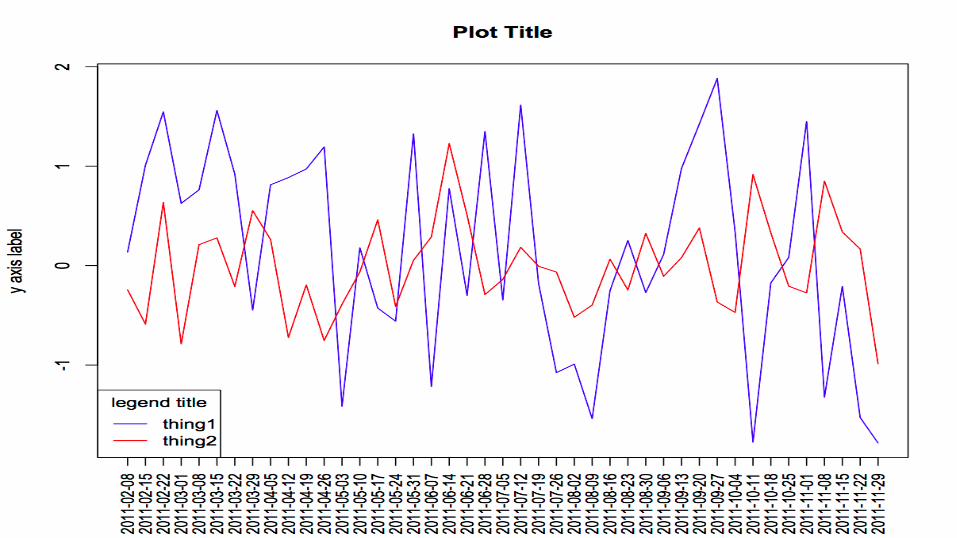
Correlation doesn’t imply causation!
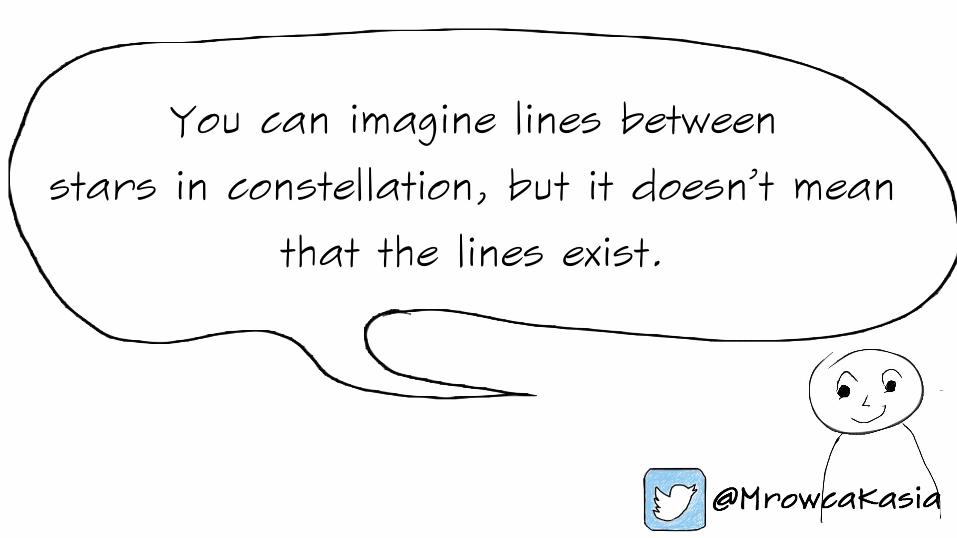
You can imagine lines between
stars in constellation, but it doesn’t mean
that the lines exist.
What can go wrong? UX/UI?


Power of visualization Part II
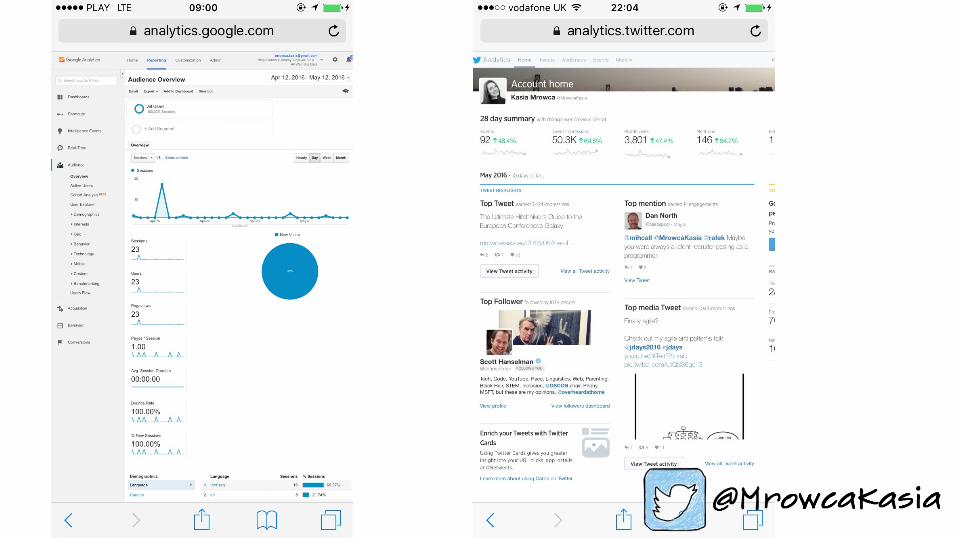
Target audience
… but where is THE pie chart?!
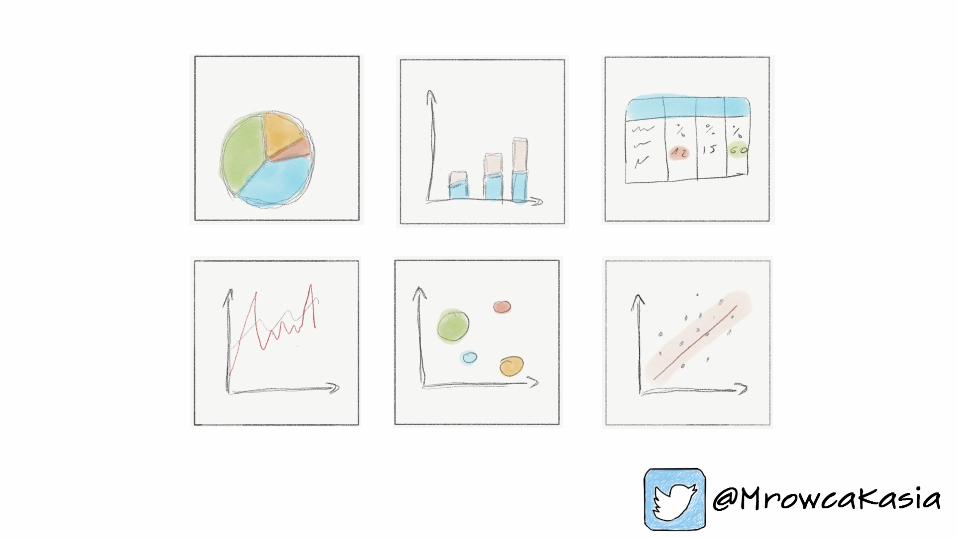
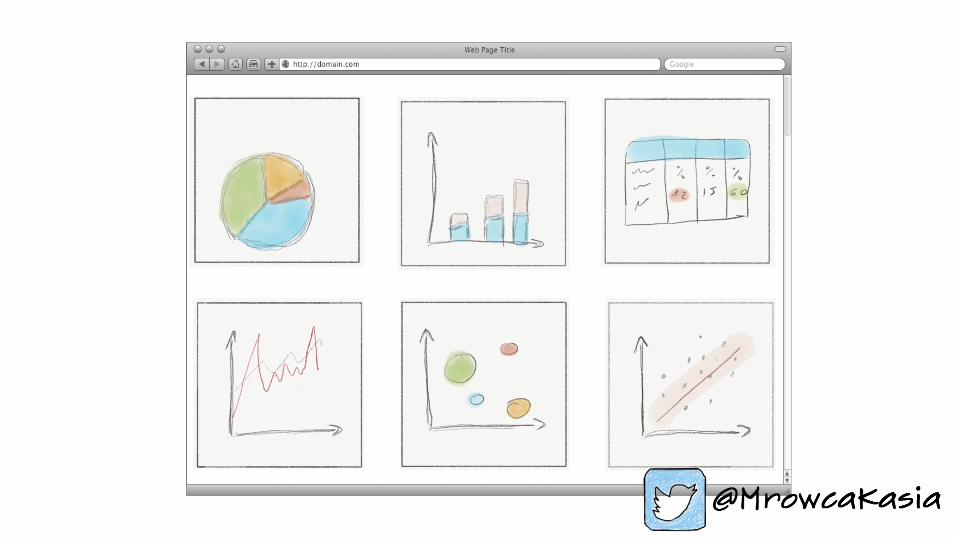
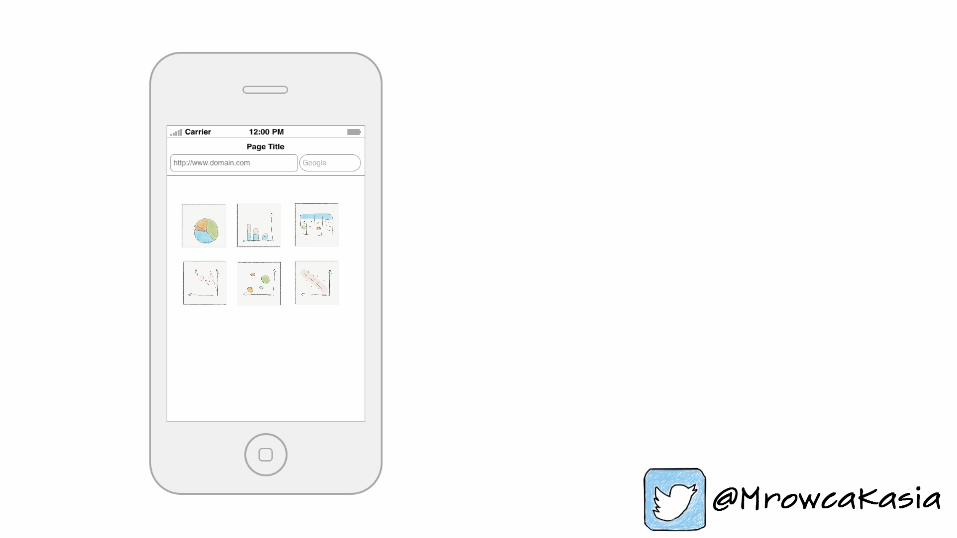
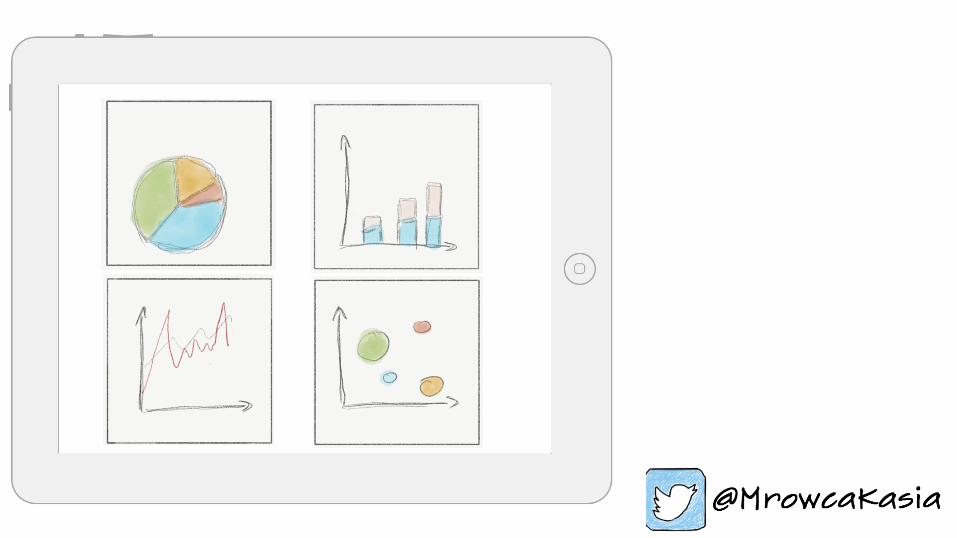
Fit to one screen If you can…

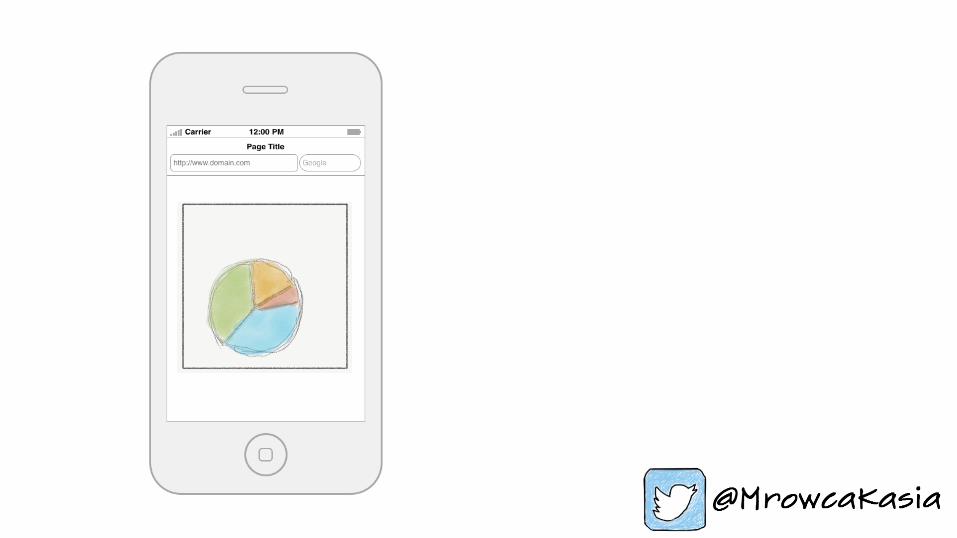
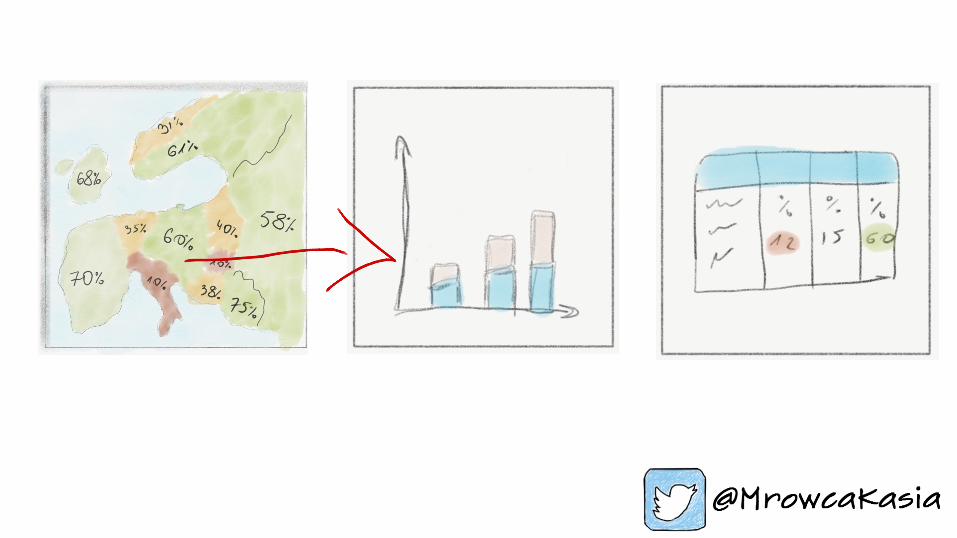
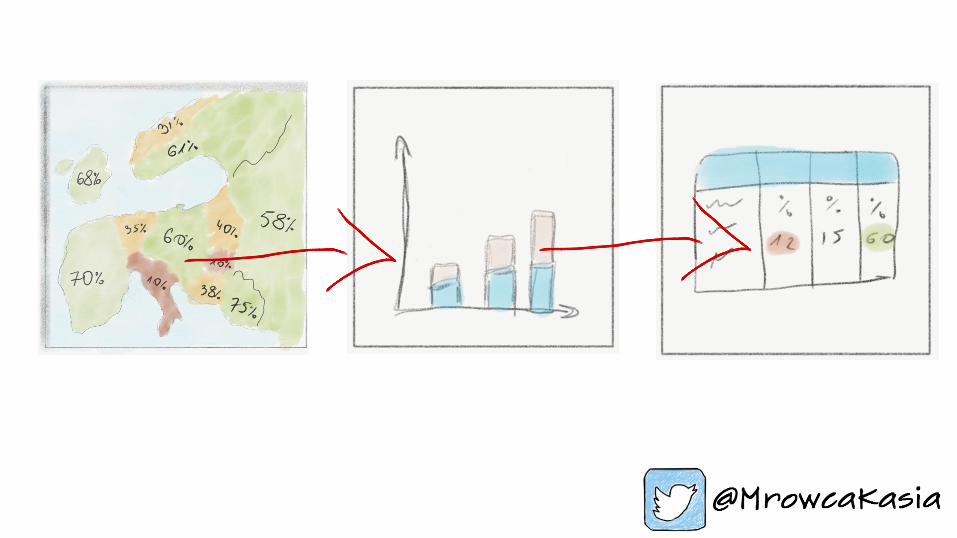
Top down
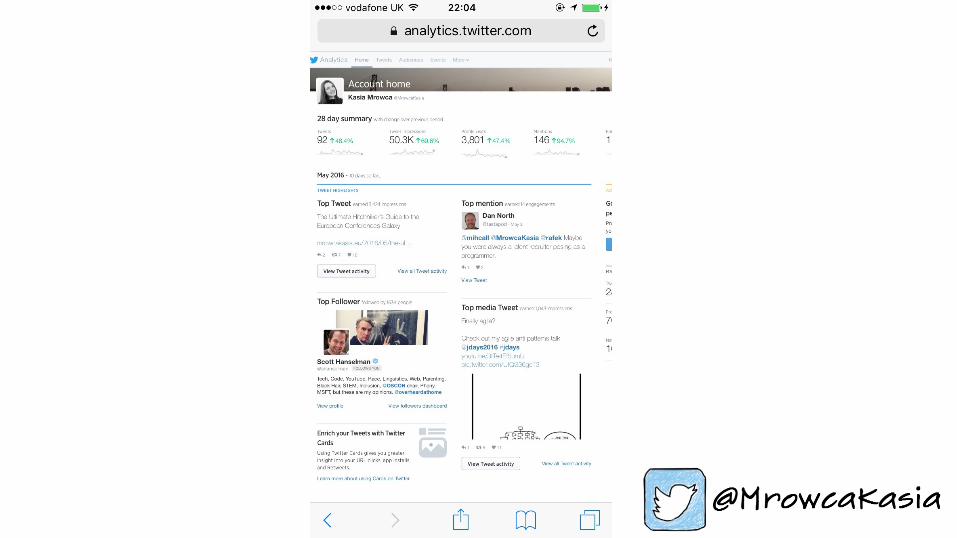
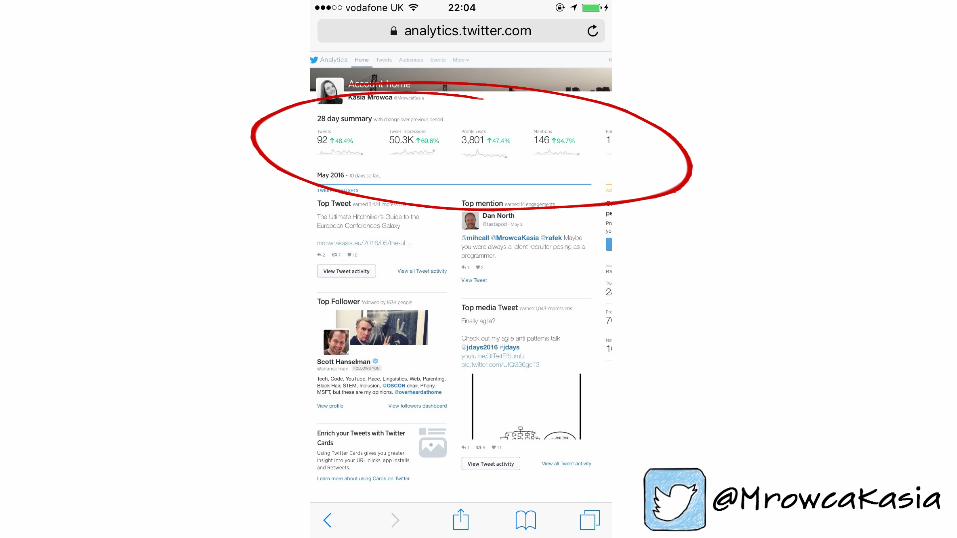
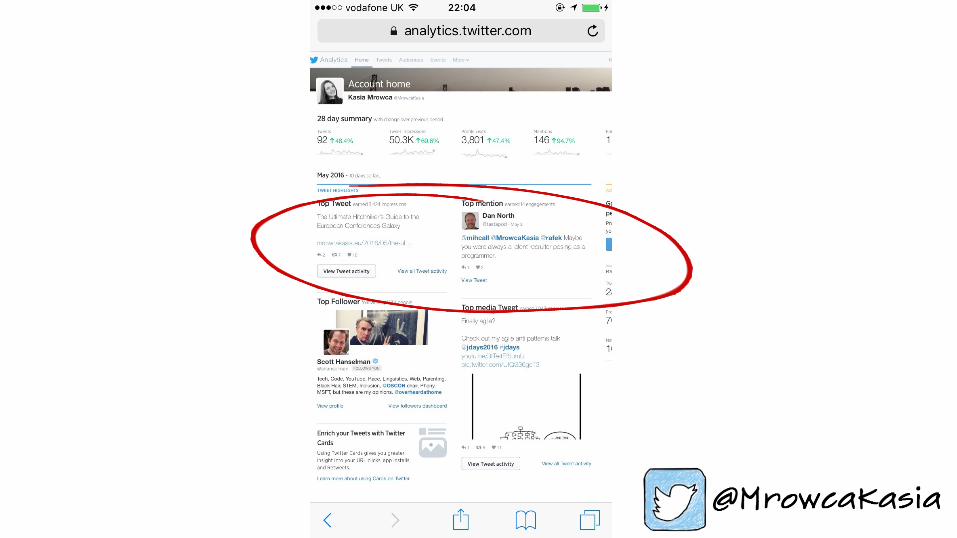
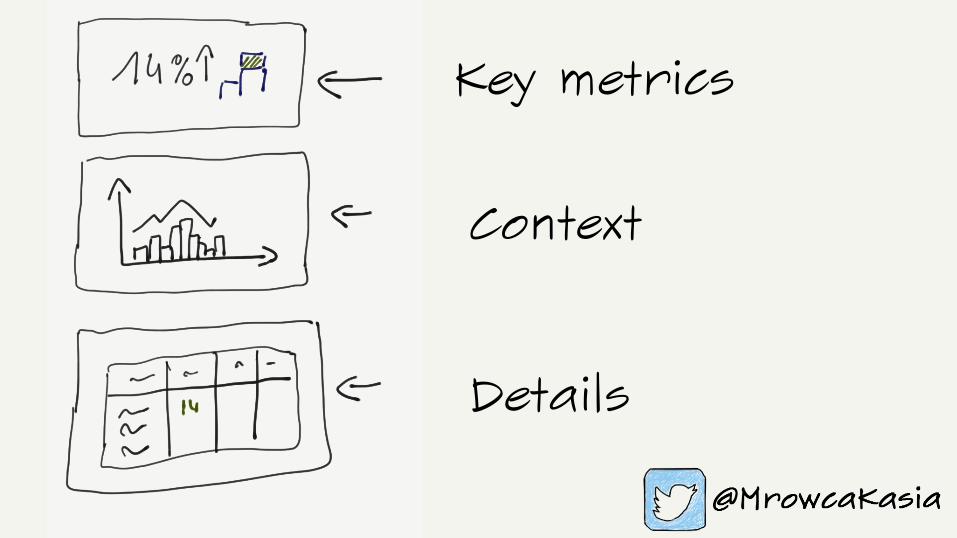
Key metrics
Context
Details
Design the ‘flow’
Make it interactive

Make it happen Part III
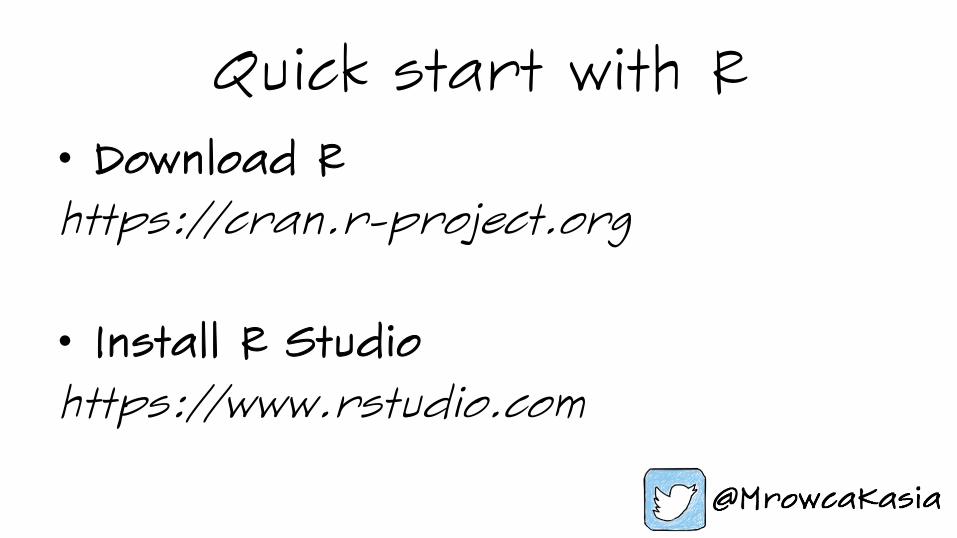
Quick start with R • Download R https://cran.r-project.org
• Install R Studio https://www.rstudio.com
install.packages("ggplot2")
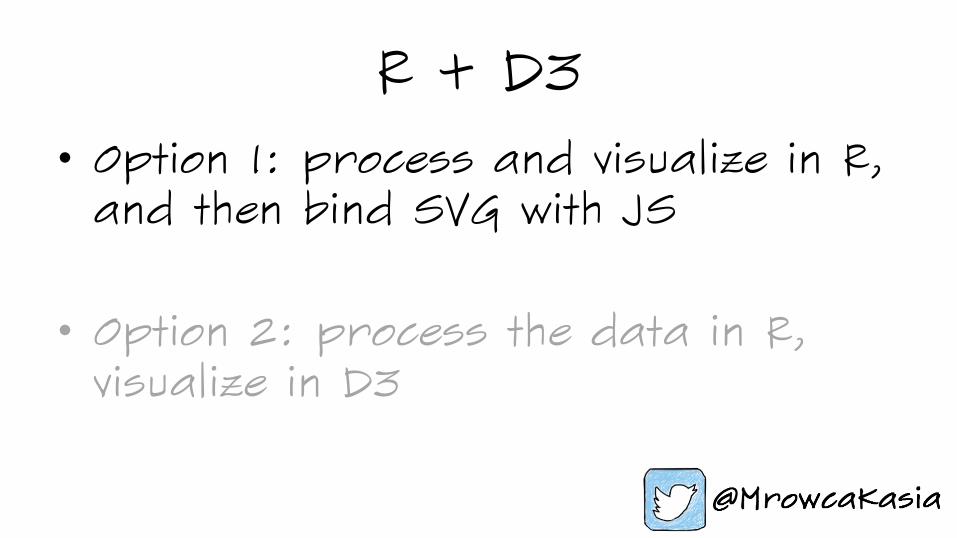
R + D3 • Option 1: process and visualize in R, and then bind SVG with JS
• Option 2: process the data in R, visualize in D3
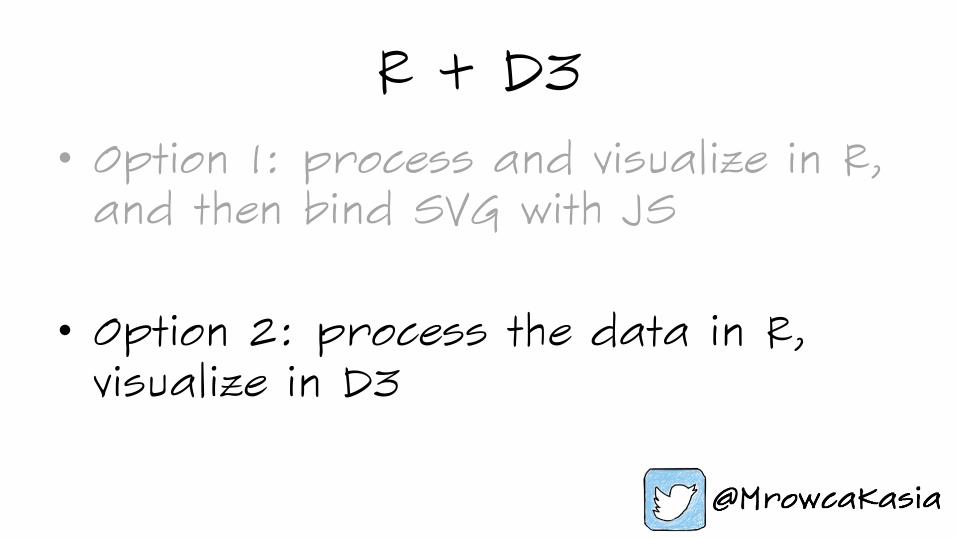
R + D3 • Option 1: process and visualize in R, and then bind SVG with JS
• Option 2: process the data in R, visualize in D3
install.packages(”shiny")
Play with data J
Design rules wrap up • Fit to one screen • Top down (drill down/roll up) • Make it interactive

www.mrowcakasia.eu [email protected]