make-up in russia - globalbusinesssjuteamavonup... · make-up in russia reference code: ... market...
TRANSCRIPT

www.datamonitor.com Datamonitor USA
245 Fifth Avenue
4th Floor
New York, NY 10016
USA
t: +1 212 686 7400
f: +1 212 686 2626
Datamonitor Europe
119 Farringdon Road
London EC1R 3DA
United Kingdom
t: +44 20 7551 9000
f: +44 20 7675 7500
Datamonitor Middle East
and North America
Datamonitor
PO Box 24893
Dubai, UAE
t: +49 69 9754 4517
f: +49 69 9754 4900
e: datamonitormena@
datamonitor.com
Datamonitor Asia Pacific
Level 46, 2 Park Street
Sydney, NSW 2000
Australia
t: +61 2 8705 6900
f: +61 2 8705 6901
Russia - Make-Up 0153 - 0700 - 2009
© Datamonitor. This profile is a licensed product and is not to be photocopied Page 1
INDUSTRY PROFILE
Make-Up in
Russia
Reference Code: 0153-0700
Publication Date: May 2010

EXECUTIVE SUMMARY
Russia - Make-Up 0153 - 0700 - 2009
© Datamonitor. This profile is a licensed product and is not to be photocopied Page 2
EXECUTIVE SUMMARY
Market value
The Russian make-up market grew by 8.7% in 2009 to reach a value of $1,576 million.
Market value forecast
In 2014, the Russian make-up market is forecast to have a value of $2,293.5 million, an increase of
45.5% since 2009.
Market volume
The Russian make-up market grew by 5.2% in 2009 to reach a volume of 205.9 million units.
Market volume forecast
In 2014, the Russian make-up market is forecast to have a volume of 255 million units, an increase of
23.8% since 2009.
Market segmentation I
Eye make-up is the largest segment of the make-up market in Russia, accounting for 33% of the market's
total value.
Market segmentation II
Russia accounts for 14.9% of the European make-up market value.
Market share
L'Oreal S.A. is the leading player in the Russian make-up market, generating a 25.7% share of the
market's value.
Market rivalry
The Russian make-up market is tending towards concentration, with the top three players holding 50.4%
of the total market by value.

CONTENTS
Russia - Make-Up 0153 - 0700 - 2009
© Datamonitor. This profile is a licensed product and is not to be photocopied Page 3
TABLE OF CONTENTS
EXECUTIVE SUMMARY 2
MARKET OVERVIEW 7
Market definition 7
Research highlights 8
Market analysis 9
MARKET VALUE 10
MARKET VOLUME 11
MARKET SEGMENTATION I 12
MARKET SEGMENTATION II 13
MARKET SHARE 14
FIVE FORCES ANALYSIS 15
Summary 15
Buyer power 17
Supplier power 18
New entrants 19
Substitutes 20
Rivalry 21
LEADING COMPANIES 22
L'Oreal S.A. 22
Oriflame Cosmetics SA 27
Procter & Gamble Company, The 31
MARKET DISTRIBUTION 35
MARKET FORECASTS 36
Market value forecast 36
Market volume forecast 37
MACROECONOMIC INDICATORS 38
APPENDIX 40
Methodology 40

CONTENTS
Russia - Make-Up 0153 - 0700 - 2009
© Datamonitor. This profile is a licensed product and is not to be photocopied Page 4
Industry associations 41
Related Datamonitor research 41
Disclaimer 42
ABOUT DATAMONITOR 43
Premium Reports 43
Summary Reports 43
Datamonitor consulting 43

CONTENTS
Russia - Make-Up 0153 - 0700 - 2009
© Datamonitor. This profile is a licensed product and is not to be photocopied Page 5
LIST OF TABLES
Table 1: Russia make-up market value: $ million, 2005–09(e) 10
Table 2: Russia make–up market volume: million units, 2005–09(e) 11
Table 3: Russia make-up market segmentation I:% share, by value, 2009(e) 12
Table 4: Russia make-up market segmentation II: % share, by value, 2009(e) 13
Table 5: Russia make-up market share: % share, by value, 2009(e) 14
Table 6: L'Oreal S.A.: key facts 22
Table 7: L'Oreal S.A.: key financials ($) 24
Table 8: L'Oreal S.A.: key financials (€) 25
Table 9: L'Oreal S.A.: key financial ratios 25
Table 10: Oriflame Cosmetics SA: key facts 27
Table 11: Oriflame Cosmetics SA: key financials ($) 28
Table 12: Oriflame Cosmetics SA: key financials (€) 29
Table 13: Oriflame Cosmetics SA: key financial ratios 29
Table 14: Procter & Gamble Company, The: key facts 31
Table 15: Procter & Gamble Company, The: key financials ($) 33
Table 16: Procter & Gamble Company, The: key financial ratios 33
Table 17: Russia make-up market distribution: % share, by value, 2009(e) 35
Table 18: Russia make-up market value forecast: $ million, 2009–14 36
Table 19: Russia make–up market volume forecast: million units, 2009–14 37
Table 20: Russia size of population (million), 2005–09 38
Table 21: Russia gdp (constant 2000 prices, $ billion), 2005–09 38
Table 22: Russia gdp (current prices, $ billion), 2005–09 38
Table 23: Russia inflation, 2005–09 39
Table 24: Russia consumer price index (absolute), 2005–09 39
Table 25: Russia exchange rate, 2005–09 39

CONTENTS
Russia - Make-Up 0153 - 0700 - 2009
© Datamonitor. This profile is a licensed product and is not to be photocopied Page 6
LIST OF FIGURES
Figure 1: Russia make-up market value: $ million, 2005–09(e) 10
Figure 2: Russia make–up market volume: million units, 2005–09(e) 11
Figure 3: Russia make-up market segmentation I:% share, by value, 2009(e) 12
Figure 4: Russia make-up market segmentation II: % share, by value, 2009(e) 13
Figure 5: Russia make-up market share: % share, by value, 2009(e) 14
Figure 6: Forces driving competition in the make-up market in Russia, 2009 15
Figure 7: Drivers of buyer power in the make-up market in Russia, 2009 17
Figure 8: Drivers of supplier power in the make-up market in Russia, 2009 18
Figure 9: Factors influencing the likelihood of new entrants in the make-up market in Russia,
2009 19
Figure 10: Factors influencing the threat of substitutes in the make-up market in Russia, 2009 20
Figure 11: Drivers of degree of rivalry in the make-up market in Russia, 2009 21
Figure 12: L'Oreal S.A.: revenues & profitability 26
Figure 13: L'Oreal S.A.: assets & liabilities 26
Figure 14: Oriflame Cosmetics SA: revenues & profitability 30
Figure 15: Oriflame Cosmetics SA: assets & liabilities 30
Figure 16: Procter & Gamble Company, The: revenues & profitability 34
Figure 17: Procter & Gamble Company, The: assets & liabilities 34
Figure 18: Russia make-up market distribution: % share, by value, 2009(e) 35
Figure 19: Russia make-up market value forecast: $ million, 2009–14 36
Figure 20: Russia make–up market volume forecast: million units, 2009–14 37

MARKET OVERVIEW
Russia - Make-Up 0153 - 0700 - 2009
© Datamonitor. This profile is a licensed product and is not to be photocopied Page 7
MARKET OVERVIEW
Market definition
The make-up market consists of eye make-up, face make-up, lip make-up and nail make-up. The market
is valued according to retail selling price (RSP) and includes any applicable taxes. Any currency
conversions used in the creation of this report have been calculated using constant 2009 annual average
exchange rates.
For the purpose of this report Europe is deemed to comprise Belgium, the Czech Republic, Denmark,
France, Germany, Hungary, Italy, Netherlands, Norway, Poland, Romania, Russia, Spain, Sweden, the
Ukraine and the United Kingdom.

MARKET OVERVIEW
Russia - Make-Up 0153 - 0700 - 2009
© Datamonitor. This profile is a licensed product and is not to be photocopied Page 8
Research highlights
The Russian make-up market generated total revenues of $1.6 billion in 2009, representing a compound
annual growth rate (CAGR) of 9% for the period spanning 2005-2009.
Eye make-up sales proved the most lucrative for the Russian make-up market in 2009, generating total
revenues of $519.5 million, equivalent to 33% of the market's overall value.
The performance of the market is forecast to decelerate, with an anticipated CAGR of 7.8% for the five-
year period 2009-2014, which is expected to lead the market to a value of $2.3 billion by the end of 2014.

MARKET OVERVIEW
Russia - Make-Up 0153 - 0700 - 2009
© Datamonitor. This profile is a licensed product and is not to be photocopied Page 9
Market analysis
The Russian make-up market grew at a strong rate between 2005 and 2009, due to strong sales growth
in the eye make-up, face make-up, lip make-up and nail make-up categories. However, the growth rate in
this market is expected to decelerate in the forthcoming five years.
The Russian make-up market generated total revenues of $1.6 billion in 2009, representing a compound
annual growth rate (CAGR) of 9% for the period spanning 2005-2009. In comparison, the French and
German markets grew with CAGRs of 2.7% and 3.6% respectively, over the same period, to reach
respective values of $1.9 billion and $1.8 billion in 2009.
Market consumption volumes increased with a CAGR of 5.2% between 2005-2009, to reach a total of
205.9 million units in 2009. The market's volume is expected to rise to 255 million units by the end of
2014, representing a CAGR of 4.4% for the 2009-2014 period.
Eye make-up sales proved the most lucrative for the Russian make-up market in 2009, generating total
revenues of $519.5 million, equivalent to 33% of the market's overall value. In comparison, sales of lip
make-up generated revenues of $511.3 million in 2009, equating to 32.4% of the market's aggregate
revenues.
The performance of the market is forecast to decelerate, with an anticipated CAGR of 7.8% for the five-
year period 2009-2014, which is expected to lead the market to a value of $2.3 billion by the end of 2014.
Comparatively, the French and German markets will grow with CAGRs of 2% and 2.9% respectively, over
the same period, to reach respective values of $2.1 billion each in 2014.

MARKET VALUE
Russia - Make-Up 0153 - 0700 - 2009
© Datamonitor. This profile is a licensed product and is not to be photocopied Page 10
MARKET VALUE
The Russian make-up market grew by 8.7% in 2009 to reach a value of $1,576 million.
The compound annual growth rate of the market in the period 2005–09 was 9%.
Table 1: Russia make-up market value: $ million, 2005–09(e)
Year $ million RUB million € million % Growth
2005 1,118.2 35,634.9 804.2
2006 1,218.2 38,821.8 876.1 8.9
2007 1,331.5 42,429.6 957.5 9.3
2008 1,450.4 46,218.8 1,043.0 8.9
2009(e) 1,576.0 50,223.6 1,133.4 8.7
CAGR: 2005–09 9.0%
Source: Datamonitor D A T A M O N I T O R
Figure 1: Russia make-up market value: $ million, 2005–09(e)
Source: Datamonitor D A T A M O N I T O R

MARKET VOLUME
Russia - Make-Up 0153 - 0700 - 2009
© Datamonitor. This profile is a licensed product and is not to be photocopied Page 11
MARKET VOLUME
The Russian make-up market grew by 5.2% in 2009 to reach a volume of 205.9 million units.
The compound annual growth rate of the market in the period 2005–09 was 5.2%.
Table 2: Russia make–up market volume: million units, 2005–09(e)
Year million units % Growth
2005 167.8
2006 175.2 4.4
2007 185.7 6.0
2008 195.8 5.4
2009(e) 205.9 5.2
CAGR: 2005–09 5.2%
Source: Datamonitor D A T A M O N I T O R
Figure 2: Russia make–up market volume: million units, 2005–09(e)
Source: Datamonitor D A T A M O N I T O R

MARKET SEGMENTATION I
Russia - Make-Up 0153 - 0700 - 2009
© Datamonitor. This profile is a licensed product and is not to be photocopied Page 12
MARKET SEGMENTATION I
Eye make-up is the largest segment of the make-up market in Russia, accounting for 33% of the market's
total value.
The lip make-up segment accounts for a further 32.4% of the market.
Table 3: Russia make-up market segmentation I:% share, by value, 2009(e)
Category % Share
Eye make-up 33.0%
Lip make-up 32.4%
Face make-up 20.4%
Nail make-up 14.2%
Total 100%
Source: Datamonitor D A T A M O N I T O R
Figure 3: Russia make-up market segmentation I:% share, by value, 2009(e)
Source: Datamonitor D A T A M O N I T O R

MARKET SEGMENTATION II
Russia - Make-Up 0153 - 0700 - 2009
© Datamonitor. This profile is a licensed product and is not to be photocopied Page 13
MARKET SEGMENTATION II
Russia accounts for 14.9% of the European make-up market value.
Ukraine accounts for a further 3.8% of the European market.
Table 4: Russia make-up market segmentation II: % share, by value, 2009(e)
Category % Share
Russia 14.9%
Ukraine 3.8%
Poland 3.2%
Hungary 0.7%
Rest of Europe 77.4%
Total 100%
Source: Datamonitor D A T A M O N I T O R
Figure 4: Russia make-up market segmentation II: % share, by value, 2009(e)
Source: Datamonitor D A T A M O N I T O R

MARKET SHARE
Russia - Make-Up 0153 - 0700 - 2009
© Datamonitor. This profile is a licensed product and is not to be photocopied Page 14
MARKET SHARE
L'Oreal S.A. is the leading player in the Russian make-up market, generating a 25.7% share of the
market's value.
Oriflame Cosmetics SA accounts for a further 17.2% of the market.
Table 5: Russia make-up market share: % share, by value, 2009(e)
Company % Share
L'Oreal S.A. 25.7%
Oriflame Cosmetics SA 17.2%
Procter & Gamble Company, The 7.5%
Others 49.6%
Total 100%
Source: Datamonitor D A T A M O N I T O R
Figure 5: Russia make-up market share: % share, by value, 2009(e)
Source: Datamonitor D A T A M O N I T O R

FIVE FORCES ANALYSIS
Russia - Make-Up 0153 - 0700 - 2009
© Datamonitor. This profile is a licensed product and is not to be photocopied Page 15
FIVE FORCES ANALYSIS
The make-up market will be analyzed taking manufacturers of make-up products as players. The key
buyers will be taken as retailers, and chemical companies and mineral producers as the key suppliers.
Summary
Figure 6: Forces driving competition in the make-up market in Russia, 2009
Source: Datamonitor D A T A M O N I T O R
The Russian make-up market is tending towards concentration, with the top three players holding 50.4%
of the total market by value.
The market leaders own a variety of recognized brands and operate in various segments of the market,
such as: eye make-up, face make-up, lip make-up and nail make-up. Fashion is a major influence on the
make-up market, with consumers differentiating themselves quite strongly through the styles and brands
of make-up products offered. Therefore, buyer power is greater amongst larger retailers
(supermarkets/hypermarkets) as switching costs for buyers are not particularly high. However, retailers
often occupy a strong position in the supply chain, which allows them to negotiate favorable contracts with
manufacturers, thereby enhancing buyer power. The wide range of brands available, with accompanying
variations in quality and price, means that buyer power is prevented from becoming disproportionately
strong in this market. Supplier power is also moderate, to the extent that the raw materials for the end
product are commonly available. Entry into this market would be highly dependent on the growth
prospects and also on the size of the existing players. Furthermore, make-up products have few

FIVE FORCES ANALYSIS
Russia - Make-Up 0153 - 0700 - 2009
© Datamonitor. This profile is a licensed product and is not to be photocopied Page 16
substitutes wherein manufacturers may face indirect competition from traditional cosmetics, such as
henna or kohl. However they are not likely to be a serious threat in the major markets. Rivalry in the
market is assessed as moderate with most of the companies being geographically diversified but
relatively high fixed costs.

FIVE FORCES ANALYSIS
Russia - Make-Up 0153 - 0700 - 2009
© Datamonitor. This profile is a licensed product and is not to be photocopied Page 17
Buyer power
Figure 7: Drivers of buyer power in the make-up market in Russia, 2009
Source: Datamonitor D A T A M O N I T O R
Major manufacturers tend to advertise to consumers in order to build brand loyalty. Retailers are
positioned at the end of the value chain, which implies that they are obliged to offer buyers what they
want, in a market that is subject to unpredictable changes in fashion. This reduces buyer power, as most
retailers must stock popular brands in order to maintain their own sales volumes. Moreover, fashion has a
major influence on the make-up market. Consumers can differentiate themselves quite strongly through
the styles and brands of make-up products they choose, which also weakens buyer power. However,
retailers often occupy a strong position in the supply chain, which allows them to negotiate favorable
contracts with manufacturers, thereby enhancing buyer power. Where brand loyalty exists, it is more likely
that customer would prefer designer brands over retailer brands, although some designer labels also
have their own retail operations for which a large market exists. Direct selling is possible: for example,
Avon avoids the conventional retail distribution network, by using a direct sales force. This is made up of
third party independent contractors (not employees), who buy Avon products at a discount and then sell
to end-users. This limits the power of contractors to set the prices, thus weakening the buyer power.
Overall, buyer power in the make-up market is moderate.

FIVE FORCES ANALYSIS
Russia - Make-Up 0153 - 0700 - 2009
© Datamonitor. This profile is a licensed product and is not to be photocopied Page 18
Supplier power
Figure 8: Drivers of supplier power in the make-up market in Russia, 2009
Source: Datamonitor D A T A M O N I T O R
Make-up products are typically manufactured using a range of chemical and mineral products, such as
essential oils, which are widely available from a large number of chemical companies. Packaging is
another significant input. The quality of many of the raw materials is important and chemicals used in
these products must be of a suitable standard for manufacturing consumer products. Supplier switching
costs are negligible for make-up manufacturers; inputs are typically undifferentiated; and products can be
made with a range of alternative raw materials, which reduces supplier power. Suppliers are often small in
scale compared to large manufacturers and consequently their power is reduced, but this is offset by the
fact that chemical producers gain revenues from a wide variety of sources, reducing their dependence on
cosmetics manufacturers. Overall, supplier power with respect to the make-up market is moderate.

FIVE FORCES ANALYSIS
Russia - Make-Up 0153 - 0700 - 2009
© Datamonitor. This profile is a licensed product and is not to be photocopied Page 19
New entrants
Figure 9: Factors influencing the likelihood of new entrants in the make-up market in Russia,
2009
Source: Datamonitor D A T A M O N I T O R
The Russian make-up market comprises a small number of brands, some widely recognized, which have
strong market position. Large firms benefit from scale economies which allow them to compete more
effectively on price, consequently, new companies entering the market may find it difficult to compete.
Retaliation by existing players, such as the launch of a price war, is a possibility, especially where a new
entrant moves into a more concentrated segment. Furthermore, the brand strength of major
manufacturers is considerable, which may negate much of the effect of low switching costs. New entrants
may be able to start on a small scale, operating within a particular niche, such as make-up with anti-
ageing components. However, product testing and research would be both: time-consuming and costly. In
addition, new entrants will need to persuade stores to stock their products, and major retailers aware of
their importance in the distribution chain, may be unwilling to risk displacing existing brands for the sake
of new ones. Substantial funds are also needed to start a business in this market, with capital required for
investment in production, distribution, and also advertising (which is crucial for success in this market).
However, due to the high sales volumes of make-up products and low product differentiation, it is
common for the companies to enter the lower end of the make-up market. Due to the high brand strength
of leading make-up manufacturers, it is difficult for new companies to develop their brands to compete at
an international level. Overall, the threat of new entrants with respect to the make-up market is moderate.

FIVE FORCES ANALYSIS
Russia - Make-Up 0153 - 0700 - 2009
© Datamonitor. This profile is a licensed product and is not to be photocopied Page 20
Substitutes
Figure 10: Factors influencing the threat of substitutes in the make-up market in Russia, 2009
Source: Datamonitor D A T A M O N I T O R
Make-up products have few substitutes as such. The conventional manufacturers may face indirect
competition from mineral make-up products. They are believed to be more natural, light and allergy free
as there are no chemicals, fragrances or preservatives in their contents. Mineral make-up products are
available in the form of foundations and loose powder. These claim to remove the wrinkles which one
gets due to aging process, acne, pimple scars or any other blemish present on the skin. Overall, the
threat of substitutes is assessed as weak.

FIVE FORCES ANALYSIS
Russia - Make-Up 0153 - 0700 - 2009
© Datamonitor. This profile is a licensed product and is not to be photocopied Page 21
Rivalry
Figure 11: Drivers of degree of rivalry in the make-up market in Russia, 2009
Source: Datamonitor D A T A M O N I T O R
The Russian make-up market is tending towards concentration, with the top three players holding 50.4%
of the total market by value. As many large players have their own production facilities, fixed costs are
relatively high, which serves to enhance rivalry. Retailers may be unwilling to switch between market
players, as their customers are likely to seek the leading brands. The diverse product range offered by
some major players, including skincare and hair care products, reduces their reliance on the make-up
products, and thus somewhat eases rivalry. This diversification protects the company’s business against
competitive pressures in any one particular market. As most companies own large production facilities,
the need to divest such assets on exiting the global market constitutes an exit barrier and therefore a
driver of competition. However, most of these companies are geographically diversified which weakens
rivalry to some extent. Overall, rivalry in the make-up market is moderate.

LEADING COMPANIES
Russia - Make-Up 0153 - 0700 - 2009
© Datamonitor. This profile is a licensed product and is not to be photocopied Page 22
LEADING COMPANIES
L'Oreal S.A.
Table 6: L'Oreal S.A.: key facts
Head office: 41, Rue Martre, 92117 Clichy, Cedex, FRA
Telephone: 33 1 47 56 70 00
Fax: 33 1 47 56 86 42
Local office: L'Oreal Russie, 1/8, 4eme Goloutvinski per, Bat. 1-2, 119180 Moscow, RUS
Telephone: 7 495 258 31 91
Website: www.loreal.com
Financial year-end: December
Ticker: OR
Stock exchange: Euronext Paris
Source: company website D A T A M O N I T O R
L'Oreal is a France-based global cosmetics company, engaged in the production and marketing of a
range of perfume, make-up, hair and skin care products. The company operates in over 130 countries. It
markets 23 international brands such as L'Oreal Paris, Garnier, Maybelline, SoftSheen Carson, CCB
Paris, L'Oreal Professional, Kerastase, Redken, Matrix, Mizani, Lancome, Biotherm, Helena Rubinstein,
Kiehl's, Shu Uemura, and Giorgio Armani.
In addition, the company has a financial stake in Sanofi-Aventis, a pharmaceutical company specializing
in therapeutic areas of cardiovascular, thrombosis, central nervous system, oncology, metabolic
disorders, internal medicine and vaccines.
L'Oreal operates through three business segments: cosmetics, the Body Shop, and dermatology.
The cosmetics segment of L'Oreal functions through four operating segments: professional products,
consumer products, luxury products and active cosmetics.
The professional products sub-segment markets hair care products to professional hairdressers, who use
or sell these products in their hair salons. The sub-segment offers differentiated brands to improve the
quality of services in hair colorants, permanent waves, styling and haircare. The professional products
sub-segment comprises four brands: L'Oreal Professionel, Kerastase, Redken, Matrix, Mizani, Shu
Uemura Art of Hair and Keraskin Esthetics. Play Ball and Texture Expert, two sub brands under L’oreal
Professionnel and Kerastase are extremely doing well in the US. Pureology is the leading color care

LEADING COMPANIES
Russia - Make-Up 0153 - 0700 - 2009
© Datamonitor. This profile is a licensed product and is not to be photocopied Page 23
brand in the US. Redken 5th Avenue is the popular haircare brand in Latin American countries. The
brands L’oreal Professionnel, Kerastase and Matrix are the major growth drivers.
The consumer products sub-segment sells products through mass-market retailing channels. The
consumer products range includes hair care, skin care and make-up; and perfume products. The leading
brands in this sub-segment include L'Oreal Paris, Garnier, Maybelline New York, Softsheen-Carson and
Le Club des Createurs. Softsheen Carson is the major growth driver in the South Africa.
The luxury products sub-segment markets premium products and services to consumers through retail
outlets such as department stores, perfumeries, travel retail and the group’s own boutiques. The
company’s luxury products include skin-care, make-up and fragrances. With the acquisition of YSL
Beaute in mid 2008, the company enhanced its luxury products portfolio. The luxury products portfolio
includes leading brands such as Lancome, Helena Rubinstein, Biotherm, Shu Uemura, YSL Beaute, and
Kiehl's. The sub-segment also includes perfume brands: Giorgio Armani, Ralph Lauren, Cacharel, Diesel
and Viktor & Rolf.
The active cosmetics sub-segment sells dermo-cosmetic skin care products through pharmacies and
specialist retailers. Pharmacists and dermatologists also offer advice on using the company's products at
the point of sale. The brands in this segment include: Vichy, La Roche-Posay, Inneov, Sanoflore and
Skinceuticals. Aminexil Energy, a brand under Vichy is a popular brand under premature hair loss
product.
The cosmetics segment also comprises various product categories such as skincare (facial skincare,
body care and sun protection), hair care products, make-up, hair colorants, perfumes, and other products.
The company offers make-up products under the brand names L’Oreal Paris, Le Club Des Createurs,
Maybelline New York, Helena Rubinstein, Shu Uemura and YSL Beaute among others.
L'Oreal took over The Body Shop International in 2006. The Body Shop operates a chain of cosmetics
stores specializing in skin and hair care products made from natural ingredients. The Body Shop sells
over 1,200 health and beauty products, across 59 countries. Its traditional emphasis has been on
shampoos, bath products, soaps, skin creams and conditioners made from natural ingredients. The
company also sells beauty and personal care accessories including exfoliating bath gloves, mitts, body
buffers, foot files, and muscle toning, relaxing and invigorating massagers. In addition, it also markets
men's toiletry ranges, perfumes and seasonal products.
The dermatology segment includes dermatological and pharmaceutical activities of the company.
Galderma Laboratories (dermatological company), a joint venture with Nestle, specializes in skin diseases
such as rosacea, psoriasis, eczema, and skin infections such as acne.
In September 2008, the company launched a new lipstick line under the brand name Rouge Volupte. In
the same month, Body Shop introduced mineral make-up range under the brand Nature’s Minerals.

LEADING COMPANIES
Russia - Make-Up 0153 - 0700 - 2009
© Datamonitor. This profile is a licensed product and is not to be photocopied Page 24
In March 2009, L’Oreal Paris launched new make-up collection under the Studio Secrets Professional
brand name.
In April 2009, the company's subsidiary, L’Oreal USA, signed an agreement for the acquisition of Idaho
Barber and Beauty Supply (IBB), a distributor of professional products to hair salons in several states in
the North West of the US, particularly Idaho, Montana and Washington. Further, in December 2009,
L’Oreal USA acquired Maly’s Midwest and Marshall Salon Services, distributors of professional products
to hair salons across eight states in the US Midwest region.
Key Metrics
L'Oreal generated revenues of $24.3 billion in the financial year (FY) ended December 2009, a decrease
of 0.4% compared to 2008. The company's net income totaled $2.5 billion in FY2009, a decrease of 8%
compared to 2008.
The cosmetics segment recorded revenues of $22.6 billion in the FY2009, a decrease of 0.6% compared
to 2008. The decline in the revenues was primarily due to the declining sales of the cosmetics products in
the Western Europe, Latin America and Eastern Europe.
The body shop segment recorded revenues of $1 billion in FY2009, a decrease of 3.9% compared to
2008.
Rest of the World (including Russia) accounted for 32% of the total revenues in FY2009. Revenues from
Rest of the World reached $7.8 billion in FY2009, an increase of 3.7% over 2008.
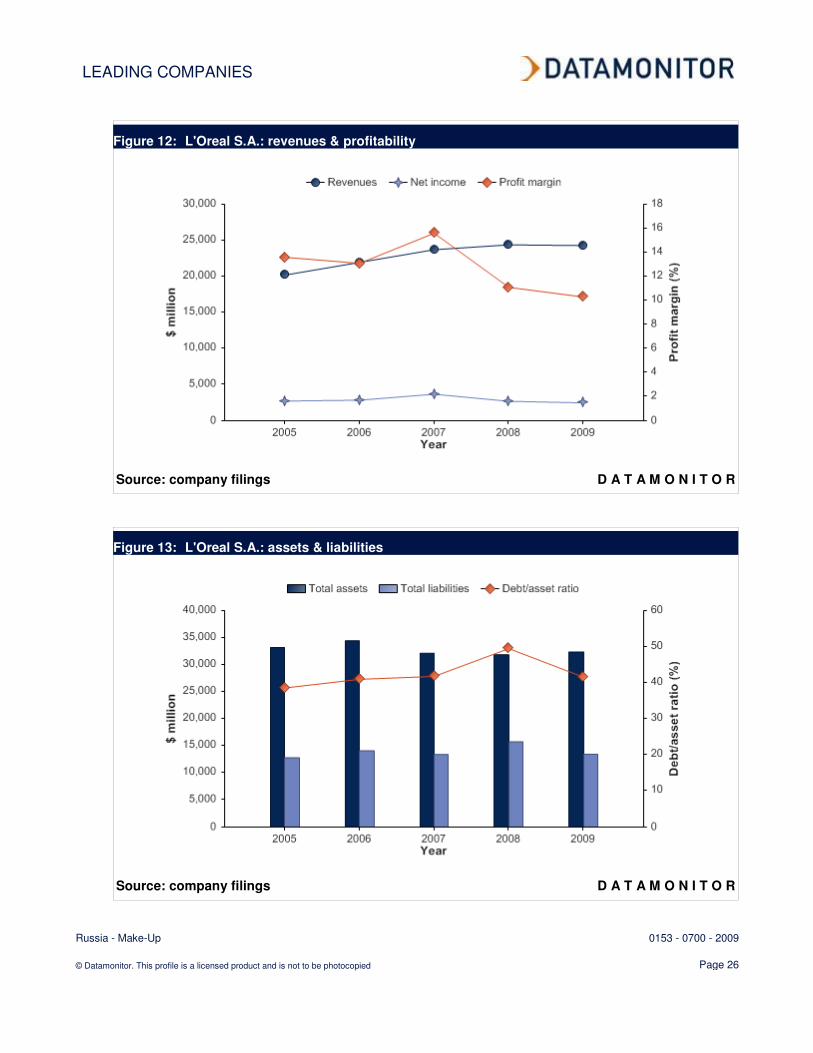
Table 7: L'Oreal S.A.: key financials ($)
$ million 2005 2006 2007 2008 2009
Revenues 20,207.6 21,956.3 23,725.7 24,392.1 24,295.8
Net income (loss) 2,742.5 2,865.8 3,693.2 2,709.1 2,492.1
Total assets 33,213.9 34,461.0 32,164.9 31,852.3 32,387.1
Total liabilities 12,832.9 14,125.9 13,444.9 15,774.5 13,478.4
Employees 52,403 60,851 63,358 67,662 64,643
Source: company filings D A T A M O N I T O R

LEADING COMPANIES
Russia - Make-Up 0153 - 0700 - 2009
© Datamonitor. This profile is a licensed product and is not to be photocopied Page 25
Table 8: L'Oreal S.A.: key financials (€)
€ million 2005 2006 2007 2008 2009
Revenues 14,532.5 15,790.1 17,062.6 17,541.8 17,472.6
Net income (loss) 1,972.3 2,061.0 2,656.0 1,948.3 1,792.2
Total assets 23,886.1 24,783.0 23,131.7 22,906.9 23,291.5
Total liabilities 9,228.9 10,158.8 9,669.0 11,344.4 9,693.1
Source: company filings D A T A M O N I T O R
Table 9: L'Oreal S.A.: key financial ratios
Ratio 2005 2006 2007 2008 2009
Profit margin 13.6% 13.1% 15.6% 11.1% 10.3%
Revenue growth 6.5% 8.7% 8.1% 2.8% (0.4%)
Asset growth 17.2% 3.8% (6.7%) (1.0%) 1.7%
Liabilities growth 7.8% 10.1% (4.8%) 17.3% (14.6%)
Debt/asset ratio 38.6% 41.0% 41.8% 49.5% 41.6%
Return on assets 8.9% 8.5% 11.1% 8.5% 7.8%
Revenue per employee $385,619 $360,821 $374,471 $360,499 $375,846
Profit per employee $52,335 $47,096 $58,291 $40,039 $38,551
Source: company filings D A T A M O N I T O R
LEADING COMPANIES
Russia - Make-Up 0153 - 0700 - 2009
© Datamonitor. This profile is a licensed product and is not to be photocopied Page 26
Figure 12: L'Oreal S.A.: revenues & profitability
Source: company filings D A T A M O N I T O R
Figure 13: L'Oreal S.A.: assets & liabilities
Source: company filings D A T A M O N I T O R

LEADING COMPANIES
Russia - Make-Up 0153 - 0700 - 2009
© Datamonitor. This profile is a licensed product and is not to be photocopied Page 27
Oriflame Cosmetics SA
Table 10: Oriflame Cosmetics SA: key facts
Head office: 24, avenue Emile Reuter, Luxembourg 2420, LUX
Telephone: 352 26 20 32 32
Fax: 352 26 20 32 34
Local office: ZAO TAF Oriflame Cosmetics Ltd., Ul. Usacheva 37, 119048 Moscow, RUS
Telephone: 7 495 626 5353
Website: www.oriflame.com
Financial year-end: December
Ticker: ORI
Stock exchange: Stockholm
Source: company website D A T A M O N I T O R
Oriflame Cosmetics manufactures and distributes natural skincare and cosmetic products through an
independent sales force, outside the traditional retail environment. It offers skincare products, fragrances
and cosmetics in 62 countries, with a sales force of 2.3 million independent sales consultants. The
company operates in the Americas, Africa, Europe and Asia. It is headquartered in Philippe II,
Luxembourg.
It has an in-house research centre for product development. The company offers about 600 products, with
150 new products being introduced each year. It operates five factories situated in India, Sweden, China,
Poland and Russia that produces emulsions, liquids (alcohol), foundations, mascaras, lipsticks, toiletries,
fragrances and toothpastes.
Oriflame has five product categories including skincare, colour cosmetics, fragrances, personal and hair
care, and accessories and wellness.
Skincare products category includes moisturizers, anti-cellulite and anti-aging products for various age
groups.
Colour cosmetics include the makeup products such as blushers, eyebrow pens, eye pencils, foundation,
lip liners, mascara, nail polishes, concealers, eye liners, eye shadow, lip glosses, lipsticks and powders.
The company offers its colour cosmetic products under Visions V, Oriflame Beauty and Giordani Gold
brand names. In September 2008, Oriflame launched a new range of lipsticks under the brand name Silky
Kiss.

LEADING COMPANIES
Russia - Make-Up 0153 - 0700 - 2009
© Datamonitor. This profile is a licensed product and is not to be photocopied Page 28
Oriflame fragrances comprise women’s fragrances, men’s fragrances, youth fragrances and limited life
fragrances.
Personal and hair care category includes body care products, bath and shower products, hair care
products, oral hygiene products, foot care products, hand care products, and baby care products.
Oriflame offers wide range of accessories such as jewellery, sunglasses, handbags, watches, cosmetic
accessories (that includes hair brush, tooth brush, toiletry bags and manicure sets), decorative and gift
items, men’s accessories, and kids accessories and gift items. Wellness products include nutrition shakes
and wellness packs. In addition, the company also offers wellness products including vitamins and
nutritional shakes.
Oriflame maintains a supply hub in Venlo to support the markets in Western Europe, Asia and Latin
America. In Russia, the company operates through its subsidiaries, Oriflame Cosmetics and Oriflame
Products. It also owns a manufacturing facility in Moscow of 22,000 square meters, which has the
production capacity of about 100 million lipsticks, pencils and other colour products annually.
Key Metrics
Oriflame generated revenues of $1.8 billion in the financial year (FY) ended December 2009, a decrease
of 0.2% compared to 2008. The company's net income totaled $139.5 million in FY2009, a decrease of
19.4% compared to 2008.
CIS and Baltics segment (including Russia) accounted for 55.1% of the total revenues in FY2009.
Revenues from CIS and Baltics reached $1 billion in FY2009, a decrease of 4.5% compared to 2008.
Table 11: Oriflame Cosmetics SA: key financials ($)
$ million 2005 2006 2007 2008 2009
Revenues 1,064.7 1,276.4 1,542.6 1,835.0 1,830.7
Net income (loss) 120.0 130.0 127.9 173.0 139.5
Total assets 541.4 606.6 717.6 806.7 855.5
Total liabilities 319.3 540.0 588.5 627.5 635.6
Employees 4,961 5,610 6,438 7,174 7,968
Source: company filings D A T A M O N I T O R

LEADING COMPANIES
Russia - Make-Up 0153 - 0700 - 2009
© Datamonitor. This profile is a licensed product and is not to be photocopied Page 29
Table 12: Oriflame Cosmetics SA: key financials (€)
€ million 2005 2006 2007 2008 2009
Revenues 765.7 917.9 1,109.4 1,319.7 1,316.6
Net income (loss) 86.3 93.5 92.0 124.4 100.3
Total assets 389.4 436.2 516.0 580.2 615.2
Total liabilities 229.6 388.4 423.2 451.3 457.1
Source: company filings D A T A M O N I T O R
Table 13: Oriflame Cosmetics SA: key financial ratios
Ratio 2005 2006 2007 2008 2009
Profit margin 11.3% 10.2% 8.3% 9.4% 7.6%
Revenue growth 14.2% 19.9% 20.9% 19.0% (0.2%)
Asset growth 39.9% 12.0% 18.3% 12.4% 6.0%
Liabilities growth 37.1% 69.1% 9.0% 6.6% 1.3%
Debt/asset ratio 59.0% 89.0% 82.0% 77.8% 74.3%
Return on assets 25.8% 22.6% 19.3% 22.7% 16.8%
Revenue per employee $214,614 $227,525 $239,610 $255,786 $229,762
Profit per employee $24,184 $23,175 $19,866 $24,110 $17,506
Source: company filings D A T A M O N I T O R

LEADING COMPANIES
Russia - Make-Up 0153 - 0700 - 2009
© Datamonitor. This profile is a licensed product and is not to be photocopied Page 30
Figure 14: Oriflame Cosmetics SA: revenues & profitability
Source: company filings D A T A M O N I T O R
Figure 15: Oriflame Cosmetics SA: assets & liabilities
Source: company filings D A T A M O N I T O R

LEADING COMPANIES
Russia - Make-Up 0153 - 0700 - 2009
© Datamonitor. This profile is a licensed product and is not to be photocopied Page 31
Procter & Gamble Company, The
Table 14: Procter & Gamble Company, The: key facts
Head office: 1 Procter & Gamble Plaza, Cincinnati, Ohio 45202, USA
Telephone: 1 513 983 1100
Local office: Procter and Gamble OOO, 125171, Moscow 16A, Leningradskoe shosse, bld.2, RUS
Telephone: 7 495 258 5888
Website: www.pg.com
Financial year-end: June
Ticker: PG
Stock exchange: New York
Source: company website D A T A M O N I T O R
The Procter & Gamble Company (P&G) is a global manufacturer and marketer of consumer products.
The company markets more than 300 brands in over 180 countries spanning Americas, Europe, the
Middle East and Africa (EMEA), and Asian region.
The company is organized into three Global Business Units (GBUs) and a Global Operations group. The
three GBUs are beauty, health and well-being, and household care. The Global Operations group
consists of the Market Development Organization (MDO) and Global Business Services (GBS).
The beauty GBU includes the beauty and the grooming businesses. The beauty business is comprised of
cosmetics, deodorants, prestige fragrances, hair care, personal cleansing and skin care. The make-up
brands offered by the company include CoverGirl, Pantene and Max factor. The company's beauty
products are manufactured in its 43 production facilities.
The grooming business includes blades and razors, electric hair removal devices, face and shave
products and home appliances. The key brands marketed by the grooming segment include Braun,
Fusion, Gillette and Mach3.
The health and well-being GBU includes the health care; and the snacks and pet care businesses. The
health care business includes feminine care, oral care, personal health care and pharmaceuticals. The
key brands marketed by the segment comprise Always, Crest, and Oral-B.
The snacks and pet care business includes pet food and snacks. The segment markets its products under
the brands Eukanuba, lams and Pringles.
LEADING COMPANIES
Russia - Make-Up 0153 - 0700 - 2009
© Datamonitor. This profile is a licensed product and is not to be photocopied Page 32
The household care GBU includes the fabric care and home care; as well as the baby care and family
care businesses. The fabric care and home care business includes air care, batteries, dish care, fabric
care and surface care. The segment markets its products under Ariel, Dawn, Downy, Duracell, Gain and
Tide brands. The dish care products are offered under Cascade, Dawn and Joy brands.
The baby care and family care business offers baby wipes, bath tissue, diapers, facial tissue and paper
towels under the following brands: Bounty, Charmin and Pampers.
The MDO segment is responsible for developing go-to-market plans at the local level. The MDO includes
dedicated retail customer, trade channel and country-specific teams. The GBS segment provides
technology, processes and standard data tools to enable the GBUs and the MDO to better understand the
business and better serve consumers and customers.
The company is organized along five geographic regions: North America, Western Europe, Central &
Eastern Europe/Middle East/Africa (CEEMEA), Latin America, and Asia.
The company's North American operation covers Canada, Puerto Rico and the US regions. P&G has a
presence in every country in Western Europe. In Western Europe, the company operates about 35
manufacturing plants and markets over 100 brands. P&G's CEEMEA includes the Balkans, Central
Europe North, Central Europe South, Eastern Europe, Middle East, Sub Sahara, Turkey/Caucasia and
the Central Asian Republics. In Latin America, the company operates 19 manufacturing sites, 12
distribution centres and a service centre in 14 countries. P&G's Asian operations covers China, Japan,
Korea, Hong Kong, India, Australia, New Zealand, Indonesia, Philippines, Singapore, Taiwan, Vietnam,
Thailand, Sri Lanka, Malaysia and Bangladesh.
In Russia, the company operates through its subsidiary, P&G Russia. In the region, the company markets
its products through a portfolio of over 70 brands, including Ariel, Tide, Fairy, Blend-a-med, Pampers,
Always, Pantene, Head & Shoulders, Wella, and Gillette. It owns a manufacturing plant in Tula region in
Russia, which is engaged in the production of Ariel, Tide, Myth and Tix detergents, Comet cleaning
powder, Ace liquid bleach, Fairy dishwashing liquid, Lenor fabric conditioner and Mr. Proper washing
liquid.
In July 2009, company launched new range of sculpting blush under the brand name Simply Ageless.
Key Metrics
The Procter & Gamble Company generated revenues of $79 billion in the financial year (FY) ended June
2009, a decrease of 3.3% compared to 2008. The company's net income totaled $13.4 billion in FY2009,
an increase of 11.3% over 2008.

LEADING COMPANIES
Russia - Make-Up 0153 - 0700 - 2009
© Datamonitor. This profile is a licensed product and is not to be photocopied Page 33
The beauty segment formed 23.8% of the total revenues in the FY2009. The beauty segment recorded
revenues of $18.8 billion, a decrease of 3.7% compared to 2008. The decline in the revenue was primarily
due to the declining sales volume in the key product lines including skin care and personal cleansing.
International (including Russia) accounted for 60.7% of the total revenues in the FY2009. Revenue from
international reached $47.9 billion in FY2009, a decrease of 4.9% compared to 2008.
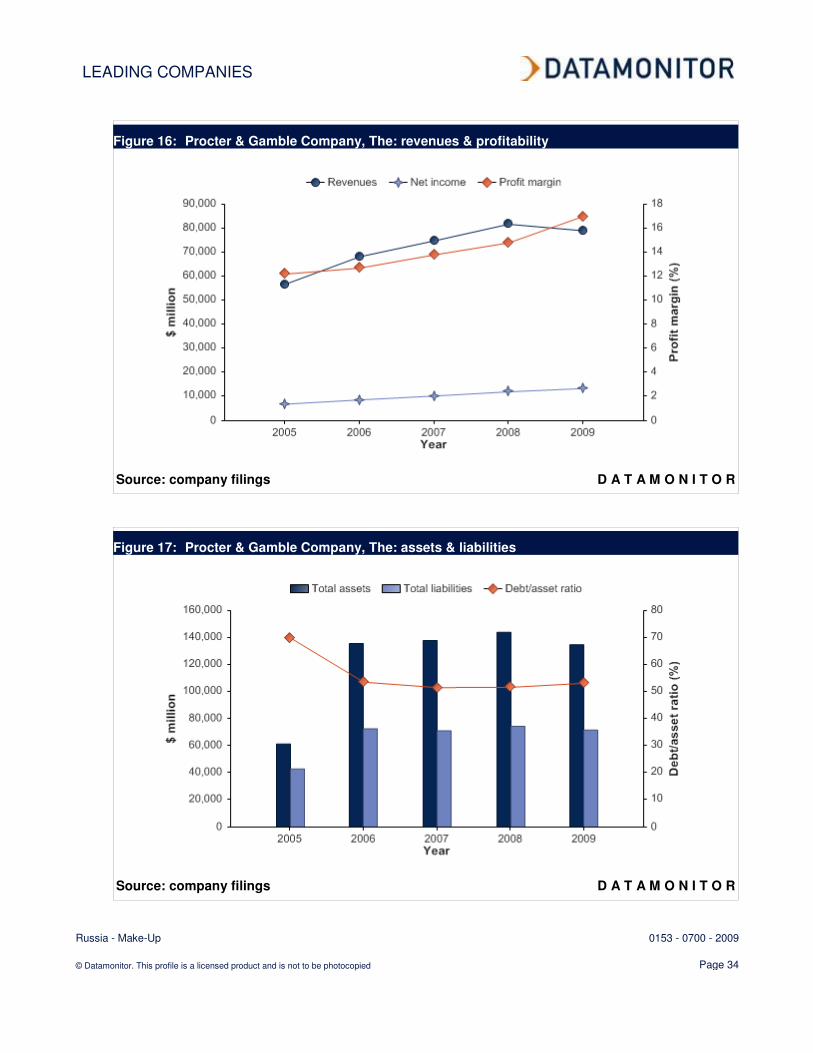
Table 15: Procter & Gamble Company, The: key financials ($)
$ million 2005 2006 2007 2008 2009
Revenues 56,741.0 68,222.0 74,832.0 81,748.0 79,029.0
Net income (loss) 6,925.0 8,684.0 10,340.0 12,075.0 13,436.0
Total assets 61,527.0 135,695.0 138,014.0 143,992.0 134,833.0
Total liabilities 43,052.0 72,787.0 71,254.0 74,498.0 71,734.0
Employees 110,000 138,000 138,000 138,000 135,000
Source: company filings D A T A M O N I T O R
Table 16: Procter & Gamble Company, The: key financial ratios
Ratio 2005 2006 2007 2008 2009
Profit margin 12.2% 12.7% 13.8% 14.8% 17.0%
Revenue growth 10.4% 20.2% 9.7% 9.2% (3.3%)
Asset growth 7.9% 120.5% 1.7% 4.3% (6.4%)
Liabilities growth 8.3% 69.1% (2.1%) 4.6% (3.7%)
Debt/asset ratio 70.0% 53.6% 51.6% 51.7% 53.2%
Return on assets 11.7% 8.8% 7.6% 8.6% 9.6%
Revenue per employee $515,827 $494,362 $542,261 $592,377 $585,400
Profit per employee $62,955 $62,928 $74,928 $87,500 $99,526
Source: company filings D A T A M O N I T O R
LEADING COMPANIES
Russia - Make-Up 0153 - 0700 - 2009
© Datamonitor. This profile is a licensed product and is not to be photocopied Page 34
Figure 16: Procter & Gamble Company, The: revenues & profitability
Source: company filings D A T A M O N I T O R
Figure 17: Procter & Gamble Company, The: assets & liabilities
Source: company filings D A T A M O N I T O R

DISTRIBUTION
Russia - Make-Up 0153 - 0700 - 2009
© Datamonitor. This profile is a licensed product and is not to be photocopied Page 35
MARKET DISTRIBUTION
Specialist Retailers form the leading distribution channel in the Russian make-up market, accounting for a
66% share of the total market's value.
Supermarkets / hypermarkets accounts for a further 4.4% of the market.
Table 17: Russia make-up market distribution: % share, by value, 2009(e)
Channel % Share
Specialist Retailers 66.0%
Supermarkets / hypermarkets 4.4%
Department Stores (incl. Duty-Free Shops) 4.2%
Others 25.5%
Total 100%
Source: Datamonitor D A T A M O N I T O R
Figure 18: Russia make-up market distribution: % share, by value, 2009(e)
Source: Datamonitor D A T A M O N I T O R

MARKET FORECASTS
Russia - Make-Up 0153 - 0700 - 2009
© Datamonitor. This profile is a licensed product and is not to be photocopied Page 36
MARKET FORECASTS
Market value forecast
In 2014, the Russian make-up market is forecast to have a value of $2,293.5 million, an increase of
45.5% since 2009.
The compound annual growth rate of the market in the period 2009–14 is predicted to be 7.8%.
Table 18: Russia make-up market value forecast: $ million, 2009–14
Year $ million RUB million € million % Growth
2009 1,576.0 50,223.6 1,133.4 8.7%
2010 1,708.8 54,454.3 1,228.9 8.4%
2011 1,848.8 58,915.9 1,329.6 8.2%
2012 1,996.1 63,608.6 1,435.5 8.0%
2013 2,150.0 68,514.9 1,546.2 7.7%
2014 2,293.5 73,087.8 1,649.4 6.7%
CAGR: 2009–14 7.8%
Source: Datamonitor D A T A M O N I T O R
Figure 19: Russia make-up market value forecast: $ million, 2009–14
Source: Datamonitor D A T A M O N I T O R

MARKET FORECASTS
Russia - Make-Up 0153 - 0700 - 2009
© Datamonitor. This profile is a licensed product and is not to be photocopied Page 37
Market volume forecast
In 2014, the Russian make-up market is forecast to have a volume of 255 million units, an increase of
23.8% since 2009.
The compound annual growth rate of the market in the period 2009–14 is predicted to be 4.4%.
Table 19: Russia make–up market volume forecast: million units, 2009–14
Year million units % Growth
2009 205.9 5.2%
2010 216.0 4.9%
2011 225.9 4.6%
2012 235.7 4.3%
2013 245.2 4.0%
2014 255.0 4.0%
CAGR: 2009–14 4.4%
Source: Datamonitor D A T A M O N I T O R
Figure 20: Russia make–up market volume forecast: million units, 2009–14
Source: Datamonitor D A T A M O N I T O R
MACROECONOMIC INDICATORS
Russia - Make-Up 0153 - 0700 - 2009
© Datamonitor. This profile is a licensed product and is not to be photocopied Page 38
MACROECONOMIC INDICATORS
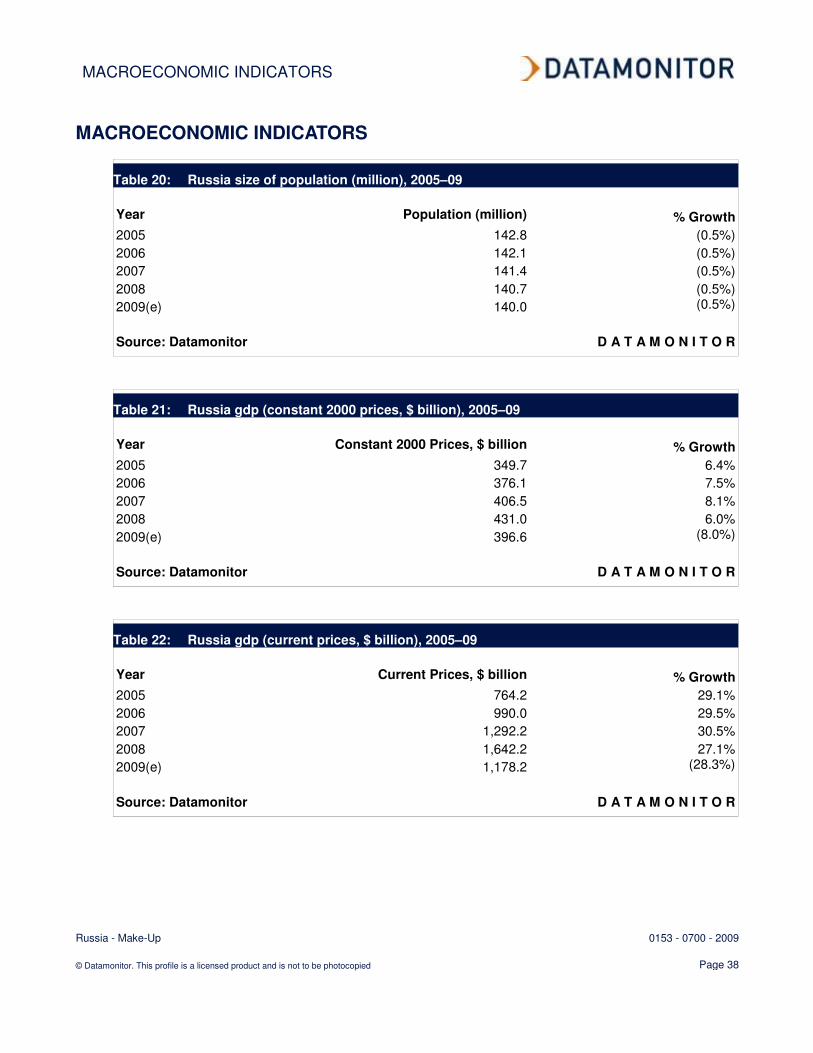
Table 20: Russia size of population (million), 2005–09
Year Population (million) % Growth
2005 142.8 (0.5%)
2006 142.1 (0.5%)
2007 141.4 (0.5%)
2008 140.7 (0.5%)
2009(e) 140.0 (0.5%)
Source: Datamonitor D A T A M O N I T O R
Table 21: Russia gdp (constant 2000 prices, $ billion), 2005–09
Year Constant 2000 Prices, $ billion % Growth
2005 349.7 6.4%
2006 376.1 7.5%
2007 406.5 8.1%
2008 431.0 6.0%
2009(e) 396.6 (8.0%)
Source: Datamonitor D A T A M O N I T O R
Table 22: Russia gdp (current prices, $ billion), 2005–09
Year Current Prices, $ billion % Growth
2005 764.2 29.1%
2006 990.0 29.5%
2007 1,292.2 30.5%
2008 1,642.2 27.1%
2009(e) 1,178.2 (28.3%)
Source: Datamonitor D A T A M O N I T O R

MACROECONOMIC INDICATORS
Russia - Make-Up 0153 - 0700 - 2009
© Datamonitor. This profile is a licensed product and is not to be photocopied Page 39
Table 23: Russia inflation, 2005–09
Year Inflation Rate (%)
2005 12.7%
2006 9.7%
2007 9.0%
2008 13.1%
2009(e) 10.7%
Source: Datamonitor D A T A M O N I T O R
Table 24: Russia consumer price index (absolute), 2005–09
Year Consumer Price Index (2000 =
100) % Growth
2005 199.8 12.7%
2006 219.1 9.7%
2007 238.8 9.0%
2008 270.1 13.1%
2009(e) 299.0 10.7%
Source: Datamonitor D A T A M O N I T O R
Table 25: Russia exchange rate, 2005–09
Year Exchange rate ($/RUB) Exchange rate (€/RUB)
2005 28.2933 35.1675
2006 27.1895 34.1135
2007 25.5794 35.0010
2008 24.8704 36.3916
2009 31.8669 44.3112
Source: Datamonitor D A T A M O N I T O R

APPENDIX
Russia - Make-Up 0153 - 0700 - 2009
© Datamonitor. This profile is a licensed product and is not to be photocopied Page 40
APPENDIX
Methodology
Datamonitor Industry Profiles draw on extensive primary and secondary research, all aggregated,
analyzed, cross-checked and presented in a consistent and accessible style.
Review of in-house databases – Created using 250,000+ industry interviews and consumer surveys
and supported by analysis from industry experts using highly complex modeling & forecasting tools,
Datamonitor’s in-house databases provide the foundation for all related industry profiles
Preparatory research – We also maintain extensive in-house databases of news, analyst
commentary, company profiles and macroeconomic & demographic information, which enable our
researchers to build an accurate market overview
Definitions – Market definitions are standardized to allow comparison from country to country. The
parameters of each definition are carefully reviewed at the start of the research process to ensure they
match the requirements of both the market and our clients
Extensive secondary research activities ensure we are always fully up-to-date with the latest
industry events and trends
Datamonitor aggregates and analyzes a number of secondary information sources, including:
- National/Governmental statistics
- International data (official international sources)
- National and International trade associations
- Broker and analyst reports
- Company Annual Reports
- Business information libraries and databases
Modeling & forecasting tools – Datamonitor has developed powerful tools that allow quantitative
and qualitative data to be combined with related macroeconomic and demographic drivers to create
market models and forecasts, which can then be refined according to specific competitive, regulatory
and demand-related factors
Continuous quality control ensures that our processes and profiles remain focused, accurate and
up-to-date
APPENDIX
Russia - Make-Up 0153 - 0700 - 2009
© Datamonitor. This profile is a licensed product and is not to be photocopied Page 41
Industry associations
Association of Perfumery, Cosmetics and Household chemistry Manufacturers
Bolshaya Yakimanka, 39/20, bld.1, office 303, Moscow, 119049, Russia
Tel.: 7 95 238 4077
Fax: 7 95 238 4744
www.apcohm.org
Related Datamonitor research
Industry Profiles
Make-Up in Asia-Pacific
Make-Up in Europe
Make-Up in Germany
Make-Up in Japan
Make-Up in the United States
Make-Up in China
Make-Up in Italy
Make-Up in Spain
Make-Up in the Netherlands
Make-Up in Belgium
Make-Up in Canada

APPENDIX
Russia - Make-Up 0153 - 0700 - 2009
© Datamonitor. This profile is a licensed product and is not to be photocopied Page 42
Disclaimer
All Rights Reserved.
No part of this publication may be reproduced, stored in a retrieval system or transmitted in any form
by any means, electronic, mechanical, photocopying, recording or otherwise, without the prior
permission of the publisher, Datamonitor plc.
The facts of this report are believed to be correct at the time of publication but cannot be guaranteed.
Please note that the findings, conclusions and recommendations that Datamonitor delivers will be
based on information gathered in good faith from both primary and secondary sources, whose
accuracy we are not always in a position to guarantee. As such Datamonitor can accept no liability
whatever for actions taken based on any information that may subsequently prove to be incorrect.

ABOUT DATAMONITOR
Russia - Make-Up 0153 - 0700 - 2009
© Datamonitor. This profile is a licensed product and is not to be photocopied Page 43
ABOUT DATAMONITOR
The Datamonitor Group is a world-leading provider of premium global business information, delivering
independent data, analysis and opinion across the Automotive, Consumer Markets, Energy & Utilities,
Financial Services, Logistics & Express, Pharmaceutical & Healthcare, Retail, Technology and
Telecoms industries.
Combining our industry knowledge and experience, we assist over 6,000 of the world’s leading
companies in making better strategic and operational decisions.
Delivered online via our user-friendly web platforms, our market intelligence products and services
ensure that you will achieve your desired commercial goals by giving you the insight you need to best
respond to your competitive environment.
Premium Reports
Datamonitor's premium reports are based on primary research with industry panels and consumers.
We gather information on market segmentation, market growth and pricing, competitors and products.
Our experts then interpret this data to produce detailed forecasts and actionable recommendations,
helping you create new business opportunities and ideas.
Summary Reports
Our series of company, industry and country profiles complements our premium products, providing
top-level information on 30,000 companies, 3,000 industries and 100 countries. While they do not
contain the highly detailed breakdowns found in premium reports, profiles give you the most important
qualitative and quantitative summary information you need - including predictions and forecasts.
Datamonitor consulting
We hope that the data and analysis in this profile will help you make informed and imaginative business
decisions. If you have further requirements, Datamonitor’s consulting team may be able to help you. For
more information about Datamonitor’s consulting capabilities, please contact us directly at