make or break race and ethnicity in entry-level
TRANSCRIPT

05/20
21
Make or BreakRace and Ethnicity in Entry-LevelCompensationfor ArtsAdministrators in Los Angeles County

Authors Cobi Krieger and Bronwyn Mauldin Published Los Angeles County Department of Arts and Culture with the Center for Business and Management of the Arts at Claremont Graduate University
5/2021
This PDF has been optimized for assistive technologies. An audio version can be found at lacountyarts.org.
Make or BreakRace and Ethnicity in Entry-LevelCompensationfor ArtsAdministrators in Los Angeles County


Make or B
reak: Race an
d Eth
nicity in En
try-Level Com
pen
sation for A
rts Adm
inistrators in Los Angeles C
ounty
4
Executive SummaryThis study looks at earnings, debt, and other forms of financial support for entry-level arts administrators, finding troubling differences between BIPOC (Black, Indigenous, and People of Color) arts administrators and their White counterparts. Building on the quantitative findings, this study dug deeper, conducting interviews to understand how those earnings and differences are experienced in the daily lives of the people who, despite the challenges they face, pursue a career in the arts.
Our survey of entry-level arts administrators in LA County found that • Average annual earnings from all sources was $36,847, slightly
higher than the LA County minimum wage of $31,200 but lower than the living wage of $40,248.
• Average annual earnings for entry-level arts administrators were $32,027 for BIPOC respondents, just above minimum wage for a full-time position, but it was $43,437 for White respondents, a difference of $11,410, or 35 percent higher. No matter their education level, White respondents earned more than BIPOC respondents.
• Average annual earnings increased with age and education level and did not vary significantly according to employer type, but actually decreased for respondents with more than one job.
• Two-thirds of entry-level respondents reported carrying some kind of debt, most commonly student loans, followed by debt for housing, transportation, business, or health.
Make or B
reak: Race an
d Eth
nicity in En
try-Level Com
pen
sation for A
rts Adm
inistrators in Los Angeles C
ounty
5
• Average student debt was $32,724, and varied significantly according to education level, race, and age. More BIPOC respondents carry student debt, but their average debt was about half of what it was for White respondents.
Through interviews with a small subset of people who took the survey we discovered how they experience earnings that are too low for the cost of living in LA County. They work overtime or find ways to reduce their expenses in order to cover everything, including student debt payments. Their career path feels precarious and affects their sense of self-worth. Many question whether they should continue in the field. In hard times, many turn to family for support, which gives a long-term career advantage to those whose families hold greater wealth. What also came through in our interviews is that the experiences of entry-level BIPOC arts administrators are different from those of their White colleagues, and both are aware of it. Some see those differences in earnings as the result of a power imbalance between predominantly White employers and BIPOC employees or job applicants. The lower amount of student debt carried by BIPOC arts administrators is seen as additional proof that they have less access to education that could secure greater earnings and career opportunities, though the data show they might still earn less than their equally-educated White colleagues. Visibility of BIPOC arts
The term BIPOC as used in this study includes Black, Indigenous, and all people of color, recognizing that people who are not of European or White ancestry face varying types of discrimination and prejudice.
Make or B
reak: Race an
d Eth
nicity in En
try-Level Com
pen
sation for A
rts Adm
inistrators in Los Angeles C
ounty
6
administrators, especially in leadership roles, is seen as a critical. Transparency of compensation, benefits, and working conditions is needed for both accountability and to help people searching for entry-level jobs in arts administration make informed decisions. The report ends with a series of recommendations to address the challenges and disparities revealed by the study, including the following:
Organizations employing entry-level arts administrators can • Conduct a demographic analysis of salaries, contracts, fees,
and other payments to all people who do work on your behalf to determine whether certain groups may be experiencing lower pay than others
• Reevaluate job requirements for entry-level positions, especially for education, experience, and mobility, and eliminate those that are not relevant to job-specific tasks
• Explore how pay for staff, contractors, artists, volunteers, and others may affect your organization’s ability to achieve its mission and DEI goals, and discuss the implications for fundraising with your board and funders
• Be publicly transparent about both compensation and the demographic makeup of your organization’s staff and leadership
• Explore how your organization can support debt relief for your staff and advocate for expansion of student debt relief programs
Arts funders can • Implement recommendations from the Full Cost Project to ensure
the arts nonprofits you fund have the resources they need to pay the full cost of employment
• Incorporate pay equity into grantee requirements for diversity, equity, and inclusion

Make or B
reak: Race an
d Eth
nicity in En
try-Level Com
pen
sation for A
rts Adm
inistrators in Los Angeles C
ounty
7
• Require grantees to make public demographic data about their workforce including leadership and board members
This study offers both empirical data and a starting point for action and change. Arts organizations and their funders can take responsibility for that change by looking inward at their own workforce and practices while also taking collective action with others.

Make or B
reak: Race an
d Eth
nicity in En
try-Level Com
pen
sation for A
rts Adm
inistrators in Los Angeles C
ounty
Contents4 EXECUTIVE SUMMARY
11 INTRODUCTION
14 LITERATURE REVIEW
14 Limited data exist about the earnings of arts administrators 16 Empirical data on entry-level earnings in the arts vary 20 Entry-level arts administrators may carry significant debt 22 Unpaid internships are common among entry-level arts administrators 24 The arts workforce does not reflect the full diversity of the population 27 Race and ethnicity are correlated with earnings and generational wealth
30 METHODS
34 FINDINGS AND ANALYSIS 34 Quantitative findings about entry-level respondents 37 Work Characteristics 37 Earnings 40 Education and debt 43 BIPOC Community Findings 47 Summary of quantitative findings

Make or B
reak: Race an
d Eth
nicity in En
try-Level Com
pen
sation for A
rts Adm
inistrators in Los Angeles C
ounty
48 Qualitative findings and themes 49 Theme 1: Arts administrators’ experience of their earnings 52 Theme 2: Arts administrators’ experience of their quality of life 53 Theme 3: The role of family support in arts administrators’ careers 54 Theme 4: Earnings, debt, and race and ethnicity 56 Theme 5: BIPOC arts administrators’ experience in the workforce 58 Summary of qualitative findings
61 CONCLUSIONS AND RECOMMENDATIONS
63 Recommendations for organizations employing entry-level arts administrators 64 Recommendations for arts funders
67 Appendix A: Survey Instrument
77 Appendix B: First Interview Protocol
81 Appendix C: Second Interview Protocol
84 ENDNOTES


Make or B
reak: Race an
d Eth
nicity in En
try-Level Com
pen
sation for A
rts Adm
inistrators in Los Angeles C
ounty
11
IntroductionThe field of arts administration sits at the intersection of two sectors where compensation is known to be low: nonprofit organizations and the arts. It is often assumed that people who decide to work in the nonprofit sector understand they are choosing lower earnings in exchange for the opportunity to do good in the world. In the arts, many people are willing to take a stable if low-paid job in arts administration because they have expertise, a degree, or simply a passion for the art form. Contract work, gig work, seasonal employment, and part-time jobs are also common in the arts. In addition, many people looking for entry-level work in arts and culture volunteer or take unpaid internships in order to get a foot in the door. Perhaps it is not surprising, then, that recent studies have found the arts administration workforce in LA County does not reflect the demographic makeup of the population or the workforce as a whole. It is overwhelmingly female and White. This raises important questions about the relationship between entry-level compensation and diversity, equity, and inclusion in the arts. Do pay scales within organizations act as barriers to certain groups of people? Do arts organizations save money by hiring people who are overqualified for entry-level jobs? Has the field as a whole accepted a compensation structure that reinforces the historical exclusion of people of color from the field? If arts organizations are serious about their statements in support of racial justice, then an examination of how they compensate their employees—especially entry-level workers—is a critical task. This study provides a starting point intended to open up this discussion, looking at entry-level arts administrators in Los Angeles County.
Make or B
reak: Race an
d Eth
nicity in En
try-Level Com
pen
sation for A
rts Adm
inistrators in Los Angeles C
ounty
12
Specifically, this study looks at earnings, debt, and other financial support for entry-level arts administrators, finding troubling differences between BIPOC (Black, Indigenous, and People of Color) people working in arts administration and their White counterparts. Beyond gathering and analyzing quantitative data, however, this study dug deeper, conducting interviews to understand how those earnings and differences are experienced in the daily lives of the people who, despite the challenges they face, pursue a career in the arts. Stakeholders from local government arts agencies to arts nonprofits to arts educators to philanthropic arts funders have acknowledged that lack of diversity, equity, and inclusion in the field prohibit them from achieving their missions, and as such it is recognized as an urgent problem. This report presents empirical evidence of where and how entry-level workforce compensation contributes to the problem. It concludes with a series of recommendations for action that can lead to meaningful change and potential solutions.
Introduction


Make or B
reak: Race an
d Eth
nicity in En
try-Level Com
pen
sation for A
rts Adm
inistrators in Los Angeles C
ounty
14
Literature ReviewThe literature review focuses on what is known about earnings and the racial and ethnic makeup of entry-level arts administrators. This includes related information about the cost of education, debt, and unpaid entry-level work in the field. To put arts administration compensation in a larger context, literature on the relationship between race and ethnicity and both earnings and generational wealth was reviewed.
Limited data exist about the earnings of arts administrators
The “arts workforce” is a concept that can be difficult to define in both practice and existing labor datasets. This is interrelated with the fact that the “creative industries” are not as clearly defined as fields like medicine and construction. The differences are particularly critical in LA County, where the entertainment industry plays a significant role in the local economy and employment. This study focuses on compensation of entry-level arts administrators. Arts administrators work behind the scenes to support both the artists who create art and the public that experiences and appreciates art of every kind.1 The Association of Arts Administration Educators defines arts administrators as “bridg[ing] the artistic world and creative industries with applied managerial, financial, and programmatic skills.”2 In LA County and across the US, most arts administrators work in nonprofit organizations from theaters to museums to festivals to
Make or B
reak: Race an
d Eth
nicity in En
try-Level Com
pen
sation for A
rts Adm
inistrators in Los Angeles C
ounty
15
publishing houses. Some work for nonprofit organizations that provide arts education to children, adults, or both. Some work in government, while others work in privately-owned galleries or museums. People who work in for-profit private sector industries like film and digital media, fashion design, or architecture are generally not considered arts administrators.3 The dividing line is blurry and exceptions to any broad generalization can be found. Nonetheless, creative industries that are commercially viable and are organized primarily to turn a profit are considered to be outside of arts administration. Arts administrators are found in arts and culture organizations with a social goal, including the goal of maintaining an art form that is not commercially viable. “Arts administrators” should not be confused with “artists.” Artists compose music, paint or sculpt, perform, write, dance, and otherwise create art. That work is not the work of arts administration. Though many arts administrators may themselves be artists or maintain an artistic practice, their work as administrators of arts organizations like museums, performance spaces, orchestras, etc., is separate. The Standard Occupational System (SOC) maintained by the federal Bureau of Labor Statistics (BLS)4 does not include an “arts administrator” occupation. Nor does it include a set of occupations that, if combined, can serve as a proxy for that occupation. The North American Industry Classification System (NAICS)5 does not have an industry called “arts administration.” The large NAICS category of Arts, Entertainment, and Recreation includes a wide range of industries beyond arts administration such as “Gambling Facilities and Marinas.” While it is possible to combine NAICS industries like “Museums and Art Galleries” and “Theater Companies and Dinner Theaters,” many people who work in arts administration can be found scattered in categories unrelated to the arts, such as “Educational Services” and “Public Administration.”
Literature Review

Make or B
reak: Race an
d Eth
nicity in En
try-Level Com
pen
sation for A
rts Adm
inistrators in Los Angeles C
ounty
16
To get a sense of what is known about compensation, we looked at a wide range of sources, some of which include arts administrators, as the next section describes.
Empirical data on entry-level earnings in the arts vary
Several studies have analyzed compensation data related to the creative workforce in LA County. Using BLS data, the 2021 Otis Report on the Creative Economy (Otis Report)6 defines the creative economy as being made up of workers within the five creative industry sectors.7 The Otis Report captures data about workers who hold creative occupations (for example, a graphic designer) and work in the creative industries or non-creative industries (for example, a graphic designer working for a theater or one working for a law firm). The report also includes workers that hold non-creative occupations if they are working within the creative industries (for example, a lawyer working for a design firm). The “Fine and Performing Arts” sector is the one that most overlaps with arts administration. In 2019, annual average earnings in the entire “Fine and Performing Arts” sector including those working in non-creative occupations8 in LA County were slightly over $89,200. This average combines seven subsectors. The average annual income of each of the following subsectors was less than $50,000: “Theater Companies and Dinner Theaters,” “Dance Companies,” and “Fine Arts Schools.” A study on Creative Career Pathways for Youth9 which also used BLS data, took a closer look at 70 “Creative Occupations” in LA County that included both “Artistic-Creative Occupations” (occupations defined by the National Endowment for the Arts as being specifically artistic) and “Other Creative Occupations” (occupations that utilize creative skills but are not specifically artistic).
Literature Review

Make or B
reak: Race an
d Eth
nicity in En
try-Level Com
pen
sation for A
rts Adm
inistrators in Los Angeles C
ounty
17
Among the 25 “Artistic-Creative Occupations,” earnings ranged from $14.8010 per hour at the entry level, to $70.83 per hour11 at the experienced level, with a median of $24.49 per hour.12 Median earnings for the 45 “Other Creative Occupations” were $34.21 per hour.13 Most studies of arts-related compensation are not representative samples, and thus the findings cannot be generalized. Nonetheless, they offer an important window into earnings. A 2014 study using aggregated salary data collected directly from LA County arts nonprofits by SMU DataArts (at that time called the Cultural Data Project) found that the average annual salary for a full-time equivalent (FTE)14 employee ten years ago (2011) was just over $57,000.15 This study found the median across all average salaries per FTE varied based on the type of staff, ranging from $31,000 for a general staff position to nearly $50,000 for program staff.16 A 2015 survey of the national arts administration workforce found that 83 percent of employees who held entry-level positions had salaries less than $45,000.17 Studies of arts and culture compensation in areas outside of LA County provide other comparative data for entry-level workers. A 2017 survey of the American Alliance of Museums (AAM) found that in art museums, six out of 51 full-time positions were assistant arts administration positions with an average median salary of $42,752.18 A 2019 salary survey of museum workers by the Association of Art Museum Directors (AAMD) found that eight of 51 positions were assistant arts administration positions. The average overall median for these eight positions was $46,274.19 In 2019, POWarts, a nonprofit professional organization for women in the arts conducted a survey of people working in both nonprofit and for-profit organizations in the arts workforce (data collection was not limited to women). The starting salary in for-profit organizations was $36,750 while it was $35,500 in nonprofits. For “assistant” jobs in for-profits, salaries
Literature Review
Make or B
reak: Race an
d Eth
nicity in En
try-Level Com
pen
sation for A
rts Adm
inistrators in Los Angeles C
ounty
18
ranged from $38,000 to $55,000 with a median of $47,000. In the nonprofit sector they ranged from $39,200 to $51,900 with a median of $46,500.20 Another comparison point for arts administrator compensation is the earnings of artists. A 2018 study examining the financial state of visual artists found that most generated income from other types of work in the same field as their practice. It further found that 23 percent of respondents earned between $20,000 and $30,000 annually. Twelve percent earned between $50,000 and $70,000.21 A 2014 study by BFAMFAPhD, a national advocacy collective of arts professionals, found that the majority of working artists with a bachelor’s degree had median annual earnings of $36,105.22 The National Endowment for the Arts (NEA) found median annual wages and salaries for artists as a whole were $43,230.23 A following 2019 study found median annual wages and salaries for all 11 artist occupations24 was just under $53,000.25 To put these findings into context, minimum wage in LA County26 is $15 per hour as of 2020 ($31,200 annually FTE) for businesses with 26 employees or more and will be $15 per hour for all businesses beginning July 2021. A living wage for a single adult in LA County that covers actual cost of living has been calculated to be $19.35 per hour ($40,248 annually).27 For two working adults with one child the living wage for each adult is $22.79 per hour ($47,403 for each adult annually).28 Median household income in LA County is $68,044.29
Literature Review

Make or B
reak: Race an
d Eth
nicity in En
try-Level Com
pen
sation for A
rts Adm
inistrators in Los Angeles C
ounty
19Literature R
eview
Approximateannual income
Type of earnings (geography)
$57,000
$50,939
$71,157
2014
2019
Salaries, LACounty Arts Commission (SMU/DataArts data)
Building Creative Career Pathways for Youth, Miller & Associates (BLS data)
$89,200 2021 2021 Otis Report, Beacon Economics (BLS data)
Average wages for the Fine and Performing Arts sector in both creative industries and non creative industries (LA County)
Average for a full-time equivalent employee (LA County)
Median for Artistic creative occupations (LA County)
Median for Other creative occupations (LA County)
$40,248 2021 MIT Living Wage Calculator
LA County Living Wage: Single adult living alone
$31,200 2021 LA County Minimum Wage Ordinance
LA County Minimum Wage
SourceYear of publication
Table 1 Studies of Arts-related Annual Earnings (in ascending order)Comparison points for arts and related earnings are highlighted
$47,403 2021 MIT Living Wage Calculator
LA County Living Wage: For each adult in a household with two working adults with one child
$45,000
$46,274
$46,500
$42,752
2015
2019
2019
2019
2017
An Exploratory Study, Cuyler
American Alliance of Museums survey (AAM)
Association of Art Museum Directors survey (AAMD)
POWarts Salary Survey, POWarts
Entry-level arts administrators (US)
Museum wages: Average of eight assistant arts administration positions (US)
Median for assistant jobs in arts nonprofit sector (US)
Museum wages: Average of six assistant arts administration positions (US)
$51,000 POWarts Salary Survey, POWarts
Median for assistant jobs in arts for-profit sector (US)

Make or B
reak: Race an
d Eth
nicity in En
try-Level Com
pen
sation for A
rts Adm
inistrators in Los Angeles C
ounty
20
Overall, these studies suggest that compensation for arts administrators in LA County does not meet a living wage standard. In addition, these figures gloss over a wide array of occupations, many of them poorly defined, in different types of organizations. Only one looks at entry-level workers in particular, and none explores earnings equity for different demographic groups. There have been efforts in recent years to fill gaps in knowledge by crowdsourcing data, such as the Arts + All Museums Salary Transparency 2019 spreadsheet,30 but even this did not include data on such demographics as race and ethnicity or gender identity. Earnings equity continues to be an area that needs further examination in the field of arts administration.
Entry-level arts administrators may carry significant debt
On the whole, arts administrators are highly educated compared to the overall population. Cuyler’s national survey found that 93 percent of arts administrators had a bachelor’s degree or higher. Forty-seven percent had a master’s degree.31 By comparison, only 32 percent of all Americans have at least a bachelor’s degree.32 Studies of other parts of the creative workforce show similar findings. A 2018 Americans for the Arts’ (AFTA) survey of local arts agency33 employees found that 85 percent had a post-secondary degree; 45 percent had a bachelor’s, and 40 percent had a master’s.34 AAM found that more than 90 percent of museum workers had a bachelor’s degree.35 A 2019 NEA report on artists and other cultural workers combined found at least 63 percent held a bachelor’s degree.36 That share was up from 59 percent in 2011.37 None of these studies asked about student debt, but the National Postsecondary Student Aid Survey (NPSAS) is suggestive. NPSAS found that from 1999 to 2016, 60 percent of all master’s degree
Literature Review

Make or B
reak: Race an
d Eth
nicity in En
try-Level Com
pen
sation for A
rts Adm
inistrators in Los Angeles C
ounty
21
graduates had loans, and their average loan balance was $66,000. The table below shows how this compares to debt levels for people with other types of master’s degrees.
How does this play out for arts administrators? Little data exist about the educational debt they carry. Data about the cost of an arts-related degree suggest debt could be high, but while some may have degrees specific to arts, it is likely many do not. A 2017 survey of arts program alumni by the Strategic National Arts Alumni Project (SNAAP) provides a hint. Thirty-four percent of recent alumni stated that student debt had a major impact on their career.39 A 2020 report by SNAAP looking at data from 2011, 2012, and 2013 found that nearly ten percent of alumni reported having ever worked in an arts administration or similar role. In terms of education, just under one percent of surveyed alumni reported majoring in arts
Percent of degreeholders with studentdebt
Average student loan balance
Master’s degree type
62%
56%
60%
51%
59%
70%
$55,200
$62,300
$66,000
$66,300
$72,800
$75,100
Education
Science
All combined
Business
Art
Other (includes public administration or policy, social work, fine arts, public health, and other)
Table 2 Graduate student debt, 2015-16 (NPSAS survey)38
Literature Review
Make or B
reak: Race an
d Eth
nicity in En
try-Level Com
pen
sation for A
rts Adm
inistrators in Los Angeles C
ounty
22
administration or management. This study found that alumni with more than $50,000 in student loan debt were significantly more likely to leave the arts than individuals who reported lower levels of debt.40 Another hint can be found in the cost of degree programs in arts management or arts administration, most of which are graduate programs. Posted tuition rates (not including any additional attendance costs) for these master’s degrees requiring more than 40 credits41 range from $34,320 at Seattle University42 to $103,400 at Carnegie Mellon University.43 Graduate degree and certificate programs that require fewer academic credits44 range from $17,806 at the University of Oregon45 to $60,480 at The New School.46 (These figures do not reflect the financial aid discount rate that can reduce overall tuition by up to 50 percent.) By comparison, the National Center for Education Statistics (NCES) reports that the 2015–2016 average total price of attendance for a single year of graduate school (tuition plus all additional costs minus any grants or financial aid)47 in the US was $28,900.48 High rates of advanced educational attainment suggest it is likely that entry-level arts administrators will carry student debt – possibly a significant amount of it. The size of student debt payments can have a meaningful impact on whether their earnings are adequate to cover the cost of living in LA County. Student debt is not included in most living wage calculators. Whether debt levels vary by demographic groups is also unknown.
Unpaid internships are common among entry-level arts administrators
Internships are common paths into the nonprofit workforce, and they are a common experience for undergraduates in all fields of study. A 2016 report by the National Association of Colleges and Employers
Literature Review

Make or B
reak: Race an
d Eth
nicity in En
try-Level Com
pen
sation for A
rts Adm
inistrators in Los Angeles C
ounty
23
(NACE) on the impact of unpaid internships on career development and employment outcomes found that 65 percent of college students participated in at least one internship. Forty percent of those internships were unpaid. Some degree programs require completion of an internship for graduation. This report also found unpaid internships were an additional barrier to career success for students from lower-income backgrounds.49 Another study on internships in general, not specific to the arts, had unexpected findings on the relationship between internships and the probability of receiving a job offer. Using a model that controlled for more than 25 variables (e.g., post-graduate plans, support in job search, and racial background), the study found that completing a paid internship was associated with only a 14.2 percent increase in the probability of receiving a job offer compared to not completing an internship at all. However, completing any internship had only a 4.4 percent increase in the probability of receiving a job offer. In recent years, increasing attention has been paid to the role of unpaid internships in limiting diversity, equity, and inclusion in the arts. In LA County, both the Cultural Equity and Inclusion Initiative Literature Review published in 201650 and a subsequent 2019 report exploring creative career pathways for youth51 identified unpaid internships as a barrier to entering the arts workforce for people who cannot afford to work without pay. This practice is referred to as “self-funded training” in a UK study about entry to the museum workforce, where unpaid internships were seen as creating an additional barrier on top of student debt.52 Unpaid interns working in arts administration positions in New York City and Toronto reported in a 2015 study they could not have maintained their living costs without parental support or without several additional jobs outside of the creative industries. In some cases, they worked as much as 80 hours a week.53
Literature Review

Make or B
reak: Race an
d Eth
nicity in En
try-Level Com
pen
sation for A
rts Adm
inistrators in Los Angeles C
ounty
24
A UK survey of recent graduates who had experienced unpaid work in the creative industries found that “underprivileged people did not have the appropriate connections to find paid jobs and they could not afford to work for free to get their ‘foot in the door.’”54 More than 40 percent of UK internships in the arts have been found to be unpaid, and an additional 40 percent were compensated only for expenses and/or paid less than minimum wage.55 In June 2019, the AAMD passed a resolution “urging art museums to provide paid internships.” The resolution stated that internships provide necessary experience, but “paid internships are essential to increasing access and equity for the museum profession.”56 The literature suggests arts organizations are beginning to recognize that offering unpaid work opportunities adds to inequity of opportunity for people who cannot afford to work for free, and how it can have a compounding effect on those who lack social capital and personal connections in the field. The burden of student debt can put unpaid positions further out of reach for even more potential arts administrators.
The arts workforce does not reflect the full diversity of the population Studies across the US and in various disciplines find the arts workforce to be overwhelmingly White. A 2019 survey of nonprofit and government arts administrators in LA County by SMU DataArts found this workforce was more non-Hispanic White and more homogenous than the county population as a whole.57 Fifty-nine percent of the total arts workforce was non-Hispanic White compared with 26 percent of the county population. However, non-supervisory staff were found to be less White (49 percent) than those in supervisory (61 percent) or board (68 percent) roles. The 2019 Otis Report found the
Literature Review
Make or B
reak: Race an
d Eth
nicity in En
try-Level Com
pen
sation for A
rts Adm
inistrators in Los Angeles C
ounty
25
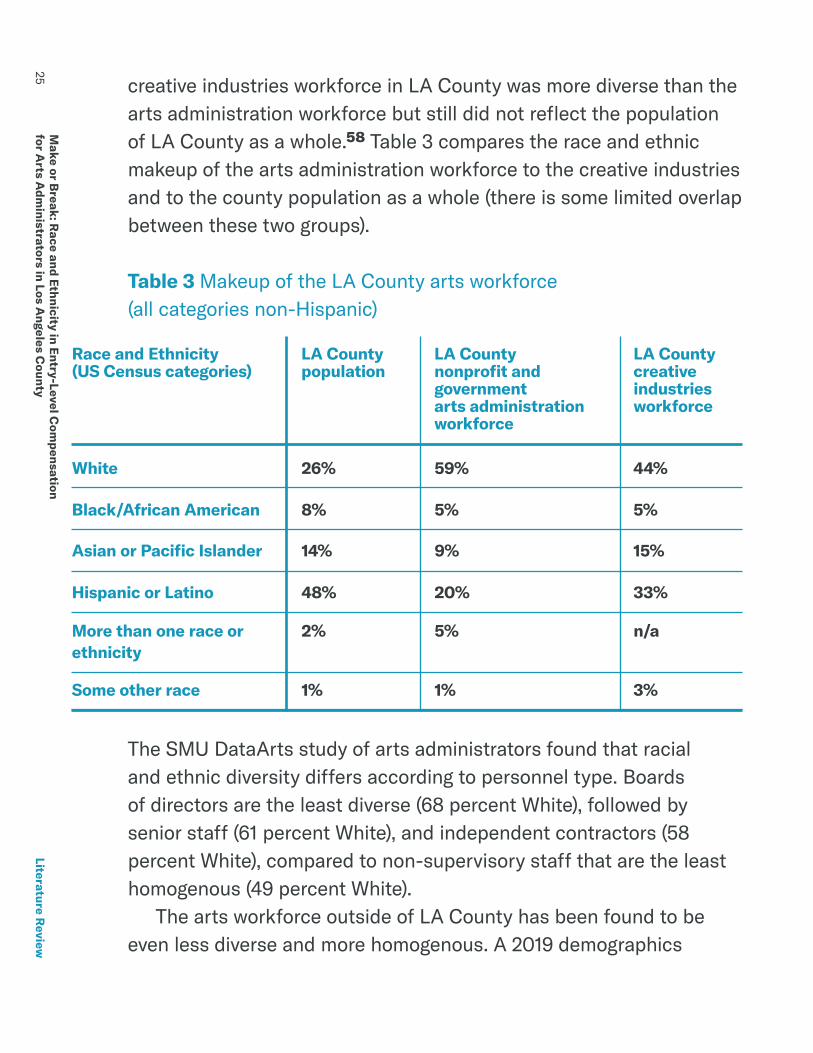
creative industries workforce in LA County was more diverse than the arts administration workforce but still did not reflect the population of LA County as a whole.58 Table 3 compares the race and ethnic makeup of the arts administration workforce to the creative industries and to the county population as a whole (there is some limited overlap between these two groups).
The SMU DataArts study of arts administrators found that racial and ethnic diversity differs according to personnel type. Boards of directors are the least diverse (68 percent White), followed by senior staff (61 percent White), and independent contractors (58 percent White), compared to non-supervisory staff that are the least homogenous (49 percent White). The arts workforce outside of LA County has been found to be even less diverse and more homogenous. A 2019 demographics
LA County population
Race and Ethnicity (US Census categories)
26%
8%
14%
48%
2%
1%
White
Black/African American
Asian or Pacific Islander
Hispanic or Latino
LA County creativeindustries workforce
44%
5%
15%
33%
n/a
3%
LA Countynonprofit andgovernmentarts administration workforce
59%
5%
9%
20%
5%
1%
Table 3 Makeup of the LA County arts workforce (all categories non-Hispanic)
More than one race or
Some other race
ethnicity
Literature Review

Make or B
reak: Race an
d Eth
nicity in En
try-Level Com
pen
sation for A
rts Adm
inistrators in Los Angeles C
ounty
26
survey of arts administrators at the largest arts institutions in New York City found that 66 percent of this workforce was White compared to 32 percent of the city population.59 In 2018, a national survey by AFTA of staff at local arts agencies found that nearly 81 percent of full-time employees were White.60 Similarly, Cuyler’s 2015 national survey of arts administrators found that 78 percent of respondents were Caucasian/White American.61 In the UK, a 2018 study found that 88 percent of the creative industries and 89 percent of the creative economy workforces were White, in comparison to 86 percent of England’s population.62 National research on the museum workforce has had similar findings. A 2018 study found that 72 percent of all art museum employees were White,63 similar to their earlier findings in 2015.64 These studies also found that 80 percent of “intellectual leadership” positions such as heads of departments or curatorial, education, or conservation positions, were White. In LA County, two long-running paid internship programs are working to increase the diversity of arts administrators. The Getty Marrow Undergraduate Internship program (formerly the Multicultural Undergraduate Internship program)65 administered and funded by the Getty Foundation is only open to undergraduates of color. The LA County Arts Internship Program (AIP)66 is administered and funded by the Department of Arts and Culture. Both offer paid internships to undergraduate students to work for arts organizations across LA County. Since its founding in 1993, participants in the Getty Marrow program are 40 percent Hispanic or Latino, 39 percent Asian, 13 percent African American, three percent Pacific Islander, three percent Multi-Ethnic, one percent Native American, and one percent “Other.”67 Analysis of nine years of LA County’s AIP program found the percent of participants who are White has declined each year, while the percent who are Hispanic or Latino, Asian or Pacific Islander, or Mixed Ethnicity has increased each year.68 In
Literature Review

Make or B
reak: Race an
d Eth
nicity in En
try-Level Com
pen
sation for A
rts Adm
inistrators in Los Angeles C
ounty
27
2020, 24 percent of participants in LA County’s AIP program were White, 27 percent were Hispanic or Latino, 21 percent were Asian or Pacific Islander, ten percent were Black or African American, and 15 percent were Mixed Ethnicity. To address continued disparities around equity and access to arts careers, the number of positions was increased through the LA County Cultural Equity and Inclusion Initiative, earmarking the additional internships for community college students. While internship programs like this can help build a pipeline to employment opportunities in arts administration for communities underrepresented in the workforce, additional research is needed to discover whether these internships lead to long-term employment in the field at a rate higher than national studies have found for paid internships.
Race and ethnicity are correlated with earnings and generational wealth Arts administration compensation takes place within the broader economy, so it is important to place them in context of wider trends. In the US, race and ethnicity appear to be correlated with earnings. For example, 2018 data from the Current Population Survey (CPS) show weekly earnings were lowest for people who are Hispanic or Latino ($680), followed by Black or African American ($694), then White ($916) and highest for people who are Asian or Pacific Islander ($1,095).69 2018 data from the US Bureau of Labor Statistics (BLS) breaks out those groups in more detail, finding that nationally, household income was lowest where the head of household is Black or African American, followed by (in ascending order) Hispanic or Latino, American Indian or Alaska Native, Multi-Racial, Native Hawaiian or Other Pacific Islander, White, and Asian.70
Literature Review

Make or B
reak: Race an
d Eth
nicity in En
try-Level Com
pen
sation for A
rts Adm
inistrators in Los Angeles C
ounty
28
A 2017 study of LA County found Whites to have the highest earnings, followed by (in descending order) people who are Asian, Native American, Black or African American, Native Hawaiian or Other Pacific Islander, and Latino.71 Race and ethnicity are also correlated with wealth, and how wealth is accumulated and transferred over time from one generation to another. Alongside income disparities, wealth is another component of racial economic gaps in the US. According to a 2013 study by the Urban Institute, the wealth gap between races is much bigger than the income gap, and neither has improved over time.72 In 2010, White people on average had six times the wealth of Black or Hispanic people. In addition, the wealth gap grows sharply over age. When comparing cohorts in their 30s and in their 60s, White people started out with three and a half times more wealth than Black people and four times more than Hispanic people and ended up with seven and five times more wealth, respectively. Another study by the Urban Institute found that racial disparities in wealth stem not from higher debt but from lower asset holdings among non-White people.73 Black and Hispanic families were found to be five times less likely to receive large family gifts and inheritance than White families. Research shows that wealth rather than income is more important in understanding racial economic inequities, and it is critical in assuring security and opportunities for families in the US. According to the National Asset Scorecard for Communities of Color (NASCC) survey,74 racial wealth differences are bigger than income differences. Black and Mexican households have one percent of the wealth of Whites in the Los Angeles—Long Beach-Santa Ana Metropolitan Statistical Area. Koreans hold seven percent, other Latinos have 12 percent, and Vietnamese have 17 percent. Among non-White groups, Japanese, Asian Indian, and Chinese households had higher median wealth than Whites.75
Literature Review

Make or B
reak: Race an
d Eth
nicity in En
try-Level Com
pen
sation for A
rts Adm
inistrators in Los Angeles C
ounty
29
In the context of the data about entry-level compensation, wealth should be understood as an asset that enables arts administrators to self-fund or family-fund their careers, especially in its early stages. As such, arts administrators who are wealthy, who are more likely to be White, could potentially have a substantial advantage over their BIPOC (Black, Indigenous, and People of Color) counterparts.
To summarize, little is known about the earnings of arts administrators, in part because the field is not well defined and does not fit easily into existing industrial or occupational taxonomies. Analysis of what is known about various types of occupations and employers related to the arts finds a range of earnings. While most appear to at least meet a living wage standard in LA County, the figures do not account for student debt nor for unpaid work— especially unpaid internships—that are common among entry-level arts administrators. Moreover, what little is known about earnings for arts administrators does not appear to explore demographic differences, especially earnings by race and ethnicity. Recent studies have found the arts workforce to be predominantly White. Research into the broader economy finds that, with some exceptions, people of color tend to earn less than their White counterparts and have less generational wealth to pass down to their children and grandchildren. If we are to ensure that employment opportunities in arts administration are equitably available to everyone in LA County, we need to know how much entry-level workers earn in terms of dollars, but we also need to explore how they experience those earnings in their daily lives. Understanding the relationship between earnings and race and ethnicity are critical starting points to addressing persistent inequities in the field.
Literature Review

Make or B
reak: Race an
d Eth
nicity in En
try-Level Com
pen
sation for A
rts Adm
inistrators in Los Angeles C
ounty
30
Methods This study used an explanatory mixed methods approach to explore the relationship between entry-level earnings and diversity, equity, and inclusion among LA County arts administrators. First, a survey was administered to arts administrators throughout LA County asking questions about employment in the arts (see Appendix A for the survey instrument), including compensation, hours of work, and type of employer. Knowing that many entry-level workers work part-time or on contract and may have more than one job, each respondent was able to provide information about up to three jobs in the arts. The survey also asked questions about debt, education, other sources of income, and demographics. Open-ended questions offered an opportunity to add comments. The survey was circulated through both educational and arts organizations in LA County, including University of Southern California, the Claremont Colleges, Arts for LA, and the Center for Cultural Innovation. A snowball technique was used, encouraging people to share it onward with others. As survey responses came in, the number of Black or African American respondents was not proportionate to their representation in the arts workforce, so we reached out to several individuals and organizations likely to reach that community of entry-level arts administrators, who shared it through their networks. A total of 311 survey responses were received. Following a data cleaning process to remove partial responses and one that was irrelevant, our final data set included a total of 169 complete responses. Nearly 70 percent of the survey respondents (n=115) reported their primary job in the arts was either “Entry-Level” or
Make or B
reak: Race an
d Eth
nicity in En
try-Level Com
pen
sation for A
rts Adm
inistrators in Los Angeles C
ounty
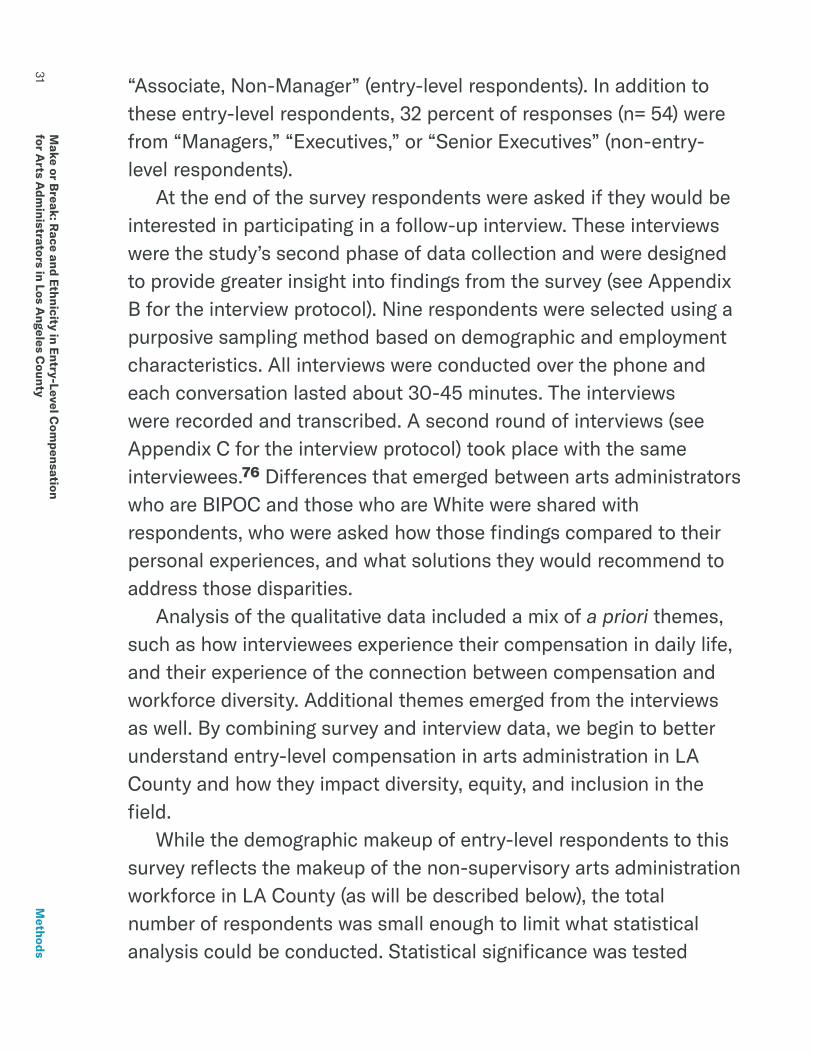
31
“Associate, Non-Manager” (entry-level respondents). In addition to these entry-level respondents, 32 percent of responses (n= 54) were from “Managers,” “Executives,” or “Senior Executives” (non-entry-level respondents). At the end of the survey respondents were asked if they would be interested in participating in a follow-up interview. These interviews were the study’s second phase of data collection and were designed to provide greater insight into findings from the survey (see Appendix B for the interview protocol). Nine respondents were selected using a purposive sampling method based on demographic and employment characteristics. All interviews were conducted over the phone and each conversation lasted about 30-45 minutes. The interviews were recorded and transcribed. A second round of interviews (see Appendix C for the interview protocol) took place with the same interviewees.76 Differences that emerged between arts administrators who are BIPOC and those who are White were shared with respondents, who were asked how those findings compared to their personal experiences, and what solutions they would recommend to address those disparities. Analysis of the qualitative data included a mix of a priori themes, such as how interviewees experience their compensation in daily life, and their experience of the connection between compensation and workforce diversity. Additional themes emerged from the interviews as well. By combining survey and interview data, we begin to better understand entry-level compensation in arts administration in LA County and how they impact diversity, equity, and inclusion in the field. While the demographic makeup of entry-level respondents to this survey reflects the makeup of the non-supervisory arts administration workforce in LA County (as will be described below), the total number of respondents was small enough to limit what statistical analysis could be conducted. Statistical significance was tested
Meth
ods
Make or B
reak: Race an
d Eth
nicity in En
try-Level Com
pen
sation for A
rts Adm
inistrators in Los Angeles C
ounty
32
wherever possible. While these findings are not generalizable to the arts administration workforce as a whole, either within LA County or beyond, the findings here are nonetheless highly suggestive and offer direction both for future research and for internal reflection and action within arts organizations. Timing of this study should also be noted. The survey was administered in the first quarter of 2020, shortly before the COVID-19 pandemic was declared. Most interviews were conducted in February 2020, before any closures or restrictions were announced. The second round of interviews took place during November 2020. While there have been significant layoffs, furloughs, pay reductions, and other major losses in the arts and culture sector in LA County during the pandemic, these are not reflected in this study.
Meth
ods


Make or B
reak: Race an
d Eth
nicity in En
try-Level Com
pen
sation for A
rts Adm
inistrators in Los Angeles C
ounty
34
Findings and Analysis Quantitative findings about entry-level respondents
At 43 percent White, this group of respondents looked like the entry-level arts administration workforce in LA County: less homogenous than the overall arts workforce and less diverse than LA County population as a whole. A profile of the most common entry-level respondent would be female, in her twenties, holding one job in a nonprofit organization where she was compensated hourly. Significant differences in earnings, debt, and sources of outside support were found. The demographic makeup of survey respondents is representative of the non-supervisory arts administration workforce in LA County. Using US Census categories that, while problematic, allow for comparison to the total population, 43 percent of entry-level respondents were White, 30 percent were Hispanic or Latino, and 14 percent Asian or Pacific Islanders. Eight percent of respondents identified as having mixed ethnicity, and three percent of respondents were Black or African American. Previous research on demographics of the LA County arts and culture workforce found 49 percent of non-supervisory arts administrators in LA County to be White. Figure 1 compares the breakdown of respondents to this survey to both non-supervisory staff in the earlier study and to the workforce as a whole.

Make or B
reak: Race an
d Eth
nicity in En
try-Level Com
pen
sation for A
rts Adm
inistrators in Los Angeles C
ounty
35
Figure 1 Respondent Race and Ethnicity Compared to Arts Workforce
15%
30%
45%
60%
0%
3%2%
1% 1%2%
1%
5%3%
8% 9%
56%
49%
43%
6%
16%14% 14% 14%
11% 12%
30%
Survey Entry Level
Decline to state
WhiteHispanic or Latino
Asian or Pacific Islander
Mixed Ethnicity
Black or African American
Other
SMU DataArts Non-Supervisory SMU DataArts All Workforce
Among entry-level survey respondents, more than half were in their twenties and 29 percent in their thirties (Figure 2). By comparison 41 percent of non-supervisory staff in the LA County arts and culture workforce were found to be ages 15-34 and 27 percent were ages 35-49.77
Figure 2 Respondent Age
20-29
30-39
40-49
50-59
60-69
Younger than 20 1%
1%
3%
9%
29%
57%
Findings an
d An
alysis

Make or B
reak: Race an
d Eth
nicity in En
try-Level Com
pen
sation for A
rts Adm
inistrators in Los Angeles C
ounty
36
Seventy percent of entry-level respondents were women, 25 percent were men, four percent were gender non-conforming, and two percent declined to state. This is comparable to 63 percent of non-supervisory staff in the LA County arts and culture workforce found to be female, 31 percent male, and four percent transgender/gender non-conforming.78 Sixteen percent of respondents (n=18) reported they were currently in school. Ninety-two percent of entry level respondents reported their residential zip codes (nine did not). As Figure 3 shows, all but two of them live within LA County. Many can be seen living in or near the downtown core of the City of Los Angeles, where prior research has found a higher concentration of headquarters for nonprofit arts organizations.79 Others live in some of the 88 other cities and unincorporated areas within the county.
Figure 3 Residential Zip Codes of Respondents
Findings an
d An
alysis
Make or B
reak: Race an
d Eth
nicity in En
try-Level Com
pen
sation for A
rts Adm
inistrators in Los Angeles C
ounty
37
Work Characteristics
Two thirds of entry-level respondents worked for nonprofit organizations. Fifteen percent worked in government, while nine percent worked for private foundations and six percent in for-profit organizations. Most respondents in the “Other” category (three percent) worked in education. About 70 percent of all entry-level respondents worked for an hourly wage, while 15 percent were paid by an annual salary. Seven percent of respondents worked on contract. Of those, about half were paid by the hour, and half were paid by deliverables. Respondents were allowed to report on up to three jobs in the arts. A total of 148 positions was reported across the 115 entry-level respondents. More than two-thirds of entry-level respondents reported having one job while 16 percent had two. By comparison, nearly five percent of workers in the US have more than one job, one-third the level of these survey respondents.80
Earnings
Average annual income from all sources for entry-level respondents was $36,847, which is 18 percent higher than the LA County minimum wage of $31,200, but lower than the living wage of $40,248. Respondents reported working an average of 34 hours per week in their primary arts job. Of the 101 respondents who reported total annual earnings, the highest was $98,470 and the lowest was $1,425. Two reported zero earnings. Average annual income from all employment varied by race and ethnicity, as Figure 4 shows. Average earnings for Hispanic or Latino respondents and for Black or African American respondents were less than the overall average, and less than what would be earned working
Findings an
d An
alysis

Make or B
reak: Race an
d Eth
nicity in En
try-Level Com
pen
sation for A
rts Adm
inistrators in Los Angeles C
ounty
38
40 hours per week at LA County’s minimum wage. The average for Asian or Pacific Islander and White respondents were above the overall average. White respondents earned 50 percent more than their Hispanic or Latino counterparts, 33 percent more than their Black or African American contemporaries, and 7.5 percent more than their Asian or Pacific Islander contemporaries.
The difference in earnings between White and Latino respondents was statistically significant81 but was not statistically significant when comparing White to Asian respondents.82 Average annual income from all employment increased with age, as Figure 5 shows. More than half the respondents were in their 20s, so that group was tested against all older respondents and the difference was found to be statistically significant.83
Findings an
d An
alysis
Figure 4 Average Annual Income from all Employment by Race and Ethnicity
White
Asian or Pacific Islander
Overall Entry Level Average
Black or African American
LA County Minimum Wage
Hispanic or Latino $27,684
$31,200
$32,475
$36,847
$40,400
$43,437

Make or B
reak: Race an
d Eth
nicity in En
try-Level Com
pen
sation for A
rts Adm
inistrators in Los Angeles C
ounty
39Fin
dings and A
nalysis
Figure 5 Average Annual Income from all Employment by Age
20-29
LA County Minimum Wage
Overall Entry Level Average
30-39
40-49
50-69 $58,350
$55,177
$40,450
$36,847
$31,200
$30,277
Average earnings for women was $36,596 while for men it was $39,331 but the difference was not statistically significant.84 Earnings also differed by type of employer. The lowest total earnings for entry-level positions were for respondents working for nonprofit organizations and private foundations, $36,755 and $36,178, respectively. Slightly higher average annual income of $39,470 was reported in government. The for-profit sector had the highest average annual income at $43,250 for its entry-level positions. However, variation in earnings between those employed by nonprofits and those in government and for-profits was found not to be statistically significant.85
Figure 6 Annual Average Income from all Employment: Type of Employer and Employee Level
For profit
Government
Overall Entry Level Average
Nonprofit
Foundation
LA County Minimum Wage $31,200
$36,177
$36,754
$36,847
$39,470
$43,250
Make or B
reak: Race an
d Eth
nicity in En
try-Level Com
pen
sation for A
rts Adm
inistrators in Los Angeles C
ounty
40Fin
dings and A
nalysis
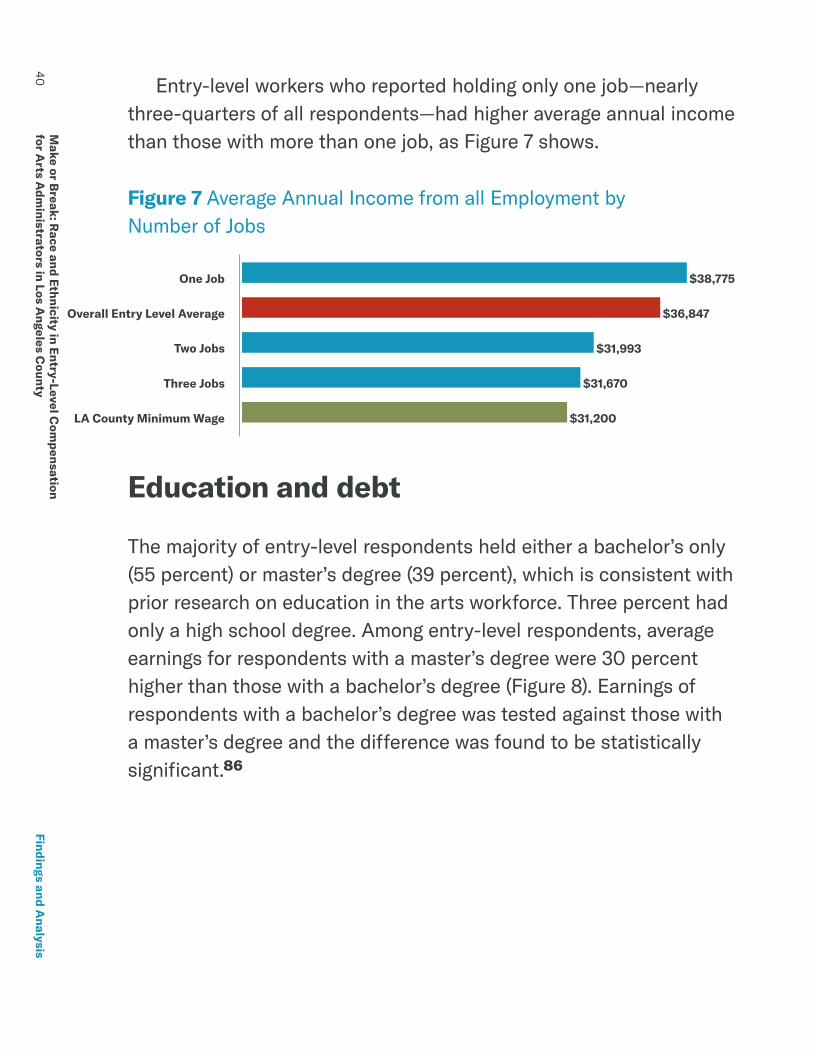
Entry-level workers who reported holding only one job—nearly three-quarters of all respondents—had higher average annual income than those with more than one job, as Figure 7 shows.
Education and debt The majority of entry-level respondents held either a bachelor’s only (55 percent) or master’s degree (39 percent), which is consistent with prior research on education in the arts workforce. Three percent had only a high school degree. Among entry-level respondents, average earnings for respondents with a master’s degree were 30 percent higher than those with a bachelor’s degree (Figure 8). Earnings of respondents with a bachelor’s degree was tested against those with a master’s degree and the difference was found to be statistically significant.86
Figure 7 Average Annual Income from all Employment by Number of Jobs
One Job
Overall Entry Level Average
Two Jobs
Three Jobs
LA County Minimum Wage $31,200
$31,670
$31,993
$36,847
$38,775

Make or B
reak: Race an
d Eth
nicity in En
try-Level Com
pen
sation for A
rts Adm
inistrators in Los Angeles C
ounty
41Fin
dings and A
nalysis
Figure 8 Average Annual Income from all Employment by Education Level
Master's
Overall Entry Level Average
Bachelor's
LA County Minimum Wage $31,200
$33,314
$36,847
$43,464
On average, entry-level respondents reported carrying $32,724 in student debt at the time of the survey. The average among non-entry-level respondents was $38,743. Entry-level respondents with master’s degrees reported an average of $68,459 in debt, while those with bachelor’s degrees was much lower at $9,695. Among entry-level respondents, student debt increased by age (as measured by decade) from people in their twenties, thirties, and forties, before declining for those in their fifties and sixties (Figure 9). Not shown in the chart, this pattern was reversed for non-entry-level respondents, where student debt was highest among those in their twenties and declined by each decade.
Figure 9 Average Student Debt by Age Group
20–29
Overall Average
30–39
40–49
50–69 $22,050
$53,960
$47,379
$32,724
$22,422

Make or B
reak: Race an
d Eth
nicity in En
try-Level Com
pen
sation for A
rts Adm
inistrators in Los Angeles C
ounty
42Fin
dings and A
nalysis
Student debt was the most common source of debt with 56 percent of entry-level respondents reporting it. In addition to student debt, respondents could share other types of debt such as housing, transportation, business, or health. Among the 115 entry-level respondents, 23 percent (n=26) reported they carried no debt. Using credit bureau data from TransUnion, the Urban Institute estimates 20 percent of Americans do not have any recorded debt.87 The majority of entry-level respondents reported at least one other source of income in addition to income earned from working as an arts administrator. The most common was family support (35 percent), followed by non-arts employment income (23 percent). Interest and “Other” were the third most common income category (10 percent each).
Figure 10 Other Income Sources
Family Support
Non-arts Employment
Interest
Other
Scholarships, Fellowships, or Grants
Inheritance
Business
Rent
5%
3%
2%
8%
10%
23%
35%
10%

Make or B
reak: Race an
d Eth
nicity in En
try-Level Com
pen
sation for A
rts Adm
inistrators in Los Angeles C
ounty
43
BIPOC Community Findings
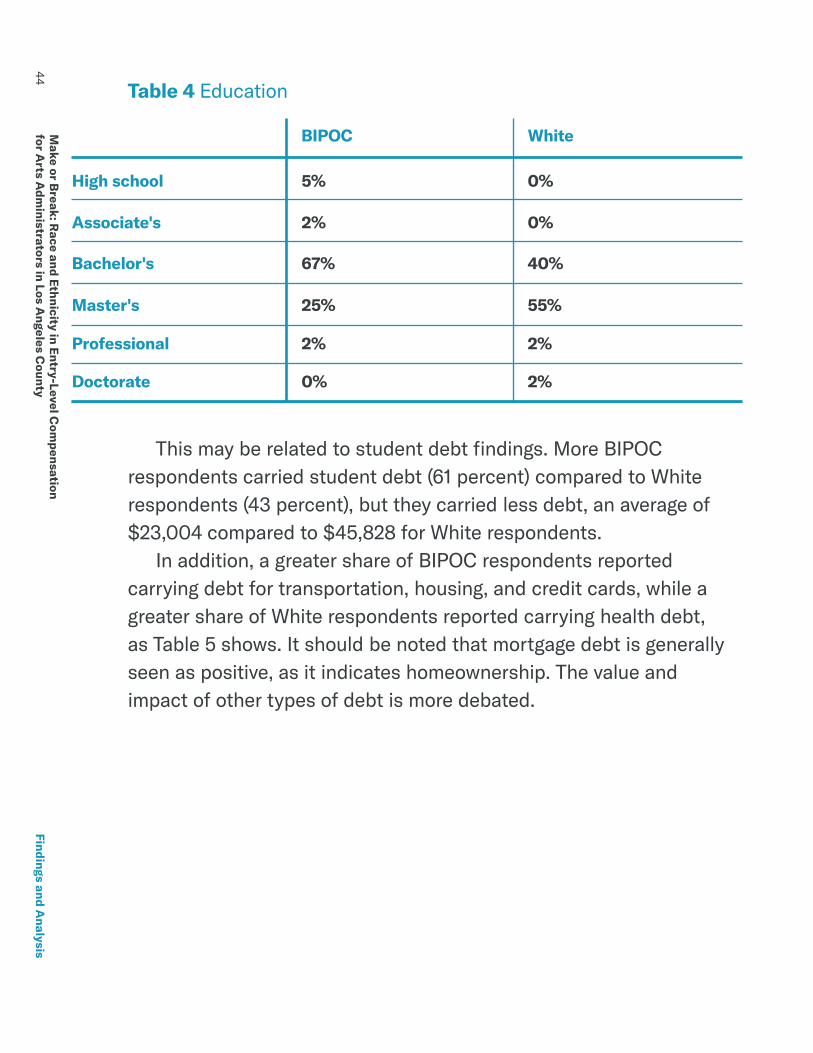
As a whole entry-level respondents to this survey, as shown above, “look like” the non-supervisory arts administration workforce. However, the number of total respondents was not large enough for an analysis that breaks out data separately for each race or ethnic group. Therefore, all BIPOC respondents as a group were compared to White respondents as a group. Notable differences were found in earnings, education, financial support, and debt. While average total earnings for entry-level arts administrators was $36,847, it was $32,027 for BIPOC respondents, above minimum wage for a full-time (40 hours per week) position. However, it was $43,437 for White respondents, a difference of $11,410, or 35 percent higher. This difference was found to be statistically significant.88 White respondents earned more no matter the education level. Average annual earnings for White respondents with a bachelor’s degree were 18 percent greater than for BIPOC respondents with a bachelor’s degree. Average annual earnings for White respondents with a master’s degree were 14 percent higher than for BIPOC respondents with a master’s degree. While the largest share of BIPOC entry-level arts administrators reported a bachelor’s degree as their highest education level, the largest share of White respondents reported a master’s degree as their highest education level.
Findings an
d An
alysis
Make or B
reak: Race an
d Eth
nicity in En
try-Level Com
pen
sation for A
rts Adm
inistrators in Los Angeles C
ounty
44Fin
dings and A
nalysis
BIPOC
5%
2%
67%
25%
2%
0%
High school
Associate's
Bachelor's
Master's
0%
0%
40%
55%
2%
2%
White
Table 4 Education
Professional
Doctorate
This may be related to student debt findings. More BIPOC respondents carried student debt (61 percent) compared to White respondents (43 percent), but they carried less debt, an average of $23,004 compared to $45,828 for White respondents. In addition, a greater share of BIPOC respondents reported carrying debt for transportation, housing, and credit cards, while a greater share of White respondents reported carrying health debt, as Table 5 shows. It should be noted that mortgage debt is generally seen as positive, as it indicates homeownership. The value and impact of other types of debt is more debated.

Make or B
reak: Race an
d Eth
nicity in En
try-Level Com
pen
sation for A
rts Adm
inistrators in Los Angeles C
ounty
45Fin
dings and A
nalysis
BIPOC
2%
10%
13%
20%
43%
Business debt
Health debt
Credit card debt
Housing debt
2%
13%
6%
17%
34%
White
Table 5 Other Debt
Transportation debt
A little more than one-third of BIPOC respondents reported receiving financial support from family (other than inheritance) while a little less than one-third of White respondents did, as Table 6 shows. More White respondents reported non-arts employment compared to BIPOC respondents. BIPOC respondents more commonly had support in the form of scholarships, fellowships, and grants, while White respondents more commonly had income from interest, businesses, inheritance, and rent. More BIPOC respondents reported holding more than one job in the arts, 23 percent, compared to 17 percent of White respondents.

Make or B
reak: Race an
d Eth
nicity in En
try-Level Com
pen
sation for A
rts Adm
inistrators in Los Angeles C
ounty
46Fin
dings and A
nalysis
BIPOC
39%
21%
11%
10%
10%
2%
2%
0%
Family support
Non-arts employment
Other
Scholarships, fellowships, or
32%
30%
11%
6%
13%
4%
11%
4%
White
Table 6 Other sources of financial support
Interest
Business income
Inheritance
Rent
While combining all BIPOC respondents into a single category prevents us from seeing how total income, numbers of jobs, other sources of financial support, and debt carried vary among different racial and ethnic groups, it does help us to see that overall, the experiences of this community as entry-level arts administrators is different from those of White entry-level arts administrators. Compared to their White colleagues, entry-level BIPOC arts administrators earn less, more commonly have more than one job, are more reliant on financial support from scholarships, fellowships, and grants, and are less reliant on business income or inheritance. They are more likely to have a bachelor’s degree while White entry-level arts administrators are more likely to have a master’s degree.

Make or B
reak: Race an
d Eth
nicity in En
try-Level Com
pen
sation for A
rts Adm
inistrators in Los Angeles C
ounty
47
Summary of quantitative findings
Key findings from the survey data are as follows:• Average annual income from all sources for entry-level
respondents was $36,847, slightly higher than the LA County minimum wage of $31,200, but lower than the living wage of $40,248.
• Average annual earnings for entry-level arts administrators were $32,027 for BIPOC respondents, just above minimum wage for a full-time position, but it was $43,437 for White respondents, a difference of $11,410, or 35 percent higher. No matter their education level, White respondents earned more than BIPOC respondents.
• Average annual earnings varied significantly according to race and ethnicity with White and Asian respondents earning above average, and Black or African American and Latino respondents earning below average, but still above the LA County minimum wage.
• Average annual earnings increased with age and education level and did not vary significantly according to employer type, but actually decreased for respondents with more than one job.
• Race/ethnicity, age, and degree were found to have a statistically significant relationship with earnings, with BIPOC respondents, younger respondents, and respondents with a bachelor’s degree earning less. At the same time, neither gender identity nor the type of organization worked for was found to be statistically significant.
• Two-thirds of entry-level respondents reported carrying some kind of debt, most commonly student loans, followed by debt for housing, transportation, business, or health.
Findings an
d An
alysis
Make or B
reak: Race an
d Eth
nicity in En
try-Level Com
pen
sation for A
rts Adm
inistrators in Los Angeles C
ounty
48
• Average student debt was $32,724, and varied significantly according to education level, race, and age. More BIPOC respondents carry student debt, but their average debt was about half of what it was for White respondents.
• Most respondents reported they receive some financial support from other sources, primarily family support.
Qualitative findings and themes
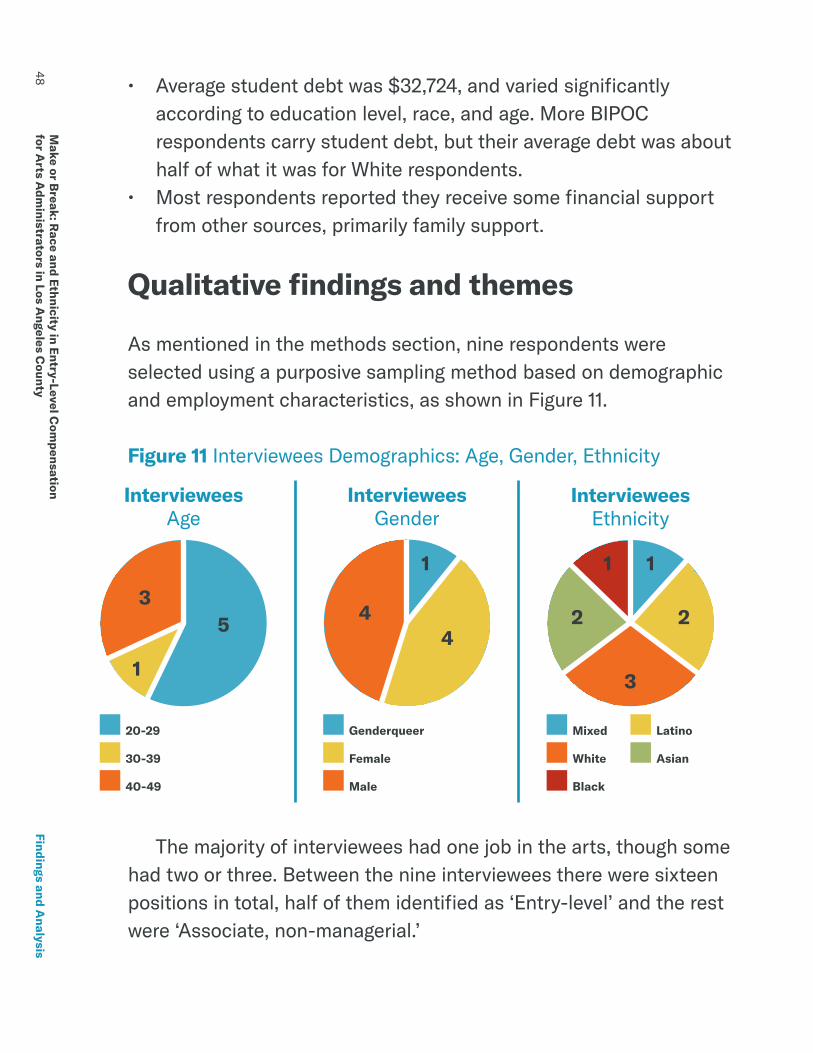
As mentioned in the methods section, nine respondents were selected using a purposive sampling method based on demographic and employment characteristics, as shown in Figure 11.
Findings an
d An
alysis
Figure 11 Interviewees Demographics: Age, Gender, Ethnicity
IntervieweesAge
35
1
IntervieweesGender
IntervieweesEthnicity
20-29 Mixed LatinoGenderqueer
30-39 White AsianFemale
40-49 BlackMale
The majority of interviewees had one job in the arts, though some had two or three. Between the nine interviewees there were sixteen positions in total, half of them identified as ‘Entry-level’ and the rest were ‘Associate, non-managerial.’
44
1 1
3
2
1
2

Make or B
reak: Race an
d Eth
nicity in En
try-Level Com
pen
sation for A
rts Adm
inistrators in Los Angeles C
ounty
49Fin
dings and A
nalysis
Figure 12 Interviewees: Number of Jobs, Type of Employer
IntervieweesNumber of Jobs
IntervieweesType of Employer
One job
Two jobs
Three jobs
Government Private foundation
Nonprofit For-profit
Education
Theme 1: Arts administrators’ experience of their earnings
Arts administrators say their earnings are too low for the cost of living in Los Angeles.89 To make ends meet, arts administrators rely on working outside of the arts, working overtime, or cutting back to reduce their living costs. Some may choose to live far from their work location, where the cost of housing can be significantly lower, though this adds to commute time and cost. Despite this, arts administrators feel living and working in Los Angeles is beneficial and worthwhile for their career. Arts administrators feel frustrated their earnings do not reflect their education, and their earnings are not adequate to cover the student debt they incurred to get the education required. “I could not survive in Los Angeles today on my salary alone” one interviewee said. Another said, “This is impossible, to live [in LA] on $13 an hour.”
2
5 6
2
2
3
3
1

Make or B
reak: Race an
d Eth
nicity in En
try-Level Com
pen
sation for A
rts Adm
inistrators in Los Angeles C
ounty
50Fin
dings and A
nalysis
Interviewees shared different solutions they found to make ends meet. For example: “At some point I was able to cover full-time work in other departments [within the organization] even though my job was technically part-time, so I could let go of my retail job. That allowed me to test drive different positions and departments which helped me get [my current full-time job].” Even while working full-time in the arts, more than one interviewee needed to work overtime, exceeding 40 hours a week. “I do make a fairly significant amount of overtime,” one explained, “about an additional $2,000 [a year] over my base pay.” This additional income afforded this person little financial security or freedom. The total is “Just enough for me to live the lifestyle I currently live,” covering living expenses, student loan payments, and a small savings. “I would say that if I choose to have a family one day it’s not enough money. I’d need to make two to three times more.” Another interviewee, who holds three part-time positions in the arts and often worked overtime, decided to reduce working hours and reduce living expenses “I realized I can’t sustain [working more than 40 hours a week] so I’m currently with a roommate, cutting the bills.” This decision left him feeling “A little bit like going backward” in his career and living arrangement. Nonetheless, arts administrators said that living in Los Angeles is necessary for their careers. One interviewee who moved here with her partner after completing her master’s degree said, “It’s not considered weird to be an artistic or creative person, because people do make livings here off of that. That potential was so enticing to us that the fact we would have to pay more in rent, all those things mattered less. If you really want to do something creative with your life [Los Angeles] has a lot more opportunities to do so, especially if you’re at the beginning of your career.” Arts administration jobs are concentrated in some of the most high-cost parts of the county. Arts administrators looking to reduce

Make or B
reak: Race an
d Eth
nicity in En
try-Level Com
pen
sation for A
rts Adm
inistrators in Los Angeles C
ounty
51Fin
dings and A
nalysis
their cost of living are often unable to afford living in these areas. An interviewee that moved in with their parents in northern LA County shared, “I don’t want to commute for three and a half hours a day spending $400 to $500 on gas. There are jobs in LA right now I could possibly apply for, but I cannot afford to live in LA. They want to pay me like $32,000 to $34,000 a year. Right now, I cannot accept that. I have financial responsibilities because I’m older, and there’s the commute. I just couldn’t see myself applying for anything under $45,000.” Arts administrators also feel their earnings are inadequate considering their education and student debt. One interviewee who maintains a longtime artistic practice, majored in economics, graduated with honors, and is completing a master’s degree in arts administration said, “I don't think my per hour worth is $15 an hour. I don't need to make a million dollars an hour, but at the same time I feel like my worth dictates a higher rate. And that does affect me on a psychological level.” Another respondent put it this way: “I was hired for my position because of my master’s degree, and I have related student debt. However, I am not able to afford my loan payments with my current salary.” Another said, “What you have to pay to get an arts degree doesn’t match the expected wages that you’ll receive. I have more debt than I have in assets.” A third interviewee looked back at a moment in her career when she had thoughts of leaving the arts: “It was really heartbreaking. I’d been out of grad school for 18 years and I was still not even done paying off the loans, and here I was about to leave the field altogether.” One solution for heavy student loans is available, but may be challenging for many arts administrators to access. “I was lucky to be able to enroll in the public service loan forgiveness program as soon as I got [my full-time job]. That program is a huge benefit, to be able to have your loans cancelled after ten years. But it doesn’t give you

Make or B
reak: Race an
d Eth
nicity in En
try-Level Com
pen
sation for A
rts Adm
inistrators in Los Angeles C
ounty
52Fin
dings and A
nalysis
the flexibility to have two part-time jobs. There were [part-time] jobs in the museum or arts education fields I would have loved to have worked but I couldn’t. I had to have one job in one organization full-time. That made me a little stuck.”
Theme 2: Arts administrators’ experience of their quality of life
Precarity in their career makes arts administrators question their ability to grow personally and professionally. Low earnings also reduce arts administrators’ sense of self-worth. Arts administrators who work part-time and don’t have health benefits feel even more insecure and compromised by their employers. Stability is a combination of things—a consistent workload, predictable income, and a possible future and career trajectory. Lack of stability impacts arts administrators’ lives. An interviewee described how they felt when they were working part time and said they were severely underpaid, “That time period was really bad for me in terms of my productivity inside work and outside. I wasn’t really enjoying life. Is this how it’s going to be in the art world for the rest of my life?” This changed drastically once they transitioned to a well-paid full-time job: “I feel more comfortable now. I have my own apartment. I’m able to pay off my student loans because of this position. Am I a little tight on money? Perhaps. I don’t know if I’m able to thrive off my salary now but I’m happy with where I am.” Arts administrators often have to “wait it out” until a stable opportunity comes their way. “I think endurance is definitely a part of it, it’s a degree of how much you can endure this wage,” one interviewee said. Low earnings in entry-level positions “Doesn’t give you enough stability for you to look into the future. Most of us make below living wage and when there’s a life struggle, thinking about
Make or B
reak: Race an
d Eth
nicity in En
try-Level Com
pen
sation for A
rts Adm
inistrators in Los Angeles C
ounty
53Fin
dings and A
nalysis
what’s next seems kind of hard, and not as urgent as paying your bills, or, you know, lunch.” Another interviewee told her story: “I come from an immigrant, working class family, and am a first-generation college graduate. I terminated a pregnancy in my 30s because I hadn’t been able to find a job with full insurance coverage nor make enough income to raise a family. I love working in the arts and made sacrifices for it. But those sacrifices will always undermine my professional success.” Working in the arts on a low hourly rate, another said, “Kind of clamps my ego a little, but at least I’m working in an arts facility.” An interviewee holding down three part-time jobs said, “Part time employees don't get health benefits usually, so that's something that we need to figure out.” A survey respondent wrote, “The organization I work at deliberately hires part-time workers to split the jobs of the role in order not to give benefits to many workers.” Another interviewee who is compensated in a deliverable-based contract talked about the impact on her health: “I don't have particularly good health care [which] hindered my ability to get treatments for things that I might need.”
Theme 3: The role of family support in arts administrators’ careers
In order to make ends meet and fund their living costs, arts administrators often rely on financial support from family, namely their parents. In effect, this creates a professional advantage for arts administrators whose families can provide this kind of financial support, helping to shape their career trajectory. An interviewee in her 40s who said she relies on substantial support from her parents and grandparents for her own family’s living expenses shares how this lack of stability and independence
Make or B
reak: Race an
d Eth
nicity in En
try-Level Com
pen
sation for A
rts Adm
inistrators in Los Angeles C
ounty
54Fin
dings and A
nalysis
comes at a difficult price. “I am still scraping and saving and filling out financial aid applications for everything my kids want to do. I have accepted that I’m always going to be the poor one in the crowd because I work for a nonprofit, because I’m in the arts.” Another interviewee in her 30s talked about the help she gets from her parents to make ends meet: “While I was in the corporate sector, I did not receive financial assistance. Since I’ve moved back into the arts, I’ve had a small amount of financial assistance each month because the cost of living here is ridiculous and the salaries are not commensurate with experience.” An interviewee in his 20s said, “My family sometimes sent me money when I didn't have enough hours or jobs. So yeah, that's definitely really helpful and I'm privileged in that sense that I could even have that. Though, my family can only support me so much. Sometimes I would be short on rent and I just had to ask.” Coming from a wealthy family provides a sense of security in an otherwise precarious line on work. As one interviewee said, “I’m very fortunate, I come from a fairly well-off family, so it would have to take a pretty catastrophic thing for me not to be able to pursue the arts because I have a little bit of a cushion.” Another said, “Basically, I don’t have any expenses. I’ve never had to struggle in terms of ‘Oh am I making enough money?’ [My parents] have given me the flexibility to truly make the best decisions for myself.”
Theme 4: Earnings, debt, and race and ethnicity
Interviewees were not surprised that the survey found earnings disparities between BIPOC and White arts administrators. However, they were extremely surprised to learn how large the earnings gap was. “That’s the difference between how many roommates you have,

Make or B
reak: Race an
d Eth
nicity in En
try-Level Com
pen
sation for A
rts Adm
inistrators in Los Angeles C
ounty
55Fin
dings and A
nalysis
what part of the city you live in. Twenty minutes from your job or 40 minutes,” said one. Some interviewees saw this gap as the result of the power imbalance between predominantly White employers and BIPOC applicants. One BIPOC respondent said, “There's a constant feeling of not having enough leverage to negotiate the pay because if you already know that a lot of folks that are getting hired for that job are White people and you're BIPOC it's pretty natural that you are more cautious about how you navigate that space.” A White interviewee added, “When I look back on my career and where it started, I certainly didn't know enough about negotiating and pushing for a higher salary compared to what I know now. I’m sure that's even more true for people of color. Even if they try to negotiate, they're not necessarily going to get the same kind of response.” In terms of student debt, more BIPOC respondents carry student debt, but their average debt was about half of what it was for White respondents. Some interviewees ascribed this to different access to education. “I carry a large amount of student debt, but it's because I went to USC. USC is not a cheap school. Whereas if I did a master's degree at a state school it might be cheaper. I’m wondering if there's a correlation between where people are choosing to get their education from and access to some of the more elite institutions.” As for other sources of debt, overall, more BIPOC respondents had transportation and credit card debt, while more White respondents had health-related debt. Interviewees saw this in different ways, but both White and BIPOC interviewees shared one consistent observation about transportation, summarized by the person who said, “I think financially comfortable White America doesn't consider enough that reliable transportation is a huge barrier for people.” Another said, “In almost all [arts] positions you're expected to be a part of the art community, and in LA that means going to different events and premieres and workshops and panels and it's really hard

Make or B
reak: Race an
d Eth
nicity in En
try-Level Com
pen
sation for A
rts Adm
inistrators in Los Angeles C
ounty
56Fin
dings and A
nalysis
to do that without a car. So, it doesn't surprise me that transportation is a big expense.” One BIPOC interviewee, in describing her experience with credit card debt, said, “I believe it's because [BIPOC people] want to try to be equals to all. If you get a job you need to look the part and that requires shopping. I think it's just a culture of living beyond your means and I learned this the very hard way in my 20s and 30s being in high, high credit card debt, in fact having to file for bankruptcy.” Wealth translates into opportunity, and entry-level arts administrators are aware of this. An American-born interviewee whose parents immigrated from Mexico said, “The fact that my parents moved from working low-income class to a more middle stable class, having financial capital to support my [educational] trips, was ultimately really what helped.” White interviewees made the same observation. “How can we expect people from diverse backgrounds to go into a career field where they’re not going to be able to support themselves? I am so privileged that I have generations of wealth behind me. That shouldn’t be what it takes.”
Theme 5: BIPOC arts administrators’ experience in the workforce
“Many people who work in entry-level positions rely on support whether it’s familial or spousal or something else. It can impact the makeup of an organization, the diversity of an organization. It precludes individuals who don’t have that support,” one interviewee said. The visibility of other arts administrators who are BIPOC in an arts organization can play out in different ways. An interviewee who is BIPOC said, “We don’t see ourselves represented or if we do, we’re

Make or B
reak: Race an
d Eth
nicity in En
try-Level Com
pen
sation for A
rts Adm
inistrators in Los Angeles C
ounty
57Fin
dings and A
nalysis
exploited. We begin to doubt ourselves—were we hired because of our skills or because of our social identity to fill a quota?” Another interviewee said, “I really noticed while working for these institutions [that] a lot of full-time or stable or administrative office jobs are allocated to White people, definitely. I see in [my place of work] a lot of the floor staff being POC, the majority of them. As you move up, people within institutions that make the decisions, they are mostly White and male.” Another said, “It’s critical that we integrate the roles and the spaces and get over this divide of people of color working the front of the house and White people working back of the house, this idea that people of color have the hourly insecure jobs of interacting with the public while White people have the jobs with offices and intellectual growth. That is really disturbing and it's highly problematic for the field as a whole. I don't think we get to pride ourselves on any sense of diversity if people of color are only getting hourly wage jobs, that just doesn’t cut it. Why aren't they being respected for their intellectual contributions and really being part of the conversation of art and artists?” Another interviewee put it this way: “Equity can’t be achieved on [the entry] level if it’s not achieved on a higher, senior, executive level, and that’s what’s really missing within our community in Los Angeles.” Transparency in terms of earnings and benefits as well as working conditions is also an important component of the experience of BIPOC arts administrators. “As people of color, we want to know more about the culture of a place before we join it,” one interviewee said. “The hardest thing is when you are a person of color and especially entry-level, you’re so eager to get work that you enter into a situation that you don't fully understand. You could be the only person that even looks like you there, or you don't even know if you’re being paid fairly or equivalent to the person that might have the same education experience as you.”

Make or B
reak: Race an
d Eth
nicity in En
try-Level Com
pen
sation for A
rts Adm
inistrators in Los Angeles C
ounty
58Fin
dings and A
nalysis
Another interviewee said, “People should know more about what they’re getting themselves into. There's too much mystery and power that organizations hold over applicants in a way that I think isn’t fair.” When asked about the type of support they received along their career path, most interviewees’ first response was to talk about mentorship. One said, “The first mentor of mine, she was the right person to introduce me to this whole career path because she understood what it meant to work in the arts.” For some, lack of diversity in senior and executive staff can mean a lack of mentors for building an arts administration career. One interviewee said responsibility for promoting diversity throughout the career pipeline should not fall solely on the arts organizations themselves. “Whoever is helping fund organizations or support them should work with the board of an organization, with the executives, with senior staff to make sure that there are incentives for them to be rethinking about how they recruit and work with people of color.”
Summary of qualitative findings
Through interviews with a small subset of people who took the survey we discovered how entry level arts administrators experience earnings that are too low for the cost of living in LA County. They work overtime or find ways to reduce their expenses in order to cover everything, including student debt payments. Their career path feels precarious and affects their sense of self-worth. Many question whether they should continue in the field. In hard times, many turn to family for support, which gives a long-term career advantage to those whose families hold greater wealth. The experiences of entry-level BIPOC arts administrators are different from those of their White colleagues, and both groups express awareness of it. The difference in earnings is seen by
Make or B
reak: Race an
d Eth
nicity in En
try-Level Com
pen
sation for A
rts Adm
inistrators in Los Angeles C
ounty
59Fin
dings and A
nalysis
some as result of a power imbalance between predominantly White employers and BIPOC employees or job applicants. Lower amounts of student debt carried by BIPOC arts administrators is seen as additional proof that they have less access to education that could secure greater earnings and career opportunities. Visibility of BIPOC arts administrators, especially in leadership roles, is seen as a critical. Transparency of compensation, benefits, and working conditions including workplace diversity is needed for both accountability and to help people looking for jobs make informed decisions about where they do and do not want to work.


Make or B
reak: Race an
d Eth
nicity in En
try-Level Com
pen
sation for A
rts Adm
inistrators in Los Angeles C
ounty
61
Conclusions and Recommendations“If museums, performing arts centers, and other nonprofit arts organizations are serious about diversity, equity, and inclusion, then they will pay all of their staff a living wage.”—Survey respondent
As arts nonprofits fight to survive the financial storm of the COVID-19 crisis, many are looking ahead to a “new normal” that will likely be a hybrid of in-person and virtual, touchless, financed by new revenue streams, and more centered on meeting community needs than ever before. This is an opportunity to reflect on mission and purpose. Arts and culture can be part of rebuilding both social cohesion and the local economy, but the sector will fail if compensation structures for their workforce continue to function as barriers for the majority of the people who live in the region. The ten million people who call LA County home make it one of the most diverse regions of the US. Three-quarters of residents are BIPOC and more than half speak a language other than English at home. What is needed to ensure they have equitable opportunity to enter into and thrive in a career in arts administration? Taking on additional arts administration jobs does not appear to increase total earnings. Outside support from family and non-arts work turn out to be more common ways entry-level arts administrators supplement compensation from arts administration work. Several interviewees, both BIPOC and White, articulated lack of family money as effectively a race-based barrier to working in arts administration. Despite the challenges, though, entry-level arts

Make or B
reak: Race an
d Eth
nicity in En
try-Level Com
pen
sation for A
rts Adm
inistrators in Los Angeles C
ounty
62C
onclusions an
d Recom
men
dations
administrators believe it is worth it to figure out how to live and work in this field in a place rich with arts and culture opportunities like Los Angeles County. For those entry-level arts administrators who cannot rely on financial support from parents, working overtime or reducing costs by living farther from work, or living with roommates, or waiting to start a family are seen as sacrifices that reduce their quality of life. They worry about the sustainability of consistently working more than 40 hours each week and its impact on their careers and personal lives. The impact of low earnings of entry-level arts administrators in LA County is compounded by student and other kinds of debt. The ability to pay student loans was a common concern among interviewees. They see it as a measure of their own progress and success, feeling confident when they are able to reduce their debt, and unhappy when unable to. Before COVID-19, transportation-related debt was found to particularly burden BIPOC arts administrators, as mobility was necessary for meeting basic job requirements in arts and culture. In sum, the early years of an arts administration career are precarious for all, but especially for those from BIPOC communities. The experiences of BIPOC entry-level arts administrators are different from that of their White counterparts. They earn less and more often carry debt, though their average debt is lower. This is interrelated to the fact that they tend to have less education than their White entry-level arts administrators. They are more likely to take on second and third jobs in the arts that, the data show, do not necessarily translate into significantly higher overall earnings. Los Angeles County is one of the most vibrant arts and culture centers in the US, at the forefront of the national creative economy and is a rapidly growing global cultural center. Entry-level work in arts administration, as this study has found, means low compensation, high levels of debt, and challenges to quality of life. The challenges
Make or B
reak: Race an
d Eth
nicity in En
try-Level Com
pen
sation for A
rts Adm
inistrators in Los Angeles C
ounty
63
are even greater for people from BIPOC communities who want to make careers in the arts. One important step toward improving diversity, equity, and inclusion in the arts is to ensure that entry-level work in arts administration pays enough to not just make ends meet but to also pay off student debt, save for the future, and plan for a long-term career. Transparency in compensation is necessary to show earnings levels for all workers and the disparity between BIPOC and White arts administrators, so both can be addressed. It also offers the opportunity for arts administrators to advocate for their self-worth and negotiate their compensation based on factual information. Transparency about the demographic makeup of staff and board members is also critical. Job applicants should know before starting a job if they will be the only team member who is BIPOC. Another important step to take is to increase BIPOC representation at all levels of arts organizations, including the highest levels of staff and board members. Many of the recommendations below were offered by the people we interviewed, while others are suggested by the findings.
Recommendations for organizations employing entry-level arts administrators
• Raise entry-level compensation to reflect the true cost of living in LA County, including costs associated with job requirements, such as education, experience, and mobility
• Provide health and retirement benefits to all staff, including part-time staff
• Eliminate unpaid internships while expanding paid internships, apprenticeships, and other paid on-the-job training opportunities
Con
clusions and R
ecomm
end
ations

Make or B
reak: Race an
d Eth
nicity in En
try-Level Com
pen
sation for A
rts Adm
inistrators in Los Angeles C
ounty
64
• Reevaluate job requirements for entry-level positions, especially for education, experience, and mobility, and eliminate those that are not relevant to job-specific tasks
• Conduct a demographic analysis of salaries, contracts, fees, and other payments to all people who do work on your behalf to determine whether certain groups may be experiencing lower pay than others
• Explore how pay for staff, contractors, artists, volunteers, and others may affect your organization’s ability to achieve its mission and DEI goals, and discuss the implications for fundraising with your board and funders
• Be publicly transparent about the demographic makeup of your organization’s staff and leadership
• Disclose the actual compensation range in job listings, rather than making statements such as “salary is commensurate with experience”
• Explore how your organization can support debt relief for your staff and advocate for expansion of student debt relief programs
• Examine your recruitment practices to ensure they are generating qualified BIPOC candidates
Recommendations for arts funders
• Implement recommendations from the Full Cost Project,90 a partnership between the Nonprofit Finance Fund and Philanthropy California, to ensure the arts nonprofits you fund have the resources they need to pay the full cost of employment
• Work with grantees to ensure they can pay a living wage to employees working on projects you fund
• Incorporate pay equity into grantee requirements for diversity, equity, and inclusion
Con
clusions and R
ecomm
end
ations

Make or B
reak: Race an
d Eth
nicity in En
try-Level Com
pen
sation for A
rts Adm
inistrators in Los Angeles C
ounty
65
• Fund research on the relationship between pay and equity in the nonprofit arts sector
• Require grantees to make public demographic data about their workforce including leadership and board members
Arts leaders often quote the statistics that one in every seven jobs in LA County are generated by the creative industries, and that more than 400,000 people in the county work directly in those industries. By digging deep into one corner of those large numbers, this study revealed troubling differences between BIPOC arts administrators and their White counterparts. The findings presented here offer a starting point for action and change. They suggest specific places where arts organizations and their funders can take responsibility for that change, looking inward at their own workforce and practices while also taking collective action with others.
Con
clusions and R
ecomm
end
ations


Make or B
reak: Race an
d Eth
nicity in En
try-Level Com
pen
sation for A
rts Adm
inistrators in Los Angeles C
ounty
67
Appendix A: Survey InstrumentHello, and thank you for completing this survey. The purpose of this study is to learn about the earnings of entry level arts administrators in LA County and explore how they relate to diversity, equity, and inclusion in the arts and culture workforce. We appreciate the time you’re taking to share your responses. You are not required to provide any information that would personally identify you. All results from this survey will be compiled and reported in the aggregate. The data collected will not be shared outside of the Research and Evaluation division at the LA County Department of Arts and Culture. This survey is the first phase in a larger study. In the second phase, we will interview entry level arts administrators to find out how they make ends meet. If you wish to participate in that phase, you will have an opportunity to provide contact information at the end of the survey. If you have any questions, please contact Cobi Krieger, Research and Evaluation consultant for the LA County Department of Arts and Culture, at [email address redacted].
Q1. Are you currently working as an arts administrator in LA County?“Working” includes full- and part-time employment, internships and apprenticeships, freelance, and contract work. It also includes substantial volunteer work that is critical to the functioning of the organization.

Make or B
reak: Race an
d Eth
nicity in En
try-Level Com
pen
sation for A
rts Adm
inistrators in Los Angeles C
ounty
68
An “arts administrator” is anyone working for an arts nonprofit, government arts agency, or in a private sector arts company that provides direct services to the public, such as galleries and private theaters.• Yes• No
Q2. How many paid jobs do you currently have in the arts and culture workforce in LA County?If you are employed by multiple organizations as a freelancer, report that as a single job.• One• Two• Three• More than three
The next section asks about your main or primary job as an arts administrator in LA County. If you have more than one arts administrator job, you will have an opportunity to provide information about up to three jobs. If you have more than three, please choose the three that give you the highest earnings.
Q3. For your main or primary arts administrator job in LA County, what is your position title?
Q4. Which of the following categories best describes your position level?• Entry Level• Associate (Non-Manager)• Manager• Executive• Senior Executive
Ap
pen
dix A: S
urvey Instrument

Make or B
reak: Race an
d Eth
nicity in En
try-Level Com
pen
sation for A
rts Adm
inistrators in Los Angeles C
ounty
69
Q5. Is your position• Permanent / Regular employee• Temporary employee• Intern• Apprentice• Freelancer/consultant/contractor• Other – Please specify
Q6. What type of organization is this employer?• Nonprofit• Government• For profit• Private foundation• Other – please specify
Q7. About how many hours do you actually work each week in this position?Please respond in numbers.
Q8. How are you compensated?• Annual salary• Hourly wage• Contract based on hours• Contract based on deliverables• Stipend• Unpaid• Other – please specify
Q9. What is your total pay before taxes each month for this position? If this changes from month to month, please provide an average. Report only your income from this job. In a later section we will ask you about your total income from all employment.
Ap
pen
dix A: S
urvey Instrument
Make or B
reak: Race an
d Eth
nicity in En
try-Level Com
pen
sation for A
rts Adm
inistrators in Los Angeles C
ounty
70
Q10. Considering the cost of living in LA County, are your earnings• More than enough to cover your costs• Just enough to cover your costs• Almost enough to cover your costs• Not nearly enough to cover your costs• Other – please specify
Q11. In this position, have you ever been asked to do work beyond what you are compensated for?• Yes• No• Not sure
Q12. Do you have another job in the LA County arts and culture workforce? • Yes • No • Q 3-11 repeat for second and third positions, based on the answer to Q2
Q13. What is your highest level of education attained (not including current studies)? • Less than high school • High school • Associate’s degree • Bachelor’s degree • Master’s degree • Professional degree • Doctorate
Ap
pen
dix A: S
urvey Instrument
Make or B
reak: Race an
d Eth
nicity in En
try-Level Com
pen
sation for A
rts Adm
inistrators in Los Angeles C
ounty
71
Q14. Are you currently in school? • Yes • No
Q15. What was your field of study for your highest degree attained (not including current studies)? • Arts and Humanities • Business • Health and Medicine • Multi/Interdisciplinary Studies • Public and Social Services • Science, Math, and Technology • Social Sciences • Trades and Professional Services • Other (please describe)
Q16. How much student debt do you currently owe? [OPEN ENDED]
Q17. Do you carry debt for any of the following? Check all that apply • Housing • Transportation • Business • Health • Other (please describe)
Q18. Have you ever considered leaving arts administration specifically because of low compensation? • Yes • No
Ap
pen
dix A: S
urvey Instrument

Make or B
reak: Race an
d Eth
nicity in En
try-Level Com
pen
sation for A
rts Adm
inistrators in Los Angeles C
ounty
72
Q19. What is your total annual income from all employment? [OPEN ENDED]
Q20. Do you have other income from any of the following sources? • Employment outside of the arts • Scholarships, fellowships, or grants • Business income (including crowdfunding) • Interest income or investment dividends • Rental income • Inheritance • Family support other than inheritance • Other (please describe)
Demographic Questions
Q21. How old are you (by decade):• Younger than 20• 20-29• 30-39• 40-49• 50-59• 60-69• 70-79• 80+• Decline to state
Ap
pen
dix A: S
urvey Instrument
Make or B
reak: Race an
d Eth
nicity in En
try-Level Com
pen
sation for A
rts Adm
inistrators in Los Angeles C
ounty
73
Q22. Using US Census definitions, which of these best describes your ethnic background?• Hispanic or Latino• Native American• Black or African American • White• Asian or Pacific Islander• Mixed Ethnicity • Decline to state• Other – please specify
Q23. In your own words, how do you describe your ethnic background or cultural identity?
Q24. What is your gender?• Female• Male• Trans male/ trans man• Trans female/ trans woman• Genderqueer/ gender non-conforming• Decline to state• Different identity – please state
Q25. Do you consider yourself to be:• Heterosexual or straight• Gay or lesbian • Bisexual• Decline to state
Ap
pen
dix A: S
urvey Instrument
Make or B
reak: Race an
d Eth
nicity in En
try-Level Com
pen
sation for A
rts Adm
inistrators in Los Angeles C
ounty
74
Q26. Do you identify as a person with disability?• Yes• No• Decline to state
Q27. What is the zip code where you live?
Q28. How many adults live in your house including you?
Q29. How many children live in your household?
Q30. Is there anything else you would like to tell us about earnings in the LA County Arts and Culture workforce? [OPEN-ENDED]
In the second phase of this study we will conduct interviews with some respondents to learn more about how you make ends meet as an entry-level arts administrator in LA County. If you would like to be considered for an interview, please provide the following information:
Would you like to be considered for an interview?• Yes• No
Interview contact information• First and last name • Best phone number to reach you• Best email to reach you
Ap
pen
dix A: S
urvey Instrument

Make or B
reak: Race an
d Eth
nicity in En
try-Level Com
pen
sation for A
rts Adm
inistrators in Los Angeles C
ounty
75
Thank you very much for completing this survey and contributing to the Entry Level Wages in LA County Arts Organizations study. Please share this survey with any colleagues who work in arts administration in LA County, so we can receive responses from a wide and diverse group.
Thank you!
Ap
pen
dix A: S
urvey Instrument

Make or B
reak: Race an
d Eth
nicity in En
try-Level Com
pen
sation for A
rts Adm
inistrators in Los Angeles C
ounty
77
Appendix B: First Interview ProtocolEntry Level Wages in the Arts Study
Phase 2 Interview Protocol
I’m Cobi Krieger, a research consultant working on a project with the LA County Department of Arts and Culture. As you know, we’re conducting a study about entry level wages in LA arts organizations. The purpose of this study is to understand how entry level wages impact diversity, equity, and inclusion in the field. The way this works is that I have a series of questions I’ll ask you. We are interviewing between ten and 20 people for this study, and for the most part we are asking all of you the same questions. I also have specific questions for you based on your responses on the survey. When we write our report, we will analyze the data from everyone we interview anonymously and will report on it in the aggregate without naming names. If I ask a question that you don’t want to answer, you don’t have to answer it. If you need to stop the interview early before we’re done, just let me know and we’ll stop. Nothing you say here, or your participation in the study, will have any impact on your relationship with the Department of Arts and Culture. I’ll take notes, but in order to make sure I get everything right I’d like to audio record our interview. Would that be okay?
[If yes, turn on recorder. If not, then don’t. Continue with the interview.]
Make or B
reak: Race an
d Eth
nicity in En
try-Level Com
pen
sation for A
rts Adm
inistrators in Los Angeles C
ounty
78
Do you have any questions for me before we get started?
1 Tell me about your current work in the arts in LA County, and your career path leading to it. (Possible prompt questions) A Where do you work now?
B Where and what did you study? C How did you get your first job? and the next? D Have you ever done unpaid work in the arts?
2 What specific skills or personal attributes do you have that have helped you move along the career path you’ve described?
3 What kinds of help or support have you gotten along the way? (Prompts)
A Professional mentors B Family members C Financial resources D Volunteer work or internships
4 What kinds of critical junctures or decision points have you made in your career so far? Describe what happened and how you made the decisions you did. (Prompts)
A Has there ever been a moment when you considered leaving the arts? Or not going into them? B If yes, why?
5 How have the pay you’ve earned affected your ability move in your career path in the way you want? Are there ways your earnings have helped? Are there ways your earnings have hindered you?
Ap
pen
dix B: First In
terview P
rotocol

Make or B
reak: Race an
d Eth
nicity in En
try-Level Com
pen
sation for A
rts Adm
inistrators in Los Angeles C
ounty
79
6 Specifically, for people like you (however you chose to identify), do you think entry level wages affect your ability to get ahead in your career in the arts?
A If yes, how and why? B If no, how and why not?
7 From your perspective, how do you see entry level wages affecting diversity, equity, and inclusion in the arts workforce in LA County?
8 [ADD QUESTIONS SPECIFIC TO THIS INDIVIDUAL HERE]
Ap
pen
dix B: First In
terview P
rotocol


Make or B
reak: Race an
d Eth
nicity in En
try-Level Com
pen
sation for A
rts Adm
inistrators in Los Angeles C
ounty
81
Appendix C: Second Interview ProtocolThank you for participating in this follow-up interview. As I told you in the last interview, when we write our report, we will analyze the data from everyone we interview anonymously and will report on it in the aggregate without naming names. If I ask a question that you don’t want to answer, you don’t have to answer it. If you need to stop the interview early before we’re done, just let me know and we’ll stop. Nothing you say here, or your participation in the study, will have any impact on your relationship with the Department of Arts and Culture. I’ll take notes, but in order to make sure I get everything right I’d like to audio record our interview. Would that be okay?
[If yes, turn on recorder. If not, then don’t. Continue with the interview.]
We have four key findings from the study about the differences between entry level arts administrators who are BIPOC compared to those who are White, and I want to hear your thoughts. I’m sharing this information with you confidentially, so can please don’t share this information with anyone else before this study is published. Okay? [wait until they affirm verbally]

Make or B
reak: Race an
d Eth
nicity in En
try-Level Com
pen
sation for A
rts Adm
inistrators in Los Angeles C
ounty
82
• First, we learned that White respondents had average annual earnings about one-third higher than BIPOC respondents
• We also found that more BIPOC respondents carry student debt, but their average debt was about half what it was for White respondents
• When it comes to other kinds of debt, overall more BIPOC respondents had transportation debt and credit card debt, while more White respondents had health-related debt.
• We also asked a question on the survey about where you get outside support to help you make ends meet. We found that more BIPOC respondents get family support, while more White respondents have other jobs outside the arts.
1 How does all this compare to your personal experiences working as an entry level arts administrator?
2 What do you think we can do as a field to improve this situation?
Ap
pen
dix C: S
econd In
terview P
rotocol

Make or B
reak: Race an
d Eth
nicity in En
try-Level Com
pen
sation for A
rts Adm
inistrators in Los Angeles C
ounty
84
Endnotes1 “Become an Arts Administrator:
Careers: The College Board,” 2020. https://bigfuture.collegeboard.org/careers/management-arts-administrators.
2 Association of Arts Administration Educators. “About Arts Administration.” Association of Arts Administration Educators. Association of Arts Administration Educators, 2020. https://member.artsadministration.org/page/about-arts-administration.
3 Rosewall, Ellen. “Chapter 1 What Is Arts Management.” Essay. In Arts Management: Uniting Arts and Audiences in the 21st Century, 4–5. London: Oxford University Press, 2014.
4 “Standard Occupational Classification.” U.S. Bureau of Labor Statistics. U.S. Bureau of Labor Statistics, 2018. https://www.bls.gov/soc/.
5 NAICS & SIC Identification Tools. The North American Industry Classification System, 2018. https://www.naics.com/search.
6 Beacon Economics. 2021 Otis Report on the Creative Economy. The Otis College of Art and Design, February 25, 2021. https://www.otis.edu/creative-economy/2021.
7 The five industry sectors are: Architecture and Related Services, Creative Goods and Products, Entertainment and Digital Media, Fashion, and Fine and Performing Arts.
8 According to the Otis Report, the creative industries are comprised of workers with creative occupations, for example an actor, and workers with non-creative occupations that work within the creative industries, for example an accountant working for a theater.
9 Thomas P. Miller & Associates. Building Creative Career Pathways for Youth. The LA County Department of Arts and Culture, April 2019. https://www.lacountyartsedcollective.org/sites/lacaec/files/building_creative_career_pathways_for_youth_web.pdf.
10 $30,784 annually 11 $147,326 annually12 $50,939 annually13 $71,157 annually14 Full-time Equivalent Employee is all
full-time employees plus part-time employees converted to a full-time basis. For example, two part-time employees working half-time equal one FTE.

Make or B
reak: Race an
d Eth
nicity in En
try-Level Com
pen
sation for A
rts Adm
inistrators in Los Angeles C
ounty
85 19 Stax Inc. Association of Art Museum Directors 2019 Salary Survey. Association of Art Museum Directors, May 10, 2019. https://aamd.org/sites/default/files/document/AAMD_Salary%20Survey%202019_Final.pdf.
20 POWarts. POWarts Salary Survey 2019. POWarts, 2019. https://www.powarts.org/salarysurvey.
21 The Creative Independent. A Study on the Financial State of Visual Artists Today. The Creative Independent, 2018. https://tci-assets.s3.amazonaws.com/pdfs/artist-survey-report/artist-survey-report.pdf.
22 Jahoda, Susan, Blair Murphy, Vicky Virgin, and Caroline Woolard. Artists Report Back: A National Study on the Lives of Arts Graduates and Working Artists, 2014. http://bfamfaphd.com/wp-content/uploads/2016/05/BFAMFAPhD_ArtistsReportBack2014-10.pdf.
23 National Endowment for the Arts. Artists and Arts Workers in the United States Findings from the American Community Survey (2005-2009) and the Quarterly Census of Employment and Wages (2010). National Endowment for the Arts, October 2011. https://www.arts.gov/sites/default/files/105.pdf.
24 “Artist occupations” were defined as Architects; fine artists, art directors, and animators; designers; actors; producers and directors; dancers and choreographers; musicians; “other entertainers”; announcers; writers and authors; and photographers.
15 Mauldin, Bronwyn. Salaries in Arts Nonprofits in LA County. The LA County Department of Arts and Culture, May 15, 2014. https://www.lacountyarts.org/sites/default/files/documents/pdfs/lacacsalariesreportmay2014final.pdf.
16 Artists: Staff directly performing the mission of the organization such as artists, musicians and dancers. This may include conductors, curators, choreographers, etc., depending on the organization’s classification of these positions. Fundraising: Staff charged with soliciting grants and contributions of money and goods and services from potential donors. General: Staff not specifically associated with a particular program or fundraising activity, but which are necessary to the organization’s conduct of those activities and its existence. Program: Staff indirectly performing program- related activities such as program directors, coordinators, instructors, artistic directors, etc.
17 Cuyler, Antonio C. “An Exploratory Study of Demographic Diversity in the Arts Management Workforce.” In the authors’ possession.
18 The American Alliance of Museums and New Knowledge Organization Ltd. 2017 National Museum Salary Survey. The American Alliance of Museums and New Knowledge Organization Ltd, 2017. https://www.aam-us.org/programs/manage-your-career/national-museum-salary-survey/.
En
dnotes
Make or B
reak: Race an
d Eth
nicity in En
try-Level Com
pen
sation for A
rts Adm
inistrators in Los Angeles C
ounty
86 31 Cuyler, Antonio C. “An Exploratory Study of Demographic Diversity in the Arts Management Workforce.” GIA Reader26, no. 3 (October 2015). https://www.giarts.org/article/exploratory-study-demographic-diversity-arts-management-workforce.
32 U.S. Census Bureau. “U.S. Census Bureau QuickFacts: United States.” Census Bureau QuickFacts. U.S. Census Bureau, July 2019. https://www.census.gov/quickfacts/fact/table/US/PST045219.
33 From the study: “Local Arts Agencies promote, support, and develop the arts at a local level. They can differ in their names —arts council, arts commission, or department of cultural affairs —and in their form—within local government, a nonprofit, or a private community organization.”
34 Americans for the Arts. Local Arts Agency Salaries Fiscal Year 2018. Americans for the Arts, March 2019. https://www.americansforthearts.org/by-program/networks-and-councils/local-arts-network/facts-and-figures/local-arts-agency-salaries-2018.
35 American Alliance of Museums. 2017 National Museum Salary Survey.
36 National Endowment for the Arts. Artists and Other Cultural Workers.
37 National Endowment for the Arts. Artists and Arts Workers in the United States.
25 National Endowment for the Arts. Artists and Other Cultural Workers A Statistical Portrait. National Endowment for the Arts, April 2019. https://www.arts.gov/sites/default/files/Artists_and_Other_Cultural_Workers.pdf.
26 County of Los Angeles. L.A. County Minimum Wage Ordinance. County of Los Angeles, July 3, 2018. https://lacounty.gov/minimum-wage/.
27 Glasmeier, Amy K. “Living Wage Calculator.” Living Wage Calculator - Living Wage Calculation for Los Angeles County, California. The Massachusetts Institute of Technology, 2021. https://livingwage.mit.edu/counties/06037.
28 $19.35 per hour x 2,080 hours = $40,248 annually; $22.79 per hour x 2,080 hours = $47,403 annually.
29 U.S. Census Bureau. “U.S. Census Bureau QuickFacts: Los Angeles County, California.” Census Bureau QuickFacts. U.S. Census Bureau, July 2019. https://www.census.gov/quickfacts/losangelescountycalifornia.
30 “Arts + All Museums Salary Transparency 2019.” Google spreadsheet. Accessed January 29, 2021. https://docs.google.com/spreadsheets/d/14_cn3afoas7NhKvHWaFKqQGka ZS5rvL6DFxzGqXQa6o/html view?usp=sharing.
En
dnotes

Make or B
reak: Race an
d Eth
nicity in En
try-Level Com
pen
sation for A
rts Adm
inistrators in Los Angeles C
ounty
87 43 Carnegie Mellon University. School of Public Policy and Management - Student Financial Services - Division of Enrollment Services - Carnegie Mellon University. Carnegie Mellon University, 2020. https://www.cmu.edu/sfs/tuition/graduate/hc-ppm.html.
44 These programs require less the 40 credits and their suggested completion time ranges from two to four semesters.
45 University of Oregon. “Graduate Tuition & Fees.” Office of the Registrar. University of Oregon, 2020. https://registrar.uoregon.edu/costs/tuition-fees/graduate?term=202001.
46 The New School. “Tuition & Fees.” Tuition and Fees | Tuition, Fees and Billing. The New School, 2020. https://www.newschool.edu/tuition-fees-billing/current-tuition/.
47 According to the NCES report total price of attendance is “the total budget (attendance intensity-adjusted) at the institution for students who attended only one institution during the academic year. The budget includes housing, board, books and supplies, transportation, and personal expenses. Institutions typically use this value as a student’s budget for the purpose of awarding federal financial aid.”
38 National Center for Education Statistics. Trends in Student Loan Debt for Graduate School Completers. National Center for Education Statistics, May 2018. https://nces.ed.gov/programs/coe/indicator_tub.asp.
39 Skaggs, Rachel, Alexandre Frenette, Sally Gaskill, and Angie L Miller. Arts Alumni in Their Communities 2017 SNAAP Annual Report. Strategic National Arts Alumni Project, November 2017. http://snaap.indiana.edu/pdf/2017/SNAAP_Annual_Report_2017.pdf.
40 Frenette, Alexandre, Timothy J Dowd, Rachel Skaggs, and Trent Ryan. Careers in the Arts: Who Stays and Who Leaves? Strategic National Arts Alumni Project, 2020. http://snaap.indiana.edu/pdf/SNAAP_Special%20Report_Spring2020.pdf.
41 These programs require more than 40 academic credits, and their suggested completion time ranges from three to four semesters for full time students. Figures above are credit-based tuition only, not including any fees, for the entire degree, based on 2020-2021 academic year price estimates and / or credit cost.
42 Seattle University. “Student Financial Services.” Graduate Tuition, Fees and Charges. Seattle University, 2020. https://www.seattleu.edu/costs/graduate-tuition-fees-and-charges/.
En
dnotes

Make or B
reak: Race an
d Eth
nicity in En
try-Level Com
pen
sation for A
rts Adm
inistrators in Los Angeles C
ounty
88 54 Siebert, Sabina, and Fiona Wilson. “All Work and No Pay: Consequences of Unpaid Work in the Creative Industries.” Work, Employment and Society 27, no. 4 (August 2013): 711–21. https://doi.org/10.1177/0950017012474708.
55 Cullinane, Carl, and Rebecca Montacute. Rep. Pay as You Go? Internship Pay, Quality, and Access in the Graduate Jobs Market. The Sutton Trust, November 2018. https://www.suttontrust.com/wp-content/uploads/2019/12/Pay-As-You-Go-1.pdf.
56 “Association of Art Museum Directors Passes Resolution Urging Art Museums to Provide Paid Internships.” Press Releases & Statements. Association of Art Museum Directors, June 20, 2019. Association of Art Museum Directors. https://aamd.org/for-the-media/press-release/association-of-art-museum-directors-passes-resolution-urging-art-museums.
57 SMU DataArts. Los Angeles County Department of Arts and Culture 2019 Workforce Demographics Study Results. The LA County Department of Arts and Culture, October 2019. https://www.lacountyarts.org/sites/default/files/lacounty_2019_workforcedemographicsstudy_final.pdf.
58 Beacon Economics. 2019 Otis Report on the Creative Economy.
48 National Center for Education Statistics. Trends in Graduate Student Financing: Selected Years, 2003–04 to 2015–16. National Center for Education Statistics, September 2019. https://nces.ed.gov/pubs2019/2019485.pdf.
49 Crain, Andrew. Understanding the Impact of Unpaid Internships on College Student Career Development and Employment Outcomes. The NACE Foundation, December 2016. https://sites.sju.edu/careers/files/the-impact-of-unpaid-internships-on-career-development.pdf.
50 Mauldin, Bronwyn, Susannah Laramee Kidd, Jesse Ruskin, and Matthew Agustin. Cultural Equity and Inclusion Initiative Literature Review. The LA County Department of Arts and Culture, March 30, 2016. https://www.lacountyarts.org/sites/default/files/pdfs/ceii_litrev_final.pdf.
51 Miller, Building Career Pathways.52 Davies, Maurice. Rep. The
Tomorrow People: Entry to the Museum Workforce. Museums Association and the University of East Anglia, April 2007. https://www.museumsassociation.org/entrylevel.
53 Shade, Leslie Regan, and Jenna Jacobson. “Hungry for the Job: Gender, Unpaid Internships, and the Creative Industries.” The Sociological Review 63, no. 1_suppl (May 2015): 188–205. https://doi.org/10.1111/1467-954X.12249.E
ndn
otes

Make or B
reak: Race an
d Eth
nicity in En
try-Level Com
pen
sation for A
rts Adm
inistrators in Los Angeles C
ounty
89 65 The Getty Foundation. “Getty Marrow Undergraduate Internships.” Getty Marrow Undergraduate Internships (Getty Foundation). The Getty Foundation, 2019. https://www.getty.edu/foundation/initiatives/current/mui/index.html.
66 LA County Department of Arts and Culture. “About Arts Internship Program (for Students).” LA County Department of Arts and Culture Arts Internship Program. LA County Department of Arts and Culture, December 29, 2020. https://www.lacountyarts.org/opportunities/arts-internship-program-students/about-arts-internship-program-students.
67 The Getty Foundation. Getty Marrow Internship Program Impact Report. The Getty Foundation, December 2020. https://www.getty.edu/interns-2020/report/.
68 LA County Department of Arts and Culture, “Arts Internship Analysis,” unpublished.
69 U.S. Bureau of Labor Statistics. Labor Force Characteristics by Race and Ethnicity, 2018. U.S. Bureau of Labor Statistics, October 2019. https://www.bls.gov/opub/reports/race-and-ethnicity/2018/pdf/home.pdf.
70 Noël, Reginald A. Race, Economics, And Social Status. U.S. Bureau of Labor Statistics, May 2018. https://www.bls.gov/spotlight/2018/race-economics-and-social-status/pdf/race-economics-and-social-status.pdf.
59 SMU DataArts. New York City Department of Cultural Affairs Workforce Demographics Pilot Study Results. The New York City Department of Cultural Affairs, July 2019. https://www1.nyc.gov/assets/dcla/downloads/pdf/NYC%20DCLA%20Full%202018%20WfD%20Report%207-24-19.pdf.
60 Americans for the Arts. Local Arts Agency Salaries Fiscal Year 2018.
61 Cuyler. “An Exploratory Study of Demographic Diversity in the Arts Management Workforce.”
62 Parkinson, Andy, and Jamie Buttrick. Rep. Equality and Diversity within the Arts and Cultural Sector in England, 2013-16: Evidence Review. Arts Council England, November 13, 2018. https://www.artscouncil.org.uk/sites/default/files/download-file/Consilium_Equality_Diversity_report_13112018.docx_0.pdf.
63 Westermann, Mariët, Roger Schonfeld, and Liam Sweeney. Rep. Art Museum Staff Demographic Survey 2018. The Andrew W. Mellon Foundation, January 28, 2018. https://mellon.org/media/filer_public/b1/21/b1211ce7-5478-4a06-92df-3c88fa472446/sr-mellon-report-art-museum-staff-demographic-survey-01282019.pdf.
64 Ibid.
En
dnotes

Make or B
reak: Race an
d Eth
nicity in En
try-Level Com
pen
sation for A
rts Adm
inistrators in Los Angeles C
ounty
90 71 Lewis, Kristen, and Sarah Burd-Sharps. A Portrait of LA County: LA County Human Development Report 2017-2018. County of Los Angeles, November 29, 2017. https://ssrc-static.s3.amazonaws.com/moa/PoLA%20Full%20Report.pdf.
72 McKernan, Signe-Mary, Caroline Ratcliffe, Eugene Steuerle, and Sisi Zhang. Less Than Equal: Racial Disparities in Wealth Accumulation. The Urban Institute, April 25, 2013. https://www.urban.org/sites/default/files/publication/23536/412802-less-than-equal-racial-disparities-in-wealth-accumulation.pdf.
73 McKernan, Signe-Mary, Caroline Ratcliffe, Margaret Simms, and Sisi Zhang. Do Financial Support and Inheritance Contribute to the Racial Wealth Gap? The Urban Institute, September 6, 2012. https://www.urban.org/sites/default/files/publication/25766/412644-do-financial-support-and-inheritance-contribute-to-the-racial-wealth-gap-.pdf.
74 From the report: “The NASCC survey was developed to supplement existing national data sets that collect data on household wealth in the United States but rarely collect data that is disaggregated by specific national origin. The NASCC survey collects detailed data on assets and debts among subpopulations, according to race, ethnicity, and country of origin.”
75 De La Cruz-Viesca, Melany, Zhenxiang Chen, Paul M Ong, Darrick Hamilton, and William A. Darity. The Color of Wealth in Los Angeles. Federal Reserve Bank of San Francisco, 2016. http://www. aasc.ucla.edu/besol/Color_of_Wealth_Report.pdf.
76 Six of the nine original interviewees participated in the second round of interviews
77 SMU DataArts. Los Angeles County Department of Arts and Culture 2019 Workforce Demographics Study Results.
78 Ibid.79 SMU DataArts. The Demographics
of the Arts and Cultural Workforce of Los Angeles County. LA County Arts Commission, April 2017. https://www.lacountyarts.org/sites/default/files/pdfs/artsworkforcedemog2017.pdf.
80 U.S. Bureau of Labor Statistics. “4.9 Percent of Workers Held More than One Job at the Same Time in 2017.” U.S. Bureau of Labor Statistics. U.S. Bureau of Labor Statistics, July 19, 2018. https://www.bls.gov/opub/ted/2018/4-point-9-percent-of-workers-held-more-than-one-job-at-the-same-time-in-2017.htm.
81 t(74)= -3.99, two-tail p = 0.000182 t(24)= -0.55, two-tail p = 0.5983 t(85) = -4.45, two-tail p = 0.0000284 T(71) = -0.61, two-tail p = 0.5585 t(53) = 0.067, two-tail p = 0.9586 t(69) = -2.57, two-tail p = 0.012
En
dnotes

Make or B
reak: Race an
d Eth
nicity in En
try-Level Com
pen
sation for A
rts Adm
inistrators in Los Angeles C
ounty
91 87 Ratcliffe, Caroline, Brett Theodos, Signe-Mary Mckernan, Emma Kalish, John Chalekian, Peifang Guo, and Christopher Trepel. Debt in America. The Urban Institute, July 29, 2014. https://www.urban.org/sites/default/files/publication/33806/413190-debt-in-america_0.pdf.
88 t(91) = -3.01, two-tail p = 0.00389 “Los Angeles” is often used
colloquially to refer to the urban area that sprawls across the City of LA, the County of LA, and may include areas in neighboring counties. Interviewees were not asked to specify what they meant when they used this term.
90 Nonprofit Finance Fund. “Full Cost.” Nonprofit Finance Fund, August 7, 2020. https://nff.org/full-cost.
En
dnotes

Make or B
reak: Race an
d Eth
nicity in En
try-Level Com
pen
sation for A
rts Adm
inistrators in Los Angeles C
ounty
93
Our thanks to Adam J. Fowler of Beacon Economics, Mirae Kim of the Schar School of Policy and Government at George Mason University, and Neville Vakharia of the Westphal College of Media Arts & Design at Drexel University for very helpful comments on a previous version of this report.
Image CreditsCover: LA County Arts Internship Program; p. 3: Lady Artesia by Sonia Romero; p. 10: LA County Arts Internship Program; p. 13: LA County Creative Strategist Deborah Aschheim; p. 33: LA County Arts Internship Program; p. 60: Venice Arts; p. 66: Fulcrum Arts; p. 76: Materials & Applications; p. 80: LA County Arts Internship Program; p. 83: LA County Arts Internship Program; p. 92: Grow: but Never Grow Up by Nate Frizzel
Los Angeles County Board of SupervisorsHilda L. SolisHolly J. Mitchell Sheila KuehlJanice HahnKathryn Barger
Los Angeles County Department of Arts and CultureKristin SakodaDirector
Claremont Graduate UniversityJonathan T. D. NeilDirector, Center for Business and Management of the Arts
Researched and Written byCobi Krieger Bronwyn Mauldin
Designed by Dandelion

Make or Break: Race and Ethnicity in Entry-Level Compensationfor Arts Administrators in Los Angeles County