make, buy, or ally? choice of and payoff from ...gtellis.net/publications/makebuyally.pdf · borah...
TRANSCRIPT

This article was downloaded by: [128.125.208.112] On: 08 April 2014, At: 12:50Publisher: Institute for Operations Research and the Management Sciences (INFORMS)INFORMS is located in Maryland, USA
Marketing Science
Publication details, including instructions for authors and subscription information:http://pubsonline.informs.org
Make, Buy, or Ally? Choice of and Payoff fromAnnouncements of Alternate Strategies for InnovationsAbhishek Borah, Gerard J. Tellis
To cite this article:Abhishek Borah, Gerard J. Tellis (2014) Make, Buy, or Ally? Choice of and Payoff from Announcements of Alternate Strategiesfor Innovations. Marketing Science 33(1):114-133. http://dx.doi.org/10.1287/mksc.2013.0818
Full terms and conditions of use: http://pubsonline.informs.org/page/terms-and-conditions
This article may be used only for the purposes of research, teaching, and/or private study. Commercial useor systematic downloading (by robots or other automatic processes) is prohibited without explicit Publisherapproval. For more information, contact [email protected].
The Publisher does not warrant or guarantee the article’s accuracy, completeness, merchantability, fitnessfor a particular purpose, or non-infringement. Descriptions of, or references to, products or publications, orinclusion of an advertisement in this article, neither constitutes nor implies a guarantee, endorsement, orsupport of claims made of that product, publication, or service.
Copyright © 2014, INFORMS
Please scroll down for article—it is on subsequent pages
INFORMS is the largest professional society in the world for professionals in the fields of operations research, managementscience, and analytics.For more information on INFORMS, its publications, membership, or meetings visit http://www.informs.org

Vol. 33, No. 1, January–February 2014, pp. 114–133ISSN 0732-2399 (print) � ISSN 1526-548X (online) http://dx.doi.org/10.1287/mksc.2013.0818
© 2014 INFORMS
Make, Buy, or Ally? Choice of andPayoff from Announcements of
Alternate Strategies for InnovationsAbhishek Borah
Foster School of Business, University of Washington, Seattle, Washington 98195,[email protected]
Gerard J. TellisMarshall School of Business, University of Southern California, Los Angeles, California 90089,
Firms constantly grapple with the question of whether to make, buy, or ally for innovations. The literature hasnot, to our knowledge, analyzed the choice of and payoff from these alternate routes to innovation for the
same firm. To address this issue, we collect, code, and analyze the choice of and payoff from 3,522 announce-ments of make, buy, and ally for 192 firms across 108 industries over five years.
We find that announcements to make or ally generate positive and higher payoffs than announcements to buy,which generate negative payoffs. Nevertheless, firms continue to buy for two reasons. First, firms seem to haveno memory of the payoff from buy, even though they have a memory of the payoff from make. Second, firmstend to buy when they lack commercializations, even though this strategy does not always seem to pay off.These results suggest that firms see buy as a signal to investors that they have a solution for what may be a deepstrategic problem. Nevertheless, the negative returns to a buy can be mitigated if the acquirer is experienced,and the target is related and offers high customer benefit. We offer explanations for and implications of theresults.
Key words : innovation; announcements; make; buy; ally; content analysis; event study; stock market returnsHistory : Received: February 6, 2012; accepted: September 4, 2013; Preyas Desai served as the editor-in-chief
and Gary Lilien served as associate editor for this article.
IntroductionInnovations are critical for survival, growth, and suc-cess in today’s global competitive markets, especiallywhen recession depresses sales of mature products.Making, buying, and allying are the three mostwidely used strategies for expanding a firm’s inno-vation portfolio. Firms spend billions of dollars eachyear in implementing these three strategies. Booz &Company (2012) estimates that the top 1,000 publicfirms investing in research and development (R&D)spent $603 billion to make innovations in 2011.The Boston Consulting Group reports 22,700 merg-ers and acquisitions in 2011 worldwide, with a valueof $1.79 trillion (Kengelbach et al. 2012). Concur-rently, Dealogic estimates firms in 2011 spent $12.1 bil-lion in joint ventures in emerging markets alone(KPMG 2013).
Despite extensive research on decisions to make,buy, or ally across disciplines such as strategic man-agement, economics, marketing, and law (Geyskenset al. 2006), several aspects of the relative payoff frommaking, buying, or allying are still not clear.
First, prior research has not compared the pay-offs from announcing decisions to make, buy, or ally
within the same firm (henceforth, called make, buy, orally, respectively). Researchers have evaluated make,buy, or ally in distinct studies using separate sam-ples of firms (see Table 1). Separate analysis may notbe comparable because of differences in samples orcontexts. To address this issue, the current study com-pares the choice of and payoff from announcementsto make, buy, and ally within the same firm and timeperiods.
Second, prior studies have not examined whetherfirms learn from their past successes or mistakes.That is, do past successes stimulate adoption of thesuccessful strategy while past failures lead to avoid-ance of the failing strategy? For example, Hewlett-Packard (HP) recently announced a write-down of$8.8 billion from an $11 billion acquisition of Auton-omy Corporation announced earlier (Worthen andScheck 2013). Ironically, HP similarly announced hugewrite-downs in two similar announcements of acqui-sitions, Palm and EDS (Steenkamp 2013).
Third, researchers have also not examined how afirm’s past commercialization of innovations affectsits strategy to make, buy, or ally. For example, arebuy announcements used by firms to complement a
114
Dow
nloa
ded
from
info
rms.
org
by [
128.
125.
208.
112]
on
08 A
pril
2014
, at 1
2:50
. Fo
r pe
rson
al u
se o
nly,
all
righ
ts r
eser
ved.

Borah and Tellis: Make, Buy, or Ally?Marketing Science 33(1), pp. 114–133, © 2014 INFORMS 115
Table 1 Papers on Make, Buy, and/or Ally in the 16 Top Business and Economics Journals from January 2001 to April 2013
Is event =No. Authors Year Journala Focus of study Event Derived measure announcement?
1 Louis K. C. Chan,Josef Lakonishok,and TheodoreSougiannis
2001 Journal of Finance Make Research anddevelopmentexpenditures
Buy and hold returns No
2 Allan C. Eberhart,William F. Maxwell,and Akhtar R.Siddique
2004 Journal of Finance Make Unexpected R&Dincreases
Long-term abnormalreturns
No
3 Namgyoo K. Park,John M. Mezias,and Jaeyong Song
2004 Journal ofManagement
Ally Technological alliances Cumulative abnormalreturns
No
4 Matthew J. Higginsand DanielRodriguez
2006 Journal ofFinancialEconomics
Buy New product-focusedbiotechnology industryacquisitions
Cumulative abnormalreturns
No
5 Kartik Kalaignanam,Venkatesh Shankar,and RajanVaradarajan
2007 ManagementScience
Ally New product developmentalliances
Cumulative abnormalreturns
No
6 David Benson andRosemarie H.Ziedonis
2008 OrganizationScience
Buy Acquisitions of technologystart-ups
Cumulative abnormalreturns
No
7 Joanne E. Oxley,Rachelle C.Sampson, and BrianS. Silverman
2009 ManagementScience
Ally Research anddevelopment alliances
Cumulative abnormalreturns
No
8 Ashish Sood andGerard J. Tellis
2009 Marketing Science Make, buy, and ally Alliance formationincluding acquisitions;make only includes newdevelopment ormanufacturing facilities
Cumulative abnormalreturns
Nogrouped into one category
called alliances
9 Sam Ransbotham andSabyasachi Mitra
2010 ManagementScience
Buy Acquisitions of innovation Abnormal returns No
10 Akbar Zaheer, ExequielHernandez, andSanjay Banerjee
2010 OrganizationScience
Buy High-technologyacquisitions
Cumulative abnormalreturns
No
11 Joshua Sears andGlenn Hoetker
2013 StrategicManagementJournal
Buy Technological acquisitions Cumulative abnormalreturns
No
Note. Full references for these papers appear in Online Appendix J (available as supplemental material at http://doi.dx.org/10.1287/mksc.2013.0818).aThe 16 top journals are as follows: the Journal of Marketing, the Journal of Marketing Research, Marketing Science, Management Science, the Strategic
Management Journal, the Academy of Management Journal, Organization Science, Administrative Science Quarterly, the Journal of Management, the Journalof Finance, the Journal of Financial Economics, Review of Financial Studies, American Economic Review, the Journal of Political Economy, Review of EconomicStudies, and the Quarterly Journal of Economics.
high level of commercializations or to compensate fora low level of commercializations? Thus, the currentstudy seeks to answer the following questions:
• What factors drive a firm to choose betweenmake, buy, or ally?
• How do payoffs differ for announcements tomake, buy, and ally within the same firm?
• What factors affect the payoff from announce-ments to make, buy, or ally?
• Do firms “learn” from the success or failure oftheir past strategies? That is, do payoffs from paststrategies affect current strategies?
• How does a firm’s prior commercialization ofinnovations affect the firm’s choice to make, buy,or ally?
To answer these questions, we collect a unique dataset of 3,522 announcements to make, buy, and allyfor 192 firms across 108 industries for five years.We model the choice of a make, buy, or ally usinga multinomial logit model with correlated responsesand firm heterogeneity, and then we carry out aregression analysis of the payoff as a function ofthe choice to make, buy, or ally, as well as otherexplanatory and control variables. We employ anevent study to estimate payoffs from announcing amake, buy, and ally. Our models control for selec-tion bias, firm heterogeneity, repeated observations,and other explanatory factors. Furthermore, we cre-ate novel, dynamic measures of innovation related-ness and customer benefit using content analysis.
Dow
nloa
ded
from
info
rms.
org
by [
128.
125.
208.
112]
on
08 A
pril
2014
, at 1
2:50
. Fo
r pe
rson
al u
se o
nly,
all
righ
ts r
eser
ved.

Borah and Tellis: Make, Buy, or Ally?116 Marketing Science 33(1), pp. 114–133, © 2014 INFORMS
To simplify the terminology and for ease of exposi-tion, we use the terms “make,” “buy,” and “ally” torefer to announcements of make, buy, and ally forinnovations, respectively.
Our results indicate that make and ally generatepositive and higher payoffs than buy, which generatenegative payoffs. Nevertheless, firms continue to buyfor two reasons. First, firms seem to have no mem-ory of the payoff from buy. Second, firms tend to buywhen they lack commercializations. Nevertheless, iffirms choose to buy, the negative returns to a buy canbe mitigated if the acquirer is experienced and thetarget is related and offers high customer benefit.
The rest of this paper is organized as follows:The next four sections present the theory, method,model, and results. The last section concludes withthe findings, discussion of the findings, implications,and study limitations.
Theory and HypothesesThis section explains the conceptual framework andbuilds hypotheses for the drivers of the choice of andpayoff from making, buying, and allying. We beginwith the definitions of the key terms and the theoryfor the payoff metric employed in the study.
DefinitionsWe define seven key terms relevant to the study:innovation project, initiation phase, announcement,make, buy, ally, and choice. An innovation project is
Figure 1 Events During Initiation, Development, and Commercialization Activities of the Innovation Project
Initiation Development Commercialization
1. Make (start of R&D lab, start of new process, start of new entity/division, start of new project)2. Buy (patents, software/technology, research personnel, product/service that are modified or combined with current innovations)3. Ally (strategic alliances, joint ventures, licensing)
1. Working prototypes2. Identification of new materials, processes, or equipment3. Demonstration in exhibitions 4. Patent applications5. Patent issuing
6. Preannouncements
1. New product/service launch
2. Initial shipments
3. New applications of and markets for the new products/services
4. Awards (external recognition of quality)
Study focus
Innovation phases
the total of a firm’s activities in researching, develop-ing, and introducing a new product or service (Soodand Tellis 2009) (see Figure 1). An innovation projectcomprises three phases: initiation, development, andcommercialization (Sood and Tellis 2009). The initi-ation phase is defined as the start of an innovationproject. An announcement is the release of informa-tion by the firm directly or by other sources aboutsome event (e.g., to make, buy, or ally) in the inno-vation project. We define make as a firm’s announce-ment that it will develop a new product or serviceinternally at the initiation phase of the innovationproject. We identify four types of makes: (1) startinga research and development center or research lab-oratory or innovation center, (2) starting a new pro-cess or system, (3) starting a new entity or division,and (4) starting a new project for developing a prod-uct or service. Note that a make is a promise ofor intention for future innovation. We define buyas a firm’s announcement to acquire a firm or partof a firm explicitly for its innovation at the initia-tion phase. We exclude all acquisitions undertakenfor non-innovation reasons (e.g., cost considerations,tax reductions, economies of scale). We identify fourtypes of buys: (1) buying patents, (2) buying soft-ware or technology, (3) buying research personnel,and (4) buying products or services that are modi-fied or combined with current innovations. Note thata buy may also be a promise because in most casesthe firm has to integrate R&D, production, branding,marketing, and distribution, which is not guaranteed
Dow
nloa
ded
from
info
rms.
org
by [
128.
125.
208.
112]
on
08 A
pril
2014
, at 1
2:50
. Fo
r pe
rson
al u
se o
nly,
all
righ
ts r
eser
ved.

Borah and Tellis: Make, Buy, or Ally?Marketing Science 33(1), pp. 114–133, © 2014 INFORMS 117
to be successful. We define ally as the announcementof joining of two or more entities, for a specified orunspecified period, to develop an innovation at theinitiation phase. These alliances, which include openinnovations (Chesbrough 2003, West et al. 2006, Hageland Brown 2011, Lichtenthaler 2011, Bayus 2013),comprise the following: (1) forming a joint venturewith other companies to develop products, (2) code-veloping products with firms, (3) licensing of technol-ogy, (4) hiring an expert on a contract basis to answera research problem, (5) collaborating with universi-ties or research institutes, and (6) participating in net-works to develop innovations. Thus, alliances can beof three types: joint ventures, strategic alliances, andlicensing agreements. Note that an ally may also be apromise because in most cases the firm has to shareR&D, production, branding, marketing, and distribu-tion with its partner(s), which is not guaranteed tobe successful. The term choice denotes the decisionamong make, buy, or ally.
The literature supports the consideration of make,buy, and ally as alternatives. Kreutzer (2012) pointsout that firms are aware that these three choicesrepresent alternative means of innovation. Dyeret al. (2004) find that 82% of firms view acquisi-tions and alliances as substitutes. For example, CiscoSystems has one senior vice president responsiblefor acquisitions, alliances, and internal development(Dyer et al. 2004). By placing all three functions underthe same person, Cisco checks the feasibility of eachoption starting with its internal capabilities. Cisco’shead of corporate development states, “[W]e makethe choice between internal development, acquisi-tions, or alliances. At some point, I have to makethe decision about what’s the right strategy for us”(Dyer et al. 2004, p. 115). Using various criteria, Ciscodecides on one of the three options (Cisco SystemsCanada 2009). Capron and Mitchell (2010) argue thatthe typical firm makes one choice out of the threealternatives. They cite Eli Lilly as an exemplar of afirm that makes one of the three choices at any giventime based on the firm’s existing capabilities and part-nership characteristics.
Logic for Event StudyTracking the long-term success of each of thesechoices is difficult if not impossible because com-panies do not reveal the specific outcomes to eachof these announcements and the causes of the out-come. To resolve the information problem, we makeuse of the event method. This method relies on theassumption that the stock price at a particular pointin time fully reflects all available information upto that point (Sharpe 1964, Fama 1998). The stockprice relies on trades by a market of thousands ofinvestors the world over who track the company’s
choices and performance. The company’s announce-ment of a new decision reflects new information thatmay affect the stock price positively, negatively, ornot at all. The change in stock price, if any, at thetime of the announcement of a decision reflects thediscounted future cash flows that the market expectsfrom the decision, taking into account the past per-formance of the company, its future potential, andits competition (Fama et al. 1969, Fama 1991). Thus,by definition, returns are future looking and incorpo-rate the long term (Campbell et al. 1997, Srinivasanand Bharadwaj 2004, Srinivasan and Hanssens 2009).By this logic, the stock market returns to make, buy,or ally would reflect the discounted expected returnsin the future. By analyzing these returns against thecharacteristics of these announcements, we can assessthe payoff from a make, buy, or ally and what factorsdrive that payoff. The use of this method is increasingin marketing (e.g., Tellis and Johnson 2007, Joshi andHanssens 2009, Luo 2009, Sood and Tellis 2009, Wileset al. 2010).
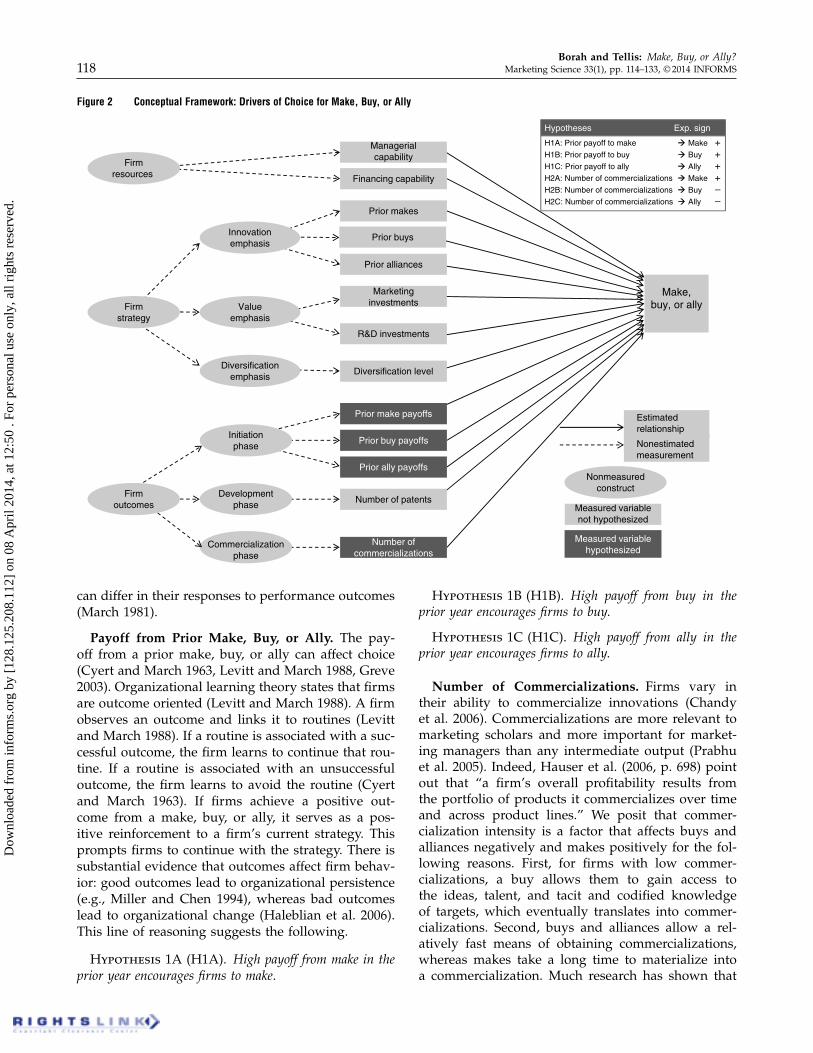
The Drivers of ChoiceThis section proposes the conceptual framework forthe drivers of choice and derives several hypothe-ses. Based on the literature, three broad constructsdrive choice: firm resources, firm strategy, and firmoutcomes (Williamson 1975, Jensen 1986, Kelm et al.1995, Mizik and Jacobson 2003, Haleblian et al. 2006,Sorescu et al. 2007, Sood and Tellis 2009). Figure 2depicts the conceptual framework. The most impor-tant firm resources are its managerial and financingcapability. Within firm strategy, the key constructsthat drive choice are the firm’s emphasis on innova-tion, value (creation and appropriation), and diversi-fication. We measure a firm’s innovation emphasis byits prior makes, buys, and alliances. We measure afirm’s emphasis on value creation by its research anddevelopment investments and on value appropriationby its marketing investments. Within firm outcomes,the key constructs are based on outcomes of eachphase of an innovation project: initiation, develop-ment, and commercialization (Sood and Tellis 2009).We measure outcomes of the initiation phase by pay-off from prior makes, buys, and alliances. The mostimportant outcomes of the development and commer-cialization phases are the number of patents and thenumber of commercializations, respectively.
We next build hypotheses on the effect of the out-comes of the initiation and commercialization phasesof an innovation project on choice. We focus on thefirm outcome construct, as there is no prior research,to our knowledge, that has examined how firm out-comes affect choice. Performance feedback plays acrucial role in indicating whether a firm needs tomaintain or change its management strategy. Firms
Dow
nloa
ded
from
info
rms.
org
by [
128.
125.
208.
112]
on
08 A
pril
2014
, at 1
2:50
. Fo
r pe
rson
al u
se o
nly,
all
righ
ts r
eser
ved.
Borah and Tellis: Make, Buy, or Ally?118 Marketing Science 33(1), pp. 114–133, © 2014 INFORMS
Figure 2 Conceptual Framework: Drivers of Choice for Make, Buy, or Ally
Make,buy, or ally
Measured variablehypothesized
Measured variablenot hypothesized
Nonmeasuredconstruct
Nonestimatedmeasurement
Managerialcapability
Financing capability
Prior makes
Prior alliances
Marketinginvestments
R&D investments
Prior make payoffs
Prior buy payoffs
Number of patents
Number ofcommercializations
Diversification levelDiversification
emphasis
Valueemphasis
Innovationemphasis
Firmstrategy
Firmresources
Commercializationphase
Firmoutcomes
Initiationphase
Developmentphase
Prior buys
Prior ally payoffs
Hypotheses Exp. sign
H1A: Prior payoff to make Make +H1B: Prior payoff to buy Buy +H1C: Prior payoff to ally Ally +H2A: Number of commercializations Make +H2B: Number of commercializations Buy –H2C: Number of commercializations Ally –
Estimatedrelationship
can differ in their responses to performance outcomes(March 1981).
Payoff from Prior Make, Buy, or Ally. The pay-off from a prior make, buy, or ally can affect choice(Cyert and March 1963, Levitt and March 1988, Greve2003). Organizational learning theory states that firmsare outcome oriented (Levitt and March 1988). A firmobserves an outcome and links it to routines (Levittand March 1988). If a routine is associated with a suc-cessful outcome, the firm learns to continue that rou-tine. If a routine is associated with an unsuccessfuloutcome, the firm learns to avoid the routine (Cyertand March 1963). If firms achieve a positive out-come from a make, buy, or ally, it serves as a pos-itive reinforcement to a firm’s current strategy. Thisprompts firms to continue with the strategy. There issubstantial evidence that outcomes affect firm behav-ior: good outcomes lead to organizational persistence(e.g., Miller and Chen 1994), whereas bad outcomeslead to organizational change (Haleblian et al. 2006).This line of reasoning suggests the following.
Hypothesis 1A (H1A). High payoff from make in theprior year encourages firms to make.
Hypothesis 1B (H1B). High payoff from buy in theprior year encourages firms to buy.
Hypothesis 1C (H1C). High payoff from ally in theprior year encourages firms to ally.
Number of Commercializations. Firms vary intheir ability to commercialize innovations (Chandyet al. 2006). Commercializations are more relevant tomarketing scholars and more important for market-ing managers than any intermediate output (Prabhuet al. 2005). Indeed, Hauser et al. (2006, p. 698) pointout that “a firm’s overall profitability results fromthe portfolio of products it commercializes over timeand across product lines.” We posit that commer-cialization intensity is a factor that affects buys andalliances negatively and makes positively for the fol-lowing reasons. First, for firms with low commer-cializations, a buy allows them to gain access tothe ideas, talent, and tacit and codified knowledgeof targets, which eventually translates into commer-cializations. Second, buys and alliances allow a rel-atively fast means of obtaining commercializations,whereas makes take a long time to materialize intoa commercialization. Much research has shown that
Dow
nloa
ded
from
info
rms.
org
by [
128.
125.
208.
112]
on
08 A
pril
2014
, at 1
2:50
. Fo
r pe
rson
al u
se o
nly,
all
righ
ts r
eser
ved.
Borah and Tellis: Make, Buy, or Ally?Marketing Science 33(1), pp. 114–133, © 2014 INFORMS 119
it is desirable to bring products to market quickly(Kessler and Chakrabarti 1996). Buying innovativefirms or partnering to obtain innovations allows firmsto quickly gain access to the target’s commercializ-able products, trusted channel relationships, and loyalcustomer base. This line of reasoning suggests thefollowing.Hypothesis 2A (H2A). A high number of commer-
cializations in the prior year encourages firms to make.
Hypothesis 2B (H2B). A low number of commercial-izations in the prior year encourages firms to buy.
Hypothesis 2C (H2C). A low number of commercial-izations in the prior year encourages firms to ally.
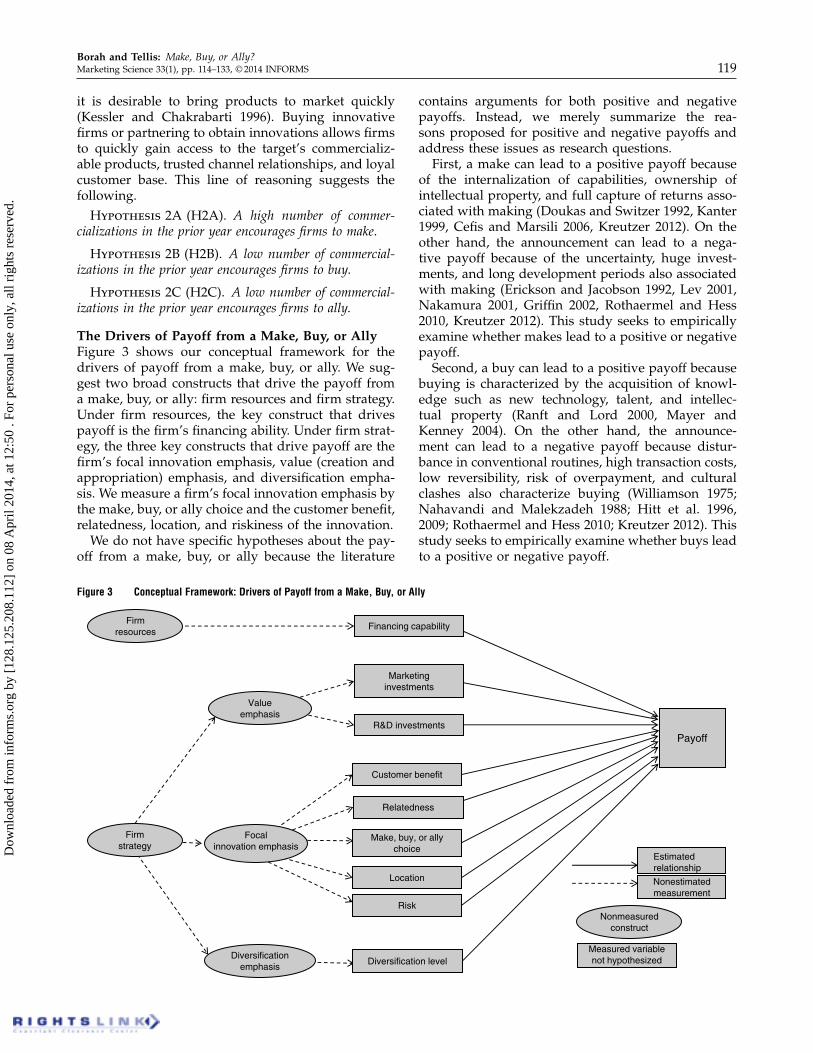
The Drivers of Payoff from a Make, Buy, or AllyFigure 3 shows our conceptual framework for thedrivers of payoff from a make, buy, or ally. We sug-gest two broad constructs that drive the payoff froma make, buy, or ally: firm resources and firm strategy.Under firm resources, the key construct that drivespayoff is the firm’s financing ability. Under firm strat-egy, the three key constructs that drive payoff are thefirm’s focal innovation emphasis, value (creation andappropriation) emphasis, and diversification empha-sis. We measure a firm’s focal innovation emphasis bythe make, buy, or ally choice and the customer benefit,relatedness, location, and riskiness of the innovation.
We do not have specific hypotheses about the pay-off from a make, buy, or ally because the literature
Figure 3 Conceptual Framework: Drivers of Payoff from a Make, Buy, or Ally
Payoff
Measured variablenot hypothesized
Nonmeasuredconstruct
Estimatedrelationship
Nonestimatedmeasurement
Financing capability
Relatedness
Make, buy, or allychoice
Marketinginvestments
R&D investments
Diversification levelDiversification
emphasis
Valueemphasis
Focalinnovation emphasis
Firmstrategy
Firmresources
Customer benefit
Location
Risk
contains arguments for both positive and negativepayoffs. Instead, we merely summarize the rea-sons proposed for positive and negative payoffs andaddress these issues as research questions.
First, a make can lead to a positive payoff becauseof the internalization of capabilities, ownership ofintellectual property, and full capture of returns asso-ciated with making (Doukas and Switzer 1992, Kanter1999, Cefis and Marsili 2006, Kreutzer 2012). On theother hand, the announcement can lead to a nega-tive payoff because of the uncertainty, huge invest-ments, and long development periods also associatedwith making (Erickson and Jacobson 1992, Lev 2001,Nakamura 2001, Griffin 2002, Rothaermel and Hess2010, Kreutzer 2012). This study seeks to empiricallyexamine whether makes lead to a positive or negativepayoff.
Second, a buy can lead to a positive payoff becausebuying is characterized by the acquisition of knowl-edge such as new technology, talent, and intellec-tual property (Ranft and Lord 2000, Mayer andKenney 2004). On the other hand, the announce-ment can lead to a negative payoff because distur-bance in conventional routines, high transaction costs,low reversibility, risk of overpayment, and culturalclashes also characterize buying (Williamson 1975;Nahavandi and Malekzadeh 1988; Hitt et al. 1996,2009; Rothaermel and Hess 2010; Kreutzer 2012). Thisstudy seeks to empirically examine whether buys leadto a positive or negative payoff.
Dow
nloa
ded
from
info
rms.
org
by [
128.
125.
208.
112]
on
08 A
pril
2014
, at 1
2:50
. Fo
r pe
rson
al u
se o
nly,
all
righ
ts r
eser
ved.

Borah and Tellis: Make, Buy, or Ally?120 Marketing Science 33(1), pp. 114–133, © 2014 INFORMS
Third, an ally can lead to a positive payoff becauseallying is associated with shared risk; access to knowl-edge with low transaction costs; and high flexibil-ity to enter, commit, or exit (Gomes-Casseres 2000,Capron and Mitchell 2012, Kreutzer 2012). On theother hand, the announcement can lead to a neg-ative payoff because allying is also associated witha lack of management attention, relationship risks,threat of opportunistic behavior, potential competi-tion between partners, and shared returns (Parkhe1993, Bleeke and Ernst 2002, Ybarra and Turk 2011,Capron and Mitchell 2012, Kreutzer 2012). This studyseeks to empirically examine whether alliances leadto a positive or negative payoff.
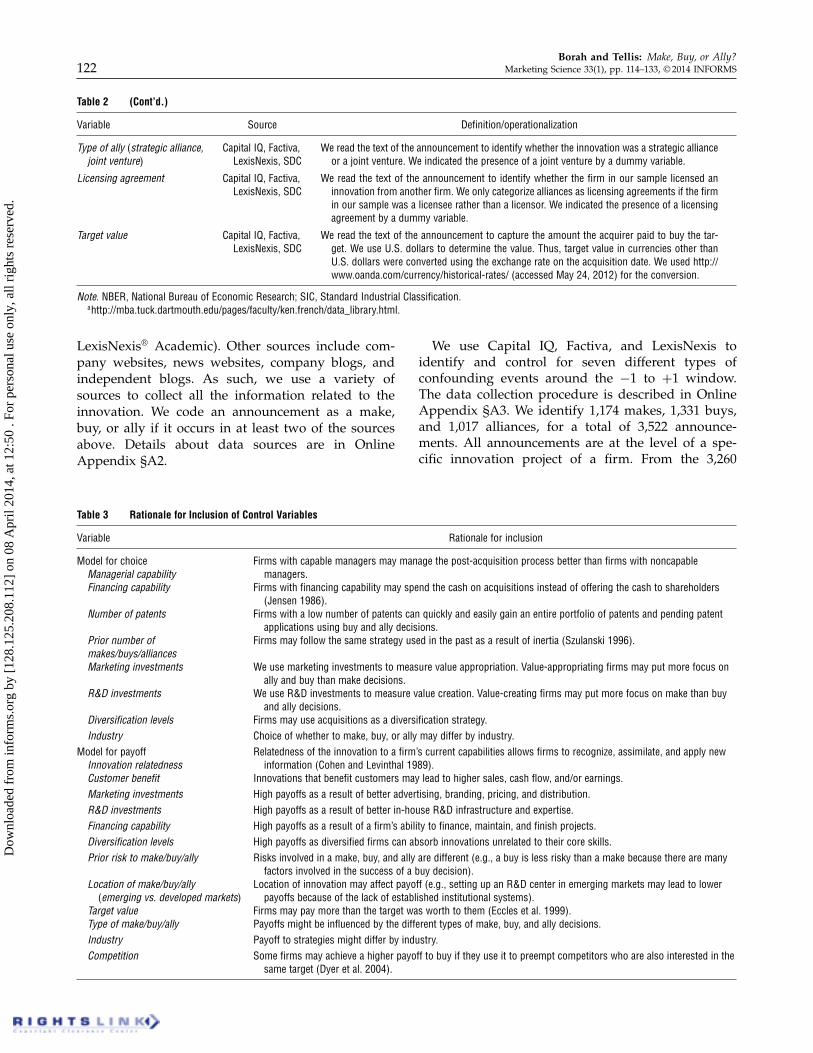
Control VariablesWe use the following control variables in our choicemodel: managerial capability, financing capability, num-ber of patents, prior number of makes, prior number ofbuys, prior number of alliances, marketing investments,R&D investments, diversification levels, and industry.Please see panel A of Table 2 for the measures of thesevariables and Table 3 for the reasons these variablesare used. We use the following control variables in ourpayoff model: innovation relatedness, customer benefit,marketing investments, R&D investments, financing capa-bility, diversification levels, prior risk to make, prior riskto buy, prior risk to ally, location 4emerging markets ver-sus developed markets5, licensing agreement, target value,type of make, type of buy, type of ally, industry, and com-petition. The measures are in panel B of Table 2, andthe rationale for the inclusion of these control vari-ables is provided in Table 3.
MethodWe test the hypotheses by assembling data from192 firms across 108 industries. We collect these datausing the historical method (Golder and Tellis 1993,Golder 2000). Below we detail the sample selec-tion, data collection, and the measures of the focalvariables.
Sample SelectionWe use four different samples to minimize any sam-ple selection bias and maximize the generalizabilityof results. The samples exclude firms not listed on theAmerican stock exchanges and financial institutionsbecause they experienced considerable turmoil dur-ing our study’s time frame. Moreover, financial inno-vations are inherently risky and complex. We outlineeach sample in turn below.
Sample 1. Our first sample is drawn from a list ofthe most innovative firms in the world. We includethis sampling frame because the most innovativefirms have an ample number of makes. We use the
2008 BusinessWeek and Boston Consulting Group’s listof the 50 most innovative firms in the world for thesampling frame. The list includes firms from variousindustries. Although the list had 50 firms, we couldonly include 36; we dropped 14 firms because theyare either financial institutions or not listed on theAmerican stock exchanges.
Sample 2. To ensure that we have a sizeable num-ber of buys, for our second sample, we select the36 most acquisitive firms in the world.1 We rely on theSecurities Data Company (SDC) mergers and acqui-sitions database to extract the list. The SDC databasecomprehensively covers all worldwide mergers andacquisitions from 1985.
Sample 3. For our third sample, we randomlyselect 64 firms from the 2008 Fortune 500 list. The For-tune 500 is a list compiled by Fortune magazine rank-ing the top 500 public corporations of the UnitedStates as measured by their gross revenue. This sam-pling frame allows us to select the largest publiclyheld firms in the United States.
Sample 4. Our fourth sample comprises 64 firmschosen at random from the 2008 Fortune 501–1,000list. This sampling frame allows us to select relativelysmaller and publicly held firms in the United States.Samples 3 and 4 include firms that vary in their num-ber of makes, buys, and alliances.
As a result, we have 192 firms in our sample. Thereis an overlap of eight firms between Samples 1 and 2.2
This sample selection strategy enables us to compilea substantial number of makes, buys, and alliancesfrom various industries. Firms range from large tosmall, from innovative to non-innovative, with low tohigh make, buy, and ally rates, and include marketersof products and services. This sampling strategy leadsto a broad, representative set of firms and is impor-tant for the generalizability of results.
The list of the 192 firms is in Online Appendix §A1.For time sampling, we chose the period from July1, 2002 to June 30, 2007. We focus on this five-yearperiod because the most recent Fama–French factorswere available through June 2007, when we starteddata collection in 2008. The availability of the Fama–French factors is intrinsically important to our study.
Data CollectionWe use a number of sources for collecting theannouncements to make, buy, and ally. We iden-tify announcements using four respected syndicatedsources (Capital IQ, Factiva, the SDC database, and
1 We use the period from 2002 to 2007 to select the top 36 acquirers.Financial institutions are dropped.2 We exclude firms from Samples 1 and 2 for the random selectionprocess for Samples 3 and 4.
Dow
nloa
ded
from
info
rms.
org
by [
128.
125.
208.
112]
on
08 A
pril
2014
, at 1
2:50
. Fo
r pe
rson
al u
se o
nly,
all
righ
ts r
eser
ved.

Borah and Tellis: Make, Buy, or Ally?Marketing Science 33(1), pp. 114–133, © 2014 INFORMS 121
Table 2 Operationalization of Control Variables
Variable Source Definition/operationalization
Panel A: Variables in both the model for choice and payoffManagerial capability Compustat Tobin’s q: Ratio of the market value of a firm to its total assets. Market value of the firm equals
the market value of common equity plus the book value of preferred stock plus the book valueof total debt (t − 1).
Financing capability Compustat Free cash flow: Operating cash flow minus capital expenditures. We normalize this measure bydividing the free cash flow by the total assets (t − 1).
Number of patents NBER patentdatabase (Hallet al. 2005)
Number of patents granted in the year prior to the announcement date. Because we have a rangeof industries, we standardize this measure by industry. We use the NBER patent database tocollect patents for all firms for every four-digit SIC code in our sample.
Prior number of makes/Priornumber of buys/Priornumber of alliances
Capital IQ, Factiva,LexisNexis
Number of makes/buys/alliances per year prior to the date of the current event. We use awindow of one year for calculating this variable. To control for size, we normalize thismeasure by the total sales in year t − 1.
Marketing investments Compustat Ratio of selling and general administrative (SG&A) expenses to the total assets (t − 1) stan-dardized by each SIC code. It is set to 0 when SG&A expense is missing.
R&D investments Compustat Ratio of research and development expenses to the total assets (t − 1) standardized by eachSIC code. It is set to 0 when R&D expense is missing.
Diversification levels (lowdiversified firms (basecase), related diversifiedfirms, unrelated diversifiedfirms, high diversifiedfirms)
Compustat Four different categories of diversification based on two broad patterns of diversification(Varadarajan and Ramanujan 1987): broad spectrum diversification, the number of two-digitSIC codes in which a firm operates; and mean narrow spectrum diversification, the numberof four-digit SIC codes in which a firm operates divided by the number of two-digit SICcategories in which it operates.
Industry OccupationalSafety andHealthAdministration
Firms are categorized by whether they are in business-to-business (B2B) goods, B2B service,business-to-consumer (B2C) goods, and B2C service (Srinivasan et al. 2011) industries.
Panel B: Variables in the model for payoff onlyInnovation relatedness Capital IQ, Factiva,
LexisNexis, SDCSchema of innovation relatedness expressing increasing relatedness, on a 10-point scale rang-
ing from 1 to 10. Scale coded by two research assistants who did not know the study’sobjectives. (See Online Appendix §A7.1 for the schema; �= 0066.)
Customer benefit Capital IQ, Factiva,LexisNexis, SDC
Schema of customer benefit expressing increasing customer benefits, on a 10-point scale rang-ing from 1 to 10. Scale coded by two research assistants who did not know the study’sobjectives. (See Online Appendix §A7.2 for the schema; �= 0072.)
Prior risk to make/Prior riskto buy/Prior risk to ally
CRSP, KennethFrench’swebsitea
Coefficient of �1i in Equation (B1) in Online Appendix B, i.e., the Carhart four-factor model forcomputing payoffs. First, we estimate prior event �1i for each firm using 265 days of dailyreturns ending 1 day before the event day. Next, we estimate post-event �1i for each firmusing 265 days of daily returns starting 1 day before the event day. The change in systematicrisk (ã�1i ) attributed to the announcement is the difference between the pre- and post-eventsystematic risk. We measure this variable by averaging the systematic risks to the firm’smakes, buys, and alliances per year prior to the date of the current event. For robustness, wealso use alternative end and start dates of 10 days before the event day.
Competition Compustat For each firms’ primary SIC industry, we square each firm’s market share and take the sum overall firms. We next subtract this sum from 1 (Fang et al. 2008).
Location (emerging vs.developed markets)
Capital IQ, Factiva,LexisNexis, SDC
If the announcement indicated that the innovation was going to be carried out in an emerg-ing market. We used the summary list provided in Wikipedia (http://en.wikipedia.org/wiki/Emerging_markets, accessed June 26, 2012). We identified a country as en emerging marketif the country appeared in the “Summary list” on the website.
Type of make (R&D center,new process, new entity,new product)
Capital IQ, Factiva,LexisNexis, SDC
We read the text of the announcement to identify whether the innovation involved thedevelopment of an R&D center, the incorporation of a new process, the start of a new entityto develop product, or the start of a new project to develop a product. We indicated thepresence of a make type by a dummy variable.
Type of buy (target’s product,target’s software, target’sresearch personnel, target’spatent)
Capital IQ, Factiva,LexisNexis, SDC
We read the text of the announcement to identify whether the target’s product, software, researchpersonnel, or patents were bought in the acquisition. We indicated the presence of a buy typeby a dummy variable.
Dow
nloa
ded
from
info
rms.
org
by [
128.
125.
208.
112]
on
08 A
pril
2014
, at 1
2:50
. Fo
r pe
rson
al u
se o
nly,
all
righ
ts r
eser
ved.
Borah and Tellis: Make, Buy, or Ally?122 Marketing Science 33(1), pp. 114–133, © 2014 INFORMS
Table 2 (Cont’d.)
Variable Source Definition/operationalization
Type of ally (strategic alliance,joint venture)
Capital IQ, Factiva,LexisNexis, SDC
We read the text of the announcement to identify whether the innovation was a strategic allianceor a joint venture. We indicated the presence of a joint venture by a dummy variable.
Licensing agreement Capital IQ, Factiva,LexisNexis, SDC
We read the text of the announcement to identify whether the firm in our sample licensed aninnovation from another firm. We only categorize alliances as licensing agreements if the firmin our sample was a licensee rather than a licensor. We indicated the presence of a licensingagreement by a dummy variable.
Target value Capital IQ, Factiva,LexisNexis, SDC
We read the text of the announcement to capture the amount the acquirer paid to buy the tar-get. We use U.S. dollars to determine the value. Thus, target value in currencies other thanU.S. dollars were converted using the exchange rate on the acquisition date. We used http://www.oanda.com/currency/historical-rates/ (accessed May 24, 2012) for the conversion.
Note. NBER, National Bureau of Economic Research; SIC, Standard Industrial Classification.ahttp://mba.tuck.dartmouth.edu/pages/faculty/ken.french/data_library.html.
LexisNexis® Academic). Other sources include com-pany websites, news websites, company blogs, andindependent blogs. As such, we use a variety ofsources to collect all the information related to theinnovation. We code an announcement as a make,buy, or ally if it occurs in at least two of the sourcesabove. Details about data sources are in OnlineAppendix §A2.
Table 3 Rationale for Inclusion of Control Variables
Variable Rationale for inclusion
Model for choiceManagerial capability
Firms with capable managers may manage the post-acquisition process better than firms with noncapablemanagers.
Financing capability Firms with financing capability may spend the cash on acquisitions instead of offering the cash to shareholders(Jensen 1986).
Number of patents Firms with a low number of patents can quickly and easily gain an entire portfolio of patents and pending patentapplications using buy and ally decisions.
Prior number ofmakes/buys/alliances
Firms may follow the same strategy used in the past as a result of inertia (Szulanski 1996).
Marketing investments We use marketing investments to measure value appropriation. Value-appropriating firms may put more focus onally and buy than make decisions.
R&D investments We use R&D investments to measure value creation. Value-creating firms may put more focus on make than buyand ally decisions.
Diversification levels Firms may use acquisitions as a diversification strategy.Industry Choice of whether to make, buy, or ally may differ by industry.
Model for payoffInnovation relatedness
Relatedness of the innovation to a firm’s current capabilities allows firms to recognize, assimilate, and apply newinformation (Cohen and Levinthal 1989).
Customer benefit Innovations that benefit customers may lead to higher sales, cash flow, and/or earnings.Marketing investments High payoffs as a result of better advertising, branding, pricing, and distribution.R&D investments High payoffs as a result of better in-house R&D infrastructure and expertise.Financing capability High payoffs as a result of a firm’s ability to finance, maintain, and finish projects.Diversification levels High payoffs as diversified firms can absorb innovations unrelated to their core skills.Prior risk to make/buy/ally Risks involved in a make, buy, and ally are different (e.g., a buy is less risky than a make because there are many
factors involved in the success of a buy decision).Location of make/buy/ally
(emerging vs. developed markets)Location of innovation may affect payoff (e.g., setting up an R&D center in emerging markets may lead to lower
payoffs because of the lack of established institutional systems).Target value Firms may pay more than the target was worth to them (Eccles et al. 1999).Type of make/buy/ally Payoffs might be influenced by the different types of make, buy, and ally decisions.Industry Payoff to strategies might differ by industry.Competition Some firms may achieve a higher payoff to buy if they use it to preempt competitors who are also interested in the
same target (Dyer et al. 2004).
We use Capital IQ, Factiva, and LexisNexis toidentify and control for seven different types ofconfounding events around the −1 to +1 window.The data collection procedure is described in OnlineAppendix §A3. We identify 1,174 makes, 1,331 buys,and 1,017 alliances, for a total of 3,522 announce-ments. All announcements are at the level of a spe-cific innovation project of a firm. From the 3,260
Dow
nloa
ded
from
info
rms.
org
by [
128.
125.
208.
112]
on
08 A
pril
2014
, at 1
2:50
. Fo
r pe
rson
al u
se o
nly,
all
righ
ts r
eser
ved.

Borah and Tellis: Make, Buy, or Ally?Marketing Science 33(1), pp. 114–133, © 2014 INFORMS 123
announcements that we use in our multinomial logitmodel, we eliminate 1,671 because of confound-ing events. Thus, our sample for the event analysisand payoff regression model comprises 441 makes,754 buys, and 394 alliances for a total of 1,589. Thissample size is, to our knowledge, higher than all othermarketing studies, which use the event study methodand also run a check for confounding events.3 Overall,collecting, reading, and coding all the different typesof data used in the study consumed approximately3,100 man-hours.
MeasuresThis section describes the measures of and ratio-nale behind the key variables in the hypotheses.The details and definition of the measures for all theother variables are in Table 2.
Payoff to Prior Make, Buy, and Ally. We mea-sure the prior make payoff, prior buy payoff, and priorally payoff variables by averaging the returns to thefirm’s makes, buys, and alliances, respectively, peryear prior to the date of the current event. We usethe −1- to +1-day window to calculate the returnsfor each event. We measure these variables over theprevious year but also test for longer windows in therobustness checks. Our position for using this mea-sure of prior payoff is as follows. When consideringwhether to make, buy, or ally, managers are likelyto consider how the firm fared when it made thedecision in the past (Cyert and March 1963, Levitt andMarch 1988). In other words, they are likely to learnfrom past experience with these decisions (Cyert andMarch 1963, Levitt and March 1988). The most recentpayoff to these decisions in the prior year is likely tobe the most important factor influencing a manager’slearning from the past (Haleblian et al. 2006).
Number of Commercializations. We measure thenumber of commercializations by the number of newproduct launches per year prior to the date of the cur-rent event. We create this measure with the followingformula:
ShareCommit =
∑t−365t=t−1 NPAit
∑
i
∑t−365t=t−1 NPAit
1 (1)
where NPAit stands for new product launch an-nouncement for firm i on day t. We sum all newproduct launch announcements for a firm i prior
3 Wiles et al. (2012) use 880 events, Chen et al. (2012) use 606 events,Karniouchina et al. (2011) use 928 events, Swaminathan andMoorman (2009) use 230 events, Tellis and Johnson (2007) use421 events, and Geyskens et al. (2002) use 98 events. Some studiesuse a higher number of events but do not control for confoundingevents (Sood and Tellis 2009, Elberse 2007). Meta-analyses for 127acquisition studies report average sample sizes of 221 events (Kinget al. 2004).
to day t up to one year and divide the same bythe total of all new product launch announcementsfor all firms prior to t up to one year. We rely onthe Capital IQ database for this particular variable.We read each entry under the category of “Product-Related Announcements” within the Key Develop-ments feature to ascertain a new product launch.Because the database has complete coverage onlyfrom January 2002 for new product launch announce-ments, we use a moving window of one year forannouncements from January 1, 2003 to June 30,2007 and the maximum time available (six monthsto one year) for announcements from July 1, 2002 toDecember 31, 2002.
ModelThis section describes the Carhart four-factor modelfor returns, the model for choice, and the modelfor payoffs. Because we have firms’ decisions thattake the form of makes, buys, and alliances withknown time stamps, we employ the event method togauge the impact of these announcements on returns(Srinivasan and Hanssens 2009).
Four-Factor Model for Computing ReturnsThe normal return to a stock is the price of a stockon a day minus that on the prior day divided by theprice on the prior day. The expected return of a stockon a day is the return of a stock that can be pre-dicted for that day based on a general market indexsuch as the S&P. The abnormal returns to a stock asa result of an event are the normal returns minus theexpected returns for the same day. As such, abnormalreturns control for fluctuations in price that affect thewhole market (not as a result of the particular eventof a particular firm) as revealed in movements of amarket index. We use the Fama–French (Fama andFrench 1993) and Carhart four-factor (Carhart 1997)models to calculate the abnormal returns. We usethe cumulative average abnormal returns (CAR) inthe (−111) window as our payoff metric. Because themodel has been used in prior research (e.g., Wileset al. 2010, Tirunillai and Tellis 2012), we skip thedetails for brevity. The interested reader can refer toOnline Appendix B for details.
Model for ChoiceBecause we have three unordered announcements(make, buy, and ally), we estimate a multinomial logitchoice model. Our specification allows for correlatedchoices. For example, a firm’s make choice mightbe correlated with its buy choice. Our specificationalso allows for firm heterogeneity. For example, twofirms with similar make, buy, or ally experience coulddevelop different abilities of managing make, buy, or
Dow
nloa
ded
from
info
rms.
org
by [
128.
125.
208.
112]
on
08 A
pril
2014
, at 1
2:50
. Fo
r pe
rson
al u
se o
nly,
all
righ
ts r
eser
ved.

Borah and Tellis: Make, Buy, or Ally?124 Marketing Science 33(1), pp. 114–133, © 2014 INFORMS
ally. In equation form, the multinomial logit modelwith random intercepts is
log�ijc
�ij1=�+x′
ij�c+uic1 c=make, ally, or buy. (2)
Here, i denotes the firm, and there exists I (i =
1121 0 0 0 1 I) firms. The ith firm has ni observations,where j denotes the jth observation at each uniquetime t (which in our case is a day). Response prob-abilities are denoted by �ijc = P4Yij = c5, where Yij
denotes the jth response for firm i (j = 1121 0 0 0 1ni).This response is from one of c (make, ally, or buy)choices. A column vector of p explanatory variablesfor the jth observation for firm i is denoted by xij ; xijincludes the hypothesized variables prior make payoff,prior buy payoff, and prior ally payoff ; number of commer-cializations; and numerous control variables definedin Table 2. Whenever possible, we use a window ofone year prior to the announcement date to calcu-late the explanatory variable. Otherwise, we use theprior year’s value. This helps us tackle any endogene-ity issues (Boulding and Staelin 1995). Constant termsare denoted by �c, and the effects of the p explanatoryvariables are assessed through �c = 4�1c1�2c1 0 0 0 1�pc5
′.Here, �c and �c are considered fixed effects; uic areconsidered random effects. We assume a multivari-ate normal distribution for uic with an expectationof 0 and an unstructured covariance matrix è; i.e., forui = 4ui11ui21ui35
′, we have ui ∼ N401è5. For reasonsof identification, we have �1 = 0, �1 = 0, and ui1 = 0.This identification scheme results in the interpretationof parameters with reference to the first category andè to be a 2 × 2 matrix. In our model, the first cate-gory is make (c = 11 where 1 stands for a make). Allyis indicated by c = 2 and buy by c = 3. Thus, the like-lihood contribution of the ith firm is
li4�c1�c1è5
=
∫ �
−�
( ni∏
j=1
[ exp4�c + x′ij�c +uic5
∑3m=1 exp4�m + x′
ij�m +uim5
]I4Yij=c5)
× fu4ui1è5dui0 (3)
Here, fu4ui1è5 is the multivariate normal density andI4 5 is the indicator function. The overall likelihoodfunction is the product of the likelihood contribu-tions for each firm, i.e., li. This likelihood functionconsists of a product of I integrals, where each ofthese cannot be solved in closed form. Thus, maxi-mum likelihood estimation of the parameters is notpossible. We thus resort to estimating the model usingnumerical integration—more specifically, by adaptiveGaussian quadrature. We use SAS to program andestimate the model (Kuss and McLerran 2007).4 Note
4 Following Kuss and McLerran (2007), we parameterize the covari-ance of the random effects such that (1) the estimate of the variance
that our estimation does not suffer from the indepen-dence of irrelevant alternatives assumption becausewe assume the random intercepts to be correlatedacross choice occasions.
Model for PayoffTo specify the payoff model, we first test for sampleselection bias in panel data following the proceduresuggested by Verbeek and Nijman (1992). If we do notfind evidence of selection bias, we estimate the modelwithout controlling for selection bias. If we find evi-dence for such bias, we resort to procedure suggestedby Wooldridge (1995). The details of the procedureand the results are in Online Appendix C. We findno evidence of sample selection bias. So we run arandom effects panel regression analysis of payoff asa function of the independent variables, combiningmake, buy, and ally in one model. In equation form,we estimate the following model:
payoff it =�i+buyit�b+allyit�a+controls�+�4it
(4)for i = 1121 0 0 0 1 I firms, where t denotes the time(which in our case is a day) when firm i makes achoice, a denotes ally, b denotes buy, �i are randomfirm-specific effects and assumed to be independentand identically distributed, �4
it is an idiosyncraticerror, buyit is an indicator variable where 1 indicatesthat the firm made a buy choice, and allyit is an indi-cator variable where 1 indicates that the firm madean ally choice. The control variables such as R&Dinvestment, marketing investment, financing capabil-ity, and prior risk are measured before the announce-ment date to control for endogeneity (Boulding andStaelin 1995). Our estimation method takes care ofthe potential problem of unobserved heterogeneitybecause we use a random effects model (Greene 2003).We use Stata’s xtreg command and the vce option toobtain firm-robust standard errors.
ResultsEach announcement type has been made within everyproject of a firm. Within a project, the majority ofannouncements (N = 31260, or 92.6%) are either onlya make, ally, or buy. We call these pure strategies.A minority of projects have a combination of two ormore announcement types. We call these mixed strate-gies. They amount to 7.4% (N = 262) of the announce-ments. Our subsequent analysis is divided into twoparts: first that of pure strategies within projects andthen that of mixed strategies within projects.
is positive definite, (2) the components of the covariance are con-structed as a correlation multiplied by the root of the product of thecomponents of the variance, and (3) the correlation is constrainedto be between −1 and 1.
Dow
nloa
ded
from
info
rms.
org
by [
128.
125.
208.
112]
on
08 A
pril
2014
, at 1
2:50
. Fo
r pe
rson
al u
se o
nly,
all
righ
ts r
eser
ved.

Borah and Tellis: Make, Buy, or Ally?Marketing Science 33(1), pp. 114–133, © 2014 INFORMS 125
Analysis of Pure Strategies Within ProjectsThis section presents the results of the descriptiveanalysis, choice analysis, and multivariate analysis ofpayoffs.
Descriptive Analysis. The descriptive statistics ofall variables are in Online Appendix D. At the firmlevel, on average, a firm in our sample has made5.3 makes, 6.6 buys, and 5 alliances. One-third ofthe firms (34%) predominantly use only one strategy.We define a predominant strategy as one used for 90%or more of a firm’s innovations. We find that for firmsthat have a predominant strategy, most use buys thanuse either makes or alliances: 23% of firms predom-inantly use buys, 5.5% of firms predominantly usemakes, and 4.9% of firms predominantly use alliances.Moreover, 68% of firms chose one announcement typefor more than 50% of its innovations. Thus, most firmstend to favor one of the three types.
Next we analyze the payoff from these pure strate-gies using the (−111) window. We use this win-dow because we can control for confounding eventsaround it. Table 4(a) shows the mean results of thepayoff from a make, buy, or ally. Note that the pay-off from a buy is strongly negative and significant,whereas that from a make or ally is strongly positiveand significant.
The first objection to these results is that they areacross all observations, including firms who use buyssparely and those who use them intensely. The argu-ment can be made that firms that use buys intenselymay be more adept at it and may be able to earnhigher returns. Table 4(b) shows the payoffs from buybased on the intensity of its use: firms that mainlybuy, moderately buy, minimally buy, and never buy.Note that the payoff is negative and significant bothfor firms that use buy moderately and for those thatmainly buy.
Table 4(a) Abnormal Returns to an Average Event by Strategy for4−11+15 Window
Strategy N Returns (%) Significance level
Make 441 0025 <0.01Buy 754 −0028 <0.05Ally 394 0032 <0.05
Table 4(b) Abnormal Returns to an Average Event by Strategy of Buyfor 4−11+15 Window
Buy Definition N Returns (%) Sig. level
Mainly buy Firms that use buys75%–100% of the time
361 −0009 <0.01
Moderately Firms that use buys 747 −001 <0.01buy 25%–74% of the time
Minimally Firms that use buys <25% of 462 0018 <0.01buy the time
Never buy Firms that do not use buys 19 1068 <0.05
Another objection to these results could be thatfirms that use a mixed strategy would do betterbecause they can combine the advantages of eachof these strategies: developing innovations internallywhen they have the expertise, allying where theylack expertise, and buying when allying and mak-ing are insufficient. Table 4(c) shows the mean payofffor mixed strategies. Note that mostly ally or mostlymake is better than any combination of make, buy,and ally.
The next objection could be that the above strate-gies do not take into account the relatedness and inno-vativeness of the target. Table 4(d) shows the payofffrom a buy under various conditions. Note that a buydoes best when the target is related or when the bene-fits to customers are high, or both. However, the mean
Table 4(c) Abnormal Returns to an Average Event by Strategy Groupfor 4−11+15 Window
Strategy Returnsgroup Definition N (%) Sig. level
Mostly ally Firms that use alliances>25% and use each of theother two types <25% ofthe time
74 1074 <0.01
Mostly make Firms that use makes >25%and use each of the othertwo types <25% of thetime
60 005 <0.01
Mostly make Firms that use makes andalliances >25% of the timeand use buys <25% of thetime
347 0019 <0.05
and ally
Mostly make Firms that use makes andbuys >25% of the timeand use alliances <25% ofthe time
241 0007 <0.05
and buy
Mostly triple play Firms that use each of thethree announcement types>25% of the time
234 −00001 <0.05
Mostly buy Firms that use buys >25% ofthe time and use each ofthe other two types <25%of the time
408 −0009 <0.05
Mostly buy Firms that use buys andalliances >25% of the timeand use makes <25% ofthe time
225 −0033 <0.05and ally
Table 4(d) Abnormal Returns to an Average Event by Condition of Buyfor 4−1, +15 Window
Condition Returns (%) Sig. level
Low relatedness −0060 <0.05High relatedness −0003 <0.05Low customer benefit −0053 <0.05High customer benefit −0001 <0.05
Note. We use median split to determine low and high relatedness/customerbenefit.
Dow
nloa
ded
from
info
rms.
org
by [
128.
125.
208.
112]
on
08 A
pril
2014
, at 1
2:50
. Fo
r pe
rson
al u
se o
nly,
all
righ
ts r
eser
ved.
Borah and Tellis: Make, Buy, or Ally?126 Marketing Science 33(1), pp. 114–133, © 2014 INFORMS
results even in these circumstances are negative. Thisanalysis indicates that even though a buy generallyyields negative returns, those returns can be mitigatedbut not eliminated by buying targets that are relatedand that have substantially better customer benefits.
A final objection could be that the above analysesare all descriptive and mostly univariate. They do nottake into account characteristics of the firm, selectivitybias in each strategy, and prior risk from the strate-gies. To control for these other factors, we proceedto the multivariate analysis of the payoff to strategiesconditioned on the multinomial analysis of the choiceof these strategies.
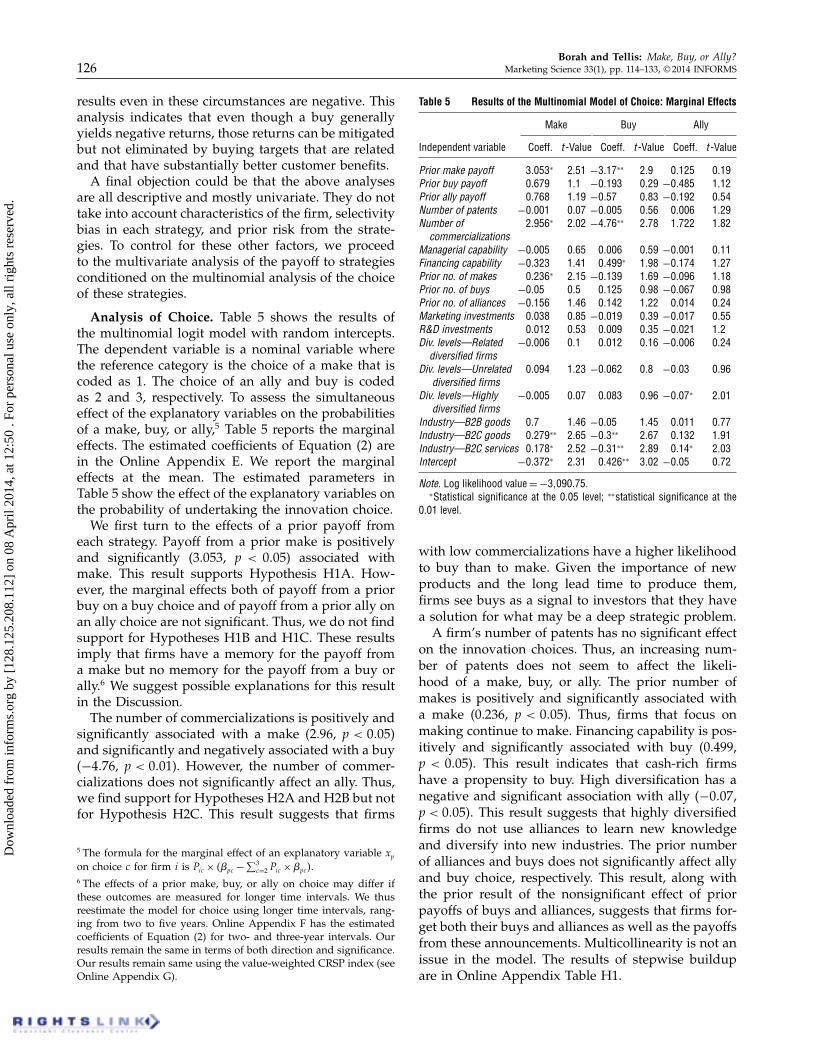
Analysis of Choice. Table 5 shows the results ofthe multinomial logit model with random intercepts.The dependent variable is a nominal variable wherethe reference category is the choice of a make that iscoded as 1. The choice of an ally and buy is codedas 2 and 3, respectively. To assess the simultaneouseffect of the explanatory variables on the probabilitiesof a make, buy, or ally,5 Table 5 reports the marginaleffects. The estimated coefficients of Equation (2) arein the Online Appendix E. We report the marginaleffects at the mean. The estimated parameters inTable 5 show the effect of the explanatory variables onthe probability of undertaking the innovation choice.
We first turn to the effects of a prior payoff fromeach strategy. Payoff from a prior make is positivelyand significantly (3.053, p < 0005) associated withmake. This result supports Hypothesis H1A. How-ever, the marginal effects both of payoff from a priorbuy on a buy choice and of payoff from a prior ally onan ally choice are not significant. Thus, we do not findsupport for Hypotheses H1B and H1C. These resultsimply that firms have a memory for the payoff froma make but no memory for the payoff from a buy orally.6 We suggest possible explanations for this resultin the Discussion.
The number of commercializations is positively andsignificantly associated with a make (2.96, p < 0005)and significantly and negatively associated with a buy(−4076, p < 0001). However, the number of commer-cializations does not significantly affect an ally. Thus,we find support for Hypotheses H2A and H2B but notfor Hypothesis H2C. This result suggests that firms
5 The formula for the marginal effect of an explanatory variable xpon choice c for firm i is Pic × 4�pc −
∑3c=2 Pic ×�pc5.
6 The effects of a prior make, buy, or ally on choice may differ ifthese outcomes are measured for longer time intervals. We thusreestimate the model for choice using longer time intervals, rang-ing from two to five years. Online Appendix F has the estimatedcoefficients of Equation (2) for two- and three-year intervals. Ourresults remain the same in terms of both direction and significance.Our results remain same using the value-weighted CRSP index (seeOnline Appendix G).
Table 5 Results of the Multinomial Model of Choice: Marginal Effects
Make Buy Ally
Independent variable Coeff. t-Value Coeff. t-Value Coeff. t-Value
Prior make payoff 30053∗ 2051 −3017∗∗ 209 00125 0019Prior buy payoff 00679 101 −00193 0029 −00485 1012Prior ally payoff 00768 1019 −0057 0083 −00192 0054Number of patents −00001 0007 −00005 0056 00006 1029Number of 20956∗ 2002 −4076∗∗ 2078 10722 1082
commercializationsManagerial capability −00005 0065 00006 0059 −00001 0011Financing capability −00323 1041 00499∗ 1098 −00174 1027Prior no. of makes 00236∗ 2015 −00139 1069 −00096 1018Prior no. of buys −0005 005 00125 0098 −00067 0098Prior no. of alliances −00156 1046 00142 1022 00014 0024Marketing investments 00038 0085 −00019 0039 −00017 0055R&D investments 00012 0053 00009 0035 −00021 102Div. levels—Related −00006 001 00012 0016 −00006 0024
diversified firmsDiv. levels—Unrelated 00094 1023 −00062 008 −0003 0096
diversified firmsDiv. levels—Highly −00005 0007 00083 0096 −0007∗ 2001
diversified firmsIndustry—B2B goods 007 1046 −0005 1045 00011 0077Industry—B2C goods 00279∗∗ 2065 −003∗∗ 2067 00132 1091Industry—B2C services 00178∗ 2052 −0031∗∗ 2089 0014∗ 2003Intercept −00372∗ 2031 00426∗∗ 3002 −0005 0072
Note. Log likelihood value = −31090075.∗Statistical significance at the 0.05 level; ∗∗statistical significance at the
0.01 level.
with low commercializations have a higher likelihoodto buy than to make. Given the importance of newproducts and the long lead time to produce them,firms see buys as a signal to investors that they havea solution for what may be a deep strategic problem.
A firm’s number of patents has no significant effecton the innovation choices. Thus, an increasing num-ber of patents does not seem to affect the likeli-hood of a make, buy, or ally. The prior number ofmakes is positively and significantly associated witha make (0.236, p < 0005). Thus, firms that focus onmaking continue to make. Financing capability is pos-itively and significantly associated with buy (0.499,p < 0005). This result indicates that cash-rich firmshave a propensity to buy. High diversification has anegative and significant association with ally (−0007,p < 0005). This result suggests that highly diversifiedfirms do not use alliances to learn new knowledgeand diversify into new industries. The prior numberof alliances and buys does not significantly affect allyand buy choice, respectively. This result, along withthe prior result of the nonsignificant effect of priorpayoffs of buys and alliances, suggests that firms for-get both their buys and alliances as well as the payoffsfrom these announcements. Multicollinearity is not anissue in the model. The results of stepwise buildupare in Online Appendix Table H1.
Dow
nloa
ded
from
info
rms.
org
by [
128.
125.
208.
112]
on
08 A
pril
2014
, at 1
2:50
. Fo
r pe
rson
al u
se o
nly,
all
righ
ts r
eser
ved.

Borah and Tellis: Make, Buy, or Ally?Marketing Science 33(1), pp. 114–133, © 2014 INFORMS 127
Table 6 Results of Regression Model of Payoff (Dependent Variable Is Returns)
Model without target value Model with target value
Independent variable Coeff. (%) z-stat Coeff. (%) z-stat
Buy indicator −2083∗∗ −3046 −4048∗∗ −4037Ally indicator 0016 0035 0010 0023Innovation relatedness −0003 −0067 −0002 −0054Customer benefit −0002 −0055 −0002 −0048Prior number of buys −1018 −104 −1033 −1064Buy indicator × Innovation relatedness 0016∗∗ 2066 0026∗∗ 3014Buy indicator × Customer benefit 0021∗ 2046 0031∗ 1096Buy indicator × Prior number of buys 1071∗ 1096 2029∗ 2009Marketing investments 0012 0084 0016 0087R&D investments 0005 0069 0004 0047Financing capability 0024 0025 1020 1005Diversification levels—Related diversified firms 0003 0015 −0004 −0017Diversification levels—Unrelated diversified firms 0000 −0002 −0007 −0033Diversification levels—Highly diversified firms −0020 −1015 −0029 −1026Prior risk to buy 0011 0046 0025 0074Prior risk to ally −0030 −0088 −0032 −0084Prior risk to make 0021 0067 0004 0012Emerging markets—Make 0017 0078 0029 0078Emerging markets—Buy −0031 −0084 −0030 −0082Emerging markets—Ally −0009 −0043 −0009 −0041Type of buy—Target’s product −0050 −1028 −0015 −0025Type of buy—Target’s software −0004 −0019 −0037 −0098Type of buy—Target’s research personnel −0058∗ −1099 −1090∗∗ −3015Type of buy—Target’s patent −0077 −1035 −0056 −0053Type of ally—Joint venture −0061 −1043 −0056 −1031Type of ally—Licensing agreement −0055 −0095 −0051 −0088Type of make—R&D center 0002 0004 0002 0004Type of make—New project −0005 −001 −0007 −0015Type of make—New entity −0035 −0086 −0036 −0089Industry—B2B goods −0046 −1042 −0052 −1012Industry—B2C goods −0058 −1073 −0069 −1056Industry—B2C services −0074∗ −1097 −0072 −1045Competition −0006 −0022 −0027 −0081Target value 0000 −106Intercept 1042 1089 1061 1083Fit statistics Overall R2: 0.043 Overall R2: 0.056N Make = 441, Buy = 754, Make = 441, Buy = 320,
Ally = 394 Ally = 394
Notes. Our results regarding the main effects and interactions remain the same when we impute the missing valueof the target value with the grand mean. Results of the propensity score matching, an alternative estimator, are inOnline Appendix I.
∗Statistical significance at the 0.05 level; ∗∗statistical significance at the 0.01 level.
Multivariate Analysis of Payoff. We pool the pay-offs from makes, buys, and alliances into a singlemodel to analyze their differences after controllingfor other independent variables (see Table 6). Forthis purpose, we estimate Equation (4) using a ran-dom effects model instead of the fixed effects modelbecause we cannot reject the null hypothesis thatthe random effects model is consistent and efficient7
(Hausman 1978). In this model, the coefficient of theincluded buy and ally indicators denote the differencein a payoff from a make (excluded level) after control-ling for all other effects. We include interactions of a
7 Hausman test: �2 value (33) = 31027, p-value = 005533.
buy with other independent variables to test whetherthese other effects vary by type of buy.
The coefficient of the buy indicator is negative andsignificant (−2083%, p < 0001; see Table 6). Thus, abuy leads to a negative and smaller payoff than amake even after controlling for all other variables,confirming the simple descriptive analysis. We findthat the coefficient of the interaction of the buy indi-cator and innovation relatedness is positive and sig-nificant (0.16%, p < 0001). This result indicates thatfirms can improve the payoff from a buy if the targetis related to it. Moreover, the coefficient of the inter-action of the buy indicator and customer benefit isfound to be positive and significant (0.21%, p < 0005).This indicates that firms can improve the payoff from
Dow
nloa
ded
from
info
rms.
org
by [
128.
125.
208.
112]
on
08 A
pril
2014
, at 1
2:50
. Fo
r pe
rson
al u
se o
nly,
all
righ
ts r
eser
ved.

Borah and Tellis: Make, Buy, or Ally?128 Marketing Science 33(1), pp. 114–133, © 2014 INFORMS
Table 7 Analysis of Mixed Strategies Within Projects
Make Buy Ally
Panel A: Average abnormal returnsa to subsequent announcements on event dayConditional on
Make comes first −0044% (N = 14) −0015% (N = 9) −0069% (N = 9)Buy comes first 0034% (N = 34) 0062% (N = 5) −0095% (N = 2)Ally comes first 0003% (N = 25) 0086% (N = 2) −0052% (N = 5)Mixed comes firstb 0046%∗ (N = 58) 0079% (N = 4) −0025% (N = 10)Total 0025%∗ (N = 131) 0033% (N = 20) −0051% (N = 26)
Panel B: Average abnormal returnsa to announcements on event dayProjects
All (pure and mixed) 0009%∗ (N = 11174) −0008%∗ (N = 11331) 0013%∗ (N = 11017)Pure only 0009%∗ (N = 11022) −001%∗ (N = 11276) 0014%∗ (N = 962)
Note. N is the number of announcements.aFor the (010) event window.bMixed strategy means two different types of announcements preceded the target announcement.∗Statistical significance at the 0.05 level; ∗∗statistical significance at the 0.01 level.
a buy if they buy targets with high customer benefits.We also find that the coefficient of the interaction ofthe buy indicator and prior number of buy is posi-tive and significant (1.71%, p < 0005), indicating thatfirms can achieve positive payoffs to buy if they haveprior buy experience. The finding that the coefficientof buying a target’s research personnel is negativeand significant (−0058%, p < 0005) indicates that firmsshould be wary of buying only research personnel,as integrating such personnel into the acquired firmmay be difficult because of the employee’s felt loss ofindependence.
As a robustness check, we include the amount paidto acquire the target in the regression model as it canaffect the buy payoff. For example, firms may paymore than the target was worth to them (Eccles et al.1999). We could only obtain the buy amount for 320of the 754 buys. Thus, we dropped 434 observations.Moreover, we could not calculate the acquisition pre-mium for more than 80% of the buys because either themarket value or the amount paid was not available.The results are in the two rightmost columns of Table 6and are similar to our main model. Multicollinearityis not an issue in the model. Results of the stepwisebuildup are in Online Appendix Table H2. We findsimilar results using propensity score matching, whichis an alternative to our modeling framework.
Analysis of Mixed Strategies Within ProjectsThe prior analysis deals entirely with pure strategiesof makes, buys, or alliances within a project. It couldbe argued that firms do best when they carry out amix of such announcements within a project. Do suchwithin-project mixed strategies fare better? We nextaddress this question.
Each announcement in our data belongs to a uniqueinnovation project. To identify mixed strategies, weneed to find what combinations of make, buy, and ally
were used for the same project. Also, to reduce leftcensoring8 in the identification of mixed strategies,we need to find out whether another announcementfor the same project preceded the announcements inour sampling window. We collect announcements for18 months before our main window of time sam-pling to reduce left censoring, at least to some extent.We then identify multiple makes, buys, and allianceswithin a project.
We find that in 7.4% of cases (262 announcements),firms did use some mixture of make, buy, and allywithin a single project. These 262 announcementsrelate to 87 projects. Within these 87 projects, we iden-tify strings of related announcements to make, buy,and ally. Note that, as far as the market is concerned,the first announcement in the string for a particu-lar project does not appear as a mixed strategy. Onlythe second, third, etc., announcements can be per-ceived as part of a mixed strategy. We next analyze thepayoffs from these subsequent announcements con-ditional on the first announcement within a project.We use the Fama–French Carhart model to calculatethe abnormal returns and report the abnormal returnsof the (010) window.
Table 7, panel A presents the number of announce-ments involving mixed strategies and the aver-age payoff from each combination. For any mixedstrategy—with one exception—we do not find thepayoff from subsequent announcements significantconditional on the first announcement. The one excep-tion is this: the payoff from a make is 0.46% (p < 0005,N = 58) when a mixed strategy comes first. Also, the
8 Here, we are concerned only about left censoring because the mar-ket would know about any announcements within a project priorto our sampling time. However, announcements after our samplingtime would be unknown to the market and would not affect returnswithin our sampling time.
Dow
nloa
ded
from
info
rms.
org
by [
128.
125.
208.
112]
on
08 A
pril
2014
, at 1
2:50
. Fo
r pe
rson
al u
se o
nly,
all
righ
ts r
eser
ved.

Borah and Tellis: Make, Buy, or Ally?Marketing Science 33(1), pp. 114–133, © 2014 INFORMS 129
last row of Table 7, panel A shows that when a makeis part of a mixed strategy, returns are significantlypositive and better than if a buy or ally were part ofthe mixed strategy.
Finally, we combine the pure strategies analyzedearlier with the mixed strategies analyzed here andpresent the results in Table 7, panel B. Note thatour primary descriptive results remain the samefor all strategies as for the pure strategies: namely,that makes and alliances yield significantly positivereturns, whereas buys yield significantly negativereturns (see Table 7, panel B).
We do not pool the mixed strategies with the purestrategies and redo the logit and regression analysisbecause the number of mixed strategies is relativelysmall, the main descriptive results do not change, andthe analysis of the pooled data becomes extremelycomplex as a result of the vast number of possiblecombinations.
DiscussionFirms constantly grapple with the question ofwhether to make, buy, or ally. They widely pursuethese strategies, spending trillions of dollars in theprocess. This study seeks to identify the pattern ofmake, buy, and ally announcements, the factors thatdrive this pattern, and the factors that drive the pay-off from such announcements. This section summa-rizes the findings, discusses some key issues, suggestsimplications for practice, and lists some limitations.
Summary of FindingsThe key findings of the study are the following:
• Make, buy, and ally are widely used as strate-gies to obtain innovations, but buy is the most preva-lent, followed by make and ally. Despite buy’s higherprevalence, make and ally generate a significantlypositive and much higher payoff than buy. Buy leadsto a significantly negative payoff of −0028%. Makeand ally have a significantly higher payoff than buyeven after controlling for several explanatory vari-ables, different estimation methods, and various com-binations of pure and mixed strategies.
• Firms do not use their prior payoffs from buy asa factor in their subsequent buy choice. However, theydo use their prior payoffs from make in their subse-quent make choice. This result suggests that firms donot have any memory of or “learn from” their priorpayoffs from buy but do remember or “learn” fromtheir prior payoffs from make.
• The number of commercializations of innova-tions is negative and significantly associated witha buy choice. This result suggests that firms buyto compensate for a low level of commercializa-tions rather than to complement a high level ofcommercializations.
• The negative returns to buy can be mitigatedif targets are related to acquirers and have highcustomer benefits and if acquirers have prior buyexperience.
Discussion of Key IssuesThis section addresses three key questions emergingfrom the results: Why are make and ally consistentlybetter than buy? Why do firms not learn from priorpayoffs from buy? Why do firms buy when they lackcommercializations?
Why Are Make and Ally Consistently Better ThanBuy? Buy does worse than make or ally for sev-eral reasons. First, make and ally are relativelymore reversible and flexible than buy. When firmsbuy, they incur high financial, management, andreputation costs. These costs increase the firm’s sep-aration pain, which translates to a potential lock-in (Kreutzer 2012). Second, compared with makeand ally, a buy has numerous post-acquisition prob-lems such as clash of cultures, difficulty of integra-tion, difficulty of employee retention (Nahavandi andMalekzadeh 1988, Hitt et al. 2009), and difficulty offull exploitation of target. For example, eBay couldnot make a profit from its $2.6 billion acquisition ofSkype in 2005, so it wrote off $1.4 billion 24 monthslater. Third, by the time a firm determines the targetis a good buy, many other firms also make a similardetermination, and the price of the target increasesto match or exceed its potential value. Fourth, a buyoften involves a bidding game with rivals, resultingin the winner’s curse (Varaiya and Ferris 1987).
Why Do Firms Not Learn from Prior Payoffs fromBuy? Firms may not learn from their prior payoffs forseveral reasons. First, firms might not consider pay-offs from buys because management might believethat the costs of not buying—before their rivals—canbe higher than the potential loss. Second, the absenceof commercializations may create pressure for firmsto buy. This pressure may lead firms to ignore ordownplay their prior buys that led to poor payoffs.Indeed, our result for prior commercializations showsthat firms tend to buy when they lack commercial-izations, even though the strategy seems not to payoff. These results suggest that firms see buys as aquick fix for what may be a deep strategic prob-lem (Tellis 2013). Third, both theoretical and empir-ical evidence show that more often than not, buysare followed by employee turnover in both the parentand the acquired firms (O’Shaughnessy and Flanagan1998, Krishnan and Park 2002, Krishnan et al. 2007).Thus, the memory for a buy may slowly die out.Fourth, managers may forget payoffs to prior buysbecause of their vested interests, such as compensa-tion, influence within the firm, and risk of unemploy-ment (Trautwein 1990, Hitt et al. 2009).
Dow
nloa
ded
from
info
rms.
org
by [
128.
125.
208.
112]
on
08 A
pril
2014
, at 1
2:50
. Fo
r pe
rson
al u
se o
nly,
all
righ
ts r
eser
ved.

Borah and Tellis: Make, Buy, or Ally?130 Marketing Science 33(1), pp. 114–133, © 2014 INFORMS
Why Do Firms Buy When They Lack Commercial-izations? A lack of commercializations may prompta buy for three reasons. First, commercializations arethe culmination and probably the most importantoutput of a firm’s innovation project. A firm’s futuregrowth and earnings depend on its commercializa-tions (Hauser et al. 2006). The lack of commercializa-tions exposes firms to a bleak future. For example,facing the absence of a good position in the mobiledevices market, Microsoft spent $7 billion to acquireNokia’s smartphone business, even though that firmwas a rapidly declining star and prior investment init had not borne fruit (Tellis 2013). Second, in a com-petitive marketplace, rivals and new entrants are con-stantly commercializing new products. The lack ofcommercializations puts the target firm at a growingdisadvantage. Third, in the absence of commercializa-tions, a buy may offer an immediate ownership of aportfolio of impending and completed commercializa-tions of new products.
Implications for ManagersThe findings of this study have six implications formanagers.
First, although make and ally have uncertain pay-offs in the distant future, firms should undertakemake and ally and announce these events becausethey lead to immediate positive returns on the stockmarket. In our study, the total dollar value for a makeis, on average, US$165 million, and the total dollarvalue for an ally is, on average, US$62 million.
Second, firms should take a hard look at buy,because this strategy leads to immediate negativereturns on the stock market for many reasons statedpreviously. In our study, the total dollar value for abuy is, on average, negative US$42 million.
Third, our results indicate that firms learn fromtheir past makes but not from their past buys. Sofirms should develop internal mechanisms to learnfrom their past experiences with makes, alliances,and buys. For example, even though HP lost out bypurchasing Palm for its mobile software (Steenkamp2013), it invested $11 billion in acquiring Autonomy(Worthen and Scheck 2013). Only 18 months later,HP wrote off $8.8 billion of that investment (Worthenand Scheck 2013). In additional analysis, we find thatthe average abnormal stock returns in the three-dayperiod surrounding HP’s three acquisition announce-ments of Compaq, EDS, and Palm is −10035%.In absolute dollar terms, HP lost, on average, approx-imately $6.6 billion dollars for these three buys. Day’s(1994, p. 44) quote nicely summarizes the situationfirms might find themselves in if they do not developadequate memory systems: “Organizations withoutpractical mechanisms to remember what has workedand why will have to repeat their failures and redis-cover their success formulas over and over again.”
Some successful acquirers are using innovative meth-ods to inquire about and capture the lessons fromtheir prior buys. A global industrial conglomerateuses a wiki-style “deal room” to discuss and storeprior acquisition processes (Heimeriks et al. 2008).
Fourth, if a buy is warranted, firms can maximizethe payoff if they acquire innovations related to theircurrent capabilities. When Nokia bought Sega.comin August 2003, Nokia had built substantial capa-bilities in multiplayer gaming. The relatedness ofSEGA’s innovation to Nokia allowed Nokia to garnerUS$540 million in the three-day window surroundingthe announcement.
Fifth, if a buy is warranted, firms can maximize thepayoff if they acquire innovations with high customerbenefit. Consider Parker Hannifin’s buy of Airtek inJanuary 2007. Airtek’s drying and filtration equip-ment for compressed air enabled Parker Hannifin’sglobal filtration business customers to enjoy a com-plete compressed-air treatment package from thecompressor to the point of use. The customer bene-fit of Airtek’s innovation allowed Parker Hannifin togarner US$319 million in the three-day window sur-rounding the announcement.
Sixth, firms can obtain higher payoffs from buysby developing acquisition experience. Experienceenables firms to learn from their prior successes andfailures (Levitt and March 1988). Consider the suc-cess of Cisco, which is attributed to its team ofwell-practiced executives and a well-tuned acqui-sition screening, selection, and integration process(Goldblatt 1999).
LimitationsThis study has several limitations that can be the basisof future research. First, we study the announcementsabout making, buying, and allying innovations—notthe events per se. Indeed, there could be events inthese strategies that are not announced. It is extremelychallenging and complicated to obtain informationabout each event of a make, buy, or ally and its out-come. So a stream of research in marketing, strategy,economics, and finance, does treat the announcementof a make, buy, or ally as equivalent to the event(see Table 1). Second, the data do not include firmsthat are not listed on the American stock exchanges.Future research might explore whether the sameresults hold for such firms. Third, we do not con-trol for confounding events as a result of competitors’activities. No previous studies in marketing, man-agement, and finance have controlled for competitorevents. Although this limitation increases the noisein the data, it does not bias any estimated coeffi-cient. Fourth, the primary driver for a make, buy orally may be the infeasibility of one or more of theother options. Although we do not explicitly model
Dow
nloa
ded
from
info
rms.
org
by [
128.
125.
208.
112]
on
08 A
pril
2014
, at 1
2:50
. Fo
r pe
rson
al u
se o
nly,
all
righ
ts r
eser
ved.

Borah and Tellis: Make, Buy, or Ally?Marketing Science 33(1), pp. 114–133, © 2014 INFORMS 131
this situation, we partly account for it by includ-ing prior choices and outcomes as independent vari-ables in current choices. Fifth, we assume the efficientmarket hypothesis (EMH) for our empirical analysis.We acknowledge that EMH accepts that the amountof publicly available information about a firm orproject can be limited and may vary across firmsand projects. Sixth, our measure of an ally includesstrategic alliances, joint ventures, and licensing agree-ments. This may be a good measure of an ally, butit is an imperfect measure of open innovation. Futureresearch should consider richer measures for openinnovation. Seventh, we do not know whether allthree alternatives appear in the firm’s considerationset while making the choice and whether the consid-eration set varies across decision points. Data limita-tions prevent us from measuring consideration sets.We assume that our panel of firms considers thesechoices at each point. Thus, our estimates may beconsidered conservative. All these remain promisingavenues for future research.
Supplemental MaterialSupplemental material to this paper is available at http://dx.doi.org/10.1287/mksc.2013.0818.
AcknowledgmentsThis project benefitted from a grant of Don Murray to theCenter for Global Innovation and from the research assis-tance of Julia Wang, Jessica Tosin, Tejas Bansod, and KevinWong. The authors thank the two anonymous reviewers,the associate editor, and the editor for their constructivecomments.
ReferencesBayus BL (2013) Crowdsourcing new product ideas over time: An
analysis of the Dell IdeaStorm community. Management Sci.59(1):226–244.
Bleeke J, Ernst D (2002) Is your strategic alliance really a sale?Faulkner D, ed. Strategy: Critical Perspectives on Business andManagement, Vol. 4 (Routledge, London), 214–226.
Booz & Company (2012) The 2012 Global Innovation 1000: Keyfindings. Report, Booz & Company, New York. http://www.booz.com/media/file/BoozCo_The-2012-Global-Innovation-1000-Media-Report.pdf.
Boulding W, Staelin R (1995) Identifying generalizable effects ofstrategic actions on firm performance: The case of demand-side returns to R&D spending. Marketing Sci. 14(3, Part 2):G222–G236.
Campbell JY, Lo AW, McKinley AC (1997) The Econometrics of Finan-cial Markets (Princeton University Press, Princeton, NJ).
Capron L, Mitchell W (2010) Finding the right path. Harvard Bus.Rev. 88(7–8):102–107.
Capron L, Mitchell W (2012) Build, Borrow, or Buy: Solving the GrowthDilemma (Harvard Business Press, Cambridge, MA).
Carhart MM (1997) On persistence of mutual fund performance.J. Finance 52(1):57–82.
Cefis E, Marsili O (2006) Survivor: The role of innovation in firms’survival. Res. Policy 35(5):626–641.
Chandy R, Hopstaken B, Narasimhan O, Prabhu J (2006) Frominvention to innovation: Conversion ability in product devel-opment. J. Marketing Res. 43(3):494–508.
Chen Y, Liu Y, Zhang J (2012) When do third-party productreviews affect firm value and what can firms do? The caseof media critics and professional movie reviews. J. Marketing76(2):116–134.
Chesbrough H (2003) Open Innovation: The New Imperative for Cre-ating and Profiting from Technology (Harvard Business SchoolPress, Boston).
Cisco Systems Canada Co. (2009) Build, buy or ally growthstrategies for business. Presentation by Joe Deklic, CiscoSystems Canada Co., Toronto. Accessed June 25, 2013, http://www.slideshare.net/CiscoCanada/build-buy-or-ally-growth-strategies-for-business.
Cohen WM, Levinthal DA (1989) Innovation and learning: The twofaces of R&D. Econom. J. 99(397):569–596.
Cyert RM, March JG (1963) A Behavioral Theory of the Firm (Prentice-Hall, Englewood Cliffs, NJ).
Day GS (1994) The capabilities of market-driven organizations.J. Marketing 58(October):37–52.
Doukas J, Switzer L (1992) The stock market’s valuation of R&Dspending and market concentration. J. Econom. Bus. 44(2):95–114.
Dyer JH, Kale P, Singh H (2004) When to ally and when to acquire.Harvard Bus. Rev. 82(7–8):109–115.
Eccles RG, Lanes KL, Wilson TC (1999) Are you paying too muchfor that acquisition? Harvard Bus. Rev. 77(4):136–146.
Elberse A (2007) The power of stars: Do star actors drive the successof movies? J. Marketing 71(4):102–120.
Erickson G, Jacobson R (1992) Gaining comparative advantagethrough discretionary expenditures: The returns to R&D andadvertising. Management Sci. 38(9):1264–1279.
Fama EF (1991) Efficient capital markets: II. J. Finance 46(5):1575–1617.
Fama EF (1998) Market efficiency, long-term returns, and behav-ioral finance. J. Finance 49(3):283–306.
Fama EF, French KR (1993) Common risk factors in the returns onstocks and bonds. J. Financial Econom. 33(1):3–56.
Fama EF, Fisher L, Jensen MC, Roll R (1969) The adjustment of stockprices to new information. Internat. Econom. Rev. 10(1):1–21.
Fang E, Palmatier RW, Steenkamp JBE (2008) Effect of service tran-sition strategies on firm value. J. Marketing 72(5):1–14.
Geyskens I, Gielens K, Dekimpe MG (2002) The market valuationof Internet channel additions. J. Marketing 66(2):102–119.
Geyskens I, Steenkamp J-BEM, Kumar N (2006) Make, buy, or ally:A transaction cost theory meta-analysis. Acad. Management J.49(3):519–543.
Goldblatt H (1999) Forty-two acquisitions and counting: Cisco’ssecrets. Fortune 140(9):177–184.
Golder P (2000) Historical method in marketing research with newevidence on long-term market share stability. J. Marketing Res.37(2):156–172.
Golder P, Tellis GJ (1993) Pioneering advantage: Marketing fact ormarketing legend. J. Marketing Res. 30(May):158–170.
Gomes-Casseres B (2000) Alliances and risk: Securing a place in thevictory parade. Financial Times (May 9) 6–7.
Greene WH (2003) Econometric Analysis, 5th ed. (Prentice-Hall,Upper Saddle River, NJ).
Greve HR (2003) Organizational Learning from Performance Feedback:A Behavioral Perspective on Innovation and Change (CambridgeUniversity Press, Cambridge, UK).
Dow
nloa
ded
from
info
rms.
org
by [
128.
125.
208.
112]
on
08 A
pril
2014
, at 1
2:50
. Fo
r pe
rson
al u
se o
nly,
all
righ
ts r
eser
ved.

Borah and Tellis: Make, Buy, or Ally?132 Marketing Science 33(1), pp. 114–133, © 2014 INFORMS
Griffin A (2002) Product development cycle time for business-to-business products. Indust. Marketing Management 31(2):291–304.
Hagel J III, Brown JS (2011) Creation nets: Harnessing the potentialof open innovation. J. Service Sci. 1(2):27–40.
Haleblian J, Kim J-Y, Rajagopalan N (2006) The influence of acqui-sition experience and performance on acquisition behavior:Evidence from the U.S. commercial banking industry. Acad.Management J. 49(2):357–370.
Hall BH, Jaffe A, Trajtenberg M (2005) Market value and patentcitations. RAND J. Econom. 36(1):16–38.
Hauser J, Tellis GJ, Griffin A (2006) Research on innovation:A review and agenda for Marketing Science. Marketing Sci. 25(6):687–717.
Hausman J (1978) Specification tests in econometrics. Econometrica46(6):1273–1291.
Heimeriks K, Gates S, Zollo M (2008) The secrets of successfulacquisitions. Wall Street Journal (September 22) http://online.wsj.com/news/articles/SB122160059703944839.
Hitt MA, Hoskisson RE, Johnson RA, Moesel DD (1996) The marketfor corporate control and firm innovation. Acad. Management J.39(5):1084–1119.
Hitt MA, King D, Krishnan H, Makri M, Schijven M, ShimizuK, Zhu H (2009) Mergers and acquisitions: Overcoming pit-falls, building synergy and creating value. Bus. Horizons52(6):523–529.
Jensen MC (1986) The agency costs of free cash flow: Corporatefinance and takeovers. Amer. Econom. Rev. 76(2)323–329.
Joshi AM, Hanssens DM (2009) Movie advertising and the stockmarket valuation of studios: A case of “great expectations?”Marketing Sci. 28(2):239–250.
Kanter RM (1999) From spare change to real change: The socialsector as beta site for business innovation. Harvard Bus. Rev.77(3):123–132.
Karniouchina EV, Uslay C, Erenburg G (2011) Do marketing mediahave life cycles? The case of product placement in movies.J. Marketing 75(3):27–48.
Kelm KM, Narayanan VK, Pinches GE (1995) Shareholder valuecreation during R&D innovation and commercialization stages.Acad. Management J. 38(3):770–786.
Kengelbach J, Klemmer DC, Roos A (2012) How M&A can growportfolio value: Plant and prune. bcg.perspectives (August 31)https://www.bcgperspectives.com/content/articles/mergers_acquisitions_divestitures_plant_and_prune_m_and_a_2012/.
Kessler EH, Chakrabarti AK (1996) Innovation speed: A conceptualmodel of context, antecedents, and outcomes. Acad. Manage-ment Rev. 21(4):1143–1191.
King DR, Dalton DR, Daily CM, Covin JG (2004) Meta-analyses ofpost-acquisition performance: Indications of unidentified mod-erators. Strategic Management J. 25(2):187–200.
Kreutzer M (2012) Selecting the right growth mechanism: Thechoice between internal development, strategic alliances, andmergers and acquisitions. Mennillo G, Schlenzig T, Friedrich E,eds. Balanced Growth: Finding Strategies for Sustainable Develop-ment (Springer, Berlin), 77–94.
Krishnan HA, Park D (2002) The impact of work force reductionon subsequent performance in major mergers and acquisitions:An exploratory study. J. Bus. Res. 55(4):285–292.
Krishnan HA, Hitt MA, Park D (2007) Acquisition premiums,subsequent workplace reductions and post-acquisition perfor-mance. J. Management Stud. 44(5):709–732.
Kuss O, McLerran D (2007) A note on the estimation of the multino-mial logistic model with correlated responses in SAS. Comput.Methods Programs Biomedicine 87(3):262–269.
Lev B (2001) Intangibles—Management, Measurement and Reporting(Brookings Institution Press, Washington, DC).
Levitt B, March JG (1988) Organizational learning. Annual Rev.Sociol. 14:319–338.
Lichtenthaler U (2011) Open innovation: Past research, currentdebates, and future directions. Acad. Management Perspect.25(1):75–93.
Luo X (2009) Quantifying the long-term impact of negative wordof mouth on cash flows and stock prices. Marketing Sci. 28(1):148–165.
March JG (1981) Footnotes to organizational change. Admin. Sci.Quart. 26(4):563–577.
Mayer D, Kenney M (2004) Ecosystems and acquisition man-agement: Understanding Cisco’s strategy. Indust. Innovation11(4):299–326.
Miller D, Chen MJ (1994) Sources and consequences of competitiveinertia: A study of the U.S. airline industry. Admin. Sci. Quart.39(1):1–23.
Mizik N, Jacobson R (2003) Trading off between value creationand value appropriation: The financial implications of shifts instrategic emphasis. J. Marketing 67(1):63–76.
Nahavandi A, Malekzadeh AR (1988) Acculturation in mergers andacquisitions. Acad. Management Rev. 13(1):79–90.
Nakamura L (2001) What is the US gross investment in intangi-bles? (At least) one trillion dollars a year! Working Paper 01-15,Federal Reserve Bank of Philadelphia, Philadelphia.
O’Shaughnessy KC, Flanagan DJ (1998) Determinants of layoffannouncements following M&As: An empirical investigation.Strategic Management J. 19(10):989–999.
Parkhe A (1993) Strategic alliance structuring: A game theoretic andtransaction cost examination of interfirm cooperation. Acad.Management J. 36(4): 794–829.
Prabhu J, Rajesh C, Mark E (2005) Acquisition and innovation inhigh-tech firms: Poison pill, placebo, or tonic? J. Marketing 69(1):114–130.
Ranft AL, Lord MD (2000) Acquiring new knowledge: The roleof retaining human capital in acquisitions of high-tech firms.J. High Tech. Management Res. 11(2):295–319.
Rothaermel FT, Hess AM (2010) Innovation strategies combined.MIT Sloan Management Rev. 51(3):13–15.
Sharpe WF (1964) Capital asset prices: A theory of market equilib-rium under conditions of risk. J. Finance 19(3):425–442.
Sood A, Tellis GJ (2009) Do innovations really payoff? Total stockmarket returns to innovation. Marketing Sci. 28(3):442–456.
Sorescu A, Chandy R, Prabhu J (2007) Why some acquisitions dobetter than others: Product capital as a driver of long-termstock returns. J. Marketing Res. 44(1):56–72.
Srinivasan R, Bharadwaj S (2004) Event studies in marketingstrategy research. Moorman C, Lehmann DR, eds. AssessingMarketing Strategy Performance (Marketing Science Institute,Cambridge, MA), 9–28.
Srinivasan S, Hanssens DM (2009) Marketing and firm value: Met-rics, methods, findings, and future directions. J. Marketing Res.46(3):293–312.
Srinivasan R, Lilien GL, Sridhar S (2011) Should firms spend moreon research and development and advertising during reces-sions? J. Marketing 75(3):49–65.
Steenkamp N (2013) HP regrets Palm acquisition. HumanIPO(June 12) http://www.humanipo.com/news/6550/hp-regrets-palm-acquisition/.
Swaminathan V, Moorman C (2009) Marketing alliances, firm net-works, and firm value creation. J. Marketing 73(5):52–69.
Szulanski G (1996) Exploring internal stickiness: Impediments tothe transfer of best practice within the firm. Strategic Manage-ment J. 17(Winter special issue):27–42.
Tellis GJ, Johnson J (2007) The value of quality. Marketing Sci. 26(6):758–773.
Dow
nloa
ded
from
info
rms.
org
by [
128.
125.
208.
112]
on
08 A
pril
2014
, at 1
2:50
. Fo
r pe
rson
al u
se o
nly,
all
righ
ts r
eser
ved.

Borah and Tellis: Make, Buy, or Ally?Marketing Science 33(1), pp. 114–133, © 2014 INFORMS 133
Tellis GJ (2013) Microsoft and Nokia: A marriage made inhell? Forbes (September 4) http://www.forbes.com/sites/forbesleadershipforum/2013/09/04/microsoft-and-nokia-a-marriage-made-in-hell/.
Tirunillai S, Tellis GJ (2012) Does chatter really matter? Dynamics ofuser-generated content and stock performance. Marketing Sci.31(2):198–215.
Trautwein F (1990) Merger motives and merger prescriptions.Strategic Management J. 11(4):283–295.
Varadarajan PR, Ramanujam V (1987) Diversification and per-formance: A reexamination using a new two-dimensionalconceptualization of diversity in firms. Acad. Management J.30(2):380–393.
Varaiya NP, Ferris KR (1987) Overpaying in corporate takeovers:The winner’s curse. Financial Analysts J. 43(3):64–70.
Verbeek M, Nijman T (1992) Testing for selectivity bias in paneldata models. Internat. Econom. Rev. 33(3):681–703.
West J, Vanhaverbeke W, Chesbrough H (2006) Open innovation:A research agenda. Chesbrough H, Vanhaverbeke W, West J,
eds. Open Innovation: Researching a New Paradigm (Oxford Uni-versity Press, Oxford, UK), 285–307.
Wiles MA, Morgan NA, Rego LL (2012) The effect of brand acqui-sition and disposal on stock returns. J. Marketing 76(1):38–58.
Wiles MA, Jain SP, Mishra S, Lindsey C (2010) Stock marketresponse to regulatory reports of deceptive advertising: Themoderating effect of omission bias and firm reputation. Mar-keting Sci. 29(5):828–845.
Williamson OE (1975) Markets and Hierarchies: Analysis and AntitrustImplications (Free Press, New York).
Wooldridge JM (1995) Selection corrections for panel data modelsunder conditional mean independence assumptions. J. Econo-metrics 68(1):115–132.
Worthen B, Scheck J (2013) Inside H-P’s missed chance to avoid adisastrous deal. Wall Street Journal (January 21) http://online.wsj.com/news/articles/SB10001424127887323635504578211743521976174.
Ybarra CE, Turk TA (2011) Strategic alliances with competing firmsand shareholder value. J. Management Marketing Res. 6(January).http://www.aabri.com/manuscripts/10565.pdf.
Dow
nloa
ded
from
info
rms.
org
by [
128.
125.
208.
112]
on
08 A
pril
2014
, at 1
2:50
. Fo
r pe
rson
al u
se o
nly,
all
righ
ts r
eser
ved.