major winter weather events during the 2013-2014 cold season · the winter weather season ended...
TRANSCRIPT
1
Major Winter Weather Events during the 2013-2014 Cold Season
Michael S. Ryan1, Amanda Fanning, Mary Beth Gerhardt, Kwan-Yin Kong, Jason Krekeler, Allison Santorelli, Richard Otto, Frank J. Pereira, Brendon
Rubin-Oster
NOAA/NWS/Weather Prediction Center, College Park, MD
1 Corresponding author address: Michael S. Ryan, NOAA/NWS/Weather Prediction Center, 5830 University Research Court, College Park, MD 20740; email: [email protected]

2
Abstract:
The 2013-2014 cold season was marked by numerous winter storms and frequent, sustained
outbreaks of Arctic air. A persistent upper-level trough remained in place through much of the
season south of Hudson Bay, while upper-level ridging largely remained in place across the
eastern north Pacific and the Gulf of Alaska. Seasonal low-level temperature anomalies of -1 to -
4°C were observed across much of the north central and northeastern U.S., giving rise to public
awareness of ‘the polar vortex’. Seasonal snowfall was above average across many of the same
areas, and below average across much of the western U.S. Nineteen notable winter storms across
the contiguous U.S. were documented, producing a total of 32 fatalities, 9 injuries, and $263
million in damage. The five most substantial of these storms, based on damage and casualty data,
are detailed in this article.

3
1. Introduction
Winter storms cause millions of dollars in damage and disrupt countless lives across the
United States every year. They directly cause an average of 25 deaths in the U.S. each year
(2003-2013 average), with an additional 27 deaths each year caused by cold temperatures
(National Weather Service (NWS) Natural Hazard Statistics 2014). Winter storms produce a
variety of precipitation including snow, sleet, and freezing rain, often with high winds, extreme
cold, and coastal flooding in addition to the precipitation. Some parts of the U.S. are more
prepared than others, and thus the impact of winter storms varies widely by region. Winter storm
activity varies from year to year, in connection with large-scale atmospheric phenomena such as
the North Atlantic Oscillation (NAO), Arctic Oscillation (AO), and El Nino-Southern Oscillation
(ENSO).
The Weather Prediction Center provides winter storm specific forecasts for the U.S.
These include quantitative precipitation forecasts (QPF), probabilistic heavy precipitation (rain,
snow, freezing rain) forecasts, and forecast tracks of surface cyclones associated with winter
weather. The WPC also issues Storm Summary products for high-impact winter weather events
that affect multiple NWS county warning areas, commerce and transportation, and are likely to
attract media attention. Storm Summaries contain information on the current location and
intensity of a storm system, a summary of rain and snowfall accumulations, and a short term
forecast for the storm system.
The purpose of this article is to provide an overview of the 2013-2014 cold season (Sep
15 – May 15), and a selection of the most notable winter weather events. Section two of the
article describes the data used as well as the method for choosing which storms warranted the
inclusion of a detailed description in this article. Section three of the article provides a seasonal

4
overview of the large scale patterns that affected North America during the cold season. Section
four of the article discusses the individual details of the most substantial winter storms of the
cold season. Finally, a summary is given in section five. Table 1 at the end of the article
summarizes all the notable winter weather events for the season, including those that were, for
brevity, not included in this article. Details on most of these other events, including their
associated storm track overview images, can be found on the WPC website
(http://www.wpc.ncep.noaa.gov) under the “Event Review” section.
2. Datasets
NCEP/NCAR Reanalysis data (Kalnay et al. 1996) were used to create the seasonal
anomaly graphics referenced in section three. Snowfall analyses shown are interpolated snow
analyses from the National Operational Hydrologic Remote Sensing Center (NOHRSC). The
NOHRSC analyses are created using observed snowfall data received in SHEF (Standard
Hydrometeorological Exchange Format) over AWIPS (Advanced Weather Interactive Processing
System) (NOHRSC 2005). The data are then interpolated temporally using preprocessed
RADAR (Radio Detection and Ranging) data (Stage II) as well as spatially using a weighting
function (NOHRSC 2005). Snowfall data are not interpolated above 500 m in elevation in the
eastern U.S. and above 1750 m in the western U.S. In northern Idaho, Washington, and Oregon
snowfall data are not interpolated above 800 m. For further details on the data assimilation and
interpolation schemes used in the NOHRSC snowfall analyses the reader is referred to NOHRSC
2005. Data for the North Atlantic Oscillation, Arctic Oscillation, and Pacific-North America
Index plot are taken from the NOAA Climate Prediction Center (CPC) archive.
The five most substantial winter weather events of the season were chosen for inclusion
in this article, based on monetary damage amounts and the numbers of deaths and/or injuries
5
directly attributed to the event (Table 1). Monetary damage and casualty data included in this
article were taken from the official NWS Storm Data publication, Storm Data and Unusual
Weather Phenomena (www.ncdc.noaa.gov/oa/climate/sd). Societal impact scales such as the
Northeast Snowfall Impact Scale (NESIS, Kocin and Ucellini 2004) and Regional Snowfall
Index (RSI, Squires et al. 2011) scales were considered, but for the purposes of this article
official monetary damage amounts and deaths were chosen as a broader measure of impacts.
3. Seasonal Overview
The 2013-2014 winter weather season was a very active one for most of the contiguous
U.S. The season was marked by numerous outbreaks of Arctic air across much of the central and
eastern U.S., giving rise to media and public awareness of ‘the polar vortex’. Overall, areas of
the Midwest, Mid-Atlantic, Northeast, and the Pacific Northwest received above average
snowfall for the season, while much of the interior western U.S. received below average
snowfall. The season began early and intensely with a blizzard in the northern Rockies and
northern High Plains in early October 2013, which produced 3 to 4 feet of snow in some areas.
The winter weather season ended late in some of the same areas, with a winter storm striking
portions of the central Rockies and western High Plains in mid-May 2014.
The large-scale pattern was remarkably stable throughout most of the cold season, with
upper-level ridging in place across the eastern North Pacific and western North America, and a
persistent upper-level low in place south of Hudson Bay, as indicated by 500 hPa geopotential
height seasonal anomalies (Fig. 1). The persistence of this large-scale pattern throughout most of
the season allowed for numerous intrusions of Arctic air from the high latitudes of Canada into
the central and eastern United States. The North Atlantic Oscillation (NAO, Barnston and
Livezey, 1987) and the Arctic Oscillation (AO, Thompson and Wallace, 1998) were
6
predominantly positive throughout most of the season (Fig. 2). The Pacific-North America
(PNA, Barnston and Livezey, 1987) index was negative throughout much of the season, but was
strongly positive during January. During this period of positive PNA (aligned with a period of
negative AO), the intensity of the ridge along the West Coast allowed for the most intense cold
air outbreaks of the season, and a period of frequent winter storms across the central and eastern
U.S.
250 hPa wind speed anomalies (Fig. 3) show two distinct jets – a Polar jet extending
from northwestern Canada into the north central and northeastern U.S., and a weaker Subtropical
jet extending from near Hawaii into the southwestern and south central U.S. before eventually
merging with the polar stream across the Mid-Atlantic and the Northeast. These 250 hPa wind
speed anomalies are suggestive of the predominant storm tracks for the season, as well as
indicating the prospect of frequent phasing of northern and southern stream systems along the
U.S. East Coast. The average storm tracks for the season are corroborated by viewing the 700
hPa relative humidity anomalies (Fig. 4), which suggest anomalously high 700 hPa relative
humidity values from the eastern Pacific into the southeastern U.S. and across the northern plains
and Great Lakes.
The intensity and duration of Arctic outbreaks across the central and eastern U.S. are
evident from seasonal 850 hPa temperature anomalies (Fig. 5). Anomalies of -4 to -5 °C,
representing the core of the anomalously cold air, were centered southwest of Hudson Bay, with
anomalies of -1 to -4 °C common across much of the central and eastern U.S.
4. Most Notable Winter Weather Events of the Season
a. Southern plains to Ohio valley winter storm (5-7 December, 2013)
1) Meteorological Overview

7
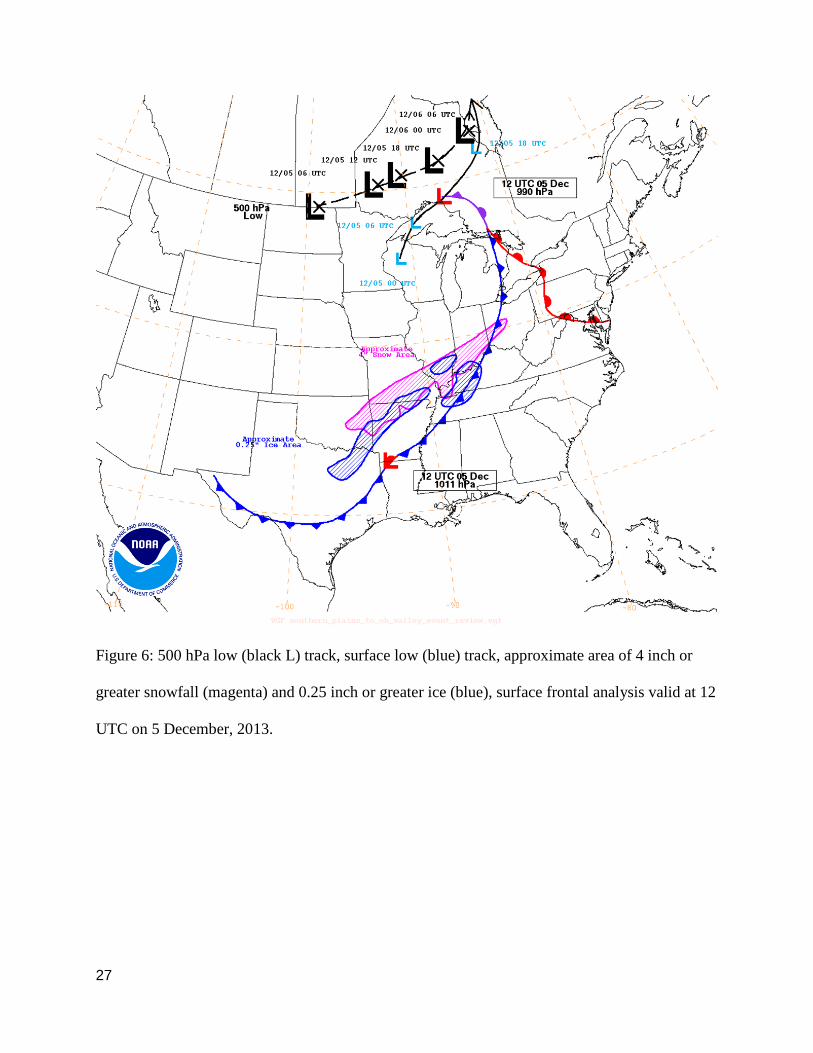
Late on 4 December into early 5 December, a 500 hPa low developed near the North
Dakota-Canada border and tracked northeastward, reaching northern Ontario by late on 5
December (Fig. 6). South of the low a positively tilted upper-level trough extended back into the
Southwest. Embedded within the base of this broader trough, a shortwave trough moved across
the Southwest on 5 December into early 6 December before reaching the southern plains later in
the day.
During the evening of 4 December as the upper-level low formed and tracked to the
northeast, a surface low tracked from the Upper Midwest through the Upper Great Lakes into
southern Ontario by the morning of 5 December. A trailing cold front extended back through the
Ohio valley into the lower Mississippi valley and southern plains early on 5 December. This
front progressed farther to the south and east, reaching south Texas and the western Gulf Coast
by that evening. Temperatures fell sharply behind the front. High temperatures on 5 December
were below freezing in many areas across Oklahoma, northwest Arkansas and north Texas. On 6
December temperatures remained near or below freezing from central Texas to Ohio – 10 to
15°C below average for parts of the region and a stark contrast to the 15-20°C above average
temperatures that were observed earlier in the week.
As the low-level winds increased ahead of the aforementioned shortwave trough moving
through the Southwest, moisture from the Gulf of Mexico was advected north of the front. A
weak surface low developed along the front and further enhanced the warm air and moisture
advection east of the low track, while furthering the cold air advection to its southwest. In
response to the enhanced warm air and moisture advection, precipitation began to develop on 5
December across north Texas, Oklahoma, Arkansas, southern Missouri and the Ohio valley.
Moderate to locally heavy precipitation developed and continued into 6 December from

8
northeastern Texas and eastern Oklahoma into the Ohio valley as this moisture interacted with an
area of strong low-level frontogenesis and upper-level divergence along the right-entrance region
of an upper-level jet maximum.
Widespread snow accumulations of 4 inches, with local amounts of up to 13 inches, were
observed from eastern Oklahoma to central Ohio (Fig. 7). South of the heavier snow
accumulations, a wintry mix was reported, with sleet amounts of 1-3 inches recorded across parts
of northeastern Texas, eastern Oklahoma, northern and central Arkansas and southeastern
Missouri. Freezing rain, with ice accumulations greater than 0.25 inch, was reported across
portions of northeastern Texas, southwestern Oklahoma, western Arkansas, western and central
Tennessee, western and central Kentucky and southern Indiana and Illinois. Ice accumulations in
excess of one inch occurred in some areas.
2) Impacts
Hundreds of thousands lost power due to the storm across the southern plains and
portions of the Mississippi River valley. In North Texas alone, a quarter-million customers were
left without power, causing many businesses to close. The weather also forced more than 1,000
cancellations at Dallas-Fort Worth International airport – one of the nation’s busiest airports.
The Dallas Marathon, scheduled for the following Sunday and expected to draw 25,000 runners,
was cancelled due to the storm’s impacts. Total monetary damage of $81.1 million was reported
for this event (making this event the most costly of the season), the large majority of which was
due to excessive ice accumulations. One fatality was directly attributed to the event in Arkansas
when a large limb weighed down by ice fell on a camping trailer, killing the occupant.
b. Southern plains to Northeast winter storm (20-23 December, 2013)
1) Meteorological Overview
9
An expansive and long-lived winter weather event affected areas from the southern plains
to the Northeast from 20-23 December, 2013 (Fig. 8). At 12 UTC on 20 December, a quasi-
stationary Arctic surface frontal boundary extended from the middle Mississippi valley eastward
into northern New England. Across the central and southern plains, the Arctic front continued to
move southward as a cold front. At this time, weak overrunning, resulting from 30 knot moist
southwesterly flow at 850 hPa crossing the surface front across the Great Lakes and the
Northeast, was causing scattered light snow, sleet, and freezing rain in the cold air north of the
front. Concurrently, a vigorous and slow-moving mid/upper-level low from the Pacific was
moving into northern Baja California. This feature would be responsible for the main event as it
moved east over the coming days.
By 00-12 UTC on 21 December, as the mid/upper-level low and the associated surface
low pressure system moved east, strengthening low-level southerly flow encountered the Arctic
surface front across Texas, and resulted in the formation of an area of overrunning precipitation,
which became larger and heavier over time, encompassing much of the southern and central
plains and Ohio valley by 12 UTC. Precipitation in this large area fell as a mix of rain, sleet, and
freezing rain. The very warm and moist air mass south of the Arctic front resulted in the
formation of convective elements which became elevated as they moved across the front and
above the shallow Arctic air. These elevated convective elements resulted in areas of very heavy
sleet and freezing rain accumulations across portions of the southern and central plains.
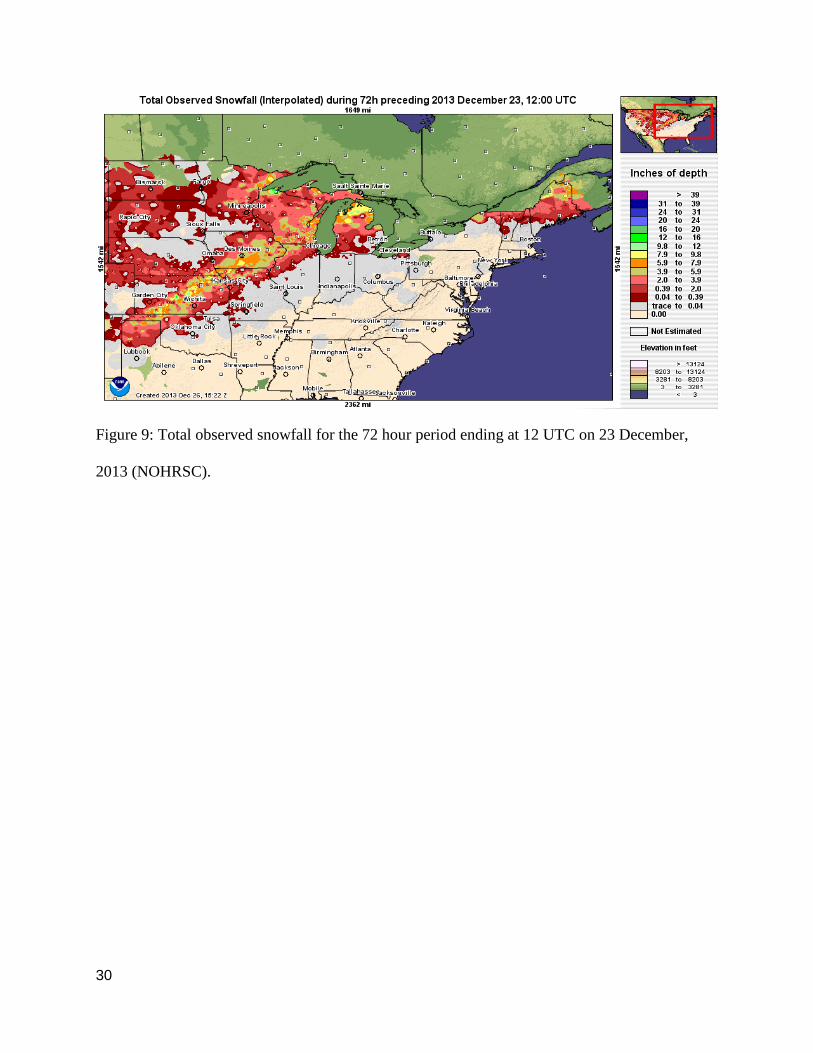
Additionally, a band of heavy snow from northern Texas to Iowa resulted in 6 to 12 inches of
snow, with amounts as high as 15 inches in Kansas (Fig. 9).
During the day on 21 December the precipitation continued to expand across the Ohio
valley and into the Northeast as low-level flow crossing the Arctic surface front continued to
10
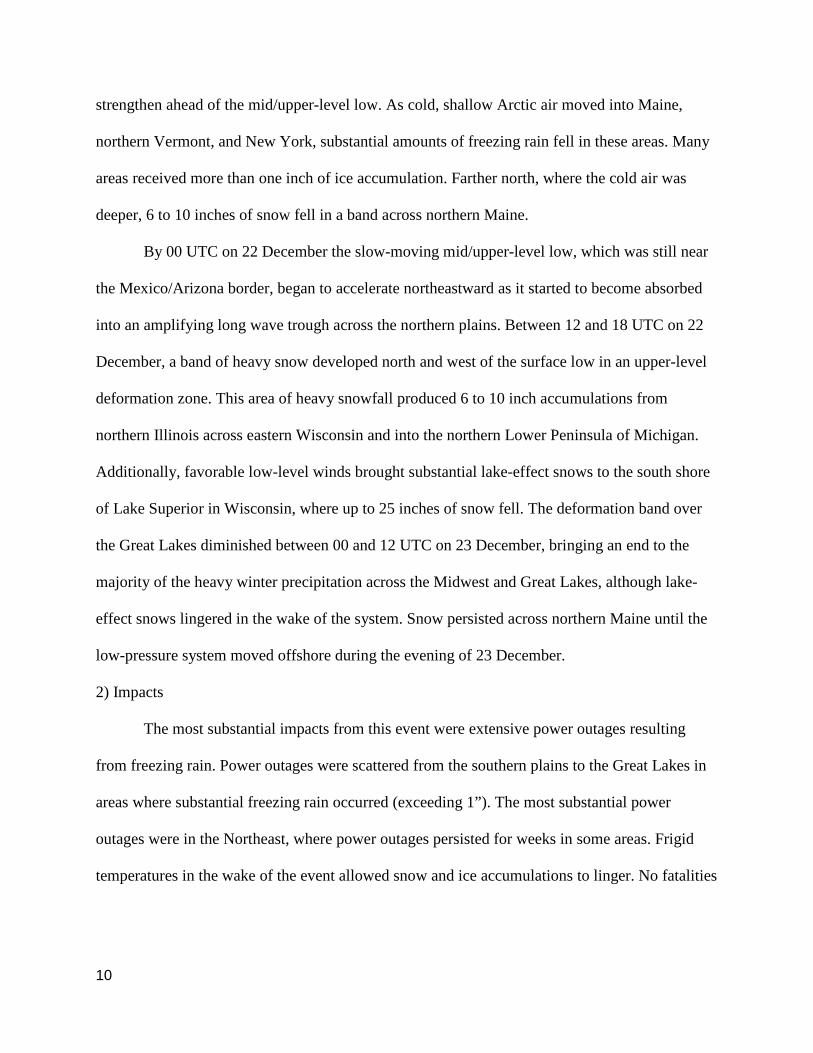
strengthen ahead of the mid/upper-level low. As cold, shallow Arctic air moved into Maine,
northern Vermont, and New York, substantial amounts of freezing rain fell in these areas. Many
areas received more than one inch of ice accumulation. Farther north, where the cold air was
deeper, 6 to 10 inches of snow fell in a band across northern Maine.
By 00 UTC on 22 December the slow-moving mid/upper-level low, which was still near
the Mexico/Arizona border, began to accelerate northeastward as it started to become absorbed
into an amplifying long wave trough across the northern plains. Between 12 and 18 UTC on 22
December, a band of heavy snow developed north and west of the surface low in an upper-level
deformation zone. This area of heavy snowfall produced 6 to 10 inch accumulations from
northern Illinois across eastern Wisconsin and into the northern Lower Peninsula of Michigan.
Additionally, favorable low-level winds brought substantial lake-effect snows to the south shore
of Lake Superior in Wisconsin, where up to 25 inches of snow fell. The deformation band over
the Great Lakes diminished between 00 and 12 UTC on 23 December, bringing an end to the
majority of the heavy winter precipitation across the Midwest and Great Lakes, although lake-
effect snows lingered in the wake of the system. Snow persisted across northern Maine until the
low-pressure system moved offshore during the evening of 23 December.
2) Impacts
The most substantial impacts from this event were extensive power outages resulting
from freezing rain. Power outages were scattered from the southern plains to the Great Lakes in
areas where substantial freezing rain occurred (exceeding 1”). The most substantial power
outages were in the Northeast, where power outages persisted for weeks in some areas. Frigid
temperatures in the wake of the event allowed snow and ice accumulations to linger. No fatalities

11
or injuries were directly attributed to the event. Monetary damage amounts of $54.6 million were
reported, primarily the result of heavy ice accumulations.
c. Central and eastern U.S. winter storm and Arctic outbreak (4-7 January, 2014)
1) Meteorological Overview
A major winter storm impacted much of the middle Mississippi and Ohio valleys and the
Great Lakes during the first week of 2014. The multi-day snowfall event commenced late in the
morning on 4 January, along a nearly stationary frontal zone extending from northern Missouri
through the Upper Great Lakes. Precipitation began as light snowfall, the result of relatively
weak vertical motion and an atmosphere that was relatively dry. Eventually warm air advection
began to increase ahead of a southern stream shortwave moving through southern Kansas on 5
January (12 UTC) (Fig. 10) which helped moisten the low-levels of the troposphere, and
increased upward vertical motion. The thermal gradient continued to strengthen across the Upper
Great Lakes ahead of a deepening 850 hPa low which moved from southern Missouri into
northwestern Ohio between 12-00 UTC on 5-6 January. This sharpening temperature contrast led
to a layer of 850-700 hPa frontogenesis extending west and north of the 850 hPa low track where
moderate to heavy snow began to fall. At this time, a pair of upper-level jets coupled across
Illinois and Indiana by 18 UTC on 5 January. Eventually the baroclinic zone became more
progressive in nature once the 500 hPa lows phased across the Upper Great Lakes by 12 UTC on
6 January which quickly carried the precipitation axis eastward. Behind the front in the central
U.S., blowing snow and reduced visibilities were common.
During the height of the heavy snowfall, Chicago O’Hare airport saw wind chills below -
15°C and visibilities dropped to less than two-tenths of a mile. In addition to the widespread
snow, freezing rain fell early in the event on the morning of 5 January with at least a quarter inch

12
of ice reported across areas of the Mid-Atlantic. Southwesterly flow ahead of the upper-level
trough between 950-800 hPa allowed warm air to overrun a surface layer which had decoupled
and remained below freezing.
A widespread axis of 6 to 12 inches of snow fell from central Missouri northeastward
through Illinois and Indiana and into Lower Michigan with isolated amounts nearing 18 inches
across northern Indiana (Fig. 11). Additional heavy accumulations fell downwind of the Great
Lakes as cyclonic flow and favorable lake trajectories set up over the region.
In addition to the wintry precipitation, some of the coldest temperatures in nearly 20
years affected the eastern two-thirds of the country, giving rise to media and public awareness of
‘the polar vortex.’ A large number of record low temperatures dating as far back as the 19th
century were broken (Tables 2 and 3, NCDC, Global Historical Climatological Network -
Daily). The upper-level flow was meridional the entire distance north to the Arctic Circle,
providing a direct path for cold air advection toward the U.S. Windy conditions resulting from a
strong surface pressure gradient led to some dangerously low wind chills. During the event, wind
chill values plunged as low as -50°C across the northern High Plains.
2) Impacts
The combination of heavy snowfall, ice, and bitterly cold temperatures led to major
disruptions to infrastructure and commerce. Accumulating ice caused a commercial aircraft to
skid off the runway and into a nearby snowbank at John F. Kennedy International Airport (JFK).
Thousands of flights in the affected area were canceled due to the inclement weather including at
Chicago O’Hare International Airport (ORD) where jet fuel and deicing fluids froze in the -15°C
temperatures. In addition to aviation, railway operations were severely hampered, with multiple
lines experiencing cancellations and hours of delays. The historic cold outbreak also forced the

13
closure of all public schools in Minnesota on 6 January for the first time in 17 years. Further,
Ohio State University in Columbus, OH, which had not been completely shut down since 1978,
was closed from 6-7 January. Monetary damage from this event totaled $5.6 million from a
combination of the winter weather, high winds, and extreme cold. Ten fatalities were directly
attributed to the event, all of which were due to exposure to the extremely cold temperatures and
wind chill values, making this the deadliest event of the season.
d. Central to Northeast U.S. winter storm (4-5 February, 2014)
1) Meteorological Overview
A strong 500 hPa low moved south along the California coast and advanced into the
desert Southwest late on 3 February, setting the stage for development of a winter storm across
the southern and central plains. During the early morning hours of 4 February, a surface low and
associated warm front formed along the western Gulf Coast ahead of the incoming 500 hPa low.
As this storm moved northeastward, a comma-head developed on the northwest side and
produced snow across Oklahoma, Kansas, and portions of Texas. Farther south in the transition
zone, freezing rain and sleet impacted portions of the southern plains, middle Mississippi valley,
and Tennessee valley. The wintry precipitation began to spread into the Ohio valley later on 4
February as the upper-level low continued to move northeastward into the central plains.
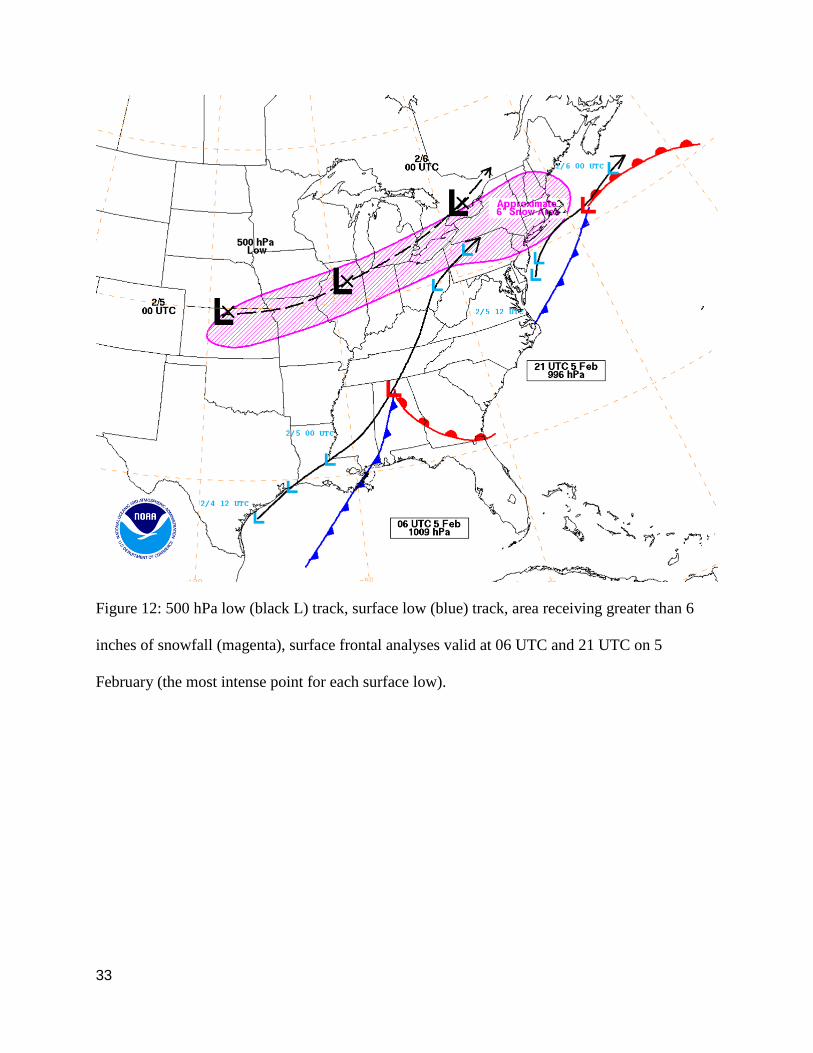
By 5 February, the upper-level low weakened as it moved over the Great Lakes, and its
associated surface system filled as it advanced into the Ohio valley in favor of coastal
cyclogenesis just off the Delmarva Peninsula (Fig. 12). As the strengthening surface low moved
up the East Coast, snow fell west and north of it, covering most of the Northeast and Upper Great
Lakes throughout the day. Along with the snow, the transition zone to the south impacted
northern portions of the Mid-Atlantic with freezing rain and sleet. Snow continued to fall

14
throughout the night of 5 February and into 6 February across New England, then tapered off
during the morning of 6 February as the surface low moved east over the Atlantic Ocean.
Over a foot of snow fell across multiple states from the central plains eastward toward the
Northeast (Fig. 13). Up to 7 inches of snow fell across the southern plains and portions of the
middle Mississippi, Ohio and Tennessee valleys. The majority of states across the Northeast
received over a foot of snow with multiple areas in New York reporting 12-15 inches.
2) Impacts
Kansas and New York declared states of emergency due to severe impacts from the
event. The state of Pennsylvania had over 600,000 people without power -- the largest power
outage in that state since Post-Tropical Storm Sandy in 2012. Traveling was also treacherous;
many automobile accidents occurred over these states and flight cancellations for this storm
totaled over 3,000. Behind the front, a 1040 hPa Arctic surface high crossed the plains and
moved over the East Coast, bringing record-breaking low temperatures and creating a dangerous
situation for people without power during the frigid conditions. The event directly caused 4
deaths across the Midwest, resulting from exposure to the extreme cold and 1 injury in
Pennsylvania, when a heavy ice-laden tree branch fell on a man. Total monetary damage of
$15.9 million was reported for the event.
e. Central Rockies and Front Range late-season winter storm (10-12 May, 2014)
1) Meteorological Overview
Over the Mother’s Day weekend of 2014, a late season snowstorm impacted areas of the
central Rockies and the central High Plains. While spring snows are not necessarily unusual for
this region, this storm broke a record in Cheyenne, WY on 11 May for the heaviest calendar-day
snow since records began in 1883. Snow began in the late morning of 10 May in the central

15
Rockies, and continued through the early evening hours of 12 May. The heaviest of the snow
occurred during the afternoon and overnight hours of 11 into 12 May.
Around 00 UTC on 10 May, a closed upper-level low entered the Pacific Northwest. The
low weakened slightly as it moved southward towards the Great Basin, but strengthened again as
it crossed into southern Utah by 12 UTC on 11 May (Fig. 14). At this time, surface low pressure
had organized in south central Utah, and moderate snow was falling across parts of the central
Rockies in Colorado and southern Wyoming. Over the next 8 to 12 hours, the surface low drifted
slowly eastward, but weakened as it reached the higher terrain of the central Rockies.
Concurrently, a second surface low formed in the lee of the Rockies and was strengthening as it
moved into the central plains, which helped to advect the coldest air into the mountains and
Front Range. This intense surge of cold air, combined with the dynamic lifting aloft, helped the
heaviest snow form over the mountains of Colorado into the central High Plains.
Many areas received 4-12 inches of snow across the central Rockies and the central High
Plains (Fig. 15). In the highest terrain of northern Colorado and southern Wyoming however,
totals approached 2 feet, with a few places exceeding 3 feet. In addition to the heavy snow, high
winds impacted much of the southwestern U.S. in the wake of the storm.
2) Impacts
Travel across the central Rockies was quickly compromised and became dangerous or
impossible through the duration of the storm. Delays and cancellations were common at area
airports, and numerous accidents blocked major roadways. In Wyoming, the storm prompted the
shutdown of I-80, a major truck route, stranding thousands of motorists and causing
overcrowding of rest stops along the interstate. Widespread power outages were also common
across the central Rockies as heavy wet snow weighed down power lines and brought down

16
newly greened trees. No fatalities or injuries directly resulted from this event. However, total
monetary damages were substantial, totaling $45 million, primarily the result of the heavy
snowfall impacting trees, power lines, and structures.
5. Summary
The winter weather season of 2013-2014 was very active. The five most substantial
events described in this seasonal review directly resulted in a total of 15 fatalities and at least
$202 million in damage (Table 1). Across all notable events of the season, a total of 32 deaths, 9
injuries, and $263 million in damage were reported. The number of deaths and injuries was an
increase over the 2012-2013 season, while the total monetary damage amount was a decrease.
The severity and widespread nature of unusually cold temperatures during several of the events
during 2013-2014 is thought to have contributed to the higher number of casualties relative to the
previous season.
6. Acknowledgements: The authors would like to thank David Novak, Anthony Fracasso, Mark
Klein, and Wallace Hogsett for valuable guidance and support throughout this project.

17
7. References
Barnston, A.G., R.E. Livezey, 1987: Classification, seasonality and persistence of low-frequency
atmospheric circulation patterns. Mon. Wea. Rev., 115, 1083-1126,
doi: http://dx.doi.org/10.1175/1520-0493(1987)115<1083:CSAPOL>2.0.CO;2
Kalnay, E. and Coauthors, 1996: The NCEP/NCAR Reanalysis 40-year project. Bull. Amer.
Meteor. Soc., 77, 437-471, doi: http://dx.doi.org/10.1175/1520-
0477(1996)077<0437:TNYRP>2.0.CO;2
Kocin, P. J. and L. W. Uccellini, 2004: A Snowfall Impact Scale Derived from Northeast Storm
Snowfall Distributions. Bull. Amer. Meteor. Soc., 85, 177-194,
doi: http://dx.doi.org/10.1175/BAMS-85-2-177.
Menne, M.J., I. Durre, R.S. Vose, B.E. Gleason, and T.G. Houston, 2012: An overview
of the Global Historical Climatology Network-Daily Database. Journal of Atmospheric
and Oceanic Technology, 29, 897-910, doi:10.1175/JTECH-D-11-00103.1.
NOAA National Climatic Data Center. http://doi.org/10.7289/V5D21VHZ (3 November, 2015)
NOHRSC Interactive Snowfall Maps, NOAA/NWS/OCWWS, 2005
(www.nohrsc.noaa.gov/technology/pdf/Snowfall_Maps.pdf)
NOAA/NWS Natural Hazard Statistics, 2013
(http://www.nws.noaa.gov/om/hazstats/resources/weather_fatalities.pdf)
Squires, M.F., J. H. Lawrimore, R.R. Heim Jr. D.A. Robinson, M.R. Gerbush, T.W. Estilow, L.
Ross, 2011: Regional Snowfall Impact Scale. 27th IIPS, Seattle, WA.
Storm Data and Unusual Weather Phenomena (www.ncdc.noaa.gov/oa/climate/sd)

18
Thompson, D.W.J., J.M. Wallace, 1998: The Arctic Oscillation signature in the wintertime
geopotential height and temperature fields. Geo. Res. Lett., 25, 1297-1300,
DOI: 10.1029/98GL00950.

19
Table 1: Date Event Impacts Deaths/Injuries Damage ($)
4-5 October, 2013 Northern Rockies and Northern Plains Winter Storm
Winter Storm/Heavy Snow, Blizzard
0/0 12.1 M
21-27 November, 2013
Southwest to Eastern U.S. Winter Storm
Winter Storm/Heavy Snow, High Wind
2/3 4.04 M
5-7 December, 2013 Southern Plains to Ohio Valley Winter
Storm
Winter Storm/Ice Storm
1/0 81.1 M
6-9 December, 2013 Central and Northeast U.S. Winter Storm
Winter Storm/Ice Storm, High Wind,
Cold/Wind Chill
0/1 726 K
14-15 December, 2013
Ohio Valley and Northeast Winter
Storm
Heavy Snow/Winter Storm, Strong Wind,
Coastal Flooding
0/0 605 K
20-23 December, 2013
Southern Plains to Northeast Winter
Storm
Winter Storm/Ice Storm
0/0 54.6 M
1-3 January, 2014 Central and Eastern U.S. Winter Storm
Winter Storm/Heavy Snow, Blizzard, High
Wind, Coastal Flooding, Cold/Wind
Chill
2/0 2.64 M
4-7 January, 2014 Central/Eastern U.S. Winter Storm and Arctic Outbreak
Winter Storm, High Wind, Extreme Cold/Wind Chill
10/0 5.60 M
20-22 January, 2014 Midwest to Eastern U.S. Winter Storm
Cold/Wind Chill, Strong Wind
4/0 23.0 K
28-30 January, 2014 Gulf Coast and Southeast U.S. Winter
Storm
Winter Storm, Extreme Cold/Wind Chill
1/1 6.08 M
2-3 February, 2014 Southern Plains to Northeast Winter
Storm
Winter Storm, Cold/Wind Chill
3/0 22.0 K
4-5 February, 2014 Central to Northeast U.S. Winter Storm
Winter Storm/Heavy Snow/Ice Storm, High
Wind
4/1 15.9 M
7-10 February, 2014 Western U.S. Winter Storm
Avalanche 2/0 40.0 K
11-14 February, 2014 Southern Plains to East Coast Winter
Storm
Winter Storm/Ice Storm/Heavy Snow,
High Wind, Cold/Wind Chill
3/0 2.95 M
1-3 March, 2014 Plains to Mid-Atlantic Winter Storm
Winter Storm/Heavy Snow, Debris Flow
0/3 3.57 M
6-7 March, 2014 Southern Appalachians Winter
Storm
Winter Storm/Ice Storm
0/0 22.2 M
12-13 March, 2014 Midwest to Northeast U.S. Winter Storm
Winter Storm, Blizzard, High Wind
0/0 5.96 M
10-12 May, 2014 Central Rockies and Front Range Late-
Season Winter Storm
Winter Storm 0/0 45.0 M
Totals: 32/9 263 M *Events shown in bold are those that were included in this article, denoted as the five most substantial events of the season based on monetary damage and/or direct casualties.

20
Table 2: Top ten daily record low temperatures (ranked by longest standing) for 4-7 January,
2014. (NOAA National Climatic Data Center, Global Historical Climatological Network - Daily)
Top 10 Records by Longest Standing Location Temperature (°F) Previous Record Year
Federal Point, FL 27 1893 Howell WWTP, MI -11 1896
Newark, NJ 3 1896 New York City (Central Park), NY 4 1896
Cape May, NJ 5 1904 Brockton, MA -10 1904
Kokomo 3 SW, IN -12 1904 Fredericksburg, TX 17 1910
Rolla, MO -10 1912 Windsor, IL -13 1912
Table 3: Top ten daily record low temperatures (ranked by lowest temperatures) for 4-7 January,
2014. (NOAA National Climatic Data Center, Global Historical Climatological Network - Daily)
Top 10 Records by Lowest Temperature Location Temperature (°F) Previous Record Year
Thorhult, MN -40 1968 Mizpah 4 NNW, MT -34 1991
Turtle Lake, ND -34 1991 Ladysmith 3 W, WI -33 1973
Willow Reservoir, WI -31 1968 Albion 1 N, MT -31 1968 Owatonna, MN -30 1988
Mellen 4 NE, WI -29 1973 Gurney, WI -28 1968
Melrose, MN -27 1988

21
Figure Captions:
Figure 1: 500 hPa geopotential height composite anomalies for the period of October 2013 to April 2014 (NCEP/NCAR Reanalysis).
Figure 2: The North Atlantic Oscillation (NAO), Arctic Oscillation (AO), and Pacific-North America Index values from October 2013 to April 2014 (CPC).
Figure 3: 250 hPa wind speed composite anomalies for the period from October 2013 to April 2014 (NCEP/NCAR Reanalysis).
Figure 4: 700 hPa relative humidity (%) composite anomalies for the period from October 2013 to April 2014 (NCEP/NCAR Reanalysis).
Figure 5: 850 hPa geopotential height composite anomalies for the period from October 2013 to April 2014 (NCEP/NCAR Reanalysis).
Figure 6: 500 hPa low (black L) track, surface low (blue) track, approximate area of 4 inch or greater snowfall (magenta) and 0.25 inch or greater ice (blue), surface frontal analysis valid at 12 UTC on 5 December, 2013.
Figure 7: Total observed snowfall (interpolated) during 48h preceding 12 UTC on 7 December, 2013 (NOHRSC).
Figure 8: 500 hPa low/trough (black), approximate areas of greater than 6 inches of snow (magenta) and 0.50 inch of ice (blue). Surface analysis shown is valid at 12 UTC on 21 December, 2013.
Figure 9: Total observed snowfall for the 72 hour period ending at 12 UTC on 23 December, 2013 (NOHRSC).
Figure 10: 500 hPa low track (black), surface low track (light blue), area receiving greater than 6 inches of snow (magenta), surface frontal analysis valid at 21 UTC on 5 January, 2014.
Figure 11: Total observed snowfall for the 72 hours ending at 18 UTC on 7 January, 2014 (NOHRSC).
Figure 12: 500 hPa low (black L) track, surface low (blue) track, area receiving greater than 6 inches of snowfall (magenta), surface frontal analyses valid at 06 UTC and 21 UTC on 5 February (the most intense point for each surface low).
Figure 13: Total observed snowfall for the 72 hour period ending at 12 UTC on 6 February, 2014 (NOHRSC).
Figure 14: 500 hPa low track (black), surface low pressure tracks (cyan and orange), approximate area receiving greater than 4 inch snowfall (magenta), surface frontal analyses valid at 18 UTC on 11 May and 00 UTC on 12 May, 2014.
Figure 15: Total observed snowfall for the 72 hour period ending at 12 UTC on 13 May, 2014 (NOHRSC).

22
Figures:
Figure 1: 500 hPa geopotential height composite anomalies for the period of October 2013 to
April 2014 (Image provided by the NOAA/ESRL Physical Sciences Division, Boulder Colorado
from their Web site at http://www.esrl.noaa.gov/psd/).

23
Figure 2: The North Atlantic Oscillation (NAO), Arctic Oscillation (AO), and Pacific-North
America Index values from October 2013 to April 2014 (CPC).

24
Figure 3: 250 hPa wind speed composite anomalies for the period from October 2013 to April
2014 (Image provided by the NOAA/ESRL Physical Sciences Division, Boulder Colorado from
their Web site at http://www.esrl.noaa.gov/psd/).

25
Figure 4: 700 hPa relative humidity (%) composite anomalies for the period from October 2013
to April 2014 (Image provided by the NOAA/ESRL Physical Sciences Division, Boulder
Colorado from their Web site at http://www.esrl.noaa.gov/psd/).

26
Figure 5: 850 hPa geopotential height composite anomalies for the period from October 2013 to
April 2014 (Image provided by the NOAA/ESRL Physical Sciences Division, Boulder Colorado
from their Web site at http://www.esrl.noaa.gov/psd/).
27
Figure 6: 500 hPa low (black L) track, surface low (blue) track, approximate area of 4 inch or
greater snowfall (magenta) and 0.25 inch or greater ice (blue), surface frontal analysis valid at 12
UTC on 5 December, 2013.

28
Figure 7: Total observed snowfall (interpolated) during 48h preceding 12 UTC on 7 December,
2013 (NOHRSC).

29
Figure 8: 500 hPa low/trough (black), approximate areas of greater than 6 inches of snow
(magenta) and 0.50 inch of ice (blue). Surface analysis shown is valid at 12 UTC on 21
December, 2013.
30
Figure 9: Total observed snowfall for the 72 hour period ending at 12 UTC on 23 December,
2013 (NOHRSC).

31
Figure 10: 500 hPa low track (black), surface low track (light blue), area receiving greater than 6
inches of snow (magenta), surface frontal analysis valid at 21 UTC on 5 January, 2014.

32
Figure 11: Total observed snowfall for the 72 hours ending at 18 UTC on 7 January, 2014
(NOHRSC).
33
Figure 12: 500 hPa low (black L) track, surface low (blue) track, area receiving greater than 6
inches of snowfall (magenta), surface frontal analyses valid at 06 UTC and 21 UTC on 5
February (the most intense point for each surface low).

34
Figure 13: Total observed snowfall for the 72 hour period ending at 12 UTC on 6 February, 2014
(NOHRSC).

35
Figure 14: 500 hPa low track (black), surface low pressure tracks (cyan and orange),
approximate area receiving greater than 4 inch snowfall (magenta), surface frontal analyses valid
at 18 UTC on 11 May and 00 UTC on 12 May, 2014.

36
Figure 15: Total observed snowfall for the 72 hour period ending at 12 UTC on 13 May, 2014
(NOHRSC).