major successes of theory - lawrence berkeley national ...155108/datastream... · obstacles in this...
TRANSCRIPT

1
Major Successes of Theory-and-Experiment-Combined Studies in
Surface Chemistry and Heterogeneous Catalysis Gabor A. Somorjai and Yimin Li
Department of Chemistry, University of California, Berkeley, California 94720, USA
Materials Science Division, Lawrence Berkeley National Laboratory, Berkeley, California
94720, USA
Abstract Experimental discoveries followed by theoretical interpretations that pave the way of further
advances by experimentalists is a developing pattern in modern surface chemistry and catalysis. The
revolution of modern surface science started with the development of surface-sensitive techniques such as
LEED, XPS, AES, ISS and SIMS, in which the close collaboration between experimentalists and theorists
led to the quantitative determination of surface structure and composition. The experimental discovery of
the chemical activity of surface defects and the trends in the reactivity of transitional metals followed by
the explanations from the theoretical studies led to the molecular level understanding of active sites in
catalysis. The molecular level knowledge, in turn, provided a guide for experiments to search for new
generation of catalysts. These and many other examples of successes in experiment-and-theory-combined
studies demonstrate the importance of the collaboration between experimentalists and theorists in the
development of modern surface science.
Introduction Both experiment and theory are indispensable in modern surface science. Modern surface science is
all about the molecular level knowledge of physical, chemical, and biological processes occurring in the
nanometer scale vicinity of surfaces or interfaces [1]. In order to acquire information at a resolution of a

2
few nanometers, the first thing to do is developing surface-sensitive experimental techniques. However,
this task is not only for experimental scientists because, virtually, the data analysis for every surface-
sensitive technique, from low-energy electron diffraction crystallography[2, 3] (LEED) to high resolution
electron energy loss spectroscopy[4, 5] (HREELS), and from scanning tunneling microscopy[6-9] (STM)
to sum frequency generation spectroscopy[10, 11] (SFG), relies on sophisticated theories. After new
experimental techniques developed, new experimental data start to be accumulated. At certain point,
theoretical models are called for again to reconcile the experimental data. A good model not only helps
experimentalists to rationalize their results, but also makes predictions that challenge the capability of
available experimental techniques in terms of the spatial, time and energy resolutions, and guide
experimentalists to design new experiments.
Jens Nørskov is a theorist who has had a profound impact in the field of surface science and
heterogeneous catalysis. His contributions to the theories of surface chemical bonding and catalytic
reaction over the past 30 years lead to a giant leap forward in our molecular level understanding of
surface chemistry and heterogeneous catalysis[12-21]. Of course, his achievement is a result of his
exceptional expertise in theoretical chemistry, but, from the point of view of an experimentalist, the more
important factors perhaps are his willingness to work closely with experimentalists and his ability to grasp
the essence of experimental development[22-28].
In this paper, we will show, from the point of view of an experimentalist, how theory and experiment
can play complementary roles in surface science by several examples including the development of
LEED surface crystallography, determining the complex structure of surface oxide, the development of
surface chemical bonding theory, and the development of theory for surface catalytic reactions and its
application to rational design of catalyst. Nørskov’s contributions to the theory of surface chemical
bonding and catalytic reaction will be highlighted. We hope that our discussion will stimulate more
collaboration between theorists and experimentalists in the field.

3
The Development of low energy electron diffraction (LEED) surface
crystallography The phenomenon of electron diffraction was first predicted by de Broglie[29] due to the quantum
particle-wave duality in 1924, and was observed three years later by Davisson and Germer[30, 31] when
a well-collimated beam of electrons was directed onto a crystallized nickel sample. It was soon realized
that, in principle, the LEED pattern contains the structure information of the first few layers of atoms at
the surface of materials.
However, it took almost sixty years after the Davisson and Germer experiment to develop LEED fully
into a prime tool for quantitatively determining complex surface structures[3, 32, 33]. The major
obstacles in this development resided in both experimental technique and theoretical interpretation of the
experimental data. From the experimental aspect, it was crucial firstly to create clean surfaces and
maintain the sample in this state within the duration of the LEED measurement; Secondly, the
inelastically scattered electrons, which plague the diffraction pattern formed by the elastically scattered
electrons, must be filtered out in the experiment. In the early 1960s, the first problem was solved by the
development of Ultra-High-Vacuum technology together with methods such as Auger electron
spectroscopy (AES) for preparing clean surfaces and monitoring their cleanliness[34].

4
Figure 1(a) Schematic illustration of the LEED experimental setup. (b) A cross section view
shows the hemispherical concentric grids used to filter out the inelastically scattered electrons. (c)
The LEED pattern of the highly symmetric (7×7) reconstructed Si (111) surface.
A clever design of the experimental setup shown in Figure 1(a) further improved the detection of
LEED pattern. The introduction of a fluorescent screen enabled the simultaneous monitoring of the
diffracted electron beams in different directions and shortened the time duration of experiments. By
applying appropriate voltage bias on the hemispherical concentric grids (Figure 1(b)), the inelastically
scattered electrons were filtered out and the elastically scattered electrons were accelerated onto the
fluorescent screen to make the diffraction pattern more readily detectable. With these technical advances,
the qualitative information such as the symmetry of the surface structure, the size and the rotational
alignment of the adsorbate unit cell with respect to the substrate unit cell were readily obtained by
analysis of the diffraction patterns from clean surfaces and surfaces with a given atomic adsorbate[2]. A
spectacular example is the (7×7) reconstructed Si (111) surface shown in Figure 1(c). A total number of
49 surface atoms per unit cell are involved in the reconstruction of silicon surface atoms to generate this
highly symmetric surface.

5
Figure 2 (a) The I-V curve of the (111) surface of solid xenon. The solid curve is the
experimental result. The dots is the result of a weak scattering theory. (b) The single electron
scattering processes by atoms in one atomic layer (left) and in two atomic layers. and are the
wave vectors of incident beam and diffracted beam, respectively. The interference between the
diffracted beam is determined by , the difference in their traveling distances.
The quantitative information about exact atomic locations in surface layers can be extracted by
theoretical analysis of the so-called I-V curves, where the intensities of diffracted electron beams are
recorded as a function of incident electron beam energy. In the 1960s, the theoretical method available for
analyzing the I-V curves was the kinematic theory derived from the X-ray diffraction theory. Figure 2(a)
shows a successful analysis of I-V curves for the (111) surface of solid xenon using the kinematic
theory[35]. In this theory, it is assumed that every incident electron is scattered once by an atom in the
surface layer before reaching the detector (Figure 2(b)). This is true for the xenon case because of the

6
uniquely short inelastic mean free path of low-energy electrons in solid xenon. For most materials, the
multiple scattering processes as shown in Figure 3(a) usually cannot be ignored. Figure 3(b)
demonstrates the necessity of the multiple scattering theory for fitting the I-V from the Cu(001)
surface[36].
Figure 3 (a) one possible multiple scattering processes of electrons by two atomic layers. (b) The
I-V curve of the (0,0) beam diffracted from the Cu(011) surface. The solid lines show the results
from a multiple scattering theory. Positions of peaks predicted by the single scattering theory are
indicated at the top of the panel.
Two computationally efficient methods developed by John B. Pendry[33] in the early 1970s
revolutionized the calculation of the I-V curves for comparison with experimental data. The first method
was the so-called layer-doubling method which treats the multiple scattering in the surface layers
explicitly. In this method, the surface is represented as a stack of identical 2D atomic planes. The basic
idea is that once one has computed the transmission ( ) and the reflection ( ) coefficients for the single
atomic layer (Figure 4(a)), the reflection ( ) and the transmission ( ) coefficients of two atomic layer
as shown in Figure 4(b) can be obtained as

7
(1.1)
and
. (1.2)
Figure 4 Schematic illustration of the basic idea of layer-doubling method. (a) The transmission
and reflection coefficients of one atomic layer are and , respectively. is the wave amplitude
of incident electron beam. The wave amplitudes of the transmitted and reflected beam are and
, respectively. (b) The transmission ( ) and reflection ( ) coefficients of two atomic layers can
be obtained by considering the multiple scattering between the two layers. (c) The four-layer system
can be viewed as a stack of two superlayers and each of superlayer consists of two atomic layer. So

8
the transmission and reflection coefficients of four layer system can be obtained in the same way as
the two-layer as long as and are known.
Now the reflection ( ) and transmission ( ) coefficients of layers as shown in Figure 4(c) can
be obtained recursively as
(1.3)
and
. (1.4)
This layer doubling method is highly computationally efficient because the computational time
needed for the calculation of a M-atomic-layer system, , scales sublinearly with the number of
atomic layers.
Another bottleneck of the computational efficiency remained in the layer doubling method was the
matrix inversion of , which has to be performed at every recursive step, and whose computation
time is scaling cubically with the matrix dimension of the reflection coefficient. Pendry proposed a
method to get around this bottleneck based on a perturbation expansion, recognizing that the strong
forward scattering of low energy electrons implies that the reflection coefficient , . Therefore, the
expansion should be in order of powers of the small parameter . However, it was found that a simple
perturbation approach failed in giving the converged result at the expense of affordable computational
time. A more sophisticated perturbation scheme, the so-called renormalized forward-scattering
perturbation theory, was finally developed to solve the problem.

9
With these theoretical advances, the calculations of I-V curves were capable to solve surface
structures with up to 5 atoms in a unit cell. In the period from the early 1970s to the mid 1980s, several
hundred structures of clean surface and simple adsorption systems were determined by the LEED
crystallography. These studies unveiled that the reconstruction is a common phenomenon at the clean
surfaces. For example, the top atomic layer of the Ir(100) surface undergoes a (5×1) reconstruction[37]
(Figure 5 (a)). This structure similar to the close-packed fcc(111) surface lowers the surface energy of the
system. The studies of ethylene chemisorption on transition metals such as Pt and Rh suggested that
ethylene is not necessarily laying flat on the surface, and that, at the room temperature, C−H bonds may
break and reform to produce ethylidyne on the surface[38, 39] (Figure 5(b)).
Figure 5 (a) The structure of the (5×1) reconstructed Ir(100) surface. (b) The structure of
ethylidyne on the Pt(111) surface.
As the complexity of the surfaces increased so did the computational resources required to perform
both the LEED calculations and the fitting of the calculated I-V curves to the experimental data. By the
mid of 1980s, it became crucial for the field to develop more computationally efficient methods for data
analysis of disordered adsorption systems and reconstructions involving multiple surface layers.

10
For disordered adsorption systems, a surface unit cell has effectively infinite area (or says, infinite
number of atoms). To tackle this problem, diffuse LEED (DLEED) theory was developed by Pendry[40]
and Van Hove[41], separately. In the Van Hove’s method (known as Beam Set Neglect method), the
disordered adsorption surface is approximated by an ordered structure with a unit cell area less than ,
here is the mean free path of electron in the solid (typically around 10 to 100 Å). The physics behind
this approach is that the low energy electrons have a relatively short mean free path, and that an electron
can only contribute to the diffraction pattern if it has traveled a distance of less than the mean free path.
Pendry’s approach is based on the observation that a disordered adsorption system can be viewed as a
disordered overlayer of atoms adsorbed on an ordered substrate. The electrons scattered from the ordered
substrate generate the Bragg spots. Any electron contributing to the diffuse component of the pattern must
have interacted with at least one adsorbed atom. Depending on the traveling path taken by the diffracted
electrons, the diffraction pattern can be broken into three components, which could be computed using
either conventional LEED theory or methods borrowed from the theory of surface extended X-ray
absorption fine structure spectroscopy (SEXAFS). With the help of DLEED theory, the structures of
weakly adsorbed molecules such as benzene on Pt(111) could be determined[42] (Figure 6). The benzene
structure unveiled that the preferred adsorption site is the bridge site on Pt(111), and that the adsorption
also induces subtle restructuring of the benzene molecules.

11
Figure 6 (a), (b), and (c) The structure of weakly bonded benzene molecule on Pt(111) resolved
by diffuse LEED. (d) STM image of the disordered benzene layer on the Rh(111) surface[43].
The development of tensor LEED theory by Rous and Pendry[44] finally brought the LEED
technique into its mature state. Tensor LEED is a perturbative approach to the calculation of LEED
intensities. One starts by defining a reference structure: a particular surface structure that we guess to be
as close as possible to the actual surface structure. We then distort this surface by moving some of the
atoms to new positions. In this way we generate a trial structure that is a structural distortion of the
reference structure related by a set of atomic displacements.
If the atomic displacements are small enough (typically within 0.4 Å), the difference between the
amplitude of a given LEED beam scattered from the reference and the trial surface, , can be
approximated to the first order. Assuming are the 3D displacements of
atoms , the amplitude difference can be written by
. (1.5)

12
The quantity is the tensor which depends only on the scattering properties of the reference surface
and can be calculated once by the conventional multiple LEED theory. Once is known, then the
diffraction intensities for many trial surfaces can be evaluated extremely efficiently by summing Eq. (1.5)
. This linear version of tensor LEED is limited to atomic displacements of less than 0.1 Å. A more
sophisticated version of the theory allowed the displacements of up to 0.4 Å. Figure 7 shows the tensor
LEED approach which combines the experimental measurement and the theoretical data analysis.
Figure 7 Scheme showing the tensor LEED approach in determining the complex surface
structure.
Tensor LEED represented a revolution in structural surface chemistry. The knowledge accumulation
of tensor LEED studies leads to the concept of ‘flexible surface’ which changed our static view of surface
structure to a dynamic one. The relaxation at Pt(210) stepped surface involves the displacements of atoms
in up to four surface layers[45] (Figure 8(a)), and the marked restructuring of metal surfaces may be
induced by strong chemisorption as shown in the cases of the ethylene adsorption on the Pt(111)[46] and
Rh(111)[47] surfaces (Figure 8(b)). The creative applications of tensor LEED to the covalent-bonded and

13
ionic-bonded materials such as NaCl[48] and ice[49, 50] further proved the generality of the concept of
‘flexible surface’ (Figure 9(a) and (b)).
Figure 8 (a) Multilayer relaxation of Pt(210) surface determined by the tensor LEED. (b)
Restructuring of Pt(111) and Rh(111) surfaces induced by ethylene chemisorptions.

14
Figure 9 Schematic illustrations of (a) reconstructed NaCl(100) surface and (b) the ice(0001)
surface at different temperatures. The LEED results indicate that the surface Na+ layer move
towards the bulk. The LEED results on the ice(0001) surface suggest that the surface is terminated
by a full bilayer of water molecules, and, even at 100 K, the surface root-mean-square vibrational
amplitude is two to three times larger than that in the bulk.
Recently, the structure studies of nanostructures pose another challenge to the LEED technique. It can
be envisioned that, with the advances both in new experimental design and theoretical data analysis, this
technique will become one of the prime tools for determining complex structures of nanostructures in
near future[51].
Structure and stability of surface oxides In recent years, the formation of thin well-ordered but complex surface oxides on later transition
metals has been discovered[52]. These surface oxides may serve as a protective layer against corrosion, as
insulation layers in microelectronic devices, and as oxygen reservoir during catalytic reactions. Due to the
structural complexity of these surface oxides, a multi-method approach of experimental and theoretical

15
techniques has to be employed in the atomic scale studies. These studies provide perfect examples for
demonstrating the complementary roles of experimental and theoretical techniques in surface chemistry
studies.
The multi-method approach starts with applying the qualitative structural methods such as LEED and
STM. These two techniques give a good approximation of the symmetry of surface structure and in-plane
lattice distances. Figure 10(a) and (b) show the LEED pattern and the STM image of a surface oxide on
Rh(111) formed under conditions: 1×10⁻³ mbar of O2 and 700 K[53]. These experimental results suggest
the formation moiré pattern consisting of a hexagonal layer with a larger in-plane lattice distance being on
top of hexagonal Rh(111) substrate. The periodicity of the oxygen-induced hexagonal pattern is close to a
(9×9) Rh(111) cell. The lattice distance of the overlayer is around 3 Å, which can also be confirmed by
using surface X-ray diffraction (SXRD) measurement.
Figure 10 (a) The LEED, and (b) the STM image of a surface oxide formed on Rh(111) at 1×10⁻³
mbar of O2 and 700 K. (c) The XPS spectra of the oxide surface. The calculated core electron
binding energies of different O and Rh species are also shown as the vertical lines for comparison.
Applying high resolution core level spectroscopy (HRCLS), a type of XPS technique, the chemical
composition of surface oxides can be studied quantitatively. For the Rh (9×9) surface oxide (Figure
10(c)), the HRCLS spectrum in O1s region indicates there are two Rh-coordinated O species existing in

16
the surface oxide layer; In the Rh 3d5/2 region, there are two major peaks. The peak at higher binding
energy (~307.9 eV) is originated from a highly-O-coordinated Rh species. The abundances of these
surface species can be deducted qualitatively from their peak intensities in the HRCLS spectra. The
obtained coverages for the highly O-coordinated Rh species and the Rh-coordinated O species are 0.9 and
1.8 monolayer, respectively, which indicates a layered O-Rh-O surface oxide.
Figure 11 (a) and (b) The DFT predicted O-Rh-O trilayer structure of the surface oxide on
Rh(111). (c) The simulated STM image of the surface oxide.
Using the experimentally obtained structural information such as symmetry and the abundances of
surface species, the atomic structural models can be proposed and examined by the DFT studies. In the
DFT studies, a O-Rh-O trilayer with a (7×7) cell on a (8×8) Rh(111) cell (Figure 11(a) and (b)) is found
to be stable at the given oxygen partial pressure and temperature[53]. The simulated STM image (Figure
11(c)) for this structure is in good agreement with the experimental result shown in Figure 10(b); Further,
the calculated core electron binding energies agree well with the measured values as shown in Figure
10(c). The DFT-predicted structure disagrees slightly with the SXRD result which suggests a structure
with a (8×8) cell on a (9×9) Rh(111) cell. However, DFT calculations also indicate that the free energy
difference between these two structures is very small.
Once the structures are obtained, the thermal and chemical stability of surface oxides can be
investigated in detail. The calculated phase diagram of various surface oxides indicates that the (8×8) and

17
the (9×9) Rh surface oxides are actually metastable under the conditions where bulk oxide is already
stable[53]. Therefore, these oxides serve as kinetic barriers for the further growth of thick oxides on the
surface.
The investigation of the reduction of the (9×9) Rh surface oxide by CO at CO partial pressure of
2×10⁻⁸ mbar and 375 K found that the surface oxide can be reduced even though CO does not adsorb
easily on the surface under the given experimental conditions[54]. Both HRCLS and STM results showed
that atomic oxygen is expelled from the oxide layer onto the reduced metallic areas. The observations can
be again explained by the DFT calculations. The DFT result showed that the (9×9) structure is not stable,
if its surrounding metal is free of oxygen. Therefore the surface oxide may serve as an oxygen reservoir
during the CO oxidation reaction.
Surface chemical bond Once the geometric structures of chemisorption systems are determined by various surface science
techniques, the further questions are how strong these surface chemical bonds are, and how the strength of
the surface chemical bond depends on the properties of the adsorbed molecules and the substrates. In
experiments, the strength of surface chemical bonding can be determined by deriving the heat of
adsorption from the adsorption isotherms at different temperatures, or by monitoring desorption
temperature of adsorbate in the temperature-programmed desorption (TPD) experiment. By the late of
1970s, large amount of experimental data had been accumulated, and the surface chemical bonding
strength across the periodic table was tabulated[55]. It was found that, over transition metal surfaces, the
chemical bonding strength of an adsorbed atom generally increases from the right to the left in the
periodic table. On the other hand, the development of the electron spectroscopy techniques, such as
ultraviolet photoelectron spectroscopy[56-58] (UPS) and X-ray photoelectron spectroscopy[59, 60]
(XPS), enabled the detailed investigation of electronic structures of chemisorptions systems[61]. All these
experimental advances set a stage for the development of theoretical approaches to rationalize the

18
experimental observations, and to understand how the electrons in the adsorbates and the metal surface
interact with each other to form surface chemical bonds.
A major contribution by Norskov in the early stage of this theoretical development was extending and
applying the effective medium theory to understand the trends of chemical bonding over the transition
metal surfaces[13, 62, 63]. The effective medium theory is based on density functional theory (DFT), a
general theory for studying molecular electronic structures. The full-blown DFT study of surface
chemical bonding is very time consuming due of the large number of electrons involved. The basic idea
behind the effective medium theory is to calculate the energy of an atom in an arbitrary environment by
first calculating it in some properly chosen reference system, the effective medium, and then estimate the
energy difference between the real system and the reference system[63]. The total energy of the system is
given by
(1.6)
Where is the energy of atom i in the reference system. The essence of the method is then to
choose the reference system so close to the real system that the correction, , is small
enough that it can be estimated using perturbation theory or some other approximation form. The choice
of the reference system also ensures that the binding energies of the reference system, , can be easily
obtained.
In the simplest form, the adsorbed atom is considered to be embedded in a homogenous electron gas
(the reference system) with an average electron density corresponding to the given metal. The binding
energy of each atom is calculated to the first order of approximation as a function of the average electron
density from its neighbors in the vicinity of the atom. The correction is calculated by the News-
Anderson model which considers subsequent interaction of the valence electron of adsorbed atom with

19
the sp bands and the d band in the metal. It turned out that, as shown in Figure 12, this simple treatment
was good enough to predict the bonding trends observed experimentally for the chemisorption of
hydrogen and oxygen over the transition metal surfaces[13].
Figure 12 The chemisorptions energies of hydrogen and oxygen across the periodic table. The
hollow squares are the experimental results. The black dots are the results predicted by the
effective medium theory.
The further refinement of the effective medium theory by Norskov and coworkers leads to a simple
yet powerful theory, the d-band model[14-16], for understanding the variations of chemisorptions energy
from one to another metal, from one surface structure to another on the same metal. In the d-band model,
the adsorption energy is given by[64]
, (1.7)

20
where is the bond energy contribution from the free-electron-like sp electrons and is the
contribution from the extra interaction with the transition metal d electrons. It is assumed that is
independent of the metal. can be calculated by the News-Anderson model as
(1.8)
where the first term is the Pauli repulsion between the adsorbate states and the metal d states, which is
proportional to , the square of the coupling matrix element between the adsorbate states and the
metal d states. The second term is the attraction contribution from the hybridization of the adsorbate states
and the metal d states. The hybridization leads to a bonding orbital below the Fermi level and an
antibonding orbital close to the Fermi level as shown in Figure 13. Just like the situation in the chemical
bonding between two atoms, the strength of the surface chemical bond is determined by the occupancy of
the antibonding orbital. The number of electrons in the antibonding orbital is approximately equal to the
initial filling of the d band of the free metal surface. and are the energy at the center of the metal d
band and the adsorbate states, respectively.
21
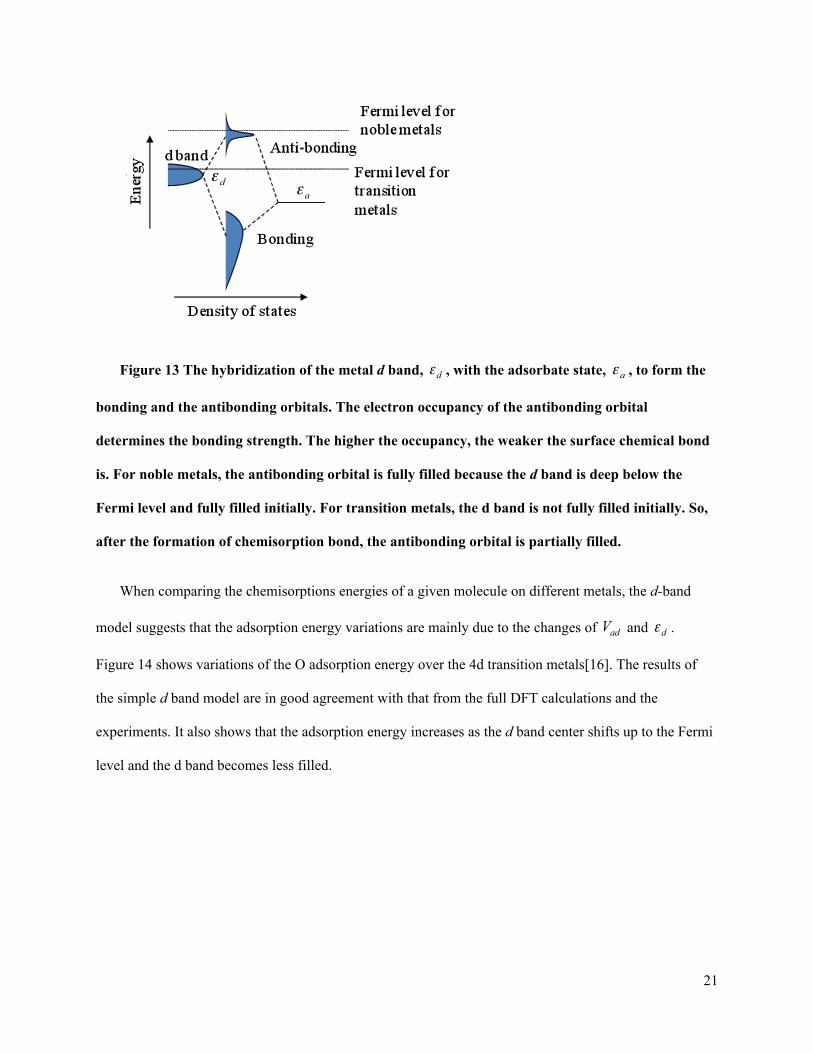
Figure 13 The hybridization of the metal d band, , with the adsorbate state, , to form the
bonding and the antibonding orbitals. The electron occupancy of the antibonding orbital
determines the bonding strength. The higher the occupancy, the weaker the surface chemical bond
is. For noble metals, the antibonding orbital is fully filled because the d band is deep below the
Fermi level and fully filled initially. For transition metals, the d band is not fully filled initially. So,
after the formation of chemisorption bond, the antibonding orbital is partially filled.
When comparing the chemisorptions energies of a given molecule on different metals, the d-band
model suggests that the adsorption energy variations are mainly due to the changes of and .
Figure 14 shows variations of the O adsorption energy over the 4d transition metals[16]. The results of
the simple d band model are in good agreement with that from the full DFT calculations and the
experiments. It also shows that the adsorption energy increases as the d band center shifts up to the Fermi
level and the d band becomes less filled.

22
Figure 14 The oxygen adsorption energies along the 4d transition metal series (the upper
panel). The adsorption energies are plotted as a function of the d-band center energy on clean metal
surfaces (the lower panel).
It was observed experimentally that the adsorbed atoms and molecules have higher heats of
adsorption at defect sites such as the steps and kinks on the surface[65] (Figure 15(a)). The calculations
by density functional theory show that the d band centers at the defect sites shift up relative to the sites on
the flat surface, which leads to the increase of the adsorption energy[66] (Figure 15(b)). Using the same
argument, the d band model has been applied to explain and predict the alloying effect on the
chemisorptions observed in the experiment. The examples shown in Figure 14 and Figure 15 clearly
demonstrate that the simple d-band model captures the main factors that determine the chemisorption
energies of atoms and small molecules on the transition metal surfaces.

23
Figure 15 (a) TPD results of CO on the stepped Pt(533) surface at different coverages. There
are major desorption peaks at relative higher coverages. By comparing to the TPD results of CO on
the flat Pt(111) surface, the peak at the lower temperature can be attributed to the desorption of
CO adsorbed on the (111) terrace. The peak at the higher temperature is due to the CO on the step
sites. Because of the higher adsorption energy at the step sites, CO molecules preferentially occupy
these step sites at the low coverages. (b) CO chemisorption energies on the flat, stepped, strained,
and kinked metal surfaces calculated by the d-band model. Theory model indicates the up-shift of
the d-band center at the defect sites causes the increase of chemisorption energy.
For more complex chemisorption systems in which adsorbates can form multiple bonds with several
surface atoms, a scaling relation has been proposed recently based on extensive DFT calculations of
adsorption energies of CHx species on the metal surfaces[67]. Figure 16 shows that, for a given x, the
adsorption energies of CHx on different metal surfaces is scaled almost linearly with the atomic
adsorption energies of carbon, which implies a scaling relation

24
, (1.9)
here and are fitting constants. From the fitting constants shown in Figure 16, we can further
see that the values of is very close to that predicted by
, (1.10)
here for carbon atom is 4, that is the maximum number of bonds carbon can form with the
surface atoms. This scaling relation, which has been also observed in several other chemisorptions
systems[19], provides a semi-quantitative method to predict the adsorption energies of complex
adsorbates from the simple calculation of atomic adsorption energy.
Figure 16 Calculated adsorption energies of CHx intermediates as a function of the adsorption
energies of atomic C on the flat and stepped surfaces of various metals. The red lines are for the
stepped surface, and black lines for the flat surfaces. For a given , the adsorption energies of CHx
can be fitted by a straight line, .
Reactivity and Selectivity in Heterogeneous Catalysis
25
Heterogeneous catalytic reactions involve elementary processes: adsorption and dissociation of
reactants from the gas phase, diffusion of surface species, surface reactions to form surface intermediates
and products, and desorption of products into the gas phase. The ultimate goal of surface science research
is to obtain the molecular level details of these elementary processes, and to control reactivity and
selectivity of catalytic reactions by using the obtained molecular level knowledge. Apparently, neither
experimental study nor theoretical study can fulfill this endeavor alone. The capability of experimental
study is always limited by the spatial, time, and energy resolutions achievable by experimental
techniques. For example, monitoring the surface intermediates during catalytic hydrocarbon conversion
under the realistic reaction conditions has been proved to be extremely difficult; On the theoretical side,
theoretical model usually tends to oversimplify the local chemical environment in which the elementary
reaction processes take place. The complexity of the local chemical environment includes the
coadsorption of surface species and their coverages on the catalyst surface, the distribution of active
surface sites, etc. Therefore, combining experimental and theoretical approaches is a must in the
molecular level study of catalytic reactions.
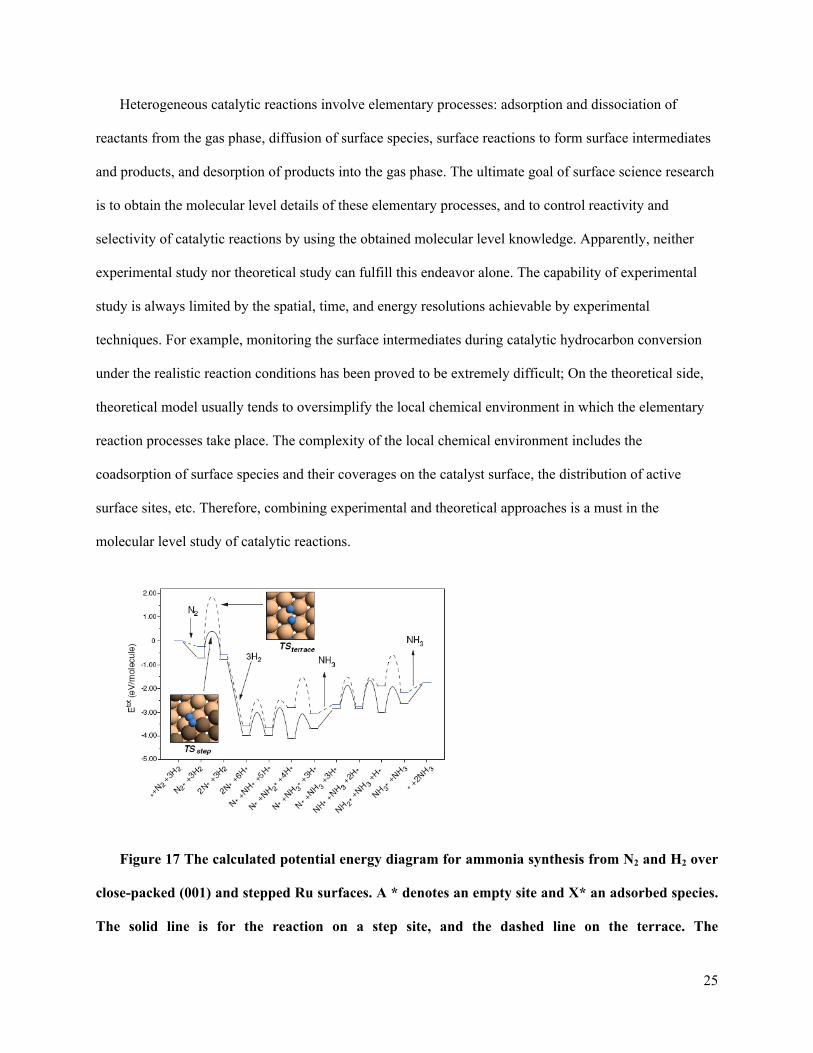
Figure 17 The calculated potential energy diagram for ammonia synthesis from N2 and H2 over
close-packed (001) and stepped Ru surfaces. A * denotes an empty site and X* an adsorbed species.
The solid line is for the reaction on a step site, and the dashed line on the terrace. The
26
configurations of the transition states for N2 dissociation over the terrace and stepped sites are
shown in the insets.
A recent study of ammonia synthesis over a ruthenium nanoparticle catalyst by Norskov and
coworkers demonstrated how the theoretical modeling and experimental techniques can complement each
other to achieve the molecular level understanding of this simplest catalytic reaction under industrially
relevant reaction conditions[68, 69]. In this study, the potential energy diagram for the full reaction was
constructed based DFT calculations. The activation barriers for the reactions taking place on the terrace
site and the step site were compared (Figure 17). It was shown that the dissociation of nitrogen (the rate
limiting step) on the step site has a much lower activation barrier than that on the terrace site. The step
site is the active site for this reaction. The potential energy diagram also provided all necessary
information to calculate the rates of the individual elementary steps in the catalytic reaction by the micro-
kinetic model. In the calculations of the dissociative adsorption rate of N2, the coadsorption effect was
also considered by investigating the activation energy changes induced by coadsorption of atomic
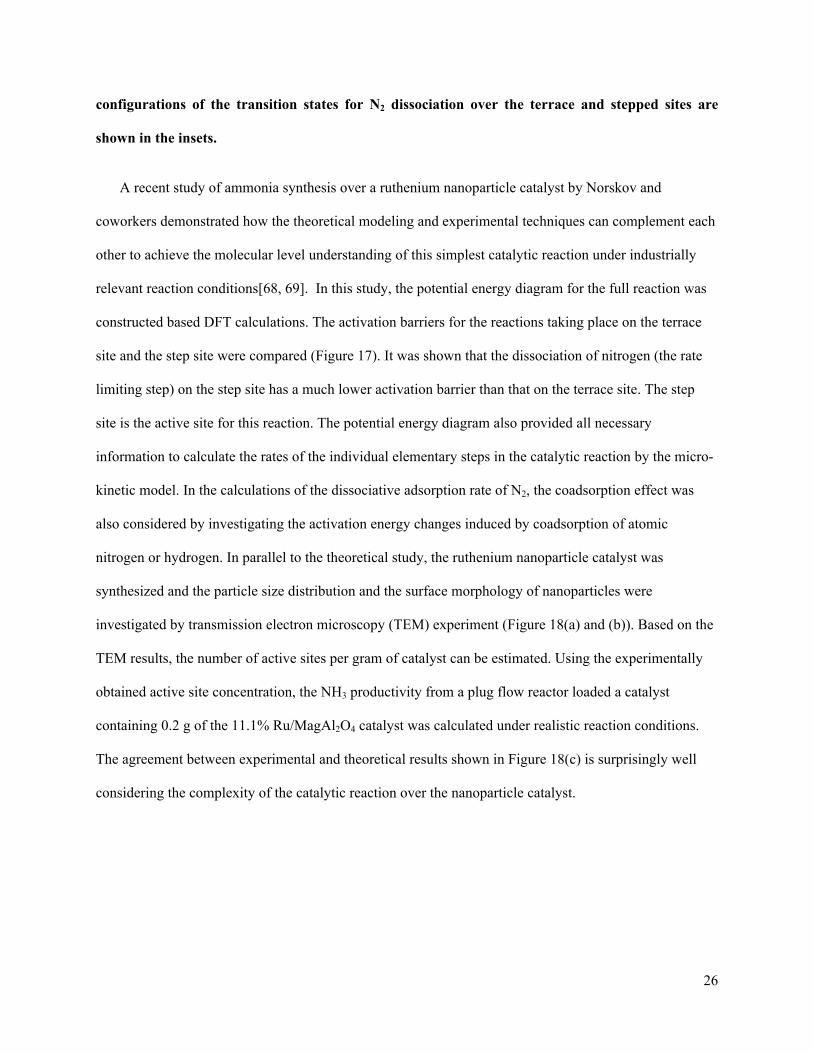
nitrogen or hydrogen. In parallel to the theoretical study, the ruthenium nanoparticle catalyst was
synthesized and the particle size distribution and the surface morphology of nanoparticles were
investigated by transmission electron microscopy (TEM) experiment (Figure 18(a) and (b)). Based on the
TEM results, the number of active sites per gram of catalyst can be estimated. Using the experimentally
obtained active site concentration, the NH3 productivity from a plug flow reactor loaded a catalyst
containing 0.2 g of the 11.1% Ru/MagAl2O4 catalyst was calculated under realistic reaction conditions.
The agreement between experimental and theoretical results shown in Figure 18(c) is surprisingly well
considering the complexity of the catalytic reaction over the nanoparticle catalyst.
27
Figure 18 (a) High resolution TEM image of a supported ruthenium nanoparticle with a step.
(b) the particle size distribution obtained from the TEM experiments. (c) Comparison of ammonia
productivity from the model with experiment results. The productivity is plotted as a function of
the reaction temperature.
The success of this study also gives hope to develop theoretical computer-based method into a
indispensable tool in rational design of catalyst. One of major bottlenecks for the computational study of
reactivity and selectivity in heterogeneous catalysis is identifying the transition states of surface reactions
and computing the activation energies. Fortunately, there are some empirical relations correlating the
activation energy and reactivity with the chemisorption energy of reactants. One of them, the Brønsted-
Evans-Polanyi (BEP) relation[70-73], states that the activation energy for an elementary reaction step on
surface depends linearly on the reaction energy, that is, the difference between the chemisorption energy
of the products and the reactants. An example[73] for the activation energies for N2 dissociation over
various metal surfaces are shown in Figure 19(a). Another relation is the famous principle of

28
Sabatier[74]: the best catalyst is one that binds the intermediates not too strongly and not too weakly.
Figure 19(b) shows how the rates of ammonia synthesis depends on the nitrogen chemisorption energies
on various metal surfaces[75]. These relations offer an efficient way to estimate the activation energy and
the reactivity using the chemisorption energies of the reactants and products, since the chemisorptions
energies can be computed efficiently by the d-band model as we discussed in the previous section. With
the help of these relations and the chemisorption model, catalytic properties of alloy combinations can be
investigated computationally in the search for the low-cost yet highly activity and selective catalysts[27,
75-80].
Figure 19 (a) The calculated activation energies of N2 dissociation adsorption as a function of
the chemisorption energies of nitrogen on the flat and stepped metal surfaces. The black dot is for
the flat surfaces, and the red triangles for the stepped surfaces. The straight fitting lines indicate
the BEP relation is applicable in this reaction. (b) The calculated turnover rates as a function of the
chemisorption energies of nitrogen on several metal and alloy surfaces. This chemisorption energy
dependence of the reaction rate clearly demonstrates the Sabatier’s principle.
Summary and outlook We have shown, by examples, the importance of experiment-and-theory-combined approaches in the
development of experimental techniques in surface science, resolving the surface structures, and studying

29
chemisorption and catalytic reactions. The contributions by Prof. Norskov and coworkers to the
chemisorption theory and the computer-based catalyst design have been highlighted with emphasizing
their deep appreciation of experimental developments and their extensive collaboration with
experimentalists in the effort to achieve the molecular level understanding of complex catalytic processes.
The major challenges of surface science in the 21th century are to explore the unique physical and
chemical properties of nanomaterials, and to design new generation of catalytic processes with high
reactivity and selectivity. To face these challenges, experimentalists and theorists have to come together,
and be aware of the advantages and the disadvantages of each others’ techniques. Here we finish our
paper with three interesting problems raised in the study of the nanostructured surfaces and catalytic
reactivity and selectivity. These problems need attentions from both experimentalists and theorists.
The first problem is regarding Sum frequency generation (SFG) vibrational spectroscopy, a prime in
situ technique to monitor the orientation and ordering of adsorbates. Recently, a number of studies have
applied this technique to the nanostructured surfaces[81-83]. A general observation in these studies is the
reduction of the sum frequency signal due to the nanometer scale corrugation on sample surfaces.
Moreover, the surface corrugation also makes it difficult to derive the adsorbate orientation from the SFG
measurements with different polarization combinations, since the common SFG theory was initially
developed for the flat surfaces [84]. Apparently, further experimental and theoretical development of the
SFG technique is needed to improve its sensitivity in the nanomaterial studies.
The second problem is concerning the synthesis of alloy catalysts. At present, the computer-based
method is capable to perform large scale screening of alloy catalysts for important catalytic reactions[79,
80]. However, the proposed alloy catalysts are not necessarily stable under harsh reaction conditions,
especially, when these catalysts are in the form of nanoparticles. On the one hand, in order to optimize the
reactivity and selectivity of alloy nanoparticle, certain surface composition is usually required[22, 27, 76].
On the other hand, the surface composition of alloy nanoparticles may change dramatically with the
30
reaction conditions as shown by an ambient pressure X-ray photoelectron spectroscopy study on
bimetallic nanoparticles carried out recently at Berkeley[85]. Therefore, the development of new
synthesis schemes for producing alloy catalysts with relatively stable surface composition is extremely
important to the rational design of catalyst.
Finally, as a third example of the challenges in catalysis science, obtaining information about the
nature and conversion of surface reaction intermediates is the key to understanding the selectivity of
complex catalytic reactions[86-88]. Performing in situ spectroscopy techniques such as polarization-
modulated reflection-absorption infrared spectroscopy (PM RAIRS) and SFG under reaction conditions
usually results in complex spectra[82, 89-92]. The development of reliable theoretical methods for
predicting the vibrational frequencies of surface intermediates will provide tremendous help in the
spectrum interpretation and in determining the coverages of the reaction intermediates that may adsorbed
simultaneously on the catalyst surface [93, 94].
Acknowledgement This work was supported by the Director, Office of Science, Office of Basic Energy Sciences of the
U. S. Department of Energy under Contract No. DE-AC02-05CH11231.
References [1] G.A. Somorjai, Introduction to surface chemistry and catalysis (Wiley, New York, 1994). [2] J.B. Pendry, Low energy electron diffraction : the theory and its application to
determination of surface structure (Academic Press, London ; New York, 1974). [3] M.A. Van Hove, W.H. Weinberg, and C.M. Chan, Low-energy electron diffraction :
experiment, theory, and surface structure determination (Springer-Verlag, Berlin ; New York, 1986).
[4] H. Ibach, M. Balden, and S. Lehwald, Journal of the Chemical Society-Faraday Transactions 92 (1996) 4771.
[5] J. Szeftel, Surface Science 152 (1985) 797. [6] G. Binnig, and H. Rohrer, Rev. Mod. Phys. 59 (1987) 615 [7] G. Binnig, and H. Rohrer, Reviews of Modern Physics 71 (1999) S324. [8] P. Sautet, Chemical Reviews 97 (1997) 1097. [9] J. Tersoff, and D.R. Hamann, Physical Review B 31 (1985) 805. [10] Y.R. Shen, Nature 337 (1989) 519.

31
[11] Y.R. Shen, The principles of nonlinear optics (Wiley-Interscience, Hoboken, N.J., 2003). [12] J.K. Norskov, and N.D. Lang, Physical Review B 21 (1980) 2131. [13] J.K. Norskov, Reports on Progress in Physics 53 (1990) 1253. [14] B. Hammer, and J.K. Norskov, Surface Science 343 (1995) 211. [15] B. Hammer, and J.K. Norskov, Nature 376 (1995) 238. [16] B. Hammer, and J.K. Norskov, Advances in Catalysis, Vol 45 45 (2000) 71. [17] J. Greeley, J.K. Norskov, and M. Mavrikakis, Annual Review of Physical Chemistry 53
(2002) 319. [18] C.H. Christensen, and J.K. Norskov, Journal of Chemical Physics 128 (2008) 182503. [19] G. Jones, T. Bligaard, F. Abild-Pedersen, and J.K. Norskov, Journal of Physics-
Condensed Matter 20 (2008) 064239. [20] J.K. Norskov, T. Bligaard, B. Hvolbaek, F. Abild-Pedersen, I. Chorkendorff, and C.H.
Christensen, Chemical Society Reviews 37 (2008) 2163. [21] A. Nilsson, L.G.M. Pettersson, and J.K. Nørskov, editors. Chemical Bonding at Surfaces
and Interfaces. (Elsevier, Amsterdam, 2008). [22] F. Besenbacher, I. Chorkendorff, B.S. Clausen, B. Hammer, A.M. Molenbroek, J.K.
Norskov, and I. Stensgaard, Science 279 (1998) 1913. [23] F. Besenbacher, and J.K. Norskov, Science 290 (2000) 1520. [24] S. Helveg, J.V. Lauritsen, E. Laegsgaard, I. Stensgaard, J.K. Norskov, B.S. Clausen, H.
Topsoe, and F. Besenbacher, Physical Review Letters 84 (2000) 951. [25] N. Lopez, and J.K. Norskov, Journal of the American Chemical Society 124 (2002)
11262. [26] J. Sehested, K.E. Larsen, A.L. Kustov, A.M. Frey, T. Johannessen, T. Bligaard, M.P.
Andersson, J.K. Norskov, and C.H. Christensen, Topics in Catalysis 45 (2007) 9. [27] F. Studt, F. Abild-Pedersen, T. Bligaard, R.Z. Sorensen, C.H. Christensen, and J.K.
Norskov, Science 320 (2008) 1320. [28] H. Topsoe, B. Hinnemann, J.K. Norskov, J.V. Lauritsen, F. Besenbacher, P.L. Hansen, G.
Hytoft, R.G. Egeberg, and K.G. Knudsen, Catalysis Today 107-08 (2005) 12. [29] L. de Broglie, Philosophical Magazine 47 (1924) 446. [30] C. Davisson, and L.H. Germer, Nature 119 (1927) 558. [31] C. Davisson, and L.H. Germer, Physical Review 30 (1927) 705. [32] G.A. Somorjai, and P.J. Rous, Journal of Physics-Condensed Matter 20 (2008) 304210. [33] J.B. Pendry, Surface Science 299 (1994) 375. [34] D.P. Woodruff, and T.A. Delchar, Modern techniques of surface science (Cambridge
University Press, Cambridge ; New York, 1994). [35] Ignatjev.A, J.B. Pendry, and T.N. Rhodin, Physical Review Letters 26 (1971) 189. [36] G. Capart, Surface Science 26 (1971) 429. [37] E. Lang, K. Mueller, K. Heinz, M.A.V. Hove, R.J. Koestner, and G.A. Somorjai, Surf.
Sci. 127 (1983) 347 [38] L.L. Kesmodel, L.H. Dubois, and G.A. Somorjai, J. Chem. Phys. 70 (1979) 2180 [39] R.J. Koestner, M.A.V. Hove, and G.A. Somorjai, Surf. Sci. 121 (1982) 321 [40] U. Starke, J.B. Pendry, and K. Heinz, Progress in Surface Science 52 (1996) 53. [41] D.K. Saldin, J.B. Pendry, M.A. Vanhove, and G.A. Somorjai, Physical Review B 31
(1985) 1216. [42] A. Wander, G. Held, R.Q. Hwang, G.S. Blackman, M.L. Xu, P.d. Andres, M.A.V. Hove,
and G.A. Somorjai, Surf. Sci. 249 (1991) 21.

32
[43] H.A. Yoon, M. Salmeron, and G.A. Somorjai, Surface Science 373 (1997) 300. [44] P.J. Rous, and J.B. Pendry, Surface Science 219 (1989) 355. [45] X.G. Zhang, M.A.V. Hove, G.A. Somorjai, P.J. Rous, D. Tobin, A. Gonis, J.M.
MacLaren, K. Heinz, M. Michl, H. Lindner, K. Miiller, M. Ehsasi, and J.H. Block, Phys. Rev. Lett. 67 (1991) 1298.
[46] U. Starke, A. Barbieri, N. Materer, M.A. Vanhove, and G.A. Somorjai, Surface Science 286 (1993) 1.
[47] A. Wander, M.A. Vanhove, and G.A. Somorjai, Physical Review Letters 67 (1991) 626. [48] J.G. Roberts, S. Hoffer, M.A. Van Hove, and G.A. Somorjai, Surface Science 437 (1999)
75. [49] N. Materer, U. Starke, A. Barbieri, M.A. Vanhove, G.A. Somorjai, G.J. Kroes, and C.
Minot, Journal of Physical Chemistry 99 (1995) 6267. [50] N. Materer, U. Starke, A. Barbieri, M.A. VanHove, G.A. Somorjai, G.J. Kroes, and C.
Minot, Surface Science 381 (1997) 190. [51] M.A. Van Hove, Surface Science 603 (2009) 1301. [52] E. Lundgren, A. Mikkelsen, J.N. Andersen, G. Kresse, M. Schmid, and P. Varga, Journal
of Physics-Condensed Matter 18 (2006) R481. [53] J. Gustafson, A. Mikkelsen, M. Borg, E. Lundgren, L. Kohler, G. Kresse, M. Schmid, P.
Varga, J. Yuhara, X. Torrelles, C. Quiros, and J.N. Andersen, Physical Review Letters 92 (2004) 126102.
[54] E. Lundgren, J. Gustafson, A. Resta, J. Weissenrieder, A. Mikkelsen, J.N. Andersen, L. Kohler, G. Kresse, J. Klikovits, A. Biederman, M. Schmid, and P. Varga, Journal of Electron Spectroscopy and Related Phenomena 144-147 (2005) 367.
[55] I. Toyoshima, and G.A. Somorjai, Catalysis Reviews-Science and Engineering 19 (1979) 105.
[56] H.D. Hagstrum, in: NATO Advanced Study Institutes Series: Series B, Physics, Volume 32 eds. L. Fiermanns, J. Vennik, and V. Dekeyser. (Plenum Press, 1978).
[57] G. Margaritondo, and J.H. Weaver, in: Solid State Physics: Surfaces, Methods of Experimental Physics, Volume 22 eds. R.L. Park, and M.G. Lagally. (Academic Press, New York, 1985).
[58] R. Leckey, in: Surface Analysis Methods in Materials Science. Springer Series of Surface Sciences, Volume 23 eds. D.J. O'Conner, B.A. Sexton, and R.S.C. Smart. (Springer-Verlag, Berlin, 1992).
[59] D. Briggs, in: Electron Spectroscopy: Theory, Techniques and Applications, Volume 3 eds. C.R. Brundle, and A.D. Baker. (Academic Press, New York, 1979).
[60] J.F. Moulder, W.F. Stickle, P.E. Sobol, and K.D. Bomben, Handbook of X-Ray Photoelectron Spectroscopy (Perkin Elmer, Eden Prairie, MN, 1992).
[61] J.A. Rodriguez, and D.W. Goodman, Science 257 (1992) 897. [62] K.W. Jacobsen, J.K. Norskov, and M.J. Puska, Physical Review B 35 (1987) 7423. [63] K.W. Jacobsen, P. Stoltze, and J.K. Norskov, Surface Science 366 (1996) 394. [64] T. Bligaard, and J.K. Norskov, in: Chemical bonding at surfaces and interfaces, eds. A.
Nilsson, L.G.M. Pettersson, and J.K. Norskov. (Elsevier Science & Technology, Amsterdam, 2008).
[65] G.A. Somorjai, and B.E. Bent, Prog. Colloid Polym. Sci. 70 (1985) 38 [66] M. Mavrikakis, B. Hammer, and J.K. Norskov, Physical Review Letters 81 (1998) 2819.

33
[67] F. Abild-Pedersen, J. Greeley, F. Studt, J. Rossmeisl, T.R. Munter, P.G. Moses, E. Skulason, T. Bligaard, and J.K. Norskov, Physical Review Letters 99 (2007) 016105.
[68] A. Hellman, K. Honkala, I.N. Remediakis, A. Logadottir, A. Carlsson, S. Dahl, C.H. Christensen, and J.K. Norskov, Surface Science 603 (2009) 1731.
[69] K. Honkala, A. Hellman, I.N. Remediakis, A. Logadottir, A. Carlsson, S. Dahl, C.H. Christensen, and J.K. Norskov, Science 307 (2005) 555.
[70] J.N. Bronsted, Chemical Reviews 5 (1928) 231. [71] M.G. Evans, and M. Polanyi, Transactions of the Faraday Society 34 (1938) 0011. [72] M. Boudart, in: Handbook of Heterogeneous Catalysis, eds. G. Ertl, H. Hnozinger, and J.
Weitkamp. (Wiley-VCH, Weinheim, 1997). [73] A. Logadottir, T.H. Rod, J.K. Norskov, B. Hammer, S. Dahl, and C.J.H. Jacobsen,
Journal of Catalysis 197 (2001) 229. [74] P. Sabatier, La catalyse en chimie organique. Conference[s] faite a mm. les étudiants
américains, 1.-9 (E. Privat, Toulouse, 1919). [75] C.J.H. Jacobsen, S. Dahl, B.S. Clausen, S. Bahn, A. Logadottir, and J.K. Norskov,
Journal of the American Chemical Society 123 (2001) 8404. [76] M.P. Andersson, T. Bligaard, A. Kustov, K.E. Larsen, J. Greeley, T. Johannessen, C.H.
Christensen, and J.K. Norskov, Journal of Catalysis 239 (2006) 501. [77] T. Bligaard, M.P. Andersson, K.W. Jacobsen, H.L. Skriver, C.H. Christensen, and J.K.
Norskov, Mrs Bulletin 31 (2006) 986. [78] T. Bligaard, G.H. Johannesson, A.V. Ruban, H.L. Skriver, K.W. Jacobsen, and J.K.
Norskov, Applied Physics Letters 83 (2003) 4527. [79] J. Greeley, and J.K. Norskov, Surface Science 601 (2007) 1590. [80] J. Greeley, and J.K. Norskov, Journal of Physical Chemistry C 113 (2009) 4932. [81] L.N. Zhang, S. Singh, C.S. Tian, Y.R. Shen, Y. Wu, M.A. Shannon, and C.J. Brinker,
Journal of Chemical Physics 130 (2009) 154702. [82] K.M. Bratlie, K. Komvopoulos, and G.A. Somorjai, Journal of Physical Chemistry C 112
(2008) 11865. [83] C. Aliaga, J.Y. Park, Y. Yamada, H.S. Lee, C.K. Tsung, P.D. Yang, and G.A. Somorjai,
Journal of Physical Chemistry C 113 (2009) 6150. [84] X. Zhuang, P.B. Miranda, D. Kim, and Y.R. Shen, Physical Review B 59 (1999) 12632. [85] F. Tao, M.E. Grass, Y.W. Zhang, D.R. Butcher, J.R. Renzas, Z. Liu, J.Y. Chung, B.S.
Mun, M. Salmeron, and G.A. Somorjai, Science 322 (2008) 932. [86] F. Zaera, Applied Catalysis a-General 229 (2002) 75. [87] F. Zaera, Journal of Physical Chemistry B 106 (2002) 4043. [88] G.A. Somorjai, and C.J. Kliewer, Reaction Kinetics and Catalysis Letters 96 (2009) 191. [89] C.J. Kliewer, M. Bieri, and G.A. Somorjai, Journal of Physical Chemistry C 112 (2008)
11373. [90] K.M. Bratlie, M.O. Montano, L.D. Flores, M. Paajanen, and G.A. Somorjai, Journal of
the American Chemical Society 128 (2006) 12810. [91] K.M. Bratlie, L.D. Flores, and G.A. Somorjai, Surface Science 599 (2005) 93. [92] M.C. Yang, K.C. Chou, and G.A. Somorjai, Journal of Physical Chemistry B 108 (2004)
14766. [93] D. Loffreda, F. Delbecq, F. Vigne, and P. Sautet, Angewandte Chemie-International
Edition 44 (2005) 5279.

34
[94] D. Loffreda, Y. Jugnet, F. Delbecq, J.C. Bertolini, and P. Sautet, Journal of Physical Chemistry B 108 (2004) 9085.
