major league baseball player contracts: an investigation...
TRANSCRIPT
* We appreciate helpful comments from Mark Coppejans, Stephen Figlewski, KevinHallock, Jay Hartzell, Kenneth Lehn, Eli Ofek, Eugene Orza of the Major League BaseballPlayers Association, Laura Quigg, Joshua Rosenberg, Marti Subrahmanyam, and seminarparticipants at Baruch College, Carleton College, Georgetown University, New York University,the University of Texas, and the Western Finance Association annual meetings. We thank DougPappas of the Society for American Baseball Research for invaluable assistance with datacollection.
Major League Baseball Player Contracts:
An Investigation of the Empirical Properties of Real Options
Matthew Clayton*
Department of Finance and Business EconomicsMarshall School of Business, University of Southern California
Los Angeles, CA 90089E-mail: [email protected]
Phone: (213) 740-0781 Fax: (213) 740-6550
David Yermack
Department of FinanceStern School of Business, New York University
New York, NY 10012E-mail: [email protected]
Phone: (212) 998-0357 Fax: (212) 995-4220
September 2001
Abstract: We study contracts negotiated between professional baseball players and teams toinvestigate the use of real options in a commercial setting. Baseball contracts feature options indiverse forms, and we find that these options have significant effects on player compensation. Aspredicted by theory, players receive higher guaranteed compensation when they allow teams totake options on their future services, and lower salaries when they bargain for options to extendtheir own contracts. The apparent value of options decreases as a function of the "spread"betwen option exercise price and annual salary and increases as a function of the time untilexercise. Implied volatility of the options lies within the range found for other assets.
JEL Codes: G13, G31. Keywords: real options, baseball.
1
Major League Baseball Player Contracts:
An Investigation of the Empirical Properties of Real Options
I. Introduction
This paper studies the contracts of Major League Baseball players to investigate the use of
real options in a commercial setting. Real options arise when firms or agents have flexibility to
extend, modify, terminate or otherwise alter their contractual rights with respect to an asset. The
rights associated with real options may be acquired explicitly through contract or implicitly as a
consequence of ownership. Examples of real options in business include the right to drill for oil
on a parcel of land or to the right to produce a film from an author's screenplay. Trigeorgis
(1996) provides an introduction to real options, including a comprehensive literature survey.
In Major League Baseball, players' contracts often include provisions allowing either the
player or, more commonly, the team to extend the contract for an additional season at a fixed
salary. Baseball players' services appear well-suited to this type of option-based contracting due
to their potentially large future value and the highly uncertain evolution of this value over time.
Because options in baseball contracts are explicitly bargained for by teams and players, and
because they exhibit cross-sectional diversity of such features as timing and exercise price, they
offer an unusual opportunity for empirically investigating the breadth, sophistication and efficiency
of real options in a business environment.

2
The baseball contracts that we study feature widespread use of real options, and these
options appear to be rationally valued through the adjustment of other payments over a contract's
life. In our sample of 1,107 contracts signed by veteran players in the mid-1990s, option rights
are included about 18% of the time, with a disproportionate concentration in the contracts of
more highly-paid, talented players. Team options, equivalent to call options on a player's future
services, are far more common than player options, which are put options on the same services.
Some contracts are complex enough to include both team and player options, some have a series
of options that must be exercised sequentially, and still others include contingencies that require
the team to exercise its option if the player meets performance goals.
We do not attempt to assess whether our data are well described by formal option
valuation models. The nature of these models – whether in closed-form solution such as Black-
Scholes (1973) or in systems of equations requiring computational solution – does not generally
permit use of data on intangible assets such as baseball player contract rights. Among other
problems, we lack observable measures of volatility and the intrinsic value of the underlying
assets.
Instead, our research strategy is to examine comparative statics properties of options that
have been known to scholars as far back as Bachelier (1900). Options have value that should be
taken into account by the contracting parties through adjustment of other contract terms, such as
guaranteed compensation, contract life, and the option exercise price. Option value should, for
instance, increase as a function of time and decrease as a function of the exercise price. Our
regression analysis evaluates whether these types of first principles of option valuation are
reflected in the bargains struck by players and teams.
1 Any baseball fan can recite examples of teams lavishing exorbitant contracts upon mediocre players, and similarcases of players refusing generous contracts from their teams because of delusions that they would receive more on theopen market. At an industry-wide level, the turbulent bargaining history between players and owners has included morethan a half dozen shutdowns of Major League Baseball since 1972 for lockouts or strikes, including cancellation of the1994 World Series.
3
Regression analysis indicates that the presence of options has significant explanatory
power for baseball player compensation. As option pricing theory would predict, we find that
players receive higher guaranteed salaries when they allow the team to take options on their future
services, and lower salaries when they retain options to extend their own contracts. The apparent
value of team option premiums decreases as a function of the "spread," or option exercise price
compared to annual salary, and increases as a function of the time until the option must be
exercised. This relatively sophisticated use of contingent claims in baseball contracts may surprise
readers, since baseball players and teams share a long reputation for inept, destructive
negotiating.1 We also find that the implied volatility of options lies within the range estimated for
numerous other asset classes, such as common stocks, real estate, and natural resources.
To our knowledge, these results represent the first empirical study of a commercial market
in which agents routinely bargain over the terms of real options in order to complete contracts.
Many previous authors have identified uses of real options in business, but the empirical analysis
in these papers has generally been limited to hypothetical simulations of implicit option values or
analysis of the option component of an isolated, individual project. Leading examples have
included leasing contracts (McConnell and Schallheim (1983)), natural resource extraction
(Brennan and Schwartz (1985); Morck, Schwartz, and Stangeland (1989); Davis (1996)), the
timing of capital investments (McDonald and Siegel (1986); Majd and Pindyck (1987)), and real
estate development (Capozza and Sick (1991)). Related research has shown that prices of
4
ordinary financial assets incorporate the value of real options that exist implicitly due to regulation
or market structure. For example, equity securities include options such as the limited liability
right to default on debt (Trigeorgis (1993)) and the right to sell a firm if liquidation value exceeds
the present value of expected cash flows (Berger, Ofek and Swary (1996)).
Two prior empirical papers have studied samples of business transactions in attempts to
detect real option values: Paddock, Siegel, and Smith (1988) and Quigg (1993). Both of these
papers analyze real options that exist implicitly within property rights and have generally identical
terms, in contrast to our examination of real options whose diverse parameters emerge explicitly
as an outcome of direct bargaining between parties. Paddock et al. analyze bids on 21 Gulf of
Mexico petroleum lease tracts auctioned by the U.S. government in 1980; winning bidders
acquired options to explore the tracts and further options to drill for oil if exploration proved
promising. The authors find that an option-based model of each lease's value "correlates poorly"
with the average and winning bids actually submitted for the 21 lease parcels. They speculate that
oil producers' strategic bidding behavior and anxiety to avoid a "winner's curse" may explain some
of the disparity. Quigg (1993) studies 2,700 sales of undeveloped land in Seattle between 1976
and 1979, examining whether transaction prices include an implicit option component related to
future opportunities to redevelop the land. Quigg finds that sale prices do include an option
premium above the land's estimated intrinsic value; the estimated premium ranges from 1% to
30% with a mean of 6%.
The nature of our data allows us to examine a wider range of questions and probably
conduct statistical tests of greater power than Paddock et al. (1988) and Quigg (1993). Since the
options we study in baseball contracts are created explicitly through bilateral negotiation, we

5
expect teams and players to account carefully for their value when bargaining over other contract
terms. We also have an abundance of information about the characteristics of baseball players
whose services become subject to options, whereas the earlier studies necessarily treated oil rights
and undeveloped real estate parcels as basically homogenous. Our data therefore enable us to
explore for the first time such empirical questions as whether real option values depend as
expected on exercise price, maturity, and unique characteristics of the underlying assets.
The paper is organized as follows. Section II describes our data sources and key variable
definitions. Section III contains our analysis. Section IV presents a discussion and conclusions.
II. Data Description
Obtaining accurate data about baseball players' contracts and salaries is challenging.
Though newspapers run thousands of stories on this subject each year, information disclosed by
teams or player agents is notoriously unreliable; data are often exaggerated by one side or the
other in order to create fan interest in the team or influence ongoing negotiations with other
players. In addition, tabulations of player salaries published in newspapers usually ignore
important elements such as the time value of money in multi-year contracts or contingent future
payments.
Our source of player compensation data is the "Joint Exhibit 1," an official document
produced annually by Major League Baseball (the sport's governing authority) and the Major
League Baseball Players Association (the players' union) pursuant to their collective bargaining
agreement. The Joint Exhibit 1 contains authoritative, comprehensive descriptions of contract
terms for all players active on August 31 of the prior season, supplemented by data such as each
2 Inspection of the data indicates that players with less than three years experience receive vastly lower pay thanveterans, and that one-year contracts are almost universal among this group. Rookies almost invariably earn the majorleague minimum salary ($109,000 during most of our sample period) and can usually expect only modest increases untilthey complete their third season, even if they become All Stars before then.
An interesting exception to this pattern occurred in the early 1990s when the Cleveland Indians signed a group oftalented first- and second-year players to lucrative long-term contracts as a strategy for reducing long-term payroll costs. The strategy was somewhat successful, as Cleveland reached the World Series twice in the mid-1990s, but the Indianseventually traded or chose not to re-sign most of these players. Currently some other teams have begun emulating thispayroll strategy, but it was generally not used during the time of our sample. As of 2000, Cleveland has not won theWorld Series in 52 years.
6
player's length of service and whether contingent incentive bonuses under prior contracts were in
fact earned. By terms of the collective bargaining agreement this document is confidential, and
we were rebuffed in attempts to obtain it from official sources. However, we were fortunate to
be provided with the 1994, 1996, and 1997 editions of the Joint Exhibit 1 by Doug Pappas,
chairman of the Business of Baseball Committee of the Society for American Baseball Research,
an organization devoted to the study of on- and off-field aspects of the sport. Our main sample of
player contracts is transcribed from this source; unfortunately, we did not have access to the 1995
document. Contract terms are repeated in future annual editions of the Joint Exhibit 1 so long as
a player remains active on August 31 of the following season, so we did obtain data for most
contracts signed in 1994 (exceptions consisted mainly of players who signed contracts before the
1994 season and subsequently retired before August 1995).
We use individual player contracts as our unit of analysis. Since many players have long-
term agreements that last for up to six years, not everyone signs a new contact each season.
Importantly, we drop from our sample those players with less than three years experience at the
time of their contract signings, because baseball's bargaining framework creates severe restrictions
on their compensation. Players with less than three years service may negotiate contracts only
with their current teams and do not have the right to sell their services on the open market.2 After
3 In arbitration, the player and team submit proposed one-year salaries. A neutral arbitrator holds a hearing andthen must select one salary or the other, based on the compensation of other players with similar performance histories. The procedure facilitates compromises by forcing teams and players to make binding contract proposals; the vast majorityof cases settle during the interval between offer submission and the hearing, with players and teams often splitting thedifference between their proposals. In unusual cases when a team proposes a salary higher than the player, the playerreceives the team's offer.
A small quota of players who come close to having three years experience are also eligible for arbitration eachyear, but we exclude this group because the exact service threshold and number of players eligible changes each season.
4 One observation is dropped from our regressions related to options, because our source did not report completedata for the terms of the contract’s option year.
5 Our data source covers each team's active roster of 25 players as of August 31 of the previous season, plusinjured players on the disabled list at that time, plus a fairly large number of inexperienced players who had signed majorleague contracts at some point during the season when moving transiently between the major and minor leagues. MajorLeague Baseball expanded from 26 to 28 teams in 1993 (and again to 30 teams in 1998, after our sample period), so thatapproximately 800 to 900 players could be considered "major leaguers" at any time during our sample period. Excludingplayers with less than three years experience, our data cover approximately 500 veteran players active at any given time.
7
three years, players are still restricted to negotiating with only their own teams but gain the right
to salary arbitration, an established procedure in which expert third parties use league-wide data
to resolve salary disputes between veteran players and teams.3 After six years, players gain the
right to "free agency," under which they essentially may auction their services to the highest-
bidding teams (players with more than three years' service may also become free agents if their
teams do not agree to salary arbitration, but such cases are rare). Tremendous mobility of players
among teams and spectacular bidding wars have characterized the market for veteran players
since arbitration and free agency were introduced in stages during the 1970s.
Limiting our analysis to players with three or more years of service, we obtain a sample of
1,107 contracts signed between 1989 and 1996.4 Of these, 752 are one-year contracts while the
remainder provide for between two and six guaranteed years, so that our sample covers a total of
1,790 guaranteed player-years. The sample represents a nearly comprehensive cross-section of
contracts in effect for veteran players in the mid-1990s.5
Players receive compensation in several forms, including signing bonuses, base salaries,
8
PV of Contract ' Signing Bonus % jT
n ' 1
Salaryn
(1 % kn ) (n & 1)% j
T
n ' 1
Incentives 1
(1 % kn ) (n & 1) (1)
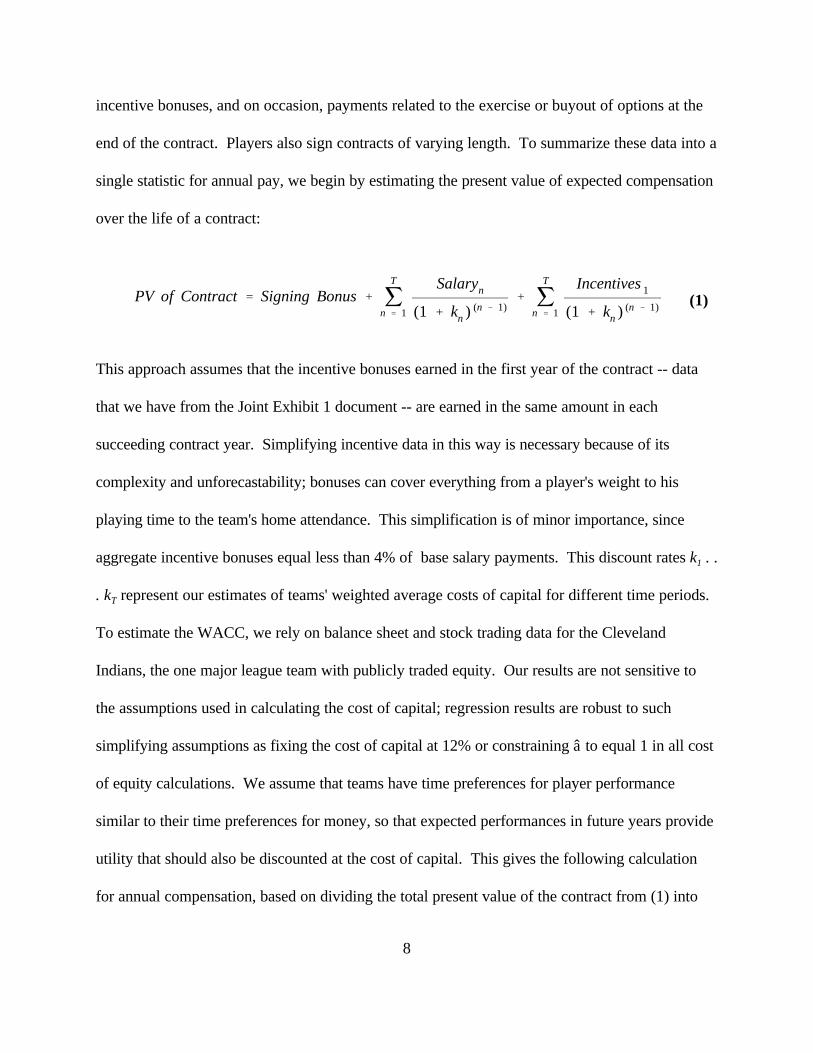
incentive bonuses, and on occasion, payments related to the exercise or buyout of options at the
end of the contract. Players also sign contracts of varying length. To summarize these data into a
single statistic for annual pay, we begin by estimating the present value of expected compensation
over the life of a contract:
This approach assumes that the incentive bonuses earned in the first year of the contract -- data
that we have from the Joint Exhibit 1 document -- are earned in the same amount in each
succeeding contract year. Simplifying incentive data in this way is necessary because of its
complexity and unforecastability; bonuses can cover everything from a player's weight to his
playing time to the team's home attendance. This simplification is of minor importance, since
aggregate incentive bonuses equal less than 4% of base salary payments. This discount rates k1 . .
. kT represent our estimates of teams' weighted average costs of capital for different time periods.
To estimate the WACC, we rely on balance sheet and stock trading data for the Cleveland
Indians, the one major league team with publicly traded equity. Our results are not sensitive to
the assumptions used in calculating the cost of capital; regression results are robust to such
simplifying assumptions as fixing the cost of capital at 12% or constraining â to equal 1 in all cost
of equity calculations. We assume that teams have time preferences for player performance
similar to their time preferences for money, so that expected performances in future years provide
utility that should also be discounted at the cost of capital. This gives the following calculation
for annual compensation, based on dividing the total present value of the contract from (1) into
6 For example, Mark Grace's 1996 contract with the Chicago Cubs called for a $4,150,000 salary in 1996, aplayer option for $4,600,000 for 1997, and a team option for 1998 at $5,250.000. The 1998 team option could only beexercised if the player first exercised his 1997 option.
9
Annual Compensation '
Signing Bonus % jT
n ' 1
Salaryn
(1 % kn ) (n & 1)% j
T
n ' 1
Incentives 1
(1 % kn ) (n & 1)
1
jT
n ' 1(1 % kn ) (n & 1)
(2)
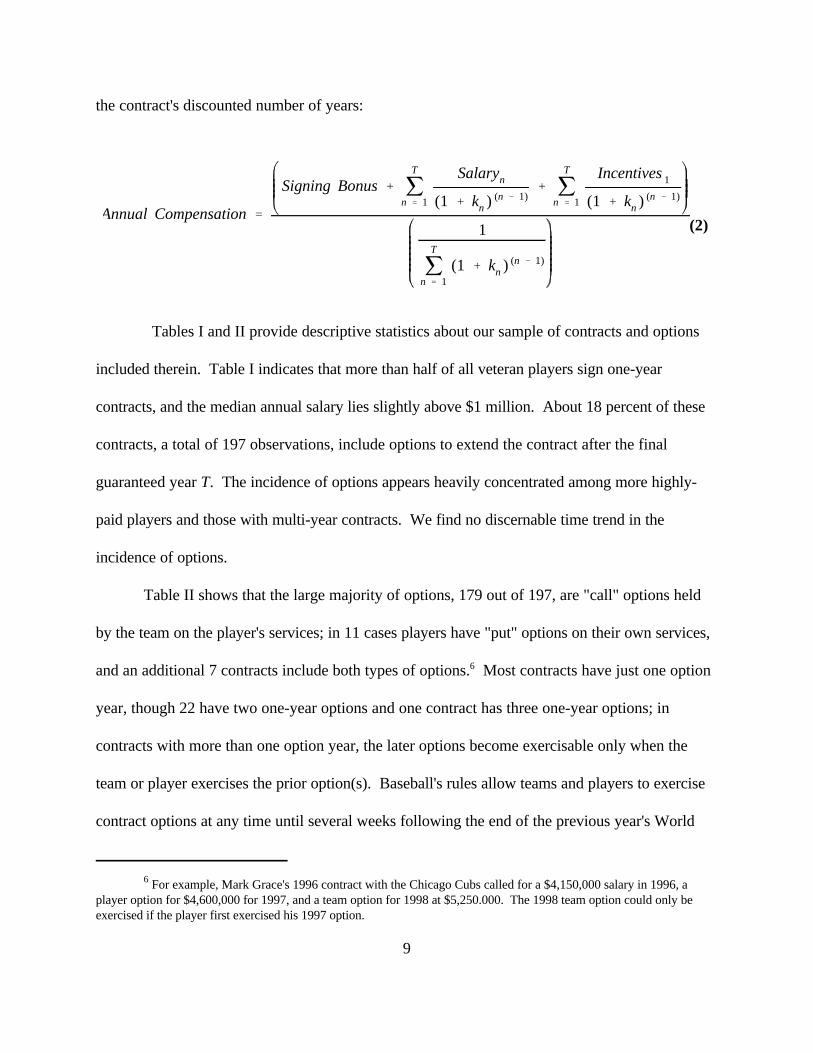
the contract's discounted number of years:
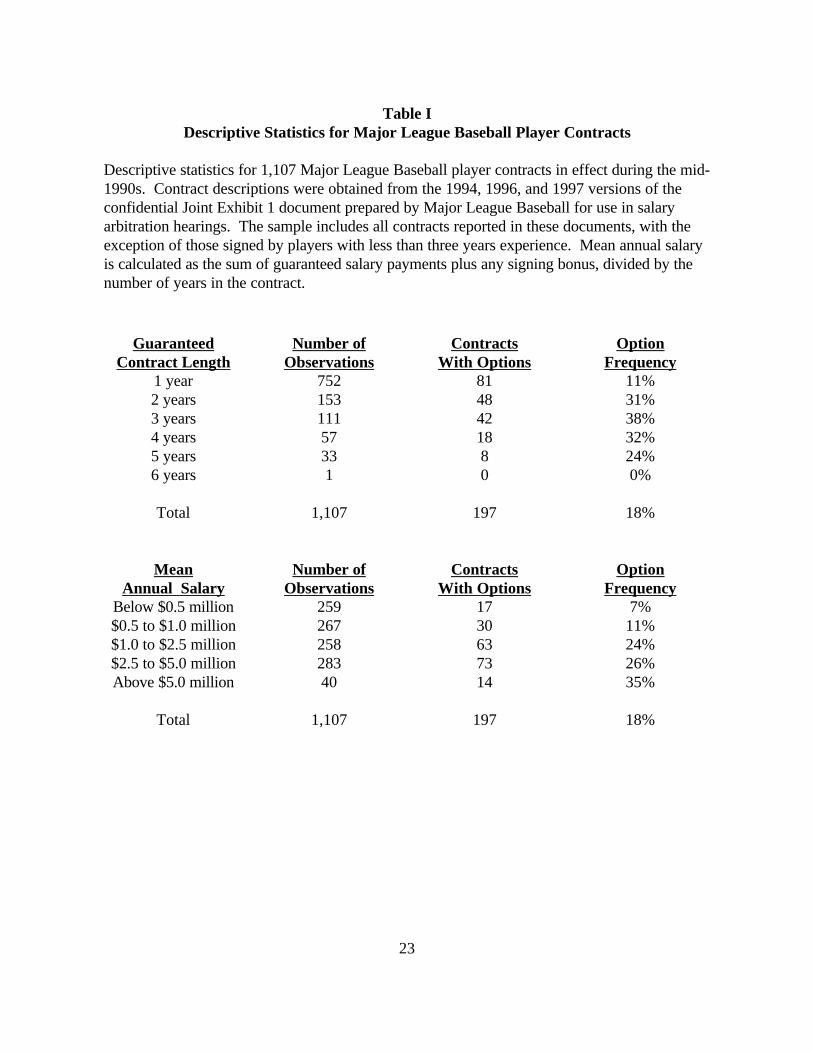
Tables I and II provide descriptive statistics about our sample of contracts and options
included therein. Table I indicates that more than half of all veteran players sign one-year
contracts, and the median annual salary lies slightly above $1 million. About 18 percent of these
contracts, a total of 197 observations, include options to extend the contract after the final
guaranteed year T. The incidence of options appears heavily concentrated among more highly-
paid players and those with multi-year contracts. We find no discernable time trend in the
incidence of options.
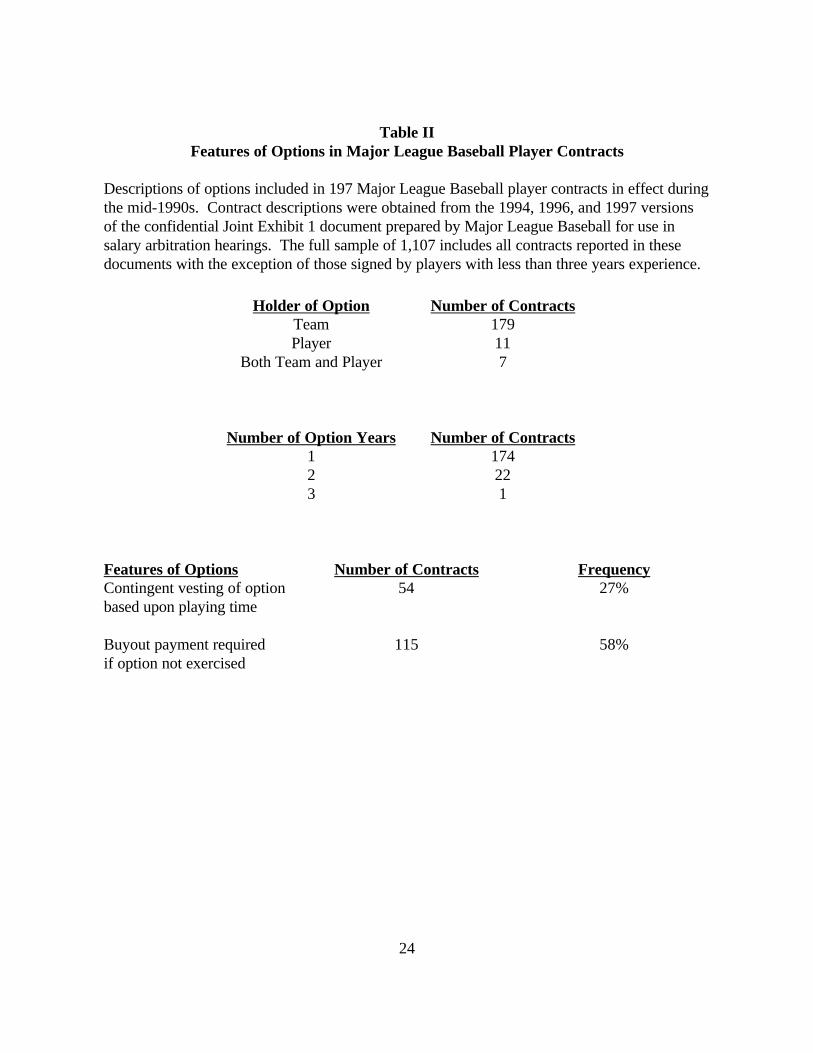
Table II shows that the large majority of options, 179 out of 197, are "call" options held
by the team on the player's services; in 11 cases players have "put" options on their own services,
and an additional 7 contracts include both types of options.6 Most contracts have just one option
year, though 22 have two one-year options and one contract has three one-year options; in
contracts with more than one option year, the later options become exercisable only when the
team or player exercises the prior option(s). Baseball's rules allow teams and players to exercise
contract options at any time until several weeks following the end of the previous year's World
7 For example, Larry Walker's 1995 contract with the Colorado Rockies included four guaranteed years and afifth option year that would vest and become guaranteed if he came to bat 475 times in the fourth year or 1,075 times inthird plus fourth years (a regular player will bat approximately 600 times in a season if he stays injury-free). Theseprovisions occasionally create moral hazard problems, with teams holding players out of the lineup to prevent options fromvesting. Baseball prohibits contract terms related to on-field statistics other than playing time, but occasionally optionsinclude vesting provisions related to achievements such as a large number of votes in the Most Valuable Player balloting orselection to the All Star team.
10
Series, but since it would not be rational for either the team or player to exercise an option early,
the options essentially resemble European calls and puts.
About one-fourth of all options include "vesting" provisions under which the team would
be required to exercise the option if an uncertain future event occurred. The vesting
contingencies almost always involve playing time, requiring the player to appear in a certain
number of games or come to bat a certain number of times in the year(s) before the team's option
exercise decision. Generally a player will meet these contingencies if he avoids injuries and holds
a regular starting position.7
Among our 179 contracts that include team options, 114 have "buyout" provisions that
require that team to pay a fixed sum to the player if it does not exercise the option (one contract
with a player option also includes a buyout provision). Since a player is guaranteed to receive this
money whether or not the option is exercised, we modify the calculations for total compensation
in (1) and (2) by adding buyout amounts to a contract's final year guaranteed salary and
subtracting these amounts from the option exercise price.
We merge our data on player contracts with data on player performance and personal
characteristics. Unlike contract data, which is difficult to obtain, baseball performance statistics
are available from an enormous range of published and on-line sources (and are arguably more
accessible to the public than even data about the stock market). Most of our performance and
11
log yi ' x )
i â % åi (3)
player data was downloaded from authoritative databases maintained by STATS, Inc., a
commercial service that dominates the market for sports statistics.
III. Analysis
To isolate the role of options in baseball player contracts, we build a regression model that
attempts to explain as much of a player's compensation as possible. We then augment our
regressions by adding explanatory variables that indicate the presence of options and describe
their characteristics. Our statistical tests examine whether a player's overall compensation is
adjusted in a rational way to reflect the presence and structure of these options.
A. Benchmark Regression Model of Player Compensation
To begin our analysis, we fit a regression model that attempts to explain the level of a
player's compensation. Our specification and functional form is similar to prior labor economics
research related to baseball such as Kahn (1983) and Burgess and Marburger (1993). We
estimate an OLS regression with the dependent variable equal to the log of annual compensation,
as defined in (2) above:
We use an exhaustive range of explanatory variables, including a player's age and years of
major league service; indicator variables for the year of contract signing, the team signed with,
8 Our indicator variables for position played are not defined as (0, 1) dummies. Instead we divide games playedat each position by a player's total number of games played in the field, so that the sum of the position variables is 1.00 forall players except designated hitters.
12
P1 (Pitching Variables) % (1 & P1) (Batting Variables) (4)
and the position played by the player;8 a minority race dummy variable that equals 1 if the player is
not a U.S.-born Caucasian; and indicator variables for players who had no performance data in
one of the three years prior to contract signing, which could occur because of serious injuries,
temporary retirements, or, in a handful of cases, players temporarily moving to the Japanese
league. We include an indicator for players who change teams when they sign new contracts,
since Lehn (1990) presents evidence that prior team’s decision not to retain the player may
represent an adverse selection problem related to its information about the player’s skill,
motivation, or health. Most importantly, we include a wide range of on-field batting, pitching and
fielding performance statistics for the year preceding the contract signing and also for the prior
two years. Batting variables include at bats, runs, hits, doubles, triples, home runs, runs batted in,
bases on balls, stolen bases, times caught stealing, and times grounded into double plays, as well
as their squares and two years of lagged data for both linear and squared terms. For pitchers,
performance variables include games, games started, complete games, games finished, wins,
losses, saves, hits allowed, earned runs allowed, bases on balls, and strikeouts. Since batting
statistics do not apply to pitchers and pitching statistics do not exist for batters, we incorporate
them into the regression model using an indicator variable, P1, which equals 1 for pitchers and 0
for position players:
Fielding statistics are difficult to interpret in baseball and are not clearly comparable across

13
yi ' ex )
i â% µ i
(5)
positions. We therefore identify players with strong fielding ability by including an indicator
variable if a player wins a Gold Glove award for being voted the outstanding fielder at his position
in the year prior to contract signing; we also include a player's cumulative total of Gold Gloves
won and its square. Our performance variables are extremely collinear, and we are not concerned
with their individual coefficient estimates or standard errors since our goal instead is to construct
a regression model that explains a substantial part of the variation in player compensation.
Given the structure of our later tests for impact of options upon contract values, it will be
convenient for us to exponentiate both sides of (3) and estimate regressions of the form:
We estimate our regressions using TSP's nonlinear least squares LSQ procedure; the resulting
estimates are equivalent to maximum likelihood estimates under the assumption that the µ i
disturbances follow a normal distribution.
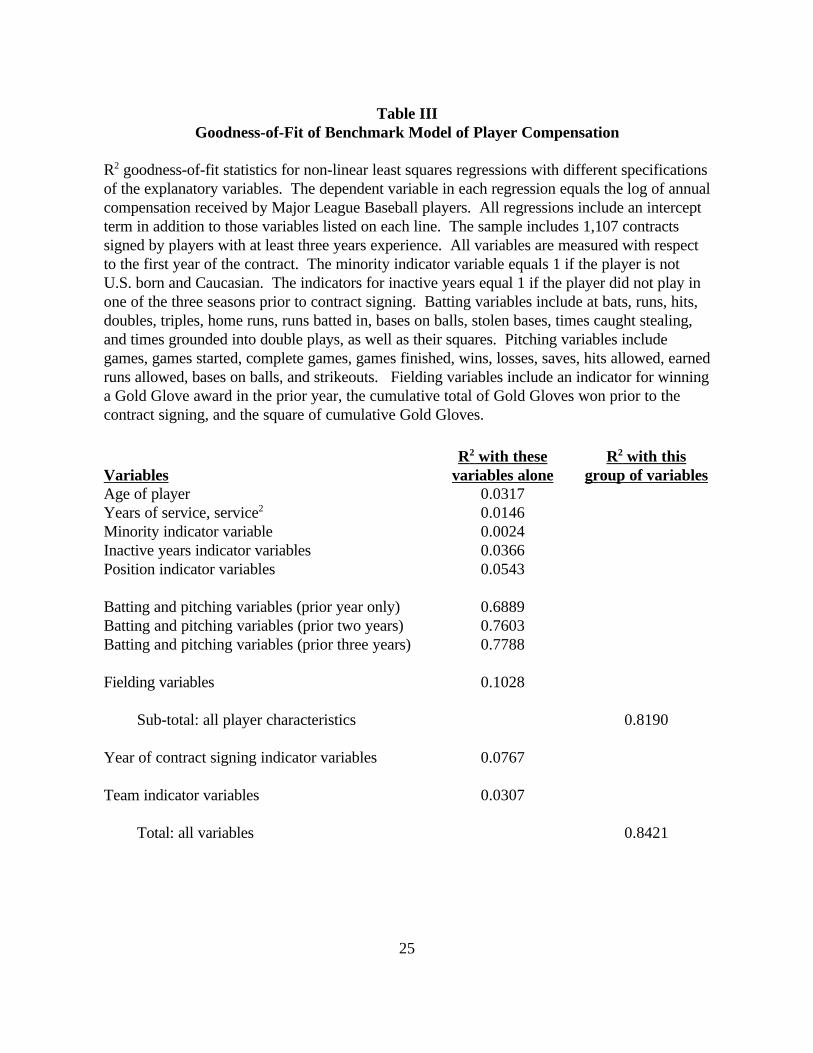
The benchmark regression model (5) appears quite successful as a tool for predicting
player compensation. We achieve high R2 goodness-of-fit statistics of approximately 0.80 to
0.85, depending on the exact specification used. Table III provides detail about the variation in
player compensation explained by various regressors alone and in combination. The table shows
R2 statistics for regressions of annual compensation, as defined in (2) above, against an intercept
and different sets of regressors. On-field performance seems overwhelmingly important in
determining player compensation, as the prior year's batting or pitching statistics alone can
account for more than two-thirds of the variation in a player's annual pay and the prior three years'
14
statistics account for more than three-fourths. Defensive ability appears important, though less so
than batting or pitching prowess, as data about prior Gold Glove awards explains about 10
percent of the variation in pay and dummy variables for position played explain about 5 percent.
The year of contract signing and the identity of the team signed with also have significant
explanatory power for player compensation when studied in the absence of other factors, but their
incremental importance appears small since their inclusion along with the model's other data
improves R2 only from 0.82 to 0.84. A player's race, age, and years of service appear to have
only a minor role in determining pay variation; these findings are interesting because they imply
that discrimination and seniority, two factors that are very important in much labor economics
research, do not play large roles in the market for established baseball players.
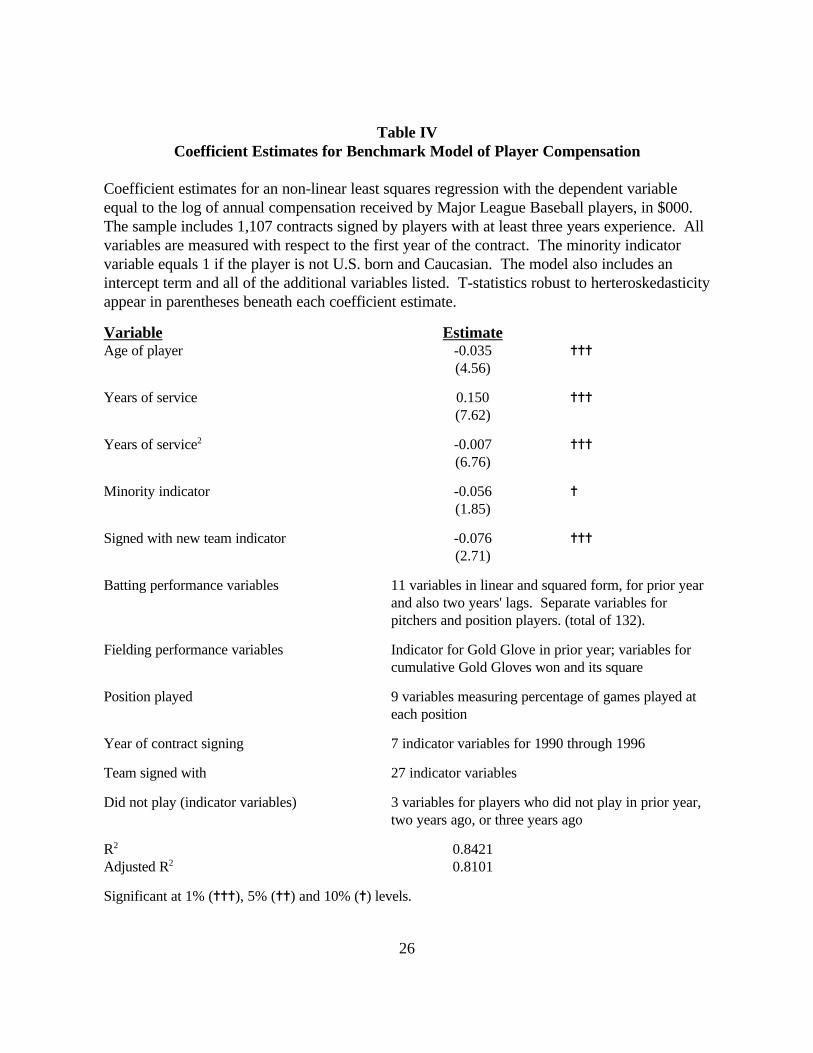
Table IV provides a list of explanatory variables used in our benchmark model, coefficient
estimates for certain variables, and summary statistics about the regression. Several of our
coefficient estimates are interesting because of prior academic research or widely held public
beliefs about the market for baseball players. We find that players' fixed compensation increases
with experience, as indicated by the positive coefficient on the linear term, but that this increase
occurs as a decreasing rate, as indicated by the negative coefficient on the quadratic term. This
mirrors the results of Blass's (1992) study of human capital accumulation by baseball players.
Players who sign with new teams receive compensation about 7.6 percent lower than expected, in
line with Lehn’s (1990) conjectures about information asymmetries creating a “lemons” problem
in the baseball labor market. We find that non-white and non-U.S. players earn about 5.6 percent
less fixed pay than their white, U.S. counterparts; Hill and Spellman (1984) provide a survey of
prior studies that have reached divergent conclusions on whether discrimination impacts the
9 Florida drastically reversed this policy in 1998, after the cutoff date for our study.
15
market for baseball players. Dummy variable coefficients for individual years (not tabulated to
save space) indicate an upward trend in guaranteed player compensation through 1994 before a
sharp drop in 1995; this pattern can be readily attributed to the financially ruinous players strike
that occurred in August 1994 and was not settled until the intervention of the U.S. federal courts
the following April. Catchers, shortstops, and center fielders earn higher fixed pay than other
position players, according to our position indicator variables; these results make sense since
those three positions are the most important in a team's defense. Dummy variable estimates for
teams (also not tabulated) generally reflect beliefs widely held among baseball fans about different
clubs' bargaining practices; the Montreal Expos and Milwaukee Brewers, two teams known to be
tightfisted, are among those paying the lowest compensation after controlling for all other
variables, while the famously profligate New York Yankees, Los Angeles Dodgers, and Florida
Marlins are among those teams paying the highest.9 However, some surprises emerge among the
team dummy variable estimates. For instance, the Pittsburgh Pirates, a team with a notoriously
small payroll, are estimated to lie among those teams with the highest salary structures after
controlling for performance, seniority, and other factors; this suggests that Pittsburgh's low
aggregate payroll results not from penurious negotiating, but rather from a tendency to fill its
roster with lower-skilled, less experienced players who are nevertheless overpaid relative to their
market values.
B. Valuation of Team and Player Options
When players take long or short positions in options on their own services as part of the
16
yi ' ex )
i â (1 % ãi ) % µ i(6)
yi ' ex )
i â % ãi % µ i(7)
ãi 'ø i ä
1
jTi
n ' 1(1 % kn ) (n & 1)
(8)
bargaining process with their teams, the contract should include a value transfer that reflects the
option's worth. Our empirical strategy to detect this value transfer relies on our benchmark
regression model of player compensation, with the dependent variable measuring annual pay.
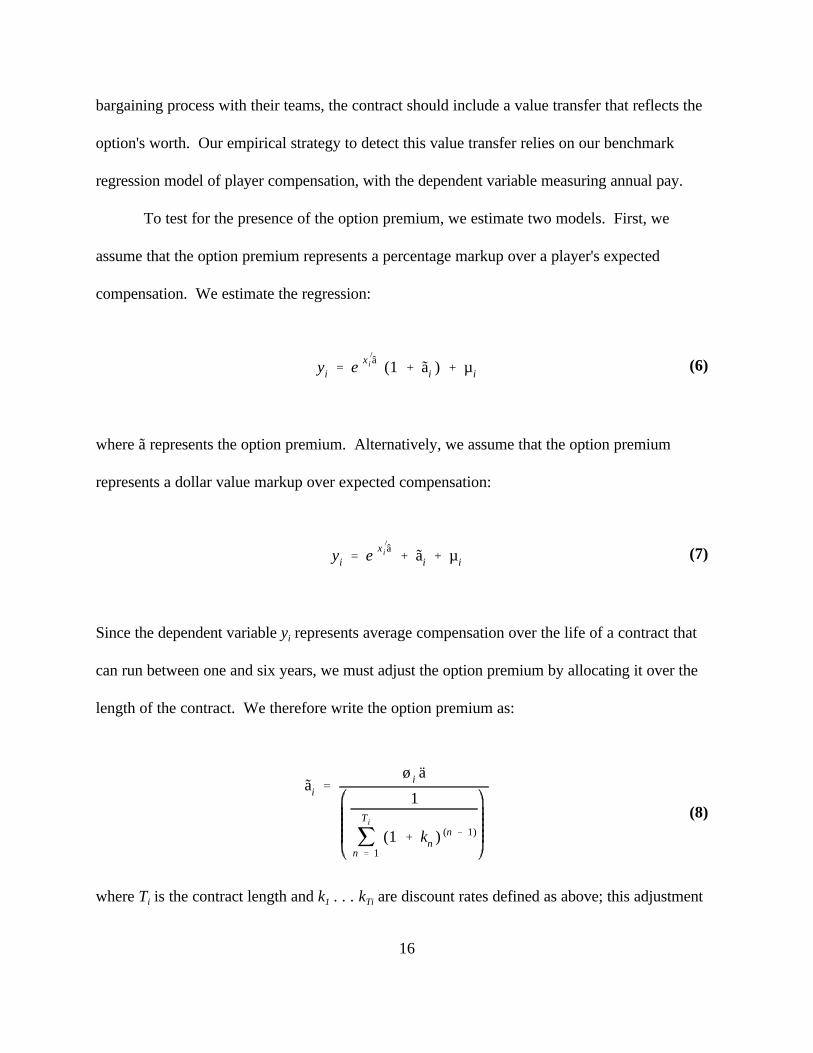
To test for the presence of the option premium, we estimate two models. First, we
assume that the option premium represents a percentage markup over a player's expected
compensation. We estimate the regression:
where ã represents the option premium. Alternatively, we assume that the option premium
represents a dollar value markup over expected compensation:
Since the dependent variable yi represents average compensation over the life of a contract that
can run between one and six years, we must adjust the option premium by allocating it over the
length of the contract. We therefore write the option premium as:
where Ti is the contract length and k1 . . . kTi are discount rates defined as above; this adjustment
17
yi ' ex )
i â(1 % ãi1
) (1 % ãi2) % µ i (9)
yi ' ex )
i â % ãi1% ãi2
% µ i (10)
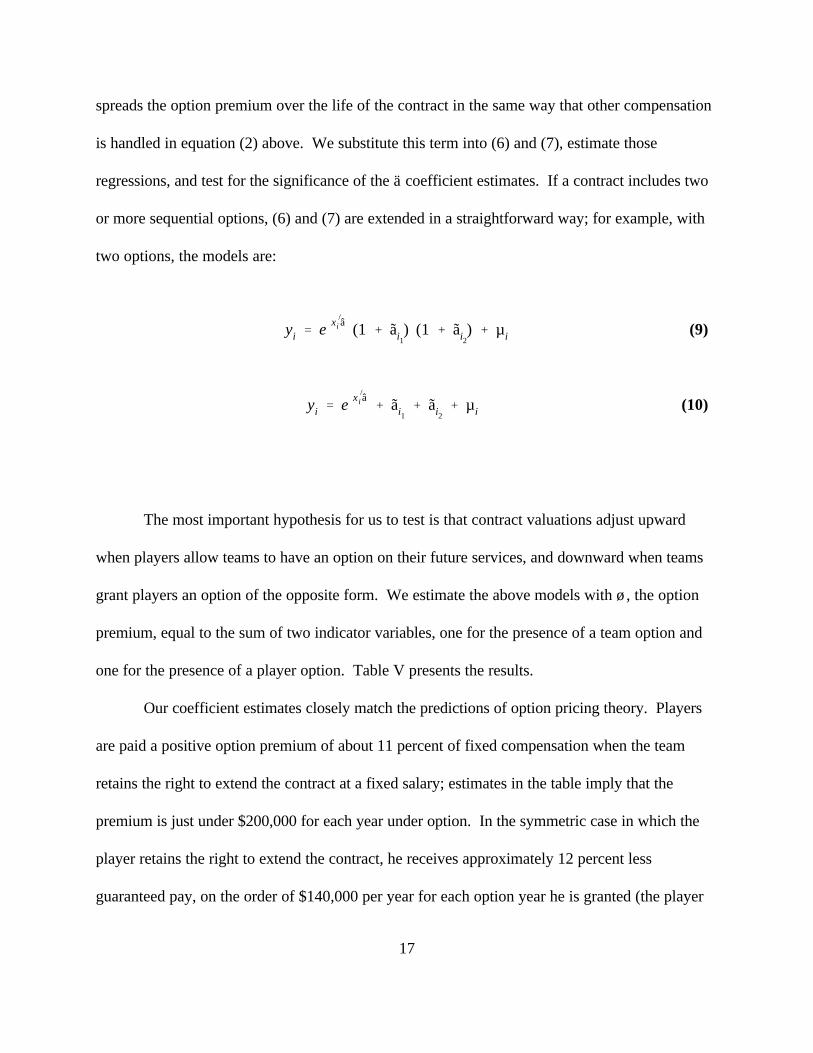
spreads the option premium over the life of the contract in the same way that other compensation
is handled in equation (2) above. We substitute this term into (6) and (7), estimate those
regressions, and test for the significance of the ä coefficient estimates. If a contract includes two
or more sequential options, (6) and (7) are extended in a straightforward way; for example, with
two options, the models are:
The most important hypothesis for us to test is that contract valuations adjust upward
when players allow teams to have an option on their future services, and downward when teams
grant players an option of the opposite form. We estimate the above models with ø , the option
premium, equal to the sum of two indicator variables, one for the presence of a team option and
one for the presence of a player option. Table V presents the results.
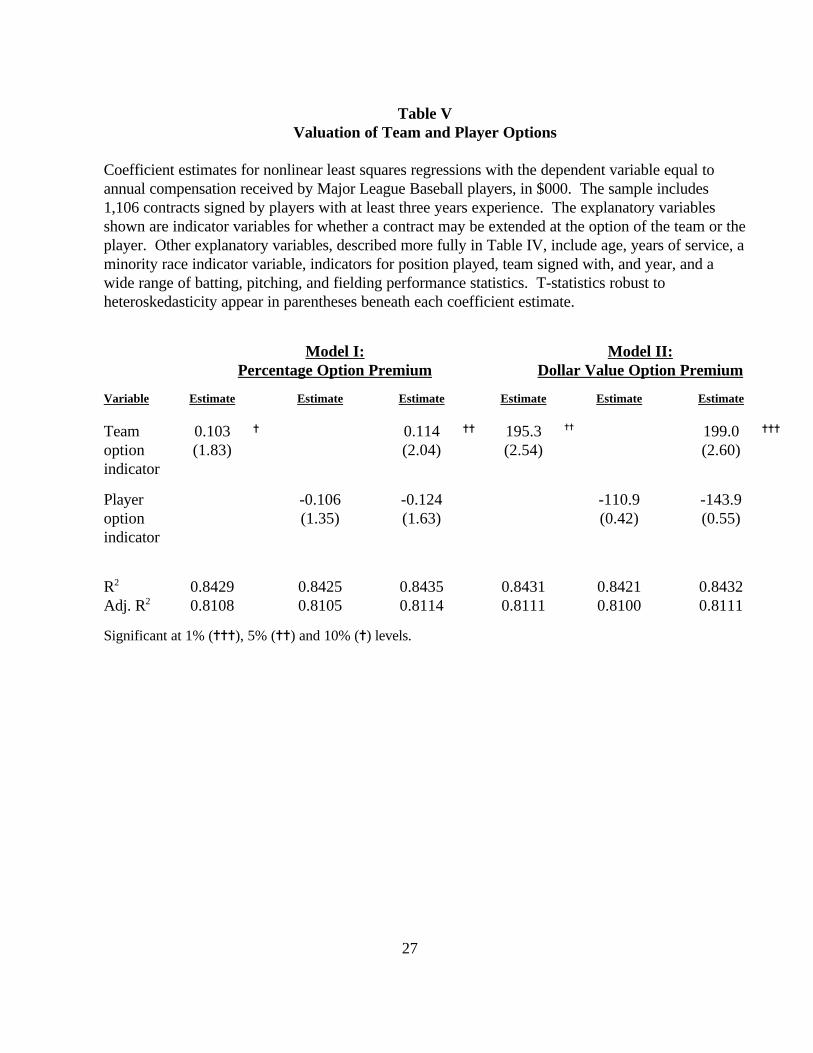
Our coefficient estimates closely match the predictions of option pricing theory. Players
are paid a positive option premium of about 11 percent of fixed compensation when the team
retains the right to extend the contract at a fixed salary; estimates in the table imply that the
premium is just under $200,000 for each year under option. In the symmetric case in which the
player retains the right to extend the contract, he receives approximately 12 percent less
guaranteed pay, on the order of $140,000 per year for each option year he is granted (the player
18
estimates are not statistically significant). The dollar amounts of these option premia are
significant though not staggering in relation to player compensation; the average first-year salary
of the contracts including these options is $2.63 million for contracts with player options and
$1.99 million for contracts that include team options.
C. Further Analysis of Team Options
Estimates in Table V indicate that the value of players' contracts includes a positive
premium when teams receive a call option on the player's services, and a negative premium when
the player receives a put option, though the latter result has marginal statistical significance at
best. In this section, we study the behavior of team option premia as a function of two parameters
upon which option value should depend: exercise price and option life. We only analyze team
options because of the rarity of player options, which appear in only 18 of our 1,107 contracts, or
less than 2 percent, compared to an incidence of 186 team options, or 16 percent.
i. Exercise price
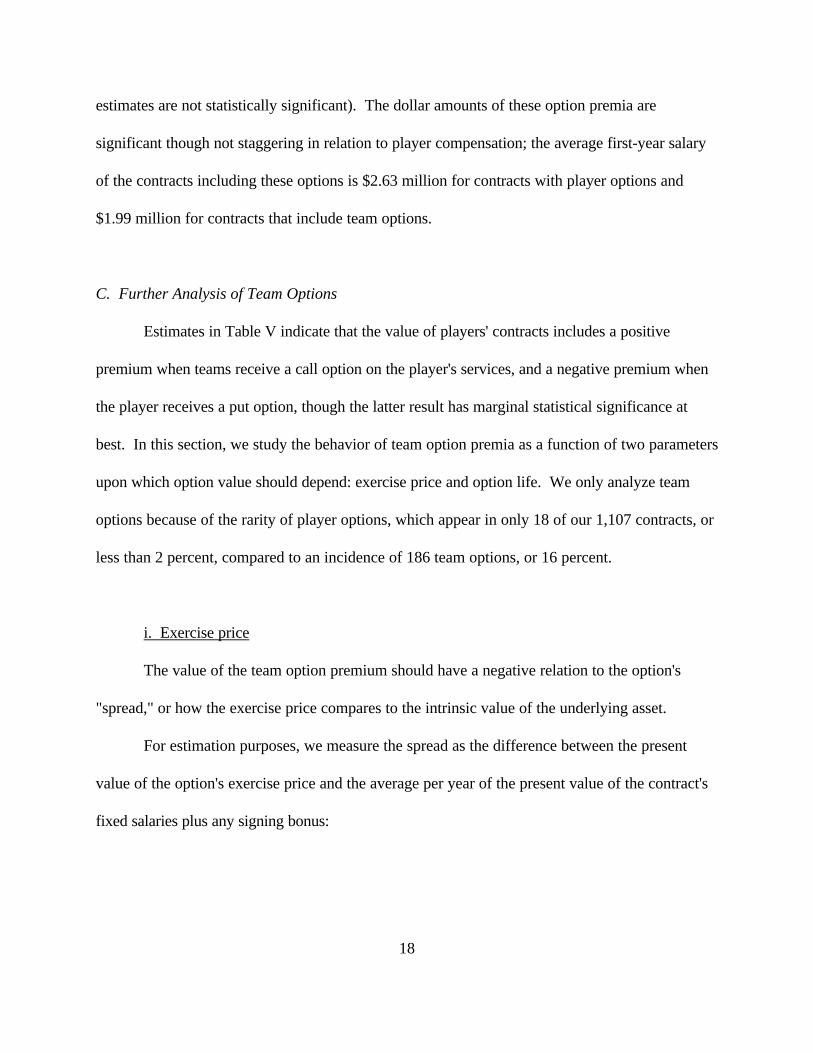
The value of the team option premium should have a negative relation to the option's
"spread," or how the exercise price compares to the intrinsic value of the underlying asset.
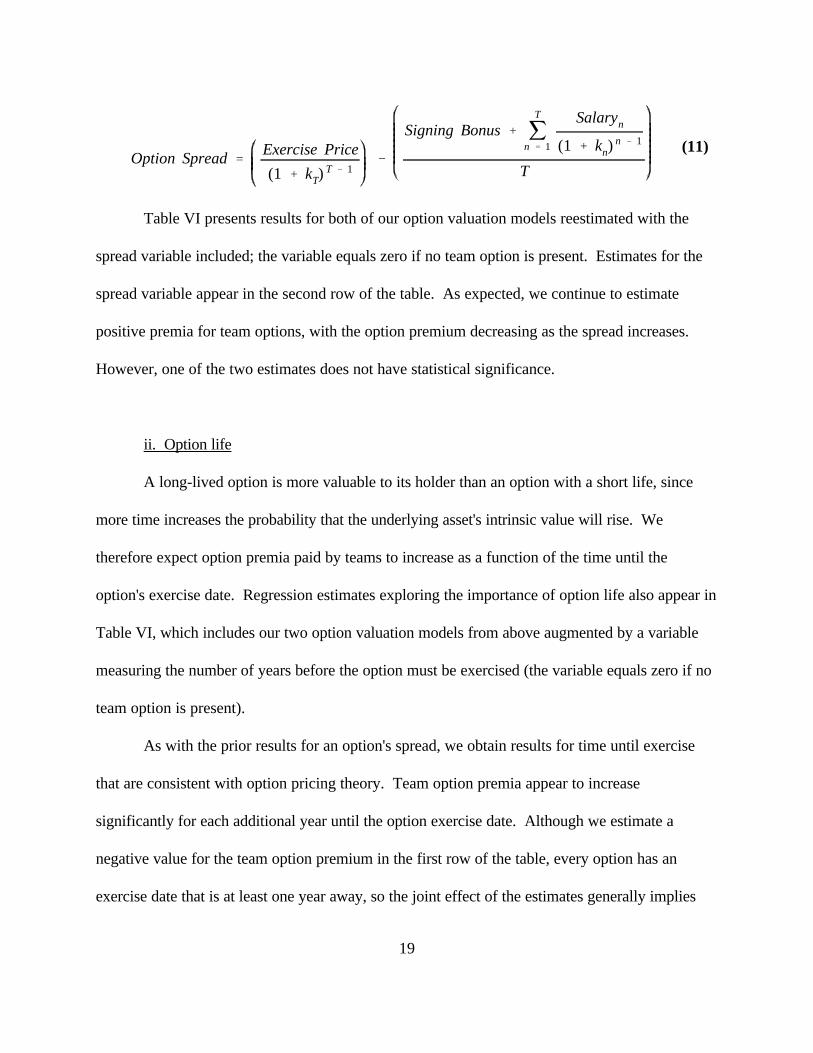
For estimation purposes, we measure the spread as the difference between the present
value of the option's exercise price and the average per year of the present value of the contract's
fixed salaries plus any signing bonus:
19
Option Spread 'Exercise Price
(1 % kT) T & 1&
Signing Bonus % jT
n ' 1
Salaryn
(1 % kn)n & 1
T
(11)
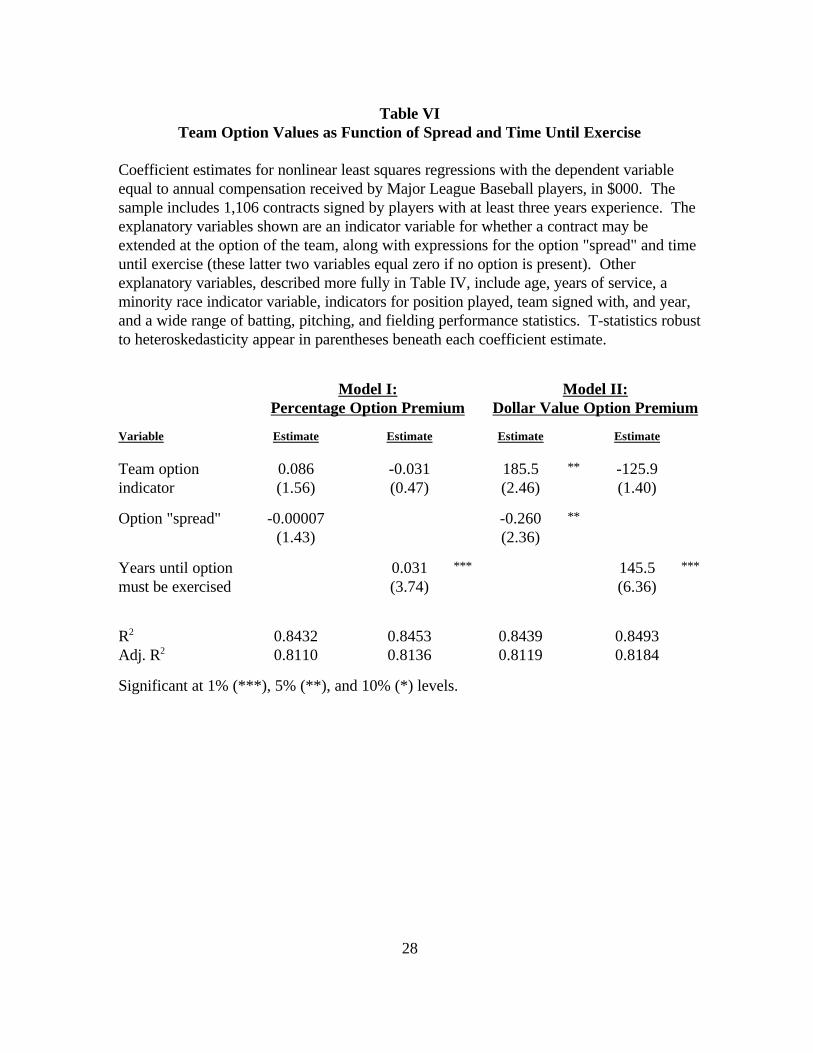
Table VI presents results for both of our option valuation models reestimated with the
spread variable included; the variable equals zero if no team option is present. Estimates for the
spread variable appear in the second row of the table. As expected, we continue to estimate
positive premia for team options, with the option premium decreasing as the spread increases.
However, one of the two estimates does not have statistical significance.
ii. Option life
A long-lived option is more valuable to its holder than an option with a short life, since
more time increases the probability that the underlying asset's intrinsic value will rise. We
therefore expect option premia paid by teams to increase as a function of the time until the
option's exercise date. Regression estimates exploring the importance of option life also appear in
Table VI, which includes our two option valuation models from above augmented by a variable
measuring the number of years before the option must be exercised (the variable equals zero if no
team option is present).
As with the prior results for an option's spread, we obtain results for time until exercise
that are consistent with option pricing theory. Team option premia appear to increase
significantly for each additional year until the option exercise date. Although we estimate a
negative value for the team option premium in the first row of the table, every option has an
exercise date that is at least one year away, so the joint effect of the estimates generally implies
10 We cannot estimate implied volatility for all of the individual options in our sample, because some outlierobservations have very large or very small option premia that make a solution impossible. Attempts to estimate theimplied volatility through maximum likelihood regressions failed to achieve convergence.
20
zero or positive option premium paid by the team to the player.
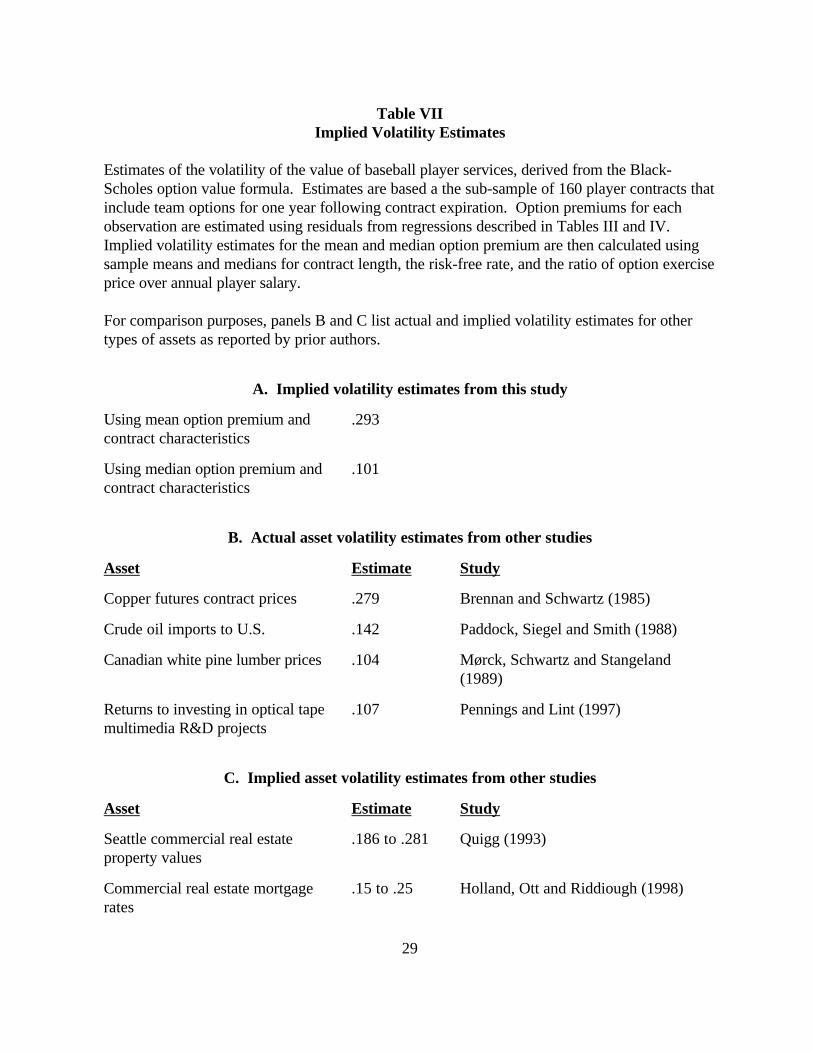
C. Implied volatility
As a reality check on the validity of our results, we estimate the implied volatility of
baseball player services using the option premiums estimated in our regressions. We run our
benchmark regression model over the entire sample and save the residuals for the 160
observations that include team options for a single year after contract expiration. From these
residuals, we calculation the mean option premium per dollar of fixed salary as 11.4 cents (median
6.5 cents). With these mean and median option values, we use the Black-Scholes formula to
calculate implied option volatility (mean and median sample data for risk-free rates and contract
length are used in the calculations). We estimate implied volatility as 0.293 for the “average”
option and 0.101 for the “median” option.10
These volatility estimates agree very closely with actual and implied volatility estimates for
other assets as reported in the literature. Table VII presents comparisons with such things as
precious metals, lumber, real estate, and the cash flows realized from a portfolio of technology
investments. These volatilites, obtained from a wide range of authors and time periods, range
betwen .10 and .30, exactly the range in which our estimates fall.
D. Options with Exercise Contingencies
Of those contracts with options, about 27 percent contain "vesting" provisions that require
11 These subgroups include such well-known players as Cal Ripken Jr., David Cone, Jeff Bagwell and Jose Canseco.
21
the team to exercise the option if the player meets certain performance criteria, generally related
to playing time. A further 12 percent of the contracts include sequences of two or three
successive options; if the first option is not exercised, the remaining options become void.
Vestable options and the latter options in a sequence should each have less economic
value than options without similar conditions. We test these hypotheses by multiplying our ã
option premium terms by indicator variables for vestable options and for those options in the
latter part of a sequence. Regression estimates for these variables are not significant in any of our
models. When we estimate option premiums on a percentage basis, vestable options are estimated
to have value 31 percent lower than other options (t-statistic = 0.47), while sequential options
have value 6 percent higher than usual (t-statistic = 0.05). For option premiums estimated on a
dollar value basis, both estimates are markedly positive instead of negative.
We do not have a clear explanation for this pattern of results, but we conjecture that the
incidence of vestable and sequential options may be correlated with omitted variables that would
also imply higher compensation for the player. Players with vestable options tend to be among
the higher-paid in our sample; the mean first-year salary of their contracts is $2.28 million,
compared to $1.91 million for contracts with options that are non-vestable and $1.40 million for
contracts with no options; players signing contracts with sequential options receive mean first-
year salaries of $2.56 million. It is possible that these subgroups of players have "star quality" fan
appeal beyond that implied by their statistics and as a result teams pay them higher salaries.11
22
IV. Discussion and Conclusions
We study the role of options in the contracts of Major League Baseball players. To our
knowledge, our results represent the first empirical study of a commercial market in which agents
routinely bargain over the terms of real options in order to complete contracts.
In our sample of 1,107 contracts signed by veteran players in the mid-1990s, option rights
are included about 18 percent of the time, with a disproportionate concentration in the contracts
of more highly-paid, talented players. Team options, equivalent to call options on a player's
services, are far more prevalent than put options held by players on their own services.
We find that the presence of options has significant explanatory power for patterns of
player compensation. As option pricing theory would predict, players receive higher guaranteed
compensation when they allow the team to take options on their future services, and lower
compensation when they receive options to extend their own contracts. The apparent value of
team option premiums decreases as a function of the "spread," or option exercise price compared
to annual salary, and increases as a function of the time until the option must be exercised. The
implied volatility of options appears to lie in the same range as a diverse range of other asset
classes.
23
Table IDescriptive Statistics for Major League Baseball Player Contracts
Descriptive statistics for 1,107 Major League Baseball player contracts in effect during the mid-1990s. Contract descriptions were obtained from the 1994, 1996, and 1997 versions of theconfidential Joint Exhibit 1 document prepared by Major League Baseball for use in salaryarbitration hearings. The sample includes all contracts reported in these documents, with theexception of those signed by players with less than three years experience. Mean annual salaryis calculated as the sum of guaranteed salary payments plus any signing bonus, divided by thenumber of years in the contract.
GuaranteedContract Length
Number ofObservations
ContractsWith Options
OptionFrequency
1 year 752 81 11%2 years 153 48 31%3 years 111 42 38%4 years 57 18 32%5 years 33 8 24%6 years 1 0 0%
Total 1,107 197 18%
MeanAnnual Salary
Number ofObservations
ContractsWith Options
OptionFrequency
Below $0.5 million 259 17 7%$0.5 to $1.0 million 267 30 11%$1.0 to $2.5 million 258 63 24%$2.5 to $5.0 million 283 73 26%Above $5.0 million 40 14 35%
Total 1,107 197 18%
24
Table IIFeatures of Options in Major League Baseball Player Contracts
Descriptions of options included in 197 Major League Baseball player contracts in effect duringthe mid-1990s. Contract descriptions were obtained from the 1994, 1996, and 1997 versionsof the confidential Joint Exhibit 1 document prepared by Major League Baseball for use insalary arbitration hearings. The full sample of 1,107 includes all contracts reported in thesedocuments with the exception of those signed by players with less than three years experience.
Holder of Option Number of ContractsTeam 179Player 11
Both Team and Player 7
Number of Option Years Number of Contracts1 1742 223 1
Features of Options Number of Contracts FrequencyContingent vesting of optionbased upon playing time
54 27%
Buyout payment requiredif option not exercised
115 58%
25
Table IIIGoodness-of-Fit of Benchmark Model of Player Compensation
R2 goodness-of-fit statistics for non-linear least squares regressions with different specificationsof the explanatory variables. The dependent variable in each regression equals the log of annualcompensation received by Major League Baseball players. All regressions include an interceptterm in addition to those variables listed on each line. The sample includes 1,107 contractssigned by players with at least three years experience. All variables are measured with respectto the first year of the contract. The minority indicator variable equals 1 if the player is notU.S. born and Caucasian. The indicators for inactive years equal 1 if the player did not play inone of the three seasons prior to contract signing. Batting variables include at bats, runs, hits,doubles, triples, home runs, runs batted in, bases on balls, stolen bases, times caught stealing,and times grounded into double plays, as well as their squares. Pitching variables includegames, games started, complete games, games finished, wins, losses, saves, hits allowed, earnedruns allowed, bases on balls, and strikeouts. Fielding variables include an indicator for winninga Gold Glove award in the prior year, the cumulative total of Gold Gloves won prior to thecontract signing, and the square of cumulative Gold Gloves.
VariablesR2 with these
variables aloneR2 with this
group of variablesAge of player 0.0317Years of service, service2 0.0146Minority indicator variable 0.0024Inactive years indicator variables 0.0366Position indicator variables 0.0543
Batting and pitching variables (prior year only) 0.6889Batting and pitching variables (prior two years) 0.7603Batting and pitching variables (prior three years) 0.7788
Fielding variables 0.1028
Sub-total: all player characteristics 0.8190
Year of contract signing indicator variables 0.0767
Team indicator variables 0.0307
Total: all variables 0.8421
26
Table IVCoefficient Estimates for Benchmark Model of Player Compensation
Coefficient estimates for an non-linear least squares regression with the dependent variableequal to the log of annual compensation received by Major League Baseball players, in $000. The sample includes 1,107 contracts signed by players with at least three years experience. Allvariables are measured with respect to the first year of the contract. The minority indicatorvariable equals 1 if the player is not U.S. born and Caucasian. The model also includes anintercept term and all of the additional variables listed. T-statistics robust to herteroskedasticityappear in parentheses beneath each coefficient estimate.
Variable EstimateAge of player -0.035
(4.56)^^^
Years of service 0.150(7.62)
^^^
Years of service2 -0.007(6.76)
^^^
Minority indicator -0.056(1.85)
^
Signed with new team indicator -0.076(2.71)
^^^
Batting performance variables 11 variables in linear and squared form, for prior yearand also two years' lags. Separate variables forpitchers and position players. (total of 132).
Fielding performance variables Indicator for Gold Glove in prior year; variables forcumulative Gold Gloves won and its square
Position played 9 variables measuring percentage of games played ateach position
Year of contract signing 7 indicator variables for 1990 through 1996
Team signed with 27 indicator variables
Did not play (indicator variables) 3 variables for players who did not play in prior year,two years ago, or three years ago
R2
Adjusted R20.84210.8101
Significant at 1% (^^^), 5% (^^) and 10% (^) levels.
27
Table VValuation of Team and Player Options
Coefficient estimates for nonlinear least squares regressions with the dependent variable equal toannual compensation received by Major League Baseball players, in $000. The sample includes1,106 contracts signed by players with at least three years experience. The explanatory variablesshown are indicator variables for whether a contract may be extended at the option of the team or theplayer. Other explanatory variables, described more fully in Table IV, include age, years of service, aminority race indicator variable, indicators for position played, team signed with, and year, and awide range of batting, pitching, and fielding performance statistics. T-statistics robust toheteroskedasticity appear in parentheses beneath each coefficient estimate.
Model I:Percentage Option Premium
Model II:Dollar Value Option Premium
Variable Estimate Estimate Estimate Estimate Estimate Estimate
Teamoptionindicator
0.103(1.83)
^ 0.114(2.04)
^^ 195.3(2.54)
^^ 199.0(2.60)
^^^
Playeroptionindicator
-0.106(1.35)
-0.124(1.63)
-110.9(0.42)
-143.9(0.55)
R2
Adj. R20.84290.8108
0.84250.8105
0.84350.8114
0.84310.8111
0.84210.8100
0.84320.8111
Significant at 1% (^^^), 5% (^^) and 10% (^) levels.
28
Table VITeam Option Values as Function of Spread and Time Until Exercise
Coefficient estimates for nonlinear least squares regressions with the dependent variableequal to annual compensation received by Major League Baseball players, in $000. Thesample includes 1,106 contracts signed by players with at least three years experience. Theexplanatory variables shown are an indicator variable for whether a contract may beextended at the option of the team, along with expressions for the option "spread" and timeuntil exercise (these latter two variables equal zero if no option is present). Otherexplanatory variables, described more fully in Table IV, include age, years of service, aminority race indicator variable, indicators for position played, team signed with, and year,and a wide range of batting, pitching, and fielding performance statistics. T-statistics robustto heteroskedasticity appear in parentheses beneath each coefficient estimate.
Model I:Percentage Option Premium
Model II:Dollar Value Option Premium
Variable Estimate Estimate Estimate Estimate
Team optionindicator
0.086(1.56)
-0.031(0.47)
185.5(2.46)
** -125.9(1.40)
Option "spread" -0.00007(1.43)
-0.260(2.36)
**
Years until optionmust be exercised
0.031(3.74)
*** 145.5(6.36)
***
R2
Adj. R20.84320.8110
0.84530.8136
0.84390.8119
0.84930.8184
Significant at 1% (***), 5% (**), and 10% (*) levels.
29
Table VIIImplied Volatility Estimates
Estimates of the volatility of the value of baseball player services, derived from the Black-Scholes option value formula. Estimates are based a the sub-sample of 160 player contracts thatinclude team options for one year following contract expiration. Option premiums for eachobservation are estimated using residuals from regressions described in Tables III and IV. Implied volatility estimates for the mean and median option premium are then calculated usingsample means and medians for contract length, the risk-free rate, and the ratio of option exerciseprice over annual player salary.
For comparison purposes, panels B and C list actual and implied volatility estimates for othertypes of assets as reported by prior authors.
A. Implied volatility estimates from this study
Using mean option premium andcontract characteristics
.293
Using median option premium andcontract characteristics
.101
B. Actual asset volatility estimates from other studies
Asset Estimate Study
Copper futures contract prices .279 Brennan and Schwartz (1985)
Crude oil imports to U.S. .142 Paddock, Siegel and Smith (1988)
Canadian white pine lumber prices .104 Mørck, Schwartz and Stangeland(1989)
Returns to investing in optical tapemultimedia R&D projects
.107 Pennings and Lint (1997)
C. Implied asset volatility estimates from other studies
Asset Estimate Study
Seattle commercial real estateproperty values
.186 to .281 Quigg (1993)
Commercial real estate mortgagerates
.15 to .25 Holland, Ott and Riddiough (1998)
30
References
Bachelier, Louis, 1900, Theory of Speculation, reprinted in Paul H. Cootner ed., The RandomCharacter of Stock Market Prices (Cambridge, MA: MIT Press, 1964).
Berger, Philip G., Eli Ofek, and Itzhak Swary, 1996, Investor valuation of the abandonmentoption, Journal of Financial Economics 42, 257-287.
Black, Fischer and Myron S. Scholes, 1973, The pricing of options and corporate liabilities,Journal of Political Economy 81, 637-654.
Blass, Asher A., 1992, Does the baseball labor market contradict the human capital model ofinvestment? Review of Economics and Statistics 74, 261-268.
Brennan, Michael J., and Eduardo S. Schwartz, 1985, Evaluating natural resource investments,Journal of Business 58, 135-157.
Burgess, Paul L., and Daniel R. Marburger, 1993, Do negotiated and arbitrated salaries differunder final-offer arbitration? Industrial and Labor Relations Review 46, 548-559.
Capozza, Dennis R., and Gordon A. Sick, 1991, Valuing long-term leases: The option toredevelop, Journal of Real Estate Finance and Economics 4, 209-223.
Davis, Graham A., 1996, Option premiums in mineral asset pricing: Are they important? LandEconomics 72, 167-186.
Hill, James Richard, and William Spellman, 1984, Pay discrimination in baseball: Data from theseventies, Industrial Relations 23, 103-112.
Holland, A. Steven, Steven H. Ott, and Timothy J. Riddiough, 1998, The role of uncertainty ininvestment: An examination of competing investment models using commerical real estate data,unpublished manuscript, Center for Real Estate, Massachusetts Institutue of Technology.
Kahn, Lawrence M., 1993, Free agency, long-term contracts and compensation in Major LeagueBaseball: Estimates from panel data, Review of Economics and Statistics 75, 157-164.
Lehn, Kenneth, 1990, Information asymmetries in baseball’s free agent market, in Brian L. Goffand Robert D. Tollison eds., Sportometrics (Texas A&M University Press, College Station, TX).
Majd, Saman, and Robert S. Pindyck, 1987, Time to build, option value, and investment decisions,Journal of Financial Economics 18, 7-27.
McConnell, John J., and James S. Schallheim, 1983, Valuation of asset leasing contracts, Journal
31
of Financial Economics 12, 237-261.
McDonald, Robert, and Daniel Siegel, 1986, The value of waiting to invest, Quarterly Journal ofEconomics 101, 707-727.
Morck, Randall, Eduardo Schwartz, and David Stangeland, 1989, The valuation of forestryresources under stochastic prices and inventories, Journal of Financial and Quantitative Analysis24, 473-487.
Paddock, James L., Daniel R. Siegel, and James L. Smith, 1988, Option valuation of claims on realassets: The case of offshore petroleum leases, Quarterly Journal of Economics 103, 479-508.
Pennings, Enrico, and Onno Lint, 1997, The option value of advanced R&D, European Journal ofOperations Research 103, 83-94.
Quigg, Laura, 1993, Empirical testing of real option-pricing models, Journal of Finance 48, 621-640.
Trigeorgis, Lenos, 1993, Real options and interactions with financial flexibility, FinancialManagement 22:3, 202-224.
Trigeorgis, Lenos, 1996, Real options: managerial flexibility and strategy in resource allocation(MIT Press, Cambridge, MA).