major banks analysis november 2016 - pwc australia · pdf filemajor banks analysis november...
TRANSCRIPT


Major Banks Analysis
Over the period 2009-2015, the major banks’ cash earnings rose from $17 billion (bn) to $30.6bn (after restatements), fuelled in particular by sustained system credit growth, ever-improving bad debt performance and balanced pricing decisions in a stable, but evolving, societal and regulatory context.
Looking deeper at the results, momentum in these traditional drivers has slowed and appears unlikely to reignite soon. With this in mind, and considering an unprecedented degree of government and societal focus, it is clear to see why the majors are taking tangible steps to reposition themselves to ‘win’ in the future.
Strong, but slowingCash earnings for the year were $29.8bn, a decrease of 2.6% year on year (yoy) and a modest 1.5% increase on the first half (hoh). The headline results vary significantly across banks and were impacted by a number of ‘specified items’ as ANZ in particular made some significant strategic decisions at an in-year cost of $1bn.
After adjusting for these and other significant ‘one-off’ items, most of which were in the first half, cash earnings rose a modest 1.1% yoy but, importantly, declined 0.9% hoh.
Return on Equity (RoE) was 13.75% for the year, down 127 basis points (bps) and 13.66% for the half (down 12bps hoh) and the lowest since 2009. Adjusting for one-off items, RoE fell 118bps yoy and 29bps hoh, driven by both a $18.1bn increase in average shareholders equity during the period and the decline in earnings momentum.
Given the regulatory outlook for further increases in capital and funding costs (including Basel Committee announcements on the global direction of capital levels) and with a tough earnings outlook, it seems likely that RoEs will experience further pressure.
While credit growth over the 12 months has been solid (5.4% p.a.), this masks a significant slow-down in the second half. For instance, in the six months to September 2015 bank loans and advances grew at an annualised rate of 9.1%;
whereas the equivalent measure for the last six months is 6.5%. The comparatively strong growth in owner-occupied housing in late 2015/early 2016 has slowed considerably, with current growth rates now roughly half of the earlier numbers. Business credit growth shows a similar picture with annualised growth in the six months to September 2016 at 1.5%, compared to 3.7% in the six months to March 2016. This slowing demand for credit is a key factor explaining industry concerns about the immediate outlook for profit growth from core operations.
Given the competitive pressures operating in the sector, the reduction in combined net interest margin to 2.02% (-1bp yoy, -4bp hoh) has been relatively benign. However it is clear that this result was achieved with some fundamental repricing of lending categories in order to offset higher funding costs both for wholesale and retail funding. This repricing of lending has definitely been one of the factors which have served to increase public scrutiny on the banks, suggesting that such repricing to preserve margins may not be able to be undertaken indefinitely.
While all the banks highlighted compliance with the 100% Net Stable Funding Ratio minimum, APRA has yet to finalise what ‘unquestionably strong’ represents in the context of funding and so any potential buffer requirements may create further need to obtain longer term funding, with the resultant impact on margin.
Australia’s four major banks’ results, while strong, have declined for the first time since the Global Financial Crisis. There are however signs of focus and action as they prepare themselves for a new, less certain, banking environment.
Cash earnings for the year fell 2.6% yoy to $29.8bn. This represents the first decline in earnings since the GFC. Half-on-half earnings rose 1.5%.
Return on equity fell yoy from 15.02% to 13.75%, a reduction of 127 basis points (bps). After adjusting for ‘one-off’ items, RoE fell 118bps.
The combined Common Equity Tier 1 ratio increased 24bps to 9.85% yoy. The banks generated and issued $13.1bn of CET1 during the year and more is expected.
Net interest margin decreased by 1bp yoy to 2.02% and 4bps to 2.00% for the half. The benefits of asset repricing have been offset by funding costs as the majors prepare for NSFR in a more volatile funding market.
Bad debt expense rose by $1.5bn (39%) yoy and $88m (3.5%) hoh driven by specific exposures particularly connected to the resources sector. Underlying asset quality metrics remain relatively stable, again suggesting BDE may provide a headwind in the future.
Expense-to-income ratio at 44.3% increased 109bps yoy but fell 114bs hoh. After adjusting for ‘one-off’ items, expense-to-income decreased 40bps yoy.
Facing in to the future
2.6%
2.02%
39%
109bps
127bps
24bps
2

Simpler Smaller Deeply connected
Major Banks Analysis
As we expected from the half, bad debt expense (BDE) increased a significant $1.5bn or 39% yoy to $5.1bn. Almost all of this movement relates to specific ‘names’ or sectors as the banks monitor the resource/mining areas in particular. Portfolio credit performance remains stable, though we note two of the banks highlighted potential stress in retail portfolios in the outlook - again suggesting that there remains little upside in the impairment story.
Cost management continues to rise on the major banks’ agendas and each bank has chosen their own approach. After adjustment for one-off items in the year, at 42.87%, expense-to-income decreased yoy 40bps and 2bps hoh, however the story by bank varies.
True ‘efficiency’ is increasingly complex to understand as the majors change, and there are signs of this challenge in the results.
How the banks consider investment spend as a result of accelerating change and obsolescence is one example. On average, 51% of the $4.5bn investment spend in the year was directly expensed rather than capitalised, compared to 36% a year earlier - an additional $600m of in-year expense. Technological change, innovation and responding to regulation are increasingly becoming running costs rather than capital investment for the banks. Efficiently delivering these changes so that benefits can be realised quickly may be a defining feature of success in the future.
By way of further illustration, rising risk and compliance costs ($1.3bn, up 13.8% yoy) remain 30% of investment spend and a drag on underlying productivity improvements for many of the banks.
Staff costs remain 56% of total expenses, with average total full time global employees (FTE) decreasing 1.2% yoy. One bank reported a 5% reduction in average headcount yoy, while others highlighted less significant reductions, in part explained through a variety of investment initiatives, implementation of business changes and the rising risk and compliance obligations above.
Changing the cost profile of these large institutions is challenging and may take some time to work its way through.
Without action from the banks, the above all points to a very challenging outlook,
not least because at the same time they are considering these business issues, a very public discussion is taking place around something more fundamental and entirely connected - the role that banks should play in a rapidly changing and increasingly empowered society.
Already changingThe challenge ahead and its acknowledgement by the banks is clear from the significant steps they are already taking to ready their businesses for the new environment.
To release additional capital and simplify their businesses, the banks have sold or restructured operations with significant financial impacts in the last two years- most notably NAB’s listing of its overseas banking subsidiaries and sale of its life insurance business, Westpac’s partial sale of interests in BTIM, and ANZ’s sale of the Esanda business, impairment of some offshore investments and foreshadowed potential sales of Asian and Wealth businesses.
This theme of ‘focus’ indicates a clear prioritisation of higher-return and lower-capital, domestic banking activities - where the majors believe they can ‘win’. Given global uncertainty and competition, the short-term benefits of this focus are clear. How this focus is applied in practice to longer term opportunities such as Asia will be of particular interest, given the significance of the region to Australia’s economic future.
Technological change has also been evident in the banks’ decisions, recognising that the payback periods on investments are dramatically shortening. Three of the banks have explicitly revised their assumptions for software useful lives and cost capitalisation policies as a result since 2012 - with $0.9bn of assets written off or amortisation accelerated.
And on matters of regulation and conduct, changes are also evident – with the majors initiating action, with unprecedented levels of cooperation, to respond to concerns over their treatment of customers and perceived self-interest. The 6-point plan being developed under the Australian Bankers Association (ABA), with independent oversight, is the clearest indication of this and is being closely watched as a result.
The challenge ahead and its acknowledgment by the banks is clear from the significant steps they are already taking to ready their businesses for the new environment”
3

Tougher changes to come In summary, the majors banks are faced with a lower credit growth outlook, capital and regulatory constraints, a dramatic pace of social change and technological investment and arguably the most intense socio-political scrutiny the sector has experienced since the government proposals to nationalise the banking industry in the late 1940s.
In our view, responses to these challenges are inherently interconnected and go to the heart of the value banks must provide if they are to escape the “commodity trap”. Six months ago, we contended that the future of banking should see banks become simpler, smaller and more deeply connected with their customers.1 Many of the changes that we have already seen align to these concepts and, we believe, there is more to come.
The Australian banks have been working hard to shape a new environment where customers can expect a different, more thoughtful and connected experience - with technology and engaged staff as the key enablers.
The banks are large, diverse organisations with long histories - Westpac for example turns 200 in 2017 - and so it is not surprising that these changes are complex. But customers expect it all to be easier. Creating a more resonant offering may require fewer (rather than more) products, contact points and messages and will involve reframing organisational norms that are deeply embedded and very tightly held.
And it may not be necessary for the banks to ‘make’ such a high proportion of what they sell. We have already seen ANZ’s announcement that it will be reconsidering its role as a manufacturer of wealth management products. This does not mean that all banks will, or should, follow suit. But as they look to become more connected and tailored to the myriad needs of a customer, they may need to release direct ownership of parts of the value chain.
And with 17% or $6.2bn of expense (excluding employees) in 2016 related to technology, we expect the banks to take more and more partnership approaches to innovation, infrastructure and distribution - reducing the organisational footprint to create more flexibility and access the very best of others’ developments. In pursuing their own approach to FinTech and innovation, each of the banks has the chance to invite others to help them change, while protecting the core of what they do and stand for as a brand.
Major Banks Analysis
…trust will always be at the heart of the relationship between banks and society”
Competen
ce
Values
ExperienceTrust
Outlook – purpose and trustTaking all of this together, the notion of ‘purpose’ for the major banks has never been so relevant – transcending the commercial and societal context. The majors are already busy reassessing, simplifying and refocusing on what makes them truly unique, where they are most relevant to customers and, therefore, where they will generate the most value. We have already seen the nature of the decisions that have been taken to date in response.
However effective these changes may prove to be, the banks have acknowledged that ‘trust’ will always be at the heart of the relationship between banks and society and that there is a lot more they can do to rebuild and reinforce it.
Our “Hot Topic” perspective takes a deeper look at the trust dynamic in Australian banking and the drivers of trust - Competence, Experience and Values.
Recognising bank actions to date, and that there are no quick fixes, we suggest some practical steps that can be considered to assist in rebuilding trust.
Of course, the challenges for the banks are not confined to rebuilding trust. In our view the next period will also be dominated by the following challenges:
� relatively weak growth in demand for credit, with ongoing pressure to access stable funding;
� competitive pressures on both sides of the balance sheet, inevitably requiring very tight margin management;
� assessing the implications of the forthcoming Basel Committee pronouncements on capital requirements and the final steps to achieve “unquestionably strong” capital and stable funding;
� hence the imperative to reduce costs can only accelerate, and a reset to return and dividend expectations by investors;
� an increasingly complicated cost agenda driven by the need to skew investments to digital-ready capabilities, with uncertain paybacks and useful durations; and
� further debate on the value of non-core assets.
1Escaping the commodity trap: the future of banking in Australia, available at www.strategyand.pwc.com4

The major banks delivered combined cash earnings of $29.8bn, down 2.6% yoy and up 1.5% hoh. This represents a decline in return on equity of 127bps yoy and 12bps hoh.
Growth generated by lending asset growth, particularly in Australian housing and by steps taken to protect margin, were largely offset yoy by rising bad debt expense, rising funding costs and declines in non-interest income.
Net interest margins fell by 1bp yoy and fell 4bp hoh. Strong competition and rising average funding costs have again offset any benefits gained from repricing loans and some deposit pricing changes over the year.
Bad debt expense increased significantly by $1.5bn (39.0%) yoy and was largely flat between halves. Most of this increase related to additional ‘specific’ provisions taken for resources/mining or related industries and the early flow on impacts to consumer debt in those areas.
The banks’ broader portfolios still appear to be performing well, though we note some banks highlighted indicators of some stress in retail portfolios, which warrants close monitoring in the outlook.
There were again a number of significant ‘one-off’ items in the year, resulting in the banks’ expense-to-income ratios rising to 44.3% (109bps increase yoy and 114bps decrease hoh). After adjusting for larger one-off income and expense items, the combined expense-to-income ratio was down 40bps yoy to 42.87% yoy.
We expect these underlying pressures on returns to continue for some time given further capital and funding increases required, a slowing credit growth outlook, competitive and political pressure on margin and signs that bad debt expense may have been as good as it gets.
Overview
2.6%
127bps
Cash earningsCombined cash earnings fell 2.6% yoy and rose 1.5% hoh. A number of ‘one-off’ items, continued margin pressure and higher bad debt expense combined with slowing credit growth to reduce momentum in the results.
RoEReturn on equity declined 127bps from 15.02% to 13.75%. Given a slowing growth outlook and further capital requirements pending, we expect pressure on RoEs to continue for some time.
Four major banks combined performance
Cash earnings – A$ million
FY2016 FY2015 2016 vs 2015 2H16 1H16 2H16 vs 1H16
Net interest income 60,308 57,180 5.5% 30,060 30,248 (0.6%)
Other income 23,652 24,480 (3.4%) 11,836 11,816 0.2%
Total income 83,960 81,660 2.8% 41,896 42,064 (0.4%)
Operating expense 37,187 35,284 5.4% 18,318 18,869 (2.9%)
Core earnings 46,773 46,376 0.9% 23,578 23,195 1.7%
Bad debt expense 5,136 3,694 39.0% 2,612 2,524 3.5%
Tax expense 11,823 12,019 (1.6%) 5,950 5,873 1.3%
Outside equity interests 46 93 (50.5%) 22 24 (8.3%)
Cash earnings 29,768 30,570 (2.6%) 14,994 14,774 1.5%
Statutory results 28,801 31,368 (8.2%) 14,520 14,281 1.7%
5

-10
25
20
15
10
5
0
-5
30
35
2006 2007 2008 2009 2010 2011 2012 2013 2014 2015 2016
%
Total credit Business PersonalHousing – Investor housingHousing – Owner-occupier
Domestic credit growth (Annual % growth – 12 month rolling average)
Credit growthAustralian domestic credit has continued to be the main driver of the majors’ growth, but the rate of growth (and therefore outlook) is slowing, particularly based on the second half.
For the year to September 2016, total credit rose 5.4% per annum (p.a.), representing a 1.2% decline in p.a. growth rate yoy, with 1.0% of that decline coming in the second half.
While the majors maintained market share of total lending of 73.1% at September 2016, a slight increase from 72.6% at September 2015, changes in the appetite for (and supply of) credit remain a significant driver of bank results.
In Australia, banks (ADIs) represent 91.5% of the outstanding credit (rising from 89.7% a year ago). By comparison, it is interesting to note the recent data from the USA that, for the first time in 30 years, over 50% of new lending in the last year was provided by non-bank institutions, reflective in part of a tightening of risk appetite by America’s banks. There are no signs of a similar trend here, but it is a strong reminder that there are others ready to step in if banks step back.
Total housing credit grew 6.4% p.a. compared to 7.5% p.a. a year ago and 7.1% p.a. 6 months ago, heavily impacted by the slowdown in investor lending.
Investor lending growth continued to decline to just 4.8% p.a. from 9.9% p.a. a year ago as the full year impacts of APRA’s 10% growth limit, statistical restatements and repricing by the banks was seen.
Most of this decline came in the first half and there are signs in the month-to-month growth in the second half that we can expect this growth to recover slightly as the banks readjust following these changes.
Owner-occupied lending over the year picked up the slack however, growing at 7.3% p.a. to September 2016, which is slightly lower than 7.4% p.a. six months ago though higher than 5.9% p.a. in September 2015.
Business credit growth, while notoriously volatile, has seen the most dramatic change, falling from an encouraging 6.3% p.a. a year ago to 4.7% p.a. at September 2016, the lowest rate of growth since December 2014. This trend gives cause for careful monitoring in the outlook, both from a bank growth and economic perspective.
Whether the trends in housing and business credit represent signs of a sustained slowdown is too early to call but warrant close attention. Given the level of commentary being applied to the Australian housing market, household indebtedness and an unclear interest rate outlook, it is reasonable to assume that credit growth will not provide the same degree of momentum as it has since the GFC.
Balance sheet dynamics
6

Composition of bank deposits (A$bn)
0
1,200
900
600
300
1,500
1,800
Sep-05 Sep-15
A$bn
Super depositsBusiness depositsHousehold deposits
Sep-06Sep-04 Sep-07 Sep-08 Sep-09 Sep-10 Sep-11 Sep-12 Sep-13 Sep-14 Sep-16
Balance sheet dynamics
FundingThe funding mix of the major banks has remained stable with deposits providing the majority of funding for lending growth with the loan to deposit ratio at 68.7% for the majors, 69.3% for the banking system more broadly.
The major banks maintained 78.2% share of bank deposits as a whole (down 0.8% yoy) and 80% market share of bank retail deposits (down 1.1% yoy).
We flagged six months ago that the implementation of the Net Stable Funding Ratio from 2018 (that will require the majors to ensure a 100% stability match over each 12 month period between funding and assets) was likely to see them readying for this change, placing downward pressure on margins and could, ultimately, present a constraint on lending growth for the banks.
There is evidence in the results that this started to play out, with wholesale funding costs rising over the period and the majors increasing the average tenor of wholesale funding. Deposit competition also appeared to increase slightly in the second half (see following page for further analysis).
APRA’s release of draft prudential standards in September 2016 will provide some relief. Following industry consultation, APRA has reduced the level of stable funding required for self-securitised assets that banks hold for liquidity purposes. This represents a significant saving for the banks, notwithstanding APRA has left the door open to require an additional NSFR buffer to ensure each bank is ‘unquestionably strong’.
Bank deposits overall continued their growth at 7.1% p.a. slightly higher than the 7.0% p.a. in September 2015 and 6.9% p.a. in March 2016. Household deposits grew by 8.7% p.a., lower than six months and a year ago.
Business deposits growth decreased to 4.4% p.a., compared to 6.1% p.a. at September 2015 but higher than the 2.2% p.a. growth rate at March 2016.
Superannuation deposits grew by 6.9% p.a., higher than a year ago at 0.7% p.a. but lower than 10.1% six months ago.
CapitalThe major banks have raised or generated $13.1bn of Common Equity Tier 1 capital over the last year (net of dividends) and average shareholders’ equity for the year was $18.1bn higher than prior year following the capital activity at the end of last year. The Combined CET1 capital ratio of the majors was 9.85%, an increase of 24 bps yoy.
RoE has fallen accordingly (in addition to the impact of slowing results and one-off items) down 127bps yoy at 13.75%, the lowest (and first time below 15.0%) since 2009.
The outlook is for further capital increases as APRA’s final determinations under revised Basel guidance, including Total Loss Absorbing Capacity (TLAC) draws closer. It therefore seems likely that, after adjusting for one-off items, RoE’s are unlikely to rise significantly any time soon.
Average equity Return on Equity
0
50
100
150
200
250
2H16
1H16
2H15
1H15
2H14
1H14
2H13
1H13
2H12
1H12
2H11
1H11
2H10
1H10
2H09
1H09
2H08
1H08
0%
2%
4%
6%
8%
10%
12%
14%
16%
18%
20%
Average equity and return on equity (half year)
7

2.05
2.09
2.14
2.29 2.28
2.23 2.25
2.27
2.20
2.14 2.13 2.13
2.08 2.06
2.03 2.03 2.04
2.00 2.00
2.25
2.50
1H08 2H08 1H09 2H09 1H10 2H10 1H11 2H11 1H12 2H12 1H13 2H13 1H14 2H14 1H15 2H15 1H16 2H16
%Combined net interest margin (half year)
Net interest incomeNet interest income grew 5.5% yoy and decreased 0.6% hoh reflecting good momentum from volume growth and repricing in the first half and a challenging volume and margin story in the second half. Second half 2016 is the first time net interest income has fallen since the significant fall in interest rates post GFC.
Average interest earning assets grew 6.0% yoy but declined 0.4% hoh, demonstrating both the slowing in credit growth and some strategic repositioning of lending to some portfolios.
The majors’ combined net interest margin slightly decreased to 2.02%, a 1bp decrease (after restatements) from 2.03% yoy and 4bp decrease to 2.0% for the second half. It is worth noting that only one bank had a positive margin movement year on year.
The banks benefited from loan and deposit repricing, particularly in the first half but this was largely offset by rising wholesale funding costs, and fairly significant markets/liquidity movements in the second half.
It is hard to see net interest margin increasing significantly for some time given a low cash rate environment, significant scrutiny of pricing decisions and a possible increase of demand for wholesale term finance.
There are a number of offsetting factors and the outlook is for further softening:
Lending+3bps yoy, +3bps hoh
The benefits of much discussed asset repricing during the year were offset in part by significant competition in retail lending and institutional banking.
Deposits+2bp yoy, -1bp hoh
One bank saw significant margin benefit from deposit repricing and the majors benefited from changes in deposit mix, offset by general increases in competition.
Wholesale funding-2bps yoy, -2bps hoh
Wholesale funding costs were generally elevated and the banks purposefully increased the average tenors of funding in preparation for NFSR.
Treasury and markets-4bps yoy, -4bps hoh
A large decrease - in particular caused by lower earnings on new capital and higher liquid asset holdings and decreased earnings on financial market/treasury positions.
Revenues
8
Analysis of other operating income (other income)
0
4
2
6
8
10
12
14
A$bn
1H08 1H09 1H10 1H11 1H12 1H13 1H14 1H152H08 2H09 2H10 2H11 2H12 2H13 2H14 2H15 2H161H16
Trading IncomeWealth ManagementBanking fees
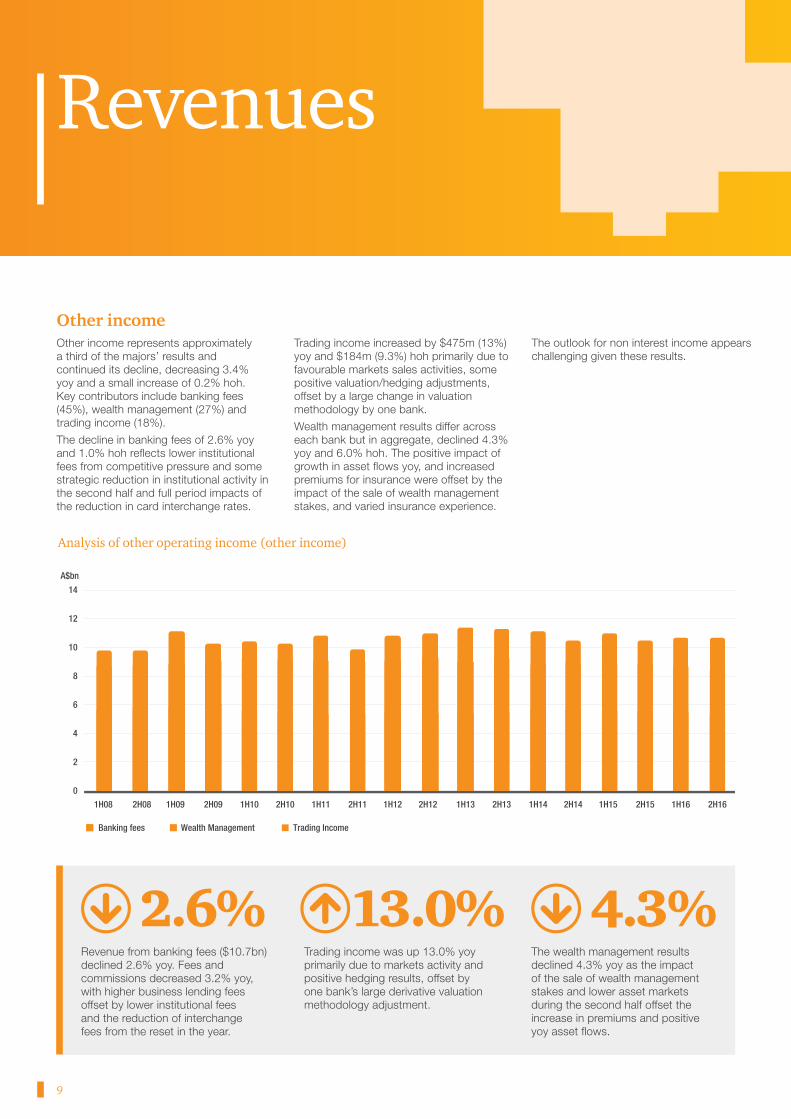
Other incomeOther income represents approximately a third of the majors’ results and continued its decline, decreasing 3.4% yoy and a small increase of 0.2% hoh. Key contributors include banking fees (45%), wealth management (27%) and trading income (18%).
The decline in banking fees of 2.6% yoy and 1.0% hoh reflects lower institutional fees from competitive pressure and some strategic reduction in institutional activity in the second half and full period impacts of the reduction in card interchange rates.
Trading income increased by $475m (13%) yoy and $184m (9.3%) hoh primarily due to favourable markets sales activities, some positive valuation/hedging adjustments, offset by a large change in valuation methodology by one bank.
Wealth management results differ across each bank but in aggregate, declined 4.3% yoy and 6.0% hoh. The positive impact of growth in asset flows yoy, and increased premiums for insurance were offset by the impact of the sale of wealth management stakes, and varied insurance experience.
The outlook for non interest income appears challenging given these results.
Revenues
2.6% 13.0% 4.3%Revenue from banking fees ($10.7bn) declined 2.6% yoy. Fees and commissions decreased 3.2% yoy, with higher business lending fees offset by lower institutional fees and the reduction of interchange fees from the reset in the year.
Trading income was up 13.0% yoy primarily due to markets activity and positive hedging results, offset by one bank’s large derivative valuation methodology adjustment.
The wealth management results declined 4.3% yoy as the impact of the sale of wealth management stakes and lower asset markets during the second half offset the increase in premiums and positive yoy asset flows.
9

46.2%
45.7%
43.6%
44.4%
43.8%
45.4%
44.3%
44.7%44.4% 44.4%
43.0%
44.3%
44.1%
46.7%
42.5%
43.4%
44.9%
43.7%
42.0%
44.0%
46.0%
48.0%
1H08 2H08 1H09 2H09 1H10 2H10 1H11 2H11 1H12 2H12 1H13 2H13 1H14 2H14 1H15 2H15 1H16 2H16
Combined expense-to-income ratio (half year ended)
Total operating expenses increased by 5.4% yoy but declined 2.9% hoh.
The major banks’ combined expense-to-income ratio for the year was 44.3%, higher than 43.2% a year ago but down 114bps hoh.
After adjusting for larger one-off items expense-to-income improved 40bps yoy to 42.87%. Expense-to-income ratios have been in the 42%-47% range since 2008 and given the combination of rapid technological change and large risk, compliance and maintenance expenditure, moving the dial on this significantly may require more fundamental change.
Total Investment Spend rose 4.8% yoy to $4.5bn. A significant proportion of this spend (30% for the year) is committed to risk and compliance costs and ‘maintenance’ of existing systems and infrastructure.
Software amortisation was up $2.3bn for the year compared to $1.6bn a year ago as banks continue to reassess useful lives of software and capitalisation of project costs. This, combined with reduced capitalisation of costs in general, is likely to further increase costs in the immediate outlook.
The number of full time equivalent staff fell 2.4% or 4,009 yoy and 1.4% or 2,348 hoh. Personnel expenses were $20.9bn for the year, up by $818m yoy due to wage inflation, offset by decrease in FTE and other productivity initiatives.
A large number of ‘one-off’ items were included in the unadjusted expense result, totalling $1bn for the year. These included software writedowns, impairments of business investments and restructuring costs, particularly relating to one bank. Similarly, over the past two years a number of large ‘non-cash’ items have occurred as the banks have made some big decisions to focus and simplify their businesses.
While perhaps not on the same scale, we would not be surprised to see more such items in the coming years, given the challenging outlook for the majors and the works that may be required to as a result.
Expenses
The banks invested $4.5bn over the last 12 months, with 48.6% being spent on transformation and productivity projects. Risk and compliance spend ($1.3bn) increased 13.8% yoy and remains almost a third of total Investment Spend.
$4.5bn
10

Impaired assets and bad debt expense
0.0
2.0
4.0
6.0
8.0
%
0.0
0.5
1.0
1.5
2.5
2.0
%
1993
1992
1994
1995
1996
1997
1998
1999
2000
2001
2002
2003
2004
2005
2006
2007
2008
2009
2010
2011
2012
2013
2014
2015
Bad debt charge/gross loans & acceptances (right axis) Impaired assets/gross loans & acceptances (left axis)
2016
Bad debt expense increased by $1.5bn, or 39% yoy to $5.1bn due to the impairment of a number of large single name exposures particularly in the mining/resources sector and retail/commercial lending loans that are in regions affected by such industries.
Impaired assets to total loans and advances remained at 0.4%, unchanged from last year. Impaired facilities increased by 16.5% yoy (mainly from the first half) reflecting increased stress in the resources and connected sectors. Non-performing loans - those 90 days past due - have remained low at 0.41% of total loans and advances but increased for the first time since the first half of 2014, broadly from regions affected by the commodity slowdown.
At 21bps, bad debt expense over loans and acceptance remains low in comparison to the longer term average of 28bps but, as well flagged at the half, has increased significantly on prior year. It appears for now that these losses are isolated to sectors and regions impacted by low commodity prices and the decline in the mining and resources sector.
Asset quality
21bpsAt 21bps, bad debt expense as a percentage of loans and acceptances has risen for four consecutive halves.
$1.5bn of this increase was attributable to individually identified loans.
11

Key banking statistics – Full year 2016
ANZ CBA NAB (iii) WBC
2016 2015 2014 2016 2015 2014 2016 2015 2014 2016 2015 2014
Balance sheet
Total assets 914,869 889,900 772,092 933,078 873,446 791,451 777,622 955,052 883,301 839,202 812,156 770,842
Risk weighted assets 408,582 401,937 361,529 394,667 368,721 337,715 388,445 399,758 367,652 410,053 358,580 331,387
Gross loans and acceptances 579,515 573,741 525,534 701,730 646,172 608,127 545,760 584,147 545,361 665,256 626,344 583,516
Asset quality & provisioning
Gross impaired assets 3,173 2,719 2,889 3,116 2,855 3,367 2,642 2,050 4,122 2,159 1,895 2,340
Net impaired assets 1,866 1,658 1,713 1,989 1,829 2,101 1,930 1,379 2,668 1,092 1,018 1,293
Gross impaired assets as a % of gross loans and acceptances 0.55% 0.47% 0.55% 0.44% 0.44% 0.55% 0.48% 0.35% 0.76% 0.32% 0.30% 0.40%
Individually assessed provisions 1,307 1,061 1,176 944 887 1,127 706 637 1,358 869 669 867
Individually assessed provisions as a % of impaired assets 41.19% 39.02% 40.71% 30.30% 31.07% 33.47% 26.72% 31.07% 32.95% 40.25% 35.30% 37.05%
Collective provisions 2,876 2,956 2,757 2,774 2,731 2,739 2,408 2,883 1,760 2,733 2,663 2,614
Collective provisions as a % of non-housing loans & acceptances 1.12% 1.08% 1.08% 1.13% 1.22% 1.31% 1.04% 1.19% 0.75% 1.25% 1.26% 1.33%
Total provisions 4,183 4,017 3,933 3,718 3,618 3,866 3,114 3,520 3,118 3,602 3,332 3,481
Total provision as a % of gross loans & acceptances 0.72% 0.70% 0.75% 0.53% 0.56% 0.64% 0.57% 0.60% 0.57% 0.54% 0.53% 0.60%
Profit & loss analysis (i)
Net interest income 15,095 14,616 13,797 16,935 15,827 15,091 12,930 12,498 13,451 15,348 14,239 13,496
Other income 5,482 5,921 5,781 7,812 7,751 7,310 4,503 4,507 5,070 5,855 6,301 6,324
Operating expenses (10,422) (9,378) (8,760) (10,429) (9,993) (9,499) (7,438) (7,278) (9,987) (8,898) (8,635) (8,246)
Core earnings 10,155 11,159 10,818 14,318 13,585 12,902 9,995 9,727 8,534 12,305 11,905 11,574
Bad debt expense (1,956) (1,205) (989) (1,256) (988) (953) (800) (748) (869) (1,124) (753) (650)
Profit before tax 8,199 9,954 9,829 13,062 12,597 11,949 9,195 8,979 7,665 11,181 11,152 10,924
Income tax expense (2,299) (2,724) (2,700) (3,592) (3,439) (3,250) (2,588) (2,582) (2,430) (3,344) (3,274) (3,230)
Minority interest (11) (14) (12) (20) (21) (19) 0 0 0 (15) (58) (66)
Cash earnings 5,889 7,216 7,117 9,450 9,137 8,680 6,607 6,397 5,235 7,822 7,820 7,628
Statutory results (ii) 5,709 7,493 7,271 9,227 9,063 8,631 6,420 6,800 5,181 7,445 8,012 7,561
Key data
Other operating income as a % of total income 26.64% 28.83% 29.53% 31.57% 32.87% 32.63% 25.83% 26.50% 27.37% 27.61% 30.68% 31.91%
Interest spread 1.81% 1.82% 1.90% 1.92% 1.95% 1.97% 1.71% 1.72% 1.62% 1.94% 1.90% 1.89%
Interest margin 2.00% 2.04% 2.13% 2.07% 2.09% 2.14% 1.88% 1.90% 1.91% 2.13% 2.08% 2.08%
Expense/income ratio (as reported ratio) 50.60% 45.70% 44.70% 42.40% 42.80% 42.90% 41.40% 41.20% 53.10% 41.97% 42.04% 41.60%
Total number of full time equivalent staff 46,554 50,152 50,328 45,129 45,948 44,329 34,263 33,894 41,420 35,280 35,241 36,373
Operating costs per employee (dollars) – annualised 214,299 186,664 174,861 229,015 221,385 212,748 215,176 210,548 238,644 253,526 240,932 226,271
Return on average equity (as reported) 10.30% 14.00% 15.40% 16.50% 18.20% 18.70% 14.30% 14.80% 11.60% 13.99% 15.84% 16.41%
Return on average assets (underlying cash) 0.65% 0.85% 0.95% 1.03% 1.08% 1.11% 0.96% 0.74% 0.61% 0.93% 0.98% 1.03%
Capital ratios
Common equity 9.60% 9.60% 8.80% 10.60% 9.10% 9.30% 9.77% 10.24% 8.63% 9.5% 9.50% 9.00%
Tier 1 11.80% 11.30% 10.70% 12.30% 11.20% 11.10% 12.19% 12.44% 10.81% 11.2% 11.40% 10.60%
Tier 2 (net of deductions) 2.50% 2.00% 2.00% 2.00% 1.50% 0.90% 1.96% 1.71% 1.35% 1.9% 1.90% 1.70%
Total 14.30% 13.30% 12.70% 14.30% 12.70% 12.00% 14.14% 14.15% 12.16% 13.1% 13.30% 12.30%
Lending and funding ratios
Gross loans & acceptances/total assets 63.34% 64.47% 68.07% 75.21% 73.98% 76.84% 70.18% 61.16% 61.74% 79.27% 77.12% 75.70%
Housing loans gross loans & acceptances 55.76% 52.37% 51.64% 64.99% 65.44% 65.72% 57.64% 58.54% 57.22% 67.23% 66.13% 66.39%
Deposits (exclude CDs)/gross loans 87.30% 84.21% 84.06% 73.83% 73.84% 72.06% 71.55% 71.71% 71.71% 70.14% 68.20% 70.13%
Deposits (exclude CDs)/total liabilities 58.98% 57.90% 60.98% 59.39% 58.15% 59.05% 53.76% 46.57% 46.81% 59.74% 56.33% 56.72%
All figures in AUD million unless otherwise indicated (i) In arriving at “cash earnings”, income and expenses exclude certain non-cash items. Non-cash items include acquisition related adjustments, impact of hedge accounting and revaluation of treasury
shares and other items reported by the banks. Some components of income and expenses have been reclassified to improve comparability between banks. (ii) Statutory result as reported by the banks, unadjusted. (iii) NAB’s underlying cash earnings after tax are shown before distributions to holders of other equity instruments – 2016 ($124m), 2015 ($175m). NAB only reports an expense-to-income ratio for its
banking operations. NAB also restated 2015 results to reflect discontinued operations, the Clydesdale Bank IPO, and adjustments to how net interest margin is calculated.
12

ContactsJulie CoatesFinancial Services Leader 02 8266 2006 [email protected]
Hugh HarleyFinancial Services – Global Emerging Markets Leader 02 8266 5746 [email protected]
Colin HeathBanking & Capital Markets Leader 03 8603 0137 [email protected]
Sam GarlandBanking & Capital Markets 02 8266 3029 [email protected]
© 2016 PricewaterhouseCoopers. All rights reserved.PwC refers to the Australian member firm, and may sometimes refer to the PwC network.Each member firm is a separate legal entity. Please see www.pwc.com/structure for further details.Liability limited by a scheme approved under Professional Standards Legislation
127043621