majic - mvtool.co.kr contents iv 0380-0163-10 rev 2.01 majic user’s manual specify your...
TRANSCRIPT

Embedded Performance, Inc.
P/N 0380-0163-10 Rev 2.01
MAJICUser’s Manual

November, 2002
EPI has made every attempt to ensure that the information in this document is accurate and complete. However, EPI assumes no responsibility for any errors, omissions, or for any consequences resulting from the use of the information included herein or the equipment it accompanies. EPI reserves the right to make changes in its products and specifications at any time without notice.
Any software described in this document is furnished under a license or non-disclosure agreement. It is against the law to copy this software on magnetic tape, disk, or other medium for any purpose other than the licensee's personal use.
Embedded Performance, Incorporated606 Valley WayMilpitas, California 95035USA(408) 957-0350www.epitools.com
Acknowledgments:
MIPS, MIPS16, MIPS32, R3000, R4000, and RISC/os are trademarks of MIPS Technologies Inc.ARM, ARM7, ARM9, and Thumb are trademarks of ARM Ltd.IBM and PC-AT are trademarks of International Business Machines.MS DOS, Windows, Win32, Windows CE, Platform Builder, and eXDI are trademarks of Microsoft Corporation.UNIX is a trademark of AT&T.Ethernet is a trademark of XEROX.Intel and XScale are trademarks of Intel Corporation.Tornado is a trademark of Wind River Corporation.EPI, MAJIC, MAJICMX , MAJICPLUS, EDT, EDTA, EDTM, MONICE, EDB, and EDBICE are trademarks of Embedded Performance, Inc.All other trademarks are trademarks of their respective companies.
© 2002 Embedded Performance, Incorporated.All rights reserved.

Contents
About this Manual . . . . . . . . . . . . . . . . . . . . . . . . . . . . . . . . . . . . . . . . . . . . . viiHow to Use This Manual. . . . . . . . . . . . . . . . . . . . . . . . . . . . . . . . . . . . . . . . . . . . . . . . . . . . . . . . . . . . viiNotational Conventions . . . . . . . . . . . . . . . . . . . . . . . . . . . . . . . . . . . . . . . . . . . . . . . . . . . . . . . . . . . . . viiiAlerts . . . . . . . . . . . . . . . . . . . . . . . . . . . . . . . . . . . . . . . . . . . . . . . . . . . . . . . . . . . . . . . . . . . . . . . . . . . . ixService . . . . . . . . . . . . . . . . . . . . . . . . . . . . . . . . . . . . . . . . . . . . . . . . . . . . . . . . . . . . . . . . . . . . . . . . . . . ixGetting Help . . . . . . . . . . . . . . . . . . . . . . . . . . . . . . . . . . . . . . . . . . . . . . . . . . . . . . . . . . . . . . . . . . . . . . ix
Chapter 1 Overview . . . . . . . . . . . . . . . . . . . . . . . . . . . . . . . . . . . . . . . . . . . . 1What is the MAJIC Probe? . . . . . . . . . . . . . . . . . . . . . . . . . . . . . . . . . . . . . . . . . . . . . . . . . . . . . . . . . . . 1
The MAJIC Probe Models . . . . . . . . . . . . . . . . . . . . . . . . . . . . . . . . . . . . . . . . . . . . . . . . . . . . . . 2What is a Debugger? . . . . . . . . . . . . . . . . . . . . . . . . . . . . . . . . . . . . . . . . . . . . . . . . . . . . . . . . . . . . . . . . 2
Chapter 2 Getting Started . . . . . . . . . . . . . . . . . . . . . . . . . . . . . . . . . . . . . . . 5Unpacking the System. . . . . . . . . . . . . . . . . . . . . . . . . . . . . . . . . . . . . . . . . . . . . . . . . . . . . . . . . . . . . . . 5Hardware Installation . . . . . . . . . . . . . . . . . . . . . . . . . . . . . . . . . . . . . . . . . . . . . . . . . . . . . . . . . . . . . . . 6
Power Connection . . . . . . . . . . . . . . . . . . . . . . . . . . . . . . . . . . . . . . . . . . . . . . . . . . . . . . . . . . . . 6Target Connection . . . . . . . . . . . . . . . . . . . . . . . . . . . . . . . . . . . . . . . . . . . . . . . . . . . . . . . . . . . . 6
Cable Kits . . . . . . . . . . . . . . . . . . . . . . . . . . . . . . . . . . . . . . . . . . . . . . . . . . . . . . . . . . . . . . 6Mini Probe . . . . . . . . . . . . . . . . . . . . . . . . . . . . . . . . . . . . . . . . . . . . . . . . . . . . . . . . . . . . . 7Triggers. . . . . . . . . . . . . . . . . . . . . . . . . . . . . . . . . . . . . . . . . . . . . . . . . . . . . . . . . . . . . . . . 8
Host Computer Connections . . . . . . . . . . . . . . . . . . . . . . . . . . . . . . . . . . . . . . . . . . . . . . . . . . . . 8Serial Connection . . . . . . . . . . . . . . . . . . . . . . . . . . . . . . . . . . . . . . . . . . . . . . . . . . . . . . . . 8Ethernet Setup . . . . . . . . . . . . . . . . . . . . . . . . . . . . . . . . . . . . . . . . . . . . . . . . . . . . . . . . . . 9
System Check-out . . . . . . . . . . . . . . . . . . . . . . . . . . . . . . . . . . . . . . . . . . . . . . . . . . . . . . . . . . . . . . . . . 12Power-on Self-Test . . . . . . . . . . . . . . . . . . . . . . . . . . . . . . . . . . . . . . . . . . . . . . . . . . . . . . . . . . 12JTAG Bypass Test . . . . . . . . . . . . . . . . . . . . . . . . . . . . . . . . . . . . . . . . . . . . . . . . . . . . . . . . . . . 13Confidence Test . . . . . . . . . . . . . . . . . . . . . . . . . . . . . . . . . . . . . . . . . . . . . . . . . . . . . . . . . . . . . 13
Chapter 3 Debug Environment . . . . . . . . . . . . . . . . . . . . . . . . . . . . . . . . . . 15Using the Setup Wizard. . . . . . . . . . . . . . . . . . . . . . . . . . . . . . . . . . . . . . . . . . . . . . . . . . . . . . . . . . . . . 15
Choose Your Debugger . . . . . . . . . . . . . . . . . . . . . . . . . . . . . . . . . . . . . . . . . . . . . . . . . . . . . . . 15Specify Your Project Name . . . . . . . . . . . . . . . . . . . . . . . . . . . . . . . . . . . . . . . . . . . . . . . . . . . . 17Specify Your Processor . . . . . . . . . . . . . . . . . . . . . . . . . . . . . . . . . . . . . . . . . . . . . . . . . . . . . . . 18Specify Your Connection Type . . . . . . . . . . . . . . . . . . . . . . . . . . . . . . . . . . . . . . . . . . . . . . . . . 18Specify Your Configuration Files’ Location . . . . . . . . . . . . . . . . . . . . . . . . . . . . . . . . . . . . . . . 19
MAJIC User’s Manual 0380-0163-10 Rev 2.01 iii

Contents
Specify Your Destination or Reference Directory . . . . . . . . . . . . . . . . . . . . . . . . . . . . . . . . . . . 20Perform the Setup . . . . . . . . . . . . . . . . . . . . . . . . . . . . . . . . . . . . . . . . . . . . . . . . . . . . . . . . . . . . 21
Configuration Process . . . . . . . . . . . . . . . . . . . . . . . . . . . . . . . . . . . . . . . . . . . . . . . . . . . . . . . . . . . . . . 22Configuration Files . . . . . . . . . . . . . . . . . . . . . . . . . . . . . . . . . . . . . . . . . . . . . . . . . . . . . . . . . . . 22
File Search Order . . . . . . . . . . . . . . . . . . . . . . . . . . . . . . . . . . . . . . . . . . . . . . . . . . . . . . . 22Startice Command File . . . . . . . . . . . . . . . . . . . . . . . . . . . . . . . . . . . . . . . . . . . . . . . . . . . 23Register Definition File. . . . . . . . . . . . . . . . . . . . . . . . . . . . . . . . . . . . . . . . . . . . . . . . . . . 23
Configuration with MONICE . . . . . . . . . . . . . . . . . . . . . . . . . . . . . . . . . . . . . . . . . . . . . . . . . . . 27Configuration with EDBICE . . . . . . . . . . . . . . . . . . . . . . . . . . . . . . . . . . . . . . . . . . . . . . . . . . . 27Configuration with Tornado . . . . . . . . . . . . . . . . . . . . . . . . . . . . . . . . . . . . . . . . . . . . . . . . . . . . 28Configuration with Other Debuggers . . . . . . . . . . . . . . . . . . . . . . . . . . . . . . . . . . . . . . . . . . . . . 28
Configuring AXD for RealMonitor through RDIMAJIC . . . . . . . . . . . . . . . . . . . . . . . . . 29Advanced MAJIC Probe Configuration. . . . . . . . . . . . . . . . . . . . . . . . . . . . . . . . . . . . . . . . . . . . . . . . . 30
Custom Initialization File . . . . . . . . . . . . . . . . . . . . . . . . . . . . . . . . . . . . . . . . . . . . . . . . . . . . . . 31Configuration Options . . . . . . . . . . . . . . . . . . . . . . . . . . . . . . . . . . . . . . . . . . . . . . . . . . . . . . . . 32
Setting Configuration Options . . . . . . . . . . . . . . . . . . . . . . . . . . . . . . . . . . . . . . . . . . . . . 32Configuration Option Display. . . . . . . . . . . . . . . . . . . . . . . . . . . . . . . . . . . . . . . . . . . . . . 33
Memory Configuration . . . . . . . . . . . . . . . . . . . . . . . . . . . . . . . . . . . . . . . . . . . . . . . . . . . . . . . . 33MC Display . . . . . . . . . . . . . . . . . . . . . . . . . . . . . . . . . . . . . . . . . . . . . . . . . . . . . . . . . . . . 34MC Attributes Table . . . . . . . . . . . . . . . . . . . . . . . . . . . . . . . . . . . . . . . . . . . . . . . . . . . . . 34Setting MC Attributes . . . . . . . . . . . . . . . . . . . . . . . . . . . . . . . . . . . . . . . . . . . . . . . . . . . . 35Sample MC Table . . . . . . . . . . . . . . . . . . . . . . . . . . . . . . . . . . . . . . . . . . . . . . . . . . . . . . . 36
Chapter 4 MAJIC Probe Debug Services . . . . . . . . . . . . . . . . . . . . . . . . . 39JTAG Interface. . . . . . . . . . . . . . . . . . . . . . . . . . . . . . . . . . . . . . . . . . . . . . . . . . . . . . . . . . . . . . . . . . . . 40
Target Power Management . . . . . . . . . . . . . . . . . . . . . . . . . . . . . . . . . . . . . . . . . . . . . . . . . . . . . 40JTAG Initialization . . . . . . . . . . . . . . . . . . . . . . . . . . . . . . . . . . . . . . . . . . . . . . . . . . . . . . . . . . . 40
JTAG Reset . . . . . . . . . . . . . . . . . . . . . . . . . . . . . . . . . . . . . . . . . . . . . . . . . . . . . . . . . . . . 41JTAG Chain Dimensions . . . . . . . . . . . . . . . . . . . . . . . . . . . . . . . . . . . . . . . . . . . . . . . . . 41User JTAG Initialization. . . . . . . . . . . . . . . . . . . . . . . . . . . . . . . . . . . . . . . . . . . . . . . . . . 42TAP Selection . . . . . . . . . . . . . . . . . . . . . . . . . . . . . . . . . . . . . . . . . . . . . . . . . . . . . . . . . . 42
Reset Management. . . . . . . . . . . . . . . . . . . . . . . . . . . . . . . . . . . . . . . . . . . . . . . . . . . . . . . . . . . . . . . . . 43Reset Processor vs. Reset Target . . . . . . . . . . . . . . . . . . . . . . . . . . . . . . . . . . . . . . . . . . . . . . . . 44Resetting Internal Peripherals . . . . . . . . . . . . . . . . . . . . . . . . . . . . . . . . . . . . . . . . . . . . . . . . . . . 44
Accessing Memory and Registers . . . . . . . . . . . . . . . . . . . . . . . . . . . . . . . . . . . . . . . . . . . . . . . . . . . . . 44Display and Enter . . . . . . . . . . . . . . . . . . . . . . . . . . . . . . . . . . . . . . . . . . . . . . . . . . . . . . . . . . . . 45
Bit Fields . . . . . . . . . . . . . . . . . . . . . . . . . . . . . . . . . . . . . . . . . . . . . . . . . . . . . . . . . . . . . . 46Interactive Mode . . . . . . . . . . . . . . . . . . . . . . . . . . . . . . . . . . . . . . . . . . . . . . . . . . . . . . . . 46MIPS Mini Assembler . . . . . . . . . . . . . . . . . . . . . . . . . . . . . . . . . . . . . . . . . . . . . . . . . . . 47
Address Expressions . . . . . . . . . . . . . . . . . . . . . . . . . . . . . . . . . . . . . . . . . . . . . . . . . . . . . . . . . . 48ARM Addresses . . . . . . . . . . . . . . . . . . . . . . . . . . . . . . . . . . . . . . . . . . . . . . . . . . . . . . . . 49MIPS Addresses . . . . . . . . . . . . . . . . . . . . . . . . . . . . . . . . . . . . . . . . . . . . . . . . . . . . . . . . 49Address Operators. . . . . . . . . . . . . . . . . . . . . . . . . . . . . . . . . . . . . . . . . . . . . . . . . . . . . . . 49
Searching Memory . . . . . . . . . . . . . . . . . . . . . . . . . . . . . . . . . . . . . . . . . . . . . . . . . . . . . . . . . . . 50Moving Data . . . . . . . . . . . . . . . . . . . . . . . . . . . . . . . . . . . . . . . . . . . . . . . . . . . . . . . . . . . . . . . . 50Filling Memory and Registers . . . . . . . . . . . . . . . . . . . . . . . . . . . . . . . . . . . . . . . . . . . . . . . . . . 51Memory Test . . . . . . . . . . . . . . . . . . . . . . . . . . . . . . . . . . . . . . . . . . . . . . . . . . . . . . . . . . . . . . . 51
Program Execution. . . . . . . . . . . . . . . . . . . . . . . . . . . . . . . . . . . . . . . . . . . . . . . . . . . . . . . . . . . . . . . . . 53Downloading Executable Programs . . . . . . . . . . . . . . . . . . . . . . . . . . . . . . . . . . . . . . . . . . . . . . 53
ELF and COFF Files . . . . . . . . . . . . . . . . . . . . . . . . . . . . . . . . . . . . . . . . . . . . . . . . . . . . . 53
iv 0380-0163-10 Rev 2.01 MAJIC User’s Manual

Contents
Hex and Binary Files . . . . . . . . . . . . . . . . . . . . . . . . . . . . . . . . . . . . . . . . . . . . . . . . . . . . 54Download Performance . . . . . . . . . . . . . . . . . . . . . . . . . . . . . . . . . . . . . . . . . . . . . . . . . . 55
Single Stepping . . . . . . . . . . . . . . . . . . . . . . . . . . . . . . . . . . . . . . . . . . . . . . . . . . . . . . . . . . . . . 55Source Stepping with EDB. . . . . . . . . . . . . . . . . . . . . . . . . . . . . . . . . . . . . . . . . . . . . . . . 56Instruction Stepping . . . . . . . . . . . . . . . . . . . . . . . . . . . . . . . . . . . . . . . . . . . . . . . . . . . . . 56Step Forward Mode . . . . . . . . . . . . . . . . . . . . . . . . . . . . . . . . . . . . . . . . . . . . . . . . . . . . . 56Stepping Over Calls . . . . . . . . . . . . . . . . . . . . . . . . . . . . . . . . . . . . . . . . . . . . . . . . . . . . . 57Step Command List in MONICE . . . . . . . . . . . . . . . . . . . . . . . . . . . . . . . . . . . . . . . . . . . 57Multi-stepping with MONICE . . . . . . . . . . . . . . . . . . . . . . . . . . . . . . . . . . . . . . . . . . . . . 58
Breakpoints . . . . . . . . . . . . . . . . . . . . . . . . . . . . . . . . . . . . . . . . . . . . . . . . . . . . . . . . . . . . . . . . 58Pass Counts. . . . . . . . . . . . . . . . . . . . . . . . . . . . . . . . . . . . . . . . . . . . . . . . . . . . . . . . . . . . 58Software Breakpoints . . . . . . . . . . . . . . . . . . . . . . . . . . . . . . . . . . . . . . . . . . . . . . . . . . . . 59Breakpoint Commands in MONICE . . . . . . . . . . . . . . . . . . . . . . . . . . . . . . . . . . . . . . . . 59Hardware Breakpoints . . . . . . . . . . . . . . . . . . . . . . . . . . . . . . . . . . . . . . . . . . . . . . . . . . . 60EPI OS and Semi-Hosting . . . . . . . . . . . . . . . . . . . . . . . . . . . . . . . . . . . . . . . . . . . . . . . . 61
Starting Execution . . . . . . . . . . . . . . . . . . . . . . . . . . . . . . . . . . . . . . . . . . . . . . . . . . . . . . . . . . . 62Concurrent Debug Mode . . . . . . . . . . . . . . . . . . . . . . . . . . . . . . . . . . . . . . . . . . . . . . . . . 63Starting Execution with MONICE . . . . . . . . . . . . . . . . . . . . . . . . . . . . . . . . . . . . . . . . . . 64Starting Execution with EDBICE. . . . . . . . . . . . . . . . . . . . . . . . . . . . . . . . . . . . . . . . . . . 64
Advanced Topics . . . . . . . . . . . . . . . . . . . . . . . . . . . . . . . . . . . . . . . . . . . . . . . . . . . . . . . . . . . . . . . . . . 65Assigning Names . . . . . . . . . . . . . . . . . . . . . . . . . . . . . . . . . . . . . . . . . . . . . . . . . . . . . . . . . . . . 65Command Aliases . . . . . . . . . . . . . . . . . . . . . . . . . . . . . . . . . . . . . . . . . . . . . . . . . . . . . . . . . . . 65Debugger Local Variables . . . . . . . . . . . . . . . . . . . . . . . . . . . . . . . . . . . . . . . . . . . . . . . . . . . . . 66Formatted Display . . . . . . . . . . . . . . . . . . . . . . . . . . . . . . . . . . . . . . . . . . . . . . . . . . . . . . . . . . . 66Saving a Session Log . . . . . . . . . . . . . . . . . . . . . . . . . . . . . . . . . . . . . . . . . . . . . . . . . . . . . . . . . 67Command (script) Files . . . . . . . . . . . . . . . . . . . . . . . . . . . . . . . . . . . . . . . . . . . . . . . . . . . . . . . 67
Command Parameters. . . . . . . . . . . . . . . . . . . . . . . . . . . . . . . . . . . . . . . . . . . . . . . . . . . . 67Shift/Unshift Commands . . . . . . . . . . . . . . . . . . . . . . . . . . . . . . . . . . . . . . . . . . . . . . . . . 68GOTO Command . . . . . . . . . . . . . . . . . . . . . . . . . . . . . . . . . . . . . . . . . . . . . . . . . . . . . . . 68If Command . . . . . . . . . . . . . . . . . . . . . . . . . . . . . . . . . . . . . . . . . . . . . . . . . . . . . . . . . . . 69+/-Q. . . . . . . . . . . . . . . . . . . . . . . . . . . . . . . . . . . . . . . . . . . . . . . . . . . . . . . . . . . . . . . . . . 70
Chapter 5 MON Command Language . . . . . . . . . . . . . . . . . . . . . . . . . . . . . 71MON Command Basics. . . . . . . . . . . . . . . . . . . . . . . . . . . . . . . . . . . . . . . . . . . . . . . . . . . . . . . . . . . . . 71Debug Monitor Commands . . . . . . . . . . . . . . . . . . . . . . . . . . . . . . . . . . . . . . . . . . . . . . . . . . . . . . . . . . 72Debug Monitor Operands . . . . . . . . . . . . . . . . . . . . . . . . . . . . . . . . . . . . . . . . . . . . . . . . . . . . . . . . . . 124
Chapter 6 Tracing and Trace Points . . . . . . . . . . . . . . . . . . . . . . . . . . . . . 141Trace Buffer. . . . . . . . . . . . . . . . . . . . . . . . . . . . . . . . . . . . . . . . . . . . . . . . . . . . . . . . . . . . . . . . . . . . . 141
Killing the Trace Buffer . . . . . . . . . . . . . . . . . . . . . . . . . . . . . . . . . . . . . . . . . . . . . . . . . . . . . . 142Trace Display Modes . . . . . . . . . . . . . . . . . . . . . . . . . . . . . . . . . . . . . . . . . . . . . . . . . . . . . . . . 142
Disassembled Trace Display . . . . . . . . . . . . . . . . . . . . . . . . . . . . . . . . . . . . . . . . . . . . . 143Raw Trace Display . . . . . . . . . . . . . . . . . . . . . . . . . . . . . . . . . . . . . . . . . . . . . . . . . . . . . 144
Time Stamp . . . . . . . . . . . . . . . . . . . . . . . . . . . . . . . . . . . . . . . . . . . . . . . . . . . . . . . . . . . . . . . 144MAJICPLUS Probe Trace Inputs . . . . . . . . . . . . . . . . . . . . . . . . . . . . . . . . . . . . . . . . . . . . . . . 145Trace Display Customization . . . . . . . . . . . . . . . . . . . . . . . . . . . . . . . . . . . . . . . . . . . . . . . . . . 147Filtered Trace Display . . . . . . . . . . . . . . . . . . . . . . . . . . . . . . . . . . . . . . . . . . . . . . . . . . . . . . . 147
Searching for Trace Frames . . . . . . . . . . . . . . . . . . . . . . . . . . . . . . . . . . . . . . . . . . . . . . 148Trace Display Files . . . . . . . . . . . . . . . . . . . . . . . . . . . . . . . . . . . . . . . . . . . . . . . . . . . . . . . . . 148
Trace Control. . . . . . . . . . . . . . . . . . . . . . . . . . . . . . . . . . . . . . . . . . . . . . . . . . . . . . . . . . . . . . . . . . . . 149
MAJIC User’s Manual 0380-0163-10 Rev 2.01 v

Contents
Trace Enable . . . . . . . . . . . . . . . . . . . . . . . . . . . . . . . . . . . . . . . . . . . . . . . . . . . . . . . . . . . . . . . 149Trace Triggers . . . . . . . . . . . . . . . . . . . . . . . . . . . . . . . . . . . . . . . . . . . . . . . . . . . . . . . . . . . . . 149
Trigger Position. . . . . . . . . . . . . . . . . . . . . . . . . . . . . . . . . . . . . . . . . . . . . . . . . . . . . . . . 150Trigger Event . . . . . . . . . . . . . . . . . . . . . . . . . . . . . . . . . . . . . . . . . . . . . . . . . . . . . . . . . 150
Conditional Tracing . . . . . . . . . . . . . . . . . . . . . . . . . . . . . . . . . . . . . . . . . . . . . . . . . . . . . . . . . 151Trace Points . . . . . . . . . . . . . . . . . . . . . . . . . . . . . . . . . . . . . . . . . . . . . . . . . . . . . . . . . . . . . . . . . . . . . 152
Trace Points in ARM/ETM . . . . . . . . . . . . . . . . . . . . . . . . . . . . . . . . . . . . . . . . . . . . . . . . . . . 152Trace Points in EJTAG/PCTrace . . . . . . . . . . . . . . . . . . . . . . . . . . . . . . . . . . . . . . . . . . . . . . . 152
Appendix A Ethernet Considerations . . . . . . . . . . . . . . . . . . . . . . . . . . . . 153Considerations for All Networks . . . . . . . . . . . . . . . . . . . . . . . . . . . . . . . . . . . . . . . . . . . . . . . . . . . . . 153
Cabling . . . . . . . . . . . . . . . . . . . . . . . . . . . . . . . . . . . . . . . . . . . . . . . . . . . . . . . . . . . . . . . . . . . 153Network Addresses . . . . . . . . . . . . . . . . . . . . . . . . . . . . . . . . . . . . . . . . . . . . . . . . . . . . . . . . . . 154
Hardware Address. . . . . . . . . . . . . . . . . . . . . . . . . . . . . . . . . . . . . . . . . . . . . . . . . . . . . . 154IP Address . . . . . . . . . . . . . . . . . . . . . . . . . . . . . . . . . . . . . . . . . . . . . . . . . . . . . . . . . . . . 154Host Name. . . . . . . . . . . . . . . . . . . . . . . . . . . . . . . . . . . . . . . . . . . . . . . . . . . . . . . . . . . . 155
Making a Connection . . . . . . . . . . . . . . . . . . . . . . . . . . . . . . . . . . . . . . . . . . . . . . . . . . . . . . . . 155Considerations for PC Networks . . . . . . . . . . . . . . . . . . . . . . . . . . . . . . . . . . . . . . . . . . . . . . . . . . . . . 156Information for Network Administrators. . . . . . . . . . . . . . . . . . . . . . . . . . . . . . . . . . . . . . . . . . . . . . . 156
Appendix B Configuration Options . . . . . . . . . . . . . . . . . . . . . . . . . . . . . . 159
Appendix C MON Quick Reference . . . . . . . . . . . . . . . . . . . . . . . . . . . . . 169MONICE Command Line . . . . . . . . . . . . . . . . . . . . . . . . . . . . . . . . . . . . . . . . . . . . . . . . . . . . . . . . . . 169MON Commands . . . . . . . . . . . . . . . . . . . . . . . . . . . . . . . . . . . . . . . . . . . . . . . . . . . . . . . . . . . . . . . . . 171Debug Monitor Operands. . . . . . . . . . . . . . . . . . . . . . . . . . . . . . . . . . . . . . . . . . . . . . . . . . . . . . . . . . . 175Command Line Editor . . . . . . . . . . . . . . . . . . . . . . . . . . . . . . . . . . . . . . . . . . . . . . . . . . . . . . . . . . . . . 176History File . . . . . . . . . . . . . . . . . . . . . . . . . . . . . . . . . . . . . . . . . . . . . . . . . . . . . . . . . . . . . . . . . . . . . 177
Appendix D MAJIC Probe Update Procedure . . . . . . . . . . . . . . . . . . . . . 179Software Update. . . . . . . . . . . . . . . . . . . . . . . . . . . . . . . . . . . . . . . . . . . . . . . . . . . . . . . . . . . . . . . . . . 179
Production Update . . . . . . . . . . . . . . . . . . . . . . . . . . . . . . . . . . . . . . . . . . . . . . . . . . . . . . . . . . 179Engineering Update . . . . . . . . . . . . . . . . . . . . . . . . . . . . . . . . . . . . . . . . . . . . . . . . . . . . . . . . . 180
Firmware Update . . . . . . . . . . . . . . . . . . . . . . . . . . . . . . . . . . . . . . . . . . . . . . . . . . . . . . . . . . . . . . . . . 180Hardware Update . . . . . . . . . . . . . . . . . . . . . . . . . . . . . . . . . . . . . . . . . . . . . . . . . . . . . . . . . . . . . . . . . 182
PLD Version . . . . . . . . . . . . . . . . . . . . . . . . . . . . . . . . . . . . . . . . . . . . . . . . . . . . . . . . . . . . . . . 182Hardware Update Process . . . . . . . . . . . . . . . . . . . . . . . . . . . . . . . . . . . . . . . . . . . . . . . . . . . . . 183
Index . . . . . . . . . . . . . . . . . . . . . . . . . . . . . . . . . . . . . . . . . . . . . . . . . . . . . 187
vi 0380-0163-10 Rev 2.01 MAJIC User’s Manual

About this Manual
This is the user manual for the Embedded Performance MAJIC, MAJICMX, and MAJICPLUS Intelligent Debug Probes. The information in this manual is intended to serve both new and experienced users. It outlines the installation and operation of the emulator, and describes how each of the emulator features works. It documents how the emulator interacts with the processor and target system, and discusses configuration issues.
Note: Except where explicitly stated to the contrary, the term MAJIC probe refers to the entire MAJIC Series of intelligent debug probes, but MAJICMX probe and MAJICPLUS probe refer only to those specific models.
How to Use This ManualChapter 1, Overview
Provides a brief overview of the probes and debuggers that comprise the MAJIC debug environment.
Chapter 2, Getting Started
Provides a listing of the MAJIC intelligent debug probe system components, and describes how to install, set up, and check out the probe.
Chapter 3, Debug Environment
No two target systems are quite the same. Therefore, certain aspects of the debug environment may be adjusted to accommodate differences between target systems. This chapter describes how to configure your debug environment.
Chapter 4, MAJIC Probe Debug Services
Discusses the MAJIC debug services for debugging both hardware and software, and for running automated test suites.
Chapter 5, MON Command Language
Describes the MON command language.
i
MAJIC User’s Manual 0380-0163-10 Rev 2.01 vii

About this Manual
Chapter 6, Tracing and Trace Points
Discusses the real-time trace and trace point features of the MAJICMX and MAJICPLUS intelligent debug probes.
Appendix A, Ethernet Considerations
Describes how to connect the MAJIC intelligent debug probe to a new or existing Ethernet network.
Appendix B, Configuration Options
Provides a reference of all configuration options.
Appendix C, MON Quick Reference
Provides a reference of MON commands and operands.
Appendix D, MAJIC Update Procedure
Provides information on updating the EDT software package, MAJIC firmware, and MAJICPLUS Trace Control hardware.
Notational ConventionsThe following conventions are used in the syntax descriptions of this manual.
Bold face Bold is used for characters that must be entered exactly as shown.
Italic Is used to indicate a general category of input that will be described in detail in the command operands section. Italic is also used when a new term or concept is first introduced, and for the title of other documents.
monospaced A non-proportional type face is used for the names of registers, processor and emulator signals, and configuration options.
<key> Angle brackets indicate that the item enclosed within the brackets is the name of a special key on the host's keyboard. Some examples are <enter>, <backspace>, and <esc>. In some cases several keys must be held down simultaneously, which is indicated with a dash between them. For example, <ctrl-C>.
�� � Square brackets are used to enclose an optional operand or group of operands. The brackets are not to be entered in the command.
��� Curly braces are used for grouping purposes. These are not to be entered in the command. They either enclose a list of alternatives, one of which must be chosen, or they enclose a group of operands that are to be taken together in the context of a list of alternatives or a subsequent repetition.
viii 0380-0163-10 Rev 2.01 MAJIC User’s Manual

About this Manual
��� An ellipses (three dots in succession) is used to indicate that the preceding operand, or group of operands if enclosed by �� � or ���, may optionally be repeated one or more times.
� A vertical bar is used to indicate that the operand, or group of operands if enclosed by � �� or ���, on either side of the bar may be entered, but not both.
�� Two dots in succession indicate the inclusion of sequential items between given start and stop points. For example, a��z refers to the entire alphabet including a and z.
AlertsConditions or practices that could damage the equipment are labeled with the word CAUTION. These keywords appear along with the following icon displayed in the margin:
ServiceIn general this equipment is not user serviceable. Do not perform any service other than as specified in this manual.
Getting HelpIf you have any technical questions, concerns, or problems with your MAJIC or the EDT software package that accompanies it, please do not hesitate to contact our technical support department for help. The following table lists contact information for EPI technical support.
We are committed to making sure our tools work well for you. To expedite your request, be sure to provide your MAJIC serial number and EDT software serial number when contacting EPI technical support.
!
Method Information
Web Site www.epitools.com
• Application Notes
• FAQs
• Support Request Form
• Updates
Email [email protected]
Telephone 408-957-0350
MAJIC User’s Manual 0380-0163-10 Rev 2.01 ix

About this Manual
x 0380-0163-10 Rev 2.01 MAJIC User’s Manual

MAJIC User’s Manual 0380-0163-10 Rev 2.01
1
OverviewThe MAJIC Intelligent Debug Probe environment consists of two components that communicate through an Ethernet port or a high speed RS-232C serial data port: a debugger running on a host computer, and a MAJIC probe.
The MAJIC probe contains the hardware and software that controls the JTAG interface to the processor’s Debug Support Unit (DSU), stores trace data, and performs debug services such as memory test, single stepping, and breakpoint management.
The debugger implements high-level debug functions by sending debug service requests to the MAJIC probe over the communication link. It then formats and displays the data or status information that is returned from the MAJIC probe.
This chapter provides a brief overview of the MAJIC series of intelligent probes, and their use with debuggers from EPI and third-party tool venders. Except where otherwise stated, the term MAJIC probe refers to the entire MAJIC series of intelligent debug probes.
What is the MAJIC Probe?The MAJIC (Multi-processor Advanced JTAG Interface Controller) probe is a debugging and development tool that provides the user the ability see what is taking place in the target system, and control its behavior. The MAJIC probe provides the debug services that the debugger uses to perform debug operations. It receives command packets over the communication link, and translates them into the JTAG operations that are needed to provide the specific service.
First, it can control the operation of the target processor and target system. What does it mean to “control” the target? In most cases it means to start and stop the processor's execution of instructions at arbitrary points in a program, examine and store values in the processor’s registers, and examine and store program code or data in the target system’s memory.
Depending on the capabilities of your target processor and MAJIC probe model, it may also be possible to record real-time execution history in a trace buffer. This
1

1 Overview
allows you to see what the processor was doing prior to a trigger event, or what the processor did after a trigger event. With ARM/ETM and the MAJICPLUS probe, it is even possible to capture load/store addresses and, optionally, data values for an even more complete picture.
The MAJIC Probe Models
The base MAJIC probe provides processor control and target access for one processor. The processor can be on a JTAG daisy chain with other devices, even other processors, but can only connect to one processor at a time.
The MAJICMX probe incorporates EPI’s MDS2 technology to support debugging multiple processors concurrently through a single JTAG interface. The MAJICMX
probe also supports real-time tracing for processors with on-chip trace buffers.
The MAJICPLUS probe includes everything provided by the MAJICMX probe plus support for real-time tracing on processors with external trace interfaces such as ARM/ETM and EJTAG v2.0.
NOTE: Please visit the EPI web site for more information on our MDS2 technology.
What is a Debugger?A debugger is a program that runs on a host computer, providing the user interface for the features of the MAJIC probe.
A symbolic debugger is a low-level debugger that is useful for debugging the hardware, software written in assembly language, or software written in a language not supported by a source-level debugger. It may also be the best tool for running automated test procedures such as manufacturing test suites and diagnostics.
A source-level debugger understands the programming language of the application program source code. This allows the user to debug source code, without having to try to relate dumps of disassembled, optimized machine code.
EPI offers the following debuggers:
• MONICE (a symbolic debugger)
• EDBICE (a C source-level debugger)
• ADW and AXD (ARM’s source-level debuggers)
In addition to the debuggers available from EPI, third-party debuggers can also be used with the MAJIC probe. The MAJIC probe provides access to all its capabilities via the following open Application Programming Interfaces (API):
• A library implementing the architecture-neutral Meta Debug Interface specification is available, as described in the MAJIC MDI User’s Guide. This is the interface library used by GDB, as well as several commercially available debuggers.
i
2 0380-0163-10 Rev 2.01 MAJIC User’s Manual

Overview 1
• The EDTA software package that comes with the MAJIC probe includes a library implementing version 1.5.1 of the ARM Remote Debug Interface (RDI) specification. See the MAJIC RDI User’s Guide for details.
• For Windows CE support, EPI offers an eXDI driver and plug-in for Platform Builder 3.0 and 4.0.
• For Tornado support, EPI offers a Wind River Back-End option for interfacing the MAJIC probe to the Tornado development environment.
MAJIC User’s Manual 0380-0163-10 Rev 2.01 3

1 Overview
4 0380-0163-10 Rev 2.01 MAJIC User’s Manual

MAJIC User’s Manual 0380-0163-10 Rev 2.01
2
Getting StartedThis chapter provides the essential information you need to set up your MAJIC Intelligent Debug Probe hardware. It includes the following sections:
• Unpacking the System below discusses issues concerning unpacking and repacking for shipping.
• Hardware Installation on page 6 describes how to set up the MAJIC probe and its accessories.
• Target Connection on page 6 provides information on connecting the MAJIC probe to your target.
• Host Computer Connections on page 8 describes how to connect the MAJIC probe to your computer using a serial connection or Ethernet.
• System Check-out on page 12 provides step-by-step instructions to verify that the MAJIC probe is operating properly.
CAUTION: Incorrect installation can damage the MAJIC probe or your target board, so please read this chapter carefully. Also, this equipment is not user serviceable. Do not perform any service other than as specified in this manual.
Unpacking the SystemThe MAJIC probe is delivered in a cardboard shipping carton. This carton and the associated packing materials around the MAJIC probe are designed to absorb any reasonable shock normally encountered in transit. Prior to unpacking, examine the exterior of the shipping carton for any signs of damage. Note any damage and if damage is severe, notify the carrier immediately before opening carton.
Carefully remove the MAJIC probe, options, and accessories from the carton and inspect the exterior of the instrument for any signs of damage. If damage is found, notify the carrier immediately. You may also wish to contact EPI Customer Support.
CAUTION: You should always use the original shipping carton and packaging material when shipping this equipment.
!
!
5

2 Getting Started
If you are missing any of the standard or optional items that were ordered, check the packing slip. If the packing slip does not indicate that the missing items are back ordered, please contact EPI Customer Support immediately (see Getting Help on page ix).
Hardware InstallationThe MAJIC probe should be placed horizontally on a firm, flat surface. You should consider how the JTAG cable(s) will be routed to the target system to avoid undue stress, twisting, or scraping.
Power Connection
The MAJIC probe comes with its own power supply. If an alternate power supply is used, it must generate a regulated 5V DC at 4A or greater. For correct operation, the 2.1mm power connector should have the positive supply connected to the center pin, as shown below:
CAUTION: The MAJIC probe may be damaged if the wrong power supply is used. Damage resulting from using the wrong power supply is not covered under warranty or MUS contract. Please look for the MAJIC probe label on the DC power cord.
Target Connection
The standard MAJIC probe and MAJICMX probe use a female DB25 connector for the target connection. A single cable either connects the MAJIC probe directly to the debug connector on your board, or to a Target Adapter Module which is then installed on your board.
A MAJICPLUS probe uses a MAJICPLUS Adapter Module to adapt its high density connector to various target connector configurations. One or two cables connect the MAJICPLUS Adapter Module either directly to the debug connector on your board, or to a Target Adapter Module which is then installed on your board.
Cable Kits The cable(s) required to connect a MAJIC probe to your target system depends on the MAJIC probe model, and the specific debug connector on your board. EPI offers a number of connection kits to cover common connectors.
The following figure is an example of how the MAJIC probe connects to a target board. Please refer to the application note included with your connection kit accessory for specific connection information.
0Vground
+5V
!
6 0380-0163-10 Rev 2.01 MAJIC User’s Manual

Getting Started 2
NOTE: Before attempting to use the MAJIC probe on your target board, you must address specific configuration issues (as described in Chapter 3, Debug Environment, on page 15).
Mini Probe The MAJICPLUS probe can trace up to eight external test points via a Mini-Probe. The Mini-Probe connects to the front of the MAJICPLUS probe box via a 20-pin ribbon cable. A set of clips are provided to attach to the test points on your board.
Caution: The mini-probe ribbon cable is keyed and must be inserted into the connector on the mini-probe case and the MAJICPLUS probe in the proper orientation. DO NOT FORCE. When properly aligned, the connectors will engage smoothly. Improper orientation may cause damage or loss of functionality. The “red-stripe” on the ribbon cables DO NOT provide a positive indication of the keying.
NOTE: Because the mini-probe is separate from the processor connection, the sample point (in time) of the user probes is not tightly coupled to the processor's trace clock. Furthermore, user probes are generally used with signals that are not synchronous to the trace clock. This imposes a restriction that a signal must remain in a high or low state for at least two trace clock cycles to guarantee that the pulse is captured. This may also cause a slight skew between the processor’s trace signals and the user probes in the trace buffer.
MAJIC
Target Board
Debug Connector
Target Adapter Module
Target Connector
Target Connection Cable(s)
1
or MAJICPLUS Adapter Module (MAJICPLUS probe)DB25 Connector (MAJIC or MAJICMX probes)
i
!
"KEY"
Cable
Mainframe ConnectorMini-Probe or
Connector
i
MAJIC User’s Manual 0380-0163-10 Rev 2.01 7

2 Getting Started
Triggers A MAJIC probe can trigger, or be triggered by, external test equipment using the following connections on the rear panel of the MAJIC probe box:
TRIG IN Allows external test equipment (or another MAJIC probe) to trigger the MAJIC probe. To use this feature, a coax cable no more than 1 meter in length should be connected to the trigger output of the external test equipment.
TRIG OUT Can be used to trigger external test equipment (or another MAJIC probe) from the MAJIC probe. To use this feature, a coax cable no more than 1 meter in length should be connected to the trigger input of the external test equipment.
TRACE ENABLE Can be used with the MAJICPLUS probe to trigger or conditionally inhibit trace acquisition from the external test equipment. (Only the MAJICPLUS probe supports this connector). To use this feature, a coax cable no more than 1 meter in length should be connected to the trigger output of the external test equipment.
NOTE: No “T” or terminator is required for these connections.
Host Computer Connections
All communication connectors are located on the rear panel of the MAJIC probe. The MAJIC probe can be connected to the host computer with a high speed RS-232C serial interface or through an Ethernet network connection (described in Ethernet Setup on page 9).
Serial Connection To connect to the host through a serial cable, observe the 9-pin connector on the rear panel of the MAJIC probe. Connect the male end of the RS-232C serial cable to the 9-pin connector labeled “SERIAL”. Connect the other end of the cable to the serial port on the host computer or workstation which will be used with the MAJIC probe, and note which communication port you have selected. This will be required when you begin using the MAJIC probe.
NOTE: The MAJIC probe’s serial connector is wired as a “DCE” device. As typical computer serial ports are wired as “DTE” devices, a straight-through one-to-one cable (i.e. not a “null modem”) is used. Only pins 2 (RX), 3 (TX), and 5 (GND) are required to be wired; no handshaking signals DTR/DCD and RTS/CTS are used.
Debug Terminal When not used for host communication, the serial port doubles as a diagnostic terminal. It can be connected to a dumb terminal using a straight-through RS-232C cable. Only pins 2, 3, and 5 are required to be connected.
The terminal should be set for 9600 baud, 8 bits, 1 stop, no parity. Characters that are typed are echoed back to the terminal, but are not processed. The sole purpose of using this port for a diagnostic terminal is to display diagnostic and status messages when instructed to do so by EPI Technical Support.
i
i
8 0380-0163-10 Rev 2.01 MAJIC User’s Manual

Getting Started 2
Ethernet Setup The MAJIC probe supports both 100Base-T and 10Base-T (twisted-pair). For technical details on how to connect the MAJIC probe to a new or existing network, see Appendix A, Ethernet Considerations, on page 153.
Attaching the MAJIC Probe to Ethernet
The process of attaching a MAJIC probe to an Ethernet network consists of four steps:
1. Connect the MAJIC probe to a network hub using a standard ethernet cable. Alternatively, you can connect the MAJIC probe directly to your computer with a “cross-over cable” for a point-to-point connection. Both types of cables are provided with each MAJIC probe.
2. Assign (or obtain from your system administrator) a host name and IP address for the probe. The host name is optional, but is easier to remember than the IP address.
3. If you are using a host name for the MAJIC probe, make sure that the computer on which you will be running the debugger can translate the MAJIC probe’s host name to its IP address.
4. Make sure that the MAJIC probe will be able to learn the IP address you have assigned to it, either statically, dynamically, or manually. These options are explained below.
Static IP A static IP address can be programmed into the MAJIC probe so that MAJIC probe always knows its IP address. If you have installed the EDT software package on a Windows system, the easiest way to set the static IP address is to connect the MAJIC probe to your computer with a serial port and use the MAJIC probe Setup Wizard. Alternatively, you can establish a temporary ethernet or serial connection and then set the static IP address from within the debugger. These procedures are provided below.
NOTES:
• Neither the wizard nor debugger will be able to use the COM port if another application (such as hyperlink or your PDA) is using it.
• To clear the static IP address, follow the procedure below and program the static IP address to 0.0.0.0
Setting the Static IP via the Setup Wizard
1. Connect the MAJIC probe to your computer’s COM port (See Serial Connection on page 8).
2. Power up the MAJIC probe. You can leave the target system turned off or disconnected during the update process, or you can connect it normally. Make sure the Status LED is green before proceeding.
3. Click on the Windows Start button, choose Programs, and then choose the MAJIC Setup Wizard shortcut in the EPI Tools folder.
4. Read the introductory information on the first form, then click Next to open the Choose Operation form, shown below.
i
MAJIC User’s Manual 0380-0163-10 Rev 2.01 9

2 Getting Started
5. Click on the Go button in the Setup Static IP Related Address Information on your MAJIC box to open the Configure Static IP Address form, shown below.
6. Enter the network information provided by your network administrator, and click NEXT to display the MAJIC Connection Parameters form, shown below.
10 0380-0163-10 Rev 2.01 MAJIC User’s Manual

Getting Started 2
7. Select serial as your connection method in the MAJIC Connection Parameters form.
Make sure the COM port is not in use by another program, and that the serial cable is correctly installed.
8. Click on the button Install IP to set the network information—this will take a few moments, and it is important not to disturb the process once started.
9. After the update has completed, you can close the Setup Wizard by clicking on the Quit button.
10. Power cycle the MAJIC probe so that the new settings can take effect. You should now be able to “ping” the MAJIC probe using your computer’s ping command.
Setting the Static IP via the Debugger
1. If you want to use a serial connection to program the static network information, connect the MAJIC probe to your computer’s COM port (See Serial Connection on page 8). If you want to use a temporary ethernet connection instead, use the Manual ARP method (described in Manual ARP on page 12) to create the temporary IP address (which can be the same as your static IP address).
2. Set up your debug environment as described in Chapter 3, Debug Environment, on page 15. EPI recommends using MONICE for this, using the start-up files in the ice/majic folder of your EDT software package. However, it is possible to complete this procedure with any debug environment.
3. Use the following commands to set the static network information. Normally only the first is required, but if the MAJIC probe and your computer are located on separate subnets, then you may need to set all three options. (See Appendix A, Ethernet Considerations, on page 153 for more information on this topic.)
eo Tv_Ip_Address = ___.___.___.___
eo Tv_Ip_Netmask = ___.___.___.___
eo Tv_Ip_Gateway = ___.___.___.___
4. Exit the debugger and then power cycle the MAJIC probe so the new settings can take effect. You should now be able to “ping” the MAJIC probe using your computer’s ping command.
5. If you completed this process with a serial connection, you may now reconfigure your debug environment to use the ethernet port instead (see Chapter 3, Debug Environment, on page 15).
Dynamic IP If the MAJIC probe is being connected to a network where IP addresses are centrally administered, it may not be desirable to configure the probe with a static IP address. In this case, the MAJIC probe can acquire its IP address dynamically from a network server using either the RARP or BOOTP protocol.
If some server on the net will respond to a RARP (Reverse ARP) or BOOTP request, the probe will get its IP address from the response packet and will then be
MAJIC User’s Manual 0380-0163-10 Rev 2.01 11

2 Getting Started
able to respond to ARP request packets and connect to any computer on the net. Your network administrator will determine whether to use a RARP or BOOTP server, and will set up the server appropriately. To do this, they will need to know the MAJIC probe’s Ethernet address, which is on the serial number label on the bottom of the MAJIC probe.
Manual ARP If the MAJIC probe’s static IP address has not been set, and there is no RARP or BOOTP server on the network, there is one other way to make a connection to the MAJIC probe using Ethernet: the computer that will connect to the MAJIC probe can have the MAJIC probe’s IP address to Ethernet Address translation added to its ARP table manually.
The ARP table is a table of Internet to Ethernet address translations, maintained in memory by the network software on your computer. It is used to reduce network traffic by remembering the Ethernet address for other network nodes to which packets have been sent recently. This avoids the need to re-issue ARP requests frequently.
If an entry is made in this table manually, then when you run the debugger (or execute the ping command), the host can directly address packets to the MAJIC probe without first having to issue an ARP request and wait for a reply.
On most systems, a manual ARP table entry is made via the arp command:
arp -s host_name ethernet_address
NOTES:
• Manually entered ARP table entries are not retained when your computer is rebooted.
• Windows 95 and 98 do not support arp -s unless you have ping’ed some other network node first.
System Check-outSystem check-out consists of two steps: a built-in self test, and a functional verification procedure. These check-out procedures allow you to verify that the MAJIC probe is operating properly.
Power-on Self-Test
The MAJIC probe performs a built-in, power-on self-test (POST) to verify its functionality. The target may or may not be powered up (or even connected to the MAJIC probe) at this time.
As the name implies, the POST is invoked each time power is applied to the MAJIC probe. Since the POST executes quickly, it is recommended that this entire section be read before applying power to the MAJIC probe so you will know what to watch for.
i
12 0380-0163-10 Rev 2.01 MAJIC User’s Manual

Getting Started 2
Apply power to the MAJIC probe and observe the color of the five LED indicators (POWER, STATUS, ENET, RUN, and CONNECT). When power is applied, the POWER indicator turns green.
When the POST firmware is initiated, the STATUS indicator will turn red. When the tests have been completed, the STATUS indicator will turn off, and the firmware will initialize. If you have connected a debug terminal to the MAJIC probe’s serial port (see Debug Terminal on page 8), then hardware and firmware revision information is displayed at this time. Once the MAJIC probe is ready for use, the STATUS indicator will turn green.
If a fatal failure is detected, the STATUS indicator will flash a pattern indicating which test failed. Record the number of green flashes and red flashes, and call EPI technical support. Do not attempt to complete the system check-out or use the system.
The ENET indicator is green when the ethernet link is ready but not in use, off when transmitting or receiving, and blinks red when a collision occurs.
The RUN indicator is red whenever the target processor is reset by the MAJIC probe; off when neither reset nor running; and green when the target processor is executing code.
The CONNECT indicator is green whenever the MAJIC probe is electrically connected to the target system, and red when disconnected. It remains red until a debug session is initiated and the target power monitor is enabled (see Target Power Management on page 40), and then serves as a target power indicator. When the debugger is exited, the MAJIC probe disconnects from the target, and the CONNECT indicator turns red.
JTAG Bypass Test
When the MAJIC probe first connects to the target system and detects target power, it attempts to initialize and test the JTAG interface. First it attempts to determine the configuration of the JTAG scan chain. If successful, it then performs a Bypass test, which is essentially a loopback test through the JTAG scan chain. This sequence is repeated whenever the MAJIC probe detects that the target’s power has been cycled. For more information on JTAG initialization, see JTAG Initialization on page 40.
Confidence Test
The MAJIC probe software package includes an automated test suite to verify that the MAJIC probe is working correctly. To use this test suite, you must attach the MAJIC probe to the appropriate reference board for your processor. If using a MAJICPLUS probe then you should also connect the Trigger Out to the Trace Enable on the back of the unit.
The test suite is run under the MONICE debugger. If you have installed the EDT software package on a Windows system, use the MAJIC Setup Wizard to create a
MAJIC User’s Manual 0380-0163-10 Rev 2.01 13

2 Getting Started
shortcut to MONICE, as described in Chapter 3, Debug Environment, on page 15. Be sure to select ice\majic\reg_test.xxx in the Configuration Files form, since special start up files are required when running this test suite (see Specify Your Configuration Files’ Location on page 19).
To run the confidence test under Linux or Solaris, start MONICE from within the ice/majic/reg_test.xxx directory. You will need to specify the -d and -v switches to define the communication device and CPU version you are using. For little endian targets, be sure to include the -l switch as well. See MONICE Command Line on page 169 for full information on running MONICE.
After starting MONICE, check that the MAJIC probe’s status LED is green. If not, review the messages presented by MONICE to see if it has already reported a problem.
If the status LED is green, initiate the test suite with the following command:
MON> fr c reg_test
When the test completes, view the reg_test.out file with any text editor and verify that all tests completed with no differences. If differences are reported, please zip the reg_test.out and output\*.out files and send them to [email protected] for analysis.
14 0380-0163-10 Rev 2.01 MAJIC User’s Manual

MAJIC User’s Manual 0380-0163-10 Rev 2.01
3
Debug EnvironmentEvery target system is different, so the MAJIC Intelligent Debug Probe needs information on the specifics of your system design in order to operate correctly. This chapter discusses how to tailor the MAJIC probe to your specific hardware and personal preferences. It also provides instructions for setting up the debugger environment.
Using the Setup WizardIf you are using a debugger that runs under Windows, the MAJIC Setup Wizard is the easiest way to configure your debug environment. Using the MAJIC Setup Wizard you can:
• Choose your debugger and processor.
• Select the MAJIC probe connection information.
• Define the target interface information or select a pre-existing target interface definition. (You can select a sample provided with your EDT software package, or one that you created previously.)
NOTE: If you are using GDB in a Linux or Unix environment, please refer to Configuration with Other Debuggers on page 28, and the Using GDB with MAJIC Intelligent Debug Probes Application Note for information on configuring GDB for use with the MAJIC probe.
Choose Your Debugger
Run the MAJIC Setup Wizard, read the introductory information on the first form, then click Next to open the Choose Operation form, shown below:
i
15

3 Debug Environment
Choose your debugger from the drop down list, and click Go. This controls the action(s) that the wizard will take upon completion.
NOTE: If you are intending to use a third-party debugger with the MAJIC probe, you should test your configuration with MONICE first, then run the wizard again to set up the other debugger. Refer to the appropriate EPI and debugger documentation for information on how to connect your debugger to the MAJIC probe.
The Choose Operation form allows you to configure the following debuggers:
EDBICE EDBICE is EPI’s C source-level debugger with built-in support for real-time trace. It provides an easy to use graphical user interface implemented as a Windows application.
MONICE MONICE is the command-line based, symbolic, assembly language debugger included in the EDT software package. It is well suited for the early stages of hardware debugging, and running automated test scripts. Refer to Chapter 5, MON Command Language, on page 71, for information on MONICE.
Platform Builder for Windows CE
EPI offers support for using the MAJIC probe in the Platform Builder environment with an eXDI driver included in the EDT software package. EPI also offers a Platform Builder Plug-In to provide access to the high-end features of the MAJIC probe, such as real-time trace.
ADW, AXD, and Other RDI Debuggers
The EDTA software package that comes with the MAJIC probe includes an RDI driver to support ADW, AXD, and other RDI compliant debuggers. Refer to the RDI for MAJIC User’s Guide and the documentation that came with your debugger for more information on configuring the RDI debug environment.
i
16 0380-0163-10 Rev 2.01 MAJIC User’s Manual

Debug Environment 3
NOTE: Tornado Users - The current version of the MAJIC Setup Wizard does not support the Wind River Tornado environment. However, EPI offers support for using the MAJIC probe in the Tornado environment with the “Wind River Back-End” option. Refer to the Tornado Interface for MAJIC User’s Manual and the documentation provided with the Tornado Development environment for full information on using the MAJIC probe in the Tornado Development Environment.
Specify Your Project Name
After you chose your debugger and click Go, the Project Name form opens (shown below).
Specify a project name and description, then click NEXT to continue.
The project name is used to create desktop shortcuts to EDB and MON. Both the project name and description are added as comment header blocks in the startup command files (startice.cmd) and the configuration files (epimdi.cfg and rdimajic.cfg).
GDB GDB works with the MAJIC probe via a program called mdiserver, which is included in the EDT distribution. mdiserver implements the standard GDB remote-protocol, so no special build of GDB is required. mdiserver then uses the standard MDI shared library to interface to the MAJIC probe. See the Using GDB with MAJIC Intelligent Debug Probes Application Note for details on using GDB with the MAJIC probe.
MDI-compliant Debuggers
There are several commercially available debuggers that interface to the MAJIC probe via MDI. Refer to the MDI for MAJIC User’s Guide and the documentation that came with your debugger for more information on configuring the MDI debug environment.
i
MAJIC User’s Manual 0380-0163-10 Rev 2.01 17

3 Debug Environment
Specify Your Processor
After you specify your project and click Next, the CPU Configuration form opens (shown below).
From the drop-down list in this form, pick the processor that most closely matches the processor you are using. Also select either Little Endian or Big Endian as appropriate for your system. Then click NEXT to continue.
Specify Your Connection Type
After you specify your processor and click Next, the MAJIC Connection Parameters form opens (shown below).
Specify whether you will use a serial or ethernet connection, and then click NEXT.
• If you choose serial, then select the COM port and baud rate. (Remember that the debugger will not be able to use the COM port if another application such as Hyperlink or your PDA is using it.) On most computers 115k baud is the best choice, but on some computers a slower speed may be more reliable.
• If you choose ethernet, then specify the MAJIC probe’s host name or IP address in the appropriate box. See Ethernet Setup on page 9 for information on establishing an ethernet connection with the MAJIC probe.
18 0380-0163-10 Rev 2.01 MAJIC User’s Manual

Debug Environment 3
i
Specify Your Configuration Files’ Location
After you specify your connection parameters and click Next, the Configuration Files form opens (shown below).
The key information for adapting the MAJIC probe to a given target board is specified in configuration files, which are read by the debugger or debug interface library when the debugger starts up (described later in Configuration Process on page 22).
In the Configuration Files form, you can specify either an existing startup file or to create a new startup file, and then click NEXT to continue.
• To specify an existing startup file (either an EPI sample startup file or a startup file that you already have), select the box Use Existing Startup File, and enter the location of the file in the Directory field, or use the Browse button to select the location.
For EDB or MON, this should be your project’s build directory. For other debuggers, you must put the configuration files where your debugger expects to find them (check your debugger documentation).
NOTE: The EDT software package includes sample startup files for standard reference platforms in the samples/... folders. If your board is similar to one of the reference boards, you can just install the appropriate sample file(s).
• To create a new startup file, select the box Create New Startup File. You should then click the Adjust Default Properties button to review the information in the Target Interface Properties form, shown below.
The default properties are based on the reference board for your CPU, but they can be adjusted to accommodate differences on your board. After reviewing the properties, click OK to return to the Configuration Files form.
MAJIC User’s Manual 0380-0163-10 Rev 2.01 19

3 Debug Environment
NOTES:
• Information on each of these options is provided in the text box at the bottom of the form.
• Except for user-defined start-up files, these options are also described in Appendix B, Configuration Options, on page 159, and the relevant sections in Chapter 4, MAJIC Probe Debug Services, on page 39.
• See Advanced MAJIC Probe Configuration on page 30 for information on user-defined start-up files.
Specify Your Destination or Reference Directory
NOTE: If you are using Platform Builder for Windows CE, skip this step. There is no need to specify a destination or reference directory, and the Perform Setup form appears instead. Go to Perform the Setup on page 21.
After you specify how you want to handle your startup file in the Configuration Files form and click NEXT, the Destination or Reference Directory form appears (shown below).
NOTE: Depending on the selections you make in the previous forms, there may be certain differences in the form from the figure shown below.
i
i
i
20 0380-0163-10 Rev 2.01 MAJIC User’s Manual

Debug Environment 3
NOTE: Some third party debuggers have special requirements as to where the files must be placed. Check your documentation or related EPI documentation for more information.
If you want to establish a new debug environment, click the option Select a Destination Directory to Create/Copy Startup Files to, and either enter a directory or use the Browse button to select the directory. This option applies whether you are using an existing startup file or are creating a new startup file. Normally this directory should be your project’s build directory. If you specify a directory that does not exist, you will be prompted to create the directory.
If you want to use an existing debug environment with the EDBICE or MONICE debugger, or use an EPI sample startup file, click the option Reference the existing startup files from their location. In this case, the location you specified in the Configuration Files form is used. Selecting this option creates a shortcut to run the existing startup file.
After making your selection, click NEXT to continue.
Perform the Setup
After you specify your destination or reference directory and click Next, the Perform Setup form opens (shown below).
i
MAJIC User’s Manual 0380-0163-10 Rev 2.01 21

3 Debug Environment
This form lists the setup actions that the Setup Wizard will perform. Review the setup actions listed to ensure that the correct actions will be performed. To make changes, click BACK to return to the appropriate form and make any corrections needed. When you are satisfied with the actions listed, click Perform Actions.
Configuration ProcessThis section describes the initialization process that takes place when you launch the debugger and connect to the MAJIC probe. The initialization process varies slightly, depending on your debug environment. The following sections explain the initialization process for various debug environments:
• Configuration with MONICE on page 27
• Configuration with EDBICE on page 27
• Configuration with Tornado on page 28
• Configuration with Other Debuggers on page 28
Configuration Files
This section discusses the startice command file (startice.cmd) and the register definition file (*.rd).
File Search Order EPI debuggers and debug libraries use the following search order to find any needed files (such as the initialization files):
1. They first search the current working directory.
2. Then the directory from which the debugger was loaded (i.e. the bin directory).
3. Then each directory in your PATH environment variable.
For example, if MONICE searches for the startice.cmd command file, it uses the first startice.cmd file that it finds. If startice.cmd reads a user-supplied
22 0380-0163-10 Rev 2.01 MAJIC User’s Manual

Debug Environment 3
initialization file, the same search order is used to find that file (unless a full path is provided).
Startice Command File
Most of the adaptations required to tailor the MAJIC probe to a given target board are handled with a start-up script file named startice.cmd. This is a command file that sets the key configuration options for describing the target system and controlling the MAJIC probe’s operation. It also declares a memory configuration table to describe the target’s memory system. Optionally, it can read a user-supplied command file, if the target board has special initialization considerations, or to set advanced options.
The EDT software package that comes with the MAJIC probe includes several sample startice.cmd files for standard reference platforms. If your target board resembles a standard reference platform, you can use the appropriate sample startice.cmd by installing it with the MAJIC Setup Wizard (see Specify Your Configuration Files’ Location on page 19). Otherwise, you can use the MAJIC Setup Wizard to create a startice.cmd with properties appropriate for your board (see the figure on page 20).
Register Definition File
EPI debuggers and debug libraries allow you to add your own definitions for application-specific co-processor registers and memory-mapped registers to the standard CPU-specific registers already built-in. This allows you to access your special registers by name rather than having to remember their address. In addition to assigning names to the registers, bit fields within the registers may be defined as well, so that they too may be viewed or set by name. Register window views can be added to EDBICE as well so that you can conveniently view and edit the specific set of registers that are important in your debug session.
Follow these steps to create and use register definition files for your custom hardware:
1. Copy samples\sample.rd from your EDT package to the folder selected in the Configuration Files form (see Specify Your Configuration Files’ Location on page 19). You may also want to rename it.
2. Add your register details with any text editor as described in File Format below.
3. Use the following command to read your register definitions:
fr rd filename
To automatically read your register definition file, use this command in your custom initialization file (see Custom Initialization File on page 31).
File Format New register names are definable with the information below:
REG = reg_name offset space_name byte_size �SEQ first lastobj_inc �inc��
reg_name Is an ident giving the name of the register being defined.
offset Is a decimal number giving the register’s byte offset within the specified space. For real register spaces, the
MAJIC User’s Manual 0380-0163-10 Rev 2.01 23

3 Debug Environment
offset is the register number times the register size. For memory spaces, the offset is the byte address.
space_name Is one of the keywords from the list below giving the register file or memory space for the register.
byte_size �1�2�4�8� is the size of the register in bytes.
first Is a decimal number giving the first value to append to reg_name to form a sequence of names. Sequences make it easy to represent a consecutive set of like-named registers (e.g. r0��r31).
last Is the last number in the sequence (see first).
obj_inc Is a decimal number giving the amount to increment offset for each register in the sequence. This is usually the same value as byte_size, but may be larger in some cases.
inc Is a decimal number giving the amount by which to increment the register number for each name in the sequence. If not specified, the default is 1.
For example: Let’s say we want to have a sequence of 4 byte-size registers mapped to physical memory at 0, with each register in the low byte of successive machine words (32 bits). If the designer chooses to name these registers z1, z3, z5, ..., then the definition would be:
REG=z 0x0 MEMORY_P 1 SEQ 1 7 4 2
Registers can also be broken down into displayable fields. Any previously defined register or register sequence can be set up as field encoded. Note that if a field breakdown is given for a register sequence, the fields apply to every register in the sequence. Fields of more than one bit are displayed as field_name=hexadecimal_value. One bit fields are displayed as a uppercase or lowercase field_name where uppercase means a TRUE or 1 value.
REG_FIELD = reg_name field_spec �, field_spec�reg_name Is an alphabetic name previously defined via a REG
statement. Note that for sequence registers a full sequence register name must be given (including the number).
field_spec field_name high_bit low_bit �, field_spec�field_name Is an ident giving the name of the field.
high_bit Is a decimal number in the bit range of the given register. Must be >= low_bit.
low_bit Is a decimal number in the bit range of the given register. Must be <= high_bit.
EDB also supports adding addition register window types (panes): A window definition is simply a list of register name pairs. All the registers logically contained between, and including the two referenced registers, are included in the list. Registers within the window are logically broken down into groups based on
24 0380-0163-10 Rev 2.01 MAJIC User’s Manual

Debug Environment 3
the name. Sequence registers are displayed in groups with wrapping occurring at the right screen edge. Registers with field symbol definitions always display one per line. The only supported display format for registers is hex.
REG_WINDOW_CLASS = class_name reg_list �, reg_list�class_name Is an alphabetic name.
reg_list �reg_name reg_name���, reg_list�
reg_name Is an alphabetic name previously defined via a REG statement. Note that for sequence registers, a full sequence register name must be given (including the number).
NOTE: Include files are supported to allow common processor elements to be placed in one file. The INCLUDE command (shown below) begins reading from the referenced file and returns to the calling file when done. Nested include files are allowed.
INCLUDE “filename”
Predefined Spaces for ARM and XScale
Space Name Description
MEMORY_V Virtual Memory
MEMORY_P Physical Memory
CRNT General Registers r0 - r15
USER User/System mode registers
SVC Supervisor mode registers
IRQ Interrupt mode registers
FIQ Fast Interrupt mode registers
ABORT Abort mode registers
UNDEF Undefined exception mode registers
STATUS cpsr, spsr {svc, abort, undef, irq, fiq}
COPROC0 CoProcessor 0 registers
COPROC1 CoProcessor 1 registers
COPROC2 CoProcessor 2 registers
COPROC3 CoProcessor 3 registers
COPROC4 CoProcessor 4 registers
COPROC5 CoProcessor 5 registers
COPROC6 CoProcessor 6 registers
COPROC7 CoProcessor 7 registers
i
MAJIC User’s Manual 0380-0163-10 Rev 2.01 25

3 Debug Environment
Predefined Spaces for MIPS
Sample Register Definition file
The example below demonstrates a definition for some memory mapped registers (common in hardware designs).
COPROC8 CoProcessor 8 registers
COPROC9 CoProcessor 9 registers
COPROC10 CoProcessor 10 registers
COPROC11 CoProcessor 11 registers
COPROC12 CoProcessor 12 registers
COPROC13 CoProcessor 13 registers
COPROC14 CoProcessor 14 registers
COPROC15 CoProcessor 15 registers
Space Name Description
MEMORY_V Virtual Memory
MEMORY_P Physical Memory
GR General Registers r0 - r31
MR mdhi, mdlo
CP0_CTL Some newer MIPS32 chips use this space
CP0_GEN Coprocessor control register (cause, sr, etc)
CP1_CTL floating point control
CP1_GEN floating point
CP2_CTL CP2 Typically not used
CP2_GEN CP2 Typically not used
CP3_CTL Mips I/II architecture chips only
CP3_GEN Mips I/II architecture chips only
ICT Instruction Cache tags
DCT Data Cache tags
TLB TLB registers 0..?
LX Lexra CP0 registers
Space Name Description
26 0380-0163-10 Rev 2.01 MAJIC User’s Manual
Debug Environment 3
Configuration with MONICE
When MONICE is started, it automatically reads the register definition file and startice.cmd to initialize MONICE and the MAJIC probe.
You may also set certain configuration options via command line switches, or specify additional command files to run on the MONICE invocation line. See MONICE Command Line on page 169 for more information.
Configuration with EDBICE
EDBICE uses four initialization command files for different types of setup information, as shown below.
The initialization files are:
cdb.rc This file is a simple EDB command file (a text file of EDB commands) that is always loaded by EDB at startup. Users do not typically need to modify this file. EPI supplies a default cdb.rc file in the bin directory, which reads startice.cmd.
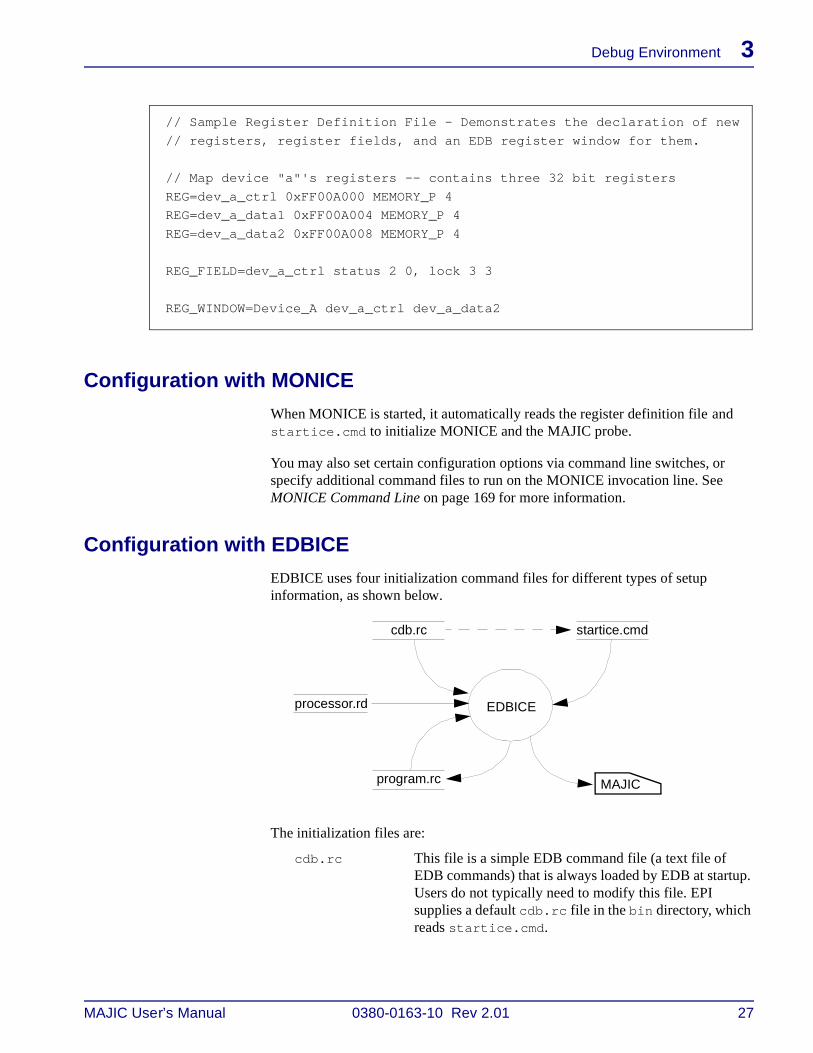
// Sample Register Definition File - Demonstrates the declaration of new
// registers, register fields, and an EDB register window for them.
// Map device "a"'s registers -- contains three 32 bit registers
REG=dev_a_ctrl 0xFF00A000 MEMORY_P 4
REG=dev_a_data1 0xFF00A004 MEMORY_P 4
REG=dev_a_data2 0xFF00A008 MEMORY_P 4
REG_FIELD=dev_a_ctrl status 2 0, lock 3 3
REG_WINDOW=Device_A dev_a_ctrl dev_a_data2
startice.cmd
program.rc
cdb.rc
EDBICEprocessor.rd
MAJIC
MAJIC User’s Manual 0380-0163-10 Rev 2.01 27

3 Debug Environment
startice.cmd This file contains initialization commands for configuring the MAJIC probe. It is read via a command in cdb.rc when EDBICE is started. (See Startice Command File on page 23.)
program.rc Contains program-specific EDB configuration information, including the program sections to download and the breakpoint list. This file is read when you choose the program to debug through the File menu, and can be saved with the File/Save Session menu, or by clicking Yes when prompted upon exiting EDBICE.
processor.rd The register definition file for the selected processor. (See Register Definition File on page 23.)
Configuration with Tornado
When the Tornado development environment loads the EPI Wind River Back-End (epiwrbe.dll), the library automatically reads the startice.cmd file and the register definition file.
Configuration with Other Debuggers
The following figure shows the configuration process when using a third-party debugger with an EPI debug library such as eXDI, MDI, or RDI. For additional information, please refer to the user manual for your third-party debugger, and corresponding EPI debug library user manual.
The initialization files are:
processor.rd The register definition file for the selected processor. (See Register Definition File on page 23.)
Configuration file This file is either rdimajic.cfg for RDI, or epimdi.cfg for MDI and eXDI. The configuration file specifies the MAJIC probe communication parameters,
Configuration
EPI Library
Filestartice.cmd
DebuggerMAJIC
processor.rd
28 0380-0163-10 Rev 2.01 MAJIC User’s Manual

Debug Environment 3
CPU type, and the name (and optionally the location) of the startice.cmd file.
NOTE: Sample configuration files are included in the EDT software package that comes with the MAJIC probe. However, it is usually best to build a custom configuration file with the MAJIC Setup Wizard.
startice.cmd This file contains initialization commands for configuring the MAJIC probe. See Startice Command File on page 23.
Configuring AXD for RealMonitor through RDIMAJIC
The debugger side of RealMonitor is implemented as a DLL, which connects to the MAJIC probe through the RDIMAJIC.DLL.
From within AXD, this configuration is selected as follows:
1. From the Options menu, select Configure Interface to open the Configure Interface dialog, shown below.
With the General tab selected, the Target connection box allows you to select either:
NOHALT keep everything (foreground task and interrupts) running.
HALT halt the foreground task, but leave interrupts running.
2. From the Options menu, select Configure target to open the Choose Target dialog, shown below:
i
MAJIC User’s Manual 0380-0163-10 Rev 2.01 29

3 Debug Environment
Select RealMonitor as the target environment. Once RealMonitor is selected, click on the Configure button to open the a second dialog, RealMonitor Configuration, shown below. (This dialog allows you to choose RDIMajic.dll as the JTAG Controller.)
There is no need to click on the Configure button in the RealMonitor Configuration box, as that opens the RDIMAJIC configuration, which should already be set up by the RDIMajic.cfg file.
3. Now, click on the OK buttons in each of the dialog boxes to accept the new configuration.
After this is done, AXD will attempt to connect to the target, but this will fail because the target does not yet have RealMonitor loaded (BUT - Do not do this step after RealMonitor is loaded, because if AXD is configured to connect to the MAJIC probe, this will cause RealMonitor to stop.
Advanced MAJIC Probe ConfigurationThe MAJIC probe offers a number of advanced options that are not addressed by the setup wizard because most users don’t need to modify them. However, if you have a complex target or want to fine tune your debug environment, you can
30 0380-0163-10 Rev 2.01 MAJIC User’s Manual

Debug Environment 3
provide your own initialization script file. This section discusses the commands for setting options that are not directly supported by the MAJIC Setup Wizard.
Custom Initialization File
When a new startice.cmd file is created with the MAJIC Setup Wizard, the Target Interface Properties form allows you to include a custom initialization file by checking Use a Custom Initialization File, and providing the file name in the field provided (shown in the figure on page 20). If you choose this option, the wizard creates a command alias named USER_INIT which reads the selected file, and then uses that alias to run your file. You can re-run the command file at any time by entering the USER_INIT command.
Examples:
The following example is an excerpt from the startice.cmd file that is created by the wizard.
Your command file should use MON commands only, excluding run control commands. Typically, only EO and MC commands are used, but it may be desirable to initialize your memory controller or MMU with EW commands, as in the following example. See Chapter 5, MON Command Language, on page 71 for descriptions of the debug monitor commands.
This example is a sample custom initialization file.
ea USER_INIT fr c MyFile.cmd // USER_INIT reads MyFile.cmd // command file
USER_INIT // Run initialization command file
MAJIC User’s Manual 0380-0163-10 Rev 2.01 31

3 Debug Environment
NOTE: Empty lines in a command file are equivalent to hitting <Enter> at the debugger prompt. That is, they may cause the previous command to be repeated, if it is a “repeatable” command such as Display. Use comment lines instead of blank lines to improve readability in command files without this side effect.
Configuration Options
Many operating parameters of the debug environment are set through configuration options. Some of the configuration options control the behavior of the MAJIC probe, some describe aspects of the target system, and some control the debugger user interface.
NOTE: Appendix B, Configuration Options, on page 159 provides a comprehensive list of all the configuration options. In addition, many are more fully explained in Chapter 4, MAJIC Probe Debug Services, on page 39.
Setting Configuration Options
Configuration options can be set with the EDB Option Settings dialog, or with the EO command. The value assigned depends on the specific option: some require a number, and some require a keyword.
Configuration options can be referred to by their full name, or an abbreviation comprised of the first character from each part of its name. For example, Reset_Address and Ice_Jtag_Clock_Freq can be referred to as ra and ijcf, respectively.
Some examples are listed below (refer to Appendix B, Configuration Options, on page 159 for details):
dv "Reading MyFile.cmd file\n"
fr rd MyRegDef.rd // Read my register definition file//// MAJIC Probe Settings//
eo semi_hosting_enabled = on
mc ffff0000:p ffffffff:p, pwd, jam // enable access to MEMCTL// regs
//// Memory Controller Initialization//
ew MEMADDR = 14000000 // base address
ew MEMCFG = 4dca // config settings
ew MEMCTL = 8000 // CS enable//
dv "finished reading MyFile.cmd file\n"
i
i
32 0380-0163-10 Rev 2.01 MAJIC User’s Manual
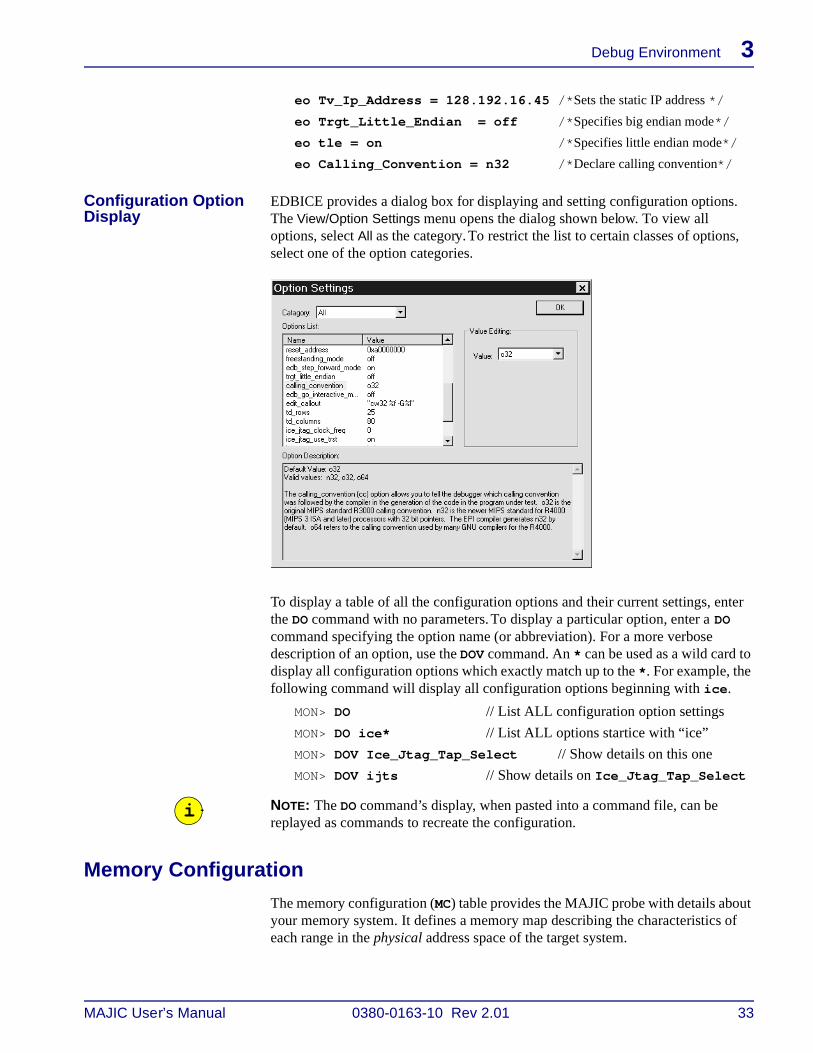
Debug Environment 3
eo Tv_Ip_Address = 128.192.16.45 /*Sets the static IP address */
eo Trgt_Little_Endian = off /*Specifies big endian mode*/
eo tle = on /*Specifies little endian mode*/
eo Calling_Convention = n32 /*Declare calling convention*/
Configuration Option Display
EDBICE provides a dialog box for displaying and setting configuration options. The View/Option Settings menu opens the dialog shown below. To view all options, select All as the category. To restrict the list to certain classes of options, select one of the option categories.
To display a table of all the configuration options and their current settings, enter the DO command with no parameters. To display a particular option, enter a DO command specifying the option name (or abbreviation). For a more verbose description of an option, use the DOV command. An * can be used as a wild card to display all configuration options which exactly match up to the *. For example, the following command will display all configuration options beginning with ice.
MON> DO // List ALL configuration option settings
MON> DO ice* // List ALL options startice with “ice”
MON> DOV Ice_Jtag_Tap_Select // Show details on this one
MON> DOV ijts // Show details on Ice_Jtag_Tap_Select
NOTE: The DO command’s display, when pasted into a command file, can be replayed as commands to recreate the configuration.
Memory Configuration
The memory configuration (MC) table provides the MAJIC probe with details about your memory system. It defines a memory map describing the characteristics of each range in the physical address space of the target system.
i
MAJIC User’s Manual 0380-0163-10 Rev 2.01 33

3 Debug Environment
MC Display The MC table can be displayed with the MC command. An MC command with no parameters displays the entire memory configuration table. An MC command with an address range but no attribute specifiers will display that part of the table.
The following figure shows the memory configuration table in the Session window:
NOTE: The MC display, when pasted into a command file, can be replayed as commands to recreate the table.
MC Attributes Table
i
Attribute Valid Settings Description
Access Method
JAM, DMA, INV
The MAJIC probe can always access memory by jamming instructions. On some processors, it may be able to use DMA, which is considerably faster. Memory regions may also be flagged as invalid in the MC table; the MAJIC probe will never attempt to access an address flagged as invalid, although it cannot prevent your code from attempting to do so.
Partial Word Access
PWD, PWE The MAJIC probe may be set to enable (PWE) or disable (PWD) partial word accesses at particular address regions. This specifies whether the MAJIC probe may perform accesses that are narrower than the actual bus width, as specified with the DW=n setting for that range.
When the MAJIC probe attempts to read a partial word from an address where partial word access is disabled, it will first read a data-width-sized word, then extract the desired part. For writes, it will perform a read-modify-write operation. This is optimized such that one command to read several bytes in the same word only accesses the target once, and writing several bytes to the same word performs one read and one write.
34 0380-0163-10 Rev 2.01 MAJIC User’s Manual

Debug Environment 3
Setting MC Attributes The MC command can be used to set an individual attribute, or multiple attributes, for the specified memory region. When an MC command is entered, only those attributes specified in the command are changed. All other attributes remain unaffected.
Before you can set up the memory configuration table, you need to become familiar with your system’s actual physical memory map. Specifically:
• Where is your ROM, and how big is it?
• Where is your RAM, and how big is it?
• What peripherals do you have, where are they mapped, and are they byte accessible?
• What other memory mapped resources are there, and how are they accessed?
Once you have a concise representation of your own memory system, entering it into the MAJIC probe memory configuration table is easy. Just create a text file with the appropriate MC commands, and then select it as your custom initialization file in the Setup Wizard (see Custom Initialization File on page 31).
Examples:
MC *:P,INV /* Flag all physical memory as invalid */
MC 0:P FFFFFF:P,DMA /* Set first 16MB to DMA access */
MC 10000000:P 1000FFFF:P,JAM /* Select JAM mode for this range */
MC *:P, PWE /* Enable partial word access for all physical memory */
MC 10000000:P 1000FFFF:P,PWD /* Disable partial word access forselected range */
MC 0:P FFFFF:P, RO, DW=8 /* First Meg is 8-bit read-only */
NOTES:
• Because the MC table describes your physical memory environment, physical addresses must be used when setting MC attributes. Physical addresses are specified by appending :P to the address value.
Read-Only RO, RW This flag controls whether MAJIC is allowed to write to the memory range. When set to RO mode, MAJIC may read from memory within the range, but will never write within the range. In RW mode, MAJIC may read or write within the range.
Data Width DW=8, DW=16, DW=32, DW=64
This option defines the maximum size data transfer that MAJIC can perform in the given range. Access requests that are wider than this setting are performed by reading or writing a block of data-width-sized objects. This option also controls the transfer size used by MAJIC in PWD mode transfers.
Attribute Valid Settings Description
i
MAJIC User’s Manual 0380-0163-10 Rev 2.01 35

3 Debug Environment
• As MC commands are read or entered, MAJIC probe collates the input ranges into one map, spanning the entire address space, with no holes or overlaps.
Sample MC Table Suppose your memory model consists of the following regions:
• 512k of read-only flash memory at 0x1FC00000 in the physical memory space.
• 1MB of RAM starting at address 0 in the physical memory space.
• 256k of internal scratchpad RAM at 0x10000000 in the physical memory space.
• Peripherals are located at 0x18000000 in the physical memory space, and do not support byte writes.
Let us further suppose that the processor you are using supports DMA to external memory, but not to internal scratchpad RAM, and that you would like to prevent inadvertent accesses (by the MAJIC probe) to invalid memory regions. The following memory configuration commands would describe such a system:
MC *:P, INV /* Invalidate all memory, first */
MC 00000000:P 000FFFFF:P, DMA, PWE /* DRAM */
MC 10000000:P 1003FFFF:P, JAM, PWE /* Scratchpad RAM*/
MC 18000000:P 18FFFFFF:P, DMA, PWD /* Peripherals */
MC 1FC00000:P 1FC7FFFF:P, DMA, PWD, RO /* Flash */
The first line defines all memory as invalid. This prevents the MAJIC probe from attempting to accesses any address in that region (although it cannot prevent your program from doing so, while it is running).
The second line sets a 1MB region, starting at 0, which may be accessed by DMA, and supports partial word accesses (PWE). This area is no longer restricted.
The third line represents the internal scratchpad RAM, which must be accessed by jamming load and store instructions (JAM), since DMA is not supported; partial word accesses are enabled (PWE) in this area.
The peripheral area is shown on line 4; since the peripherals in this example are on the external bus, DMA may be used to access them. However, partial word accesses are disabled (PWD), since these hypothetical peripherals do not support byte writes.
The boot ROM is shown on line 5; DMA is enabled, since it is on the external bus, and partial word accesses are disabled (PWD). This range is also marked as read-only (RO), because flash is not directly writable.
The memory configuration commands would result in the following memory configuration table:
36 0380-0163-10 Rev 2.01 MAJIC User’s Manual

Debug Environment 3
NOTE: The MAJIC probe may coerce the settings of certain memory ranges to meet access method restrictions imposed by the target processor. For example, internal memory mapped registers might not be accessible via DMA, so the MAJIC probe will always keep such known areas set to JAM mode.
i
MAJIC User’s Manual 0380-0163-10 Rev 2.01 37

3 Debug Environment
38 0380-0163-10 Rev 2.01 MAJIC User’s Manual

MAJIC User’s Manual 0380-0163-10 Rev 2.01
4
MAJIC Probe Debug ServicesThe MAJIC Intelligent Debug Probe development environment provides a rich set of debug services for debugging both hardware and software, and for running automated test suites. This chapter provides technical details on the debug services provided by the MAJIC probe:
• Initialization and Management of the JTAG interface
• Resetting the processor and/or target system.
• Reading and writing memory and memory mapped registers.
• Assembling and disassembling code in memory.
• Using the MAJIC probe’s built-in memory test and native MT sample program.
• Downloading, stepping through, and executing programs.
• Software and hardware breakpoints.
• Command aliases, debugger local variables, and a powerful command file language allow for building simple or sophisticated test scripts, or creating user-defined commands.
This chapter also provides examples for each of these features using the MON command language. The way the MON command language is presented and the extent of MON support depends on the debug environment. For full details on the MON command language, see Chapter 5, MON Command Language, on page 71.
Source-level debuggers implement a high-level debug environment utilizing the MAJIC probe’s debug services. However, not all source-level debuggers implement all the same features, in all the same ways. Refer to your debugger documentation for information on its interface to the MAJIC probe.
NOTE: Before attempting to use the MAJIC probe with your target board, you must take steps to configure it. This process is described in Chapter 3, Debug Environment, on page 15.
i
39

4 MAJIC Probe Debug Services
JTAG InterfaceThe MAJIC probe performs debug services by using the target processor’s JTAG interface to access registers within its Debug Support Unit (DSU). This section explains the fundamentals of how the MAJIC probe operates the JTAG scan chain.
NOTE: Additional information on this topic is available in the MAJIC Support for Multi-TAP JTAG Configurations application note (0380-0243-10), available on the EPI web site.
Target Power Management
The MAJIC probe supports targets that operate over a range of voltage levels. To do this, it samples the target’s voltage level and recreates that level for its output drivers. It also sets the threshold levels for receiving signals from the target. The MAJIC probe expects the selected signal to be pulled up to the I/O voltage of the target board.
The MAJIC probe monitors a user-selected target signal to determine when the target system is powered up or down (see Ice_Power_Sense on page 162).The hardware monitors the level on the selected signal to determine when the target has been powered up; when the MAJIC probe thinks there is no power, it disables its target interface output buffers to prevent damage or latch up possibilities. After software detects that power has been applied, it enables the MAJIC probe’s output drivers. The CONNECT LED indicates what state the target interface is in (red=disabled, green=enabled).
If the debug connector on your board has a dedicated pin for this purpose, then it should be used for sensing power by setting the Ice_Power_Sense option to VREF.
The MIPS/EJTAG 2.0 specification recommends the RST* pin for power detection, but if that pin is not provided on your target board, or it is not properly pulled up, you may use the TRST* pin instead.
The Ice_Power_Sense option may be set to off to disconnect from the target. When it is re-enabled, the JTAG initialization process will repeat.
NOTE: For details on the target connector, refer to the MAJIC Interface Guidelines application note for your processor.
JTAG Initialization
When the MAJIC probe detects target power, it resets and initializes the JTAG interface. This happens when Ice_Power_Sense is changed from off to a signal with a voltage level that is within the MAJIC probe’s supported voltage range, or when Ice_Power_Sense is already enabled and the target board is powered up.
i
i
40 0380-0163-10 Rev 2.01 MAJIC User’s Manual

MAJIC Probe Debug Services 4
JTAG Reset The MAJIC probe resets the JTAG interface in one of two ways, depending on the Ice_Jtag_Use_Trst option. If enabled, the MAJIC probe resets the JTAG interface by asserting the TRST* pin on the JTAG connector. If disabled, the MAJIC probe resets the JTAG interface by keeping TMS high for 5 consecutive TCK cycles. In general, if your target board supports the TRST* pin, EPI recommends that you use it.
NOTE: EPI recommends that the TRST* pin and the system reset pin be managed separately on the target board. If your target board asserts TRST* when system reset is asserted, then you must select the Trgt_Resets_Jtag option so that the MAJIC probe will expect it.
JTAG Chain Dimensions
The JTAG initialization process includes several steps. First, the MAJIC probe must determine how many Test Access Ports (TAPs) are connected on the JTAG scan chain. It also has to discover how many bits are in the Instruction Register of each TAP. Usually the MAJIC probe can learn this on its own by scanning a test pattern through the chain, but if the MAJIC probe reports that the automatic JTAG detection process failed, then you may need to declare the JTAG configuration of your board.
When necessary, you can declare the number of TAPs on the JTAG scan chain, and number of instruction register bits in each, by writing a descriptor to the MAJIC_JTAG_DIMENSION buffer (within the MAJIC probe). The first word in the descriptor specifies the number of TAPs in the JTAG chain and hence the number of words to follow in the descriptor. The remaining words are the number of bits in each TAP’s instruction register. Note that TAPs are numbered starting from the one whose TDO signal is connected to the MAJIC probe.
For example, if your system has three TAPs, the first with 38 instruction bits, the second with 4, and third with 8, you could declare the JTAG parameters by setting the MAJIC_JTAG_DIMENSION descriptor as follows:
ew MAJIC_JTAG_DIMENSION = 3, 0n38, 4, 8
NOTE: If the MAJIC_JTAG_DIMENSION descriptor is required, it must be set before the target power monitor senses target voltage. Therefore, you should select off for Ice_Power_Sense in the MAJIC Setup Wizard, and read a custom initialization file (see Specify Your Configuration Files’ Location on page 19). Your custom initialization file should set the MAJIC_JTAG_DIMENSION buffer first, then finally set the Ice_Power_Sense option, as in the following example.
Example:
i
i
FR RD MAJIC /* Register Definition file for MAJIC probe registers */
EW MAJIC_JTAG_DIMENSION = 3,0n38,4,8 /* Set JTAG Dimension descriptor */
EO Ice_Power_Sense = VREF /* Enable power monitor */
MAJIC User’s Manual 0380-0163-10 Rev 2.01 41

4 MAJIC Probe Debug Services
User JTAG Initialization
Some target systems require a special initialization sequence. For example, it may be necessary to enable the debug support unit of a given device before the MAJIC probe attempts to access it. Or if an SoC incorporates a hierarchical TAP organization, it may be necessary to reconfigure the JTAG connection within the device to make the processor’s DSU accessible.
When necessary, you can provide such initialization sequences by writing a descriptor to one of two initialization buffers. The MAJIC_JTAG_INIT0 descriptor, if set, will be used as the first JTAG operation after each JTAG reset. This descriptor must be used if the operation will change the organization of the JTAG chain. The MAJIC_JTAG_INIT1 descriptor, if set, will be used as the first JTAG operation after the JTAG chain dimensions are determined. This descriptor should be used if the operation does not change the JTAG chain dimensions. It is possible to use both.
The User JTAG Initialization descriptor consists of the number of IR bits to scan, then the IR bits themselves, then the number of data bits to scan, then finally the data bits. Note that this describes an entire JTAG operation, so it must take all TAPs in the chain into account.
For example, the following command describes a JTAG operation with 11 instruction bits whose values are 111_1101_1111, and 64 data bits that are all zeros.
ew MAJIC_JTAG_INIT1 = 0n11, 0x7DF, 0n64, 0, 0
NOTE: If a special JTAG initialization sequence is required, then it must be set before the target power monitor senses target power. Therefore, you should select off for Ice_Power_Sense in the MAJIC Setup Wizard, and read a custom initialization file (see Specify Your Configuration Files’ Location on page 19). Your custom initialization file should set the MAJIC_JTAG_INIT0 and/or MAJIC_JTAG_INIT1 descriptor first, then set the Ice_Power_Sense option, as in the following example.
Example:
TAP Selection Once the MAJIC probe knows how many TAPs there are, it needs to know which one corresponds to the processor under test. If there is only one TAP, then the answer is obvious, so the MAJIC probe simply connects to it automatically.
However, if there are multiple TAPs, then the MAJIC probe needs to know which one to use. The number of TAPs can be checked with the Ice_Jtag_Tap_Count option. The TAP is selected by setting the Ice_Jtag_Tap_Select option. This
i
FR RD MAJIC /* Register Definition file for MAJIC probe registers */
EW MAJIC_JTAG_INIT0 = 0n11,0x7DF,0n64,0,0 /* Set JTAG Init0buffer */
EW MAJIC_JTAG_INIT1 = 0n11,0x7DF,0n64,0,0 /* Set JTAG Init1buffer */
EO Ice_Power_Sense = VREF /* Enable power monitor */
42 0380-0163-10 Rev 2.01 MAJIC User’s Manual
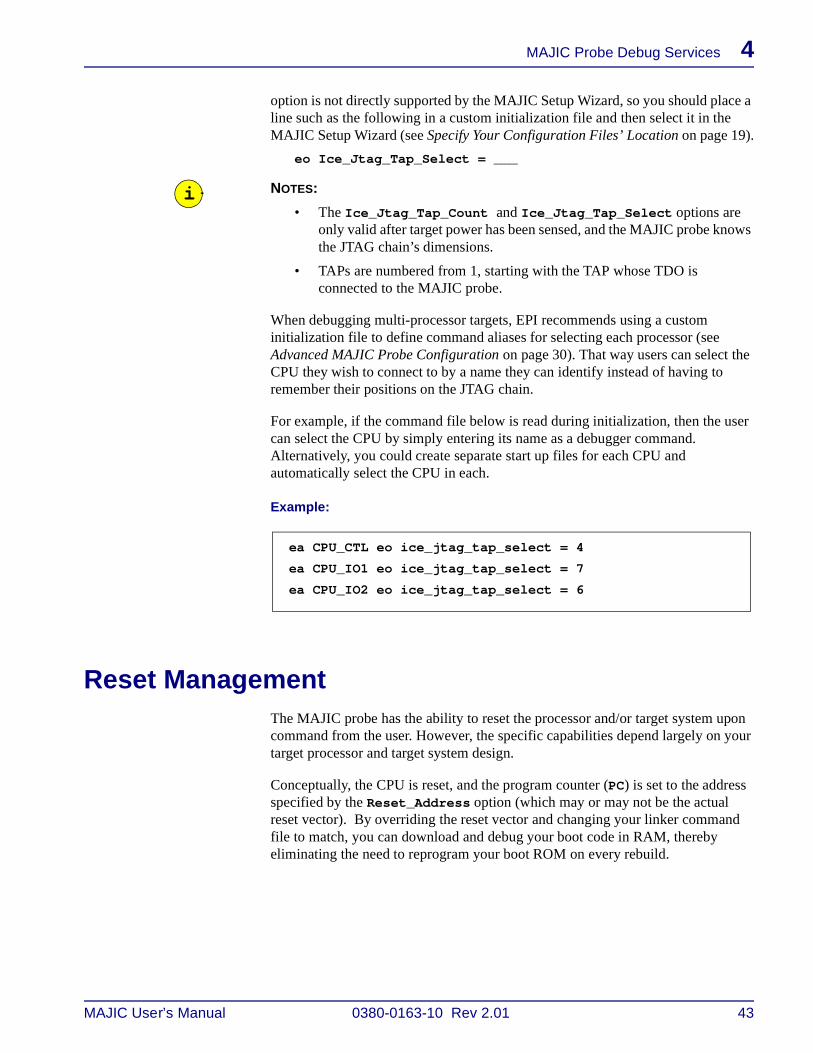
MAJIC Probe Debug Services 4
option is not directly supported by the MAJIC Setup Wizard, so you should place a line such as the following in a custom initialization file and then select it in the MAJIC Setup Wizard (see Specify Your Configuration Files’ Location on page 19).
eo Ice_Jtag_Tap_Select = ___
NOTES:
• The Ice_Jtag_Tap_Count and Ice_Jtag_Tap_Select options are only valid after target power has been sensed, and the MAJIC probe knows the JTAG chain’s dimensions.
• TAPs are numbered from 1, starting with the TAP whose TDO is connected to the MAJIC probe.
When debugging multi-processor targets, EPI recommends using a custom initialization file to define command aliases for selecting each processor (see Advanced MAJIC Probe Configuration on page 30). That way users can select the CPU they wish to connect to by a name they can identify instead of having to remember their positions on the JTAG chain.
For example, if the command file below is read during initialization, then the user can select the CPU by simply entering its name as a debugger command. Alternatively, you could create separate start up files for each CPU and automatically select the CPU in each.
Example:
Reset ManagementThe MAJIC probe has the ability to reset the processor and/or target system upon command from the user. However, the specific capabilities depend largely on your target processor and target system design.
Conceptually, the CPU is reset, and the program counter (PC) is set to the address specified by the Reset_Address option (which may or may not be the actual reset vector). By overriding the reset vector and changing your linker command file to match, you can download and debug your boot code in RAM, thereby eliminating the need to reprogram your boot ROM on every rebuild.
i
ea CPU_CTL eo ice_jtag_tap_select = 4
ea CPU_IO1 eo ice_jtag_tap_select = 7
ea CPU_IO2 eo ice_jtag_tap_select = 6
MAJIC User’s Manual 0380-0163-10 Rev 2.01 43

4 MAJIC Probe Debug Services
Reset Processor vs. Reset Target
The MAJIC probe provides two different reset functions: a processor reset, which is performed via a JTAG command, and a target system reset, which is performed by asserting the system reset signal on the JTAG cable (providing that the reset signal is implemented by the target system). In cases where the processor does not provide any means of reset via the JTAG port, the MAJIC probe will simulate a processor reset by setting those registers that are affected by a reset to their defined state.
The Ice_Reset_Output option controls whether the MAJIC probe performs a processor reset or target reset when a reset (R) command is issued, or when the program is downloaded. In addition, separate reset commands are provided to directly reset the processor (RP) or target system (RT).
NOTES:
• The target reset feature relies on support by your target system. Specifically, the system reset pin on the JTAG connector (not to be confused with TRST*) should be connected so as to reset the board, including the CPU. On processors with both hard and soft resets (or cold and warm resets), the soft or warm reset should be asserted.
• If the target system’s reset controller asserts the processor’s TRST* pin as well as the system reset pin, then the Trgt_Resets_Jtag option must be set (as described on page 167).
• After resetting the target system, it may be necessary to reinitialize your memory controller prior to accessing memory.
Resetting Internal Peripherals
When the MAJIC probe resets a MIPS/EJTAG processor with a JTAG command, it normally resets only the processor, not the internal peripherals. However, if the Ice_Reset_Peripheral option (described on page 162) is enabled, the MAJIC probe sets the EJTAG control bit to reset internal peripherals as well.
NOTE: This feature relies on support by the processor and target system design. This feature is not well defined in the EJTAG standard. Please check your processor documentation for information on how it implements the reset peripheral operation.
Accessing Memory and RegistersSource-level debuggers usually have various windows for viewing and editing the contents of registers and memory. The MAJIC probe services read and write requests from the debugger as the user works with those windows, just as it does for the MON examples in the following sections.
i
i
44 0380-0163-10 Rev 2.01 MAJIC User’s Manual

MAJIC Probe Debug Services 4
Display and Enter
To display or enter the contents of a CPU register, CoProcessor register, or memory location, MON provides the Display (D) and Enter (E) commands. These commands can be qualified by size, as follows:
The location for which a value is displayed or entered can be a register number or name, a virtual or physical memory address, or a symbolic name representing a memory address (see Address Expressions on page 48). After displaying a register, memory location, or range of either, simply pressing <ENTER> will advance the display.
An address range may be specified as a start address and end address, or as “start L count”. The format of the display or entered data (hexadecimal, ASCII, instructions, ...) can be controlled by appending “, fmt” to the command line, where fmt is a letter specifying the desired format (the format operand is described on page 131).
Examples:
dw sp /* Display stack pointer */
dw r0 r7 /* Display r0 through r7 */
dw 0 /* Display address 0 in virtual space */
dw 0:P /* Display address 0 in physical space */
dw 8000 L 40 /* Display 40 words starting at 0x8000 */
dw main L 10,i /* Display 10 instructions starting at main */
db @str_ptr,s /* Display string pointed to by str_ptr */
ew r8 = 816E /* Set r8 to 0x816E */
ew var = 0n1000 /* Set var to 1000 decimal*/
ew var,d = 1000 /* Set var to 1000 decimal*/
h addr /* Help on addresses */
h fmt /* Help on data formats*/
NOTE: The fmt operand is one exception to the general rule that commands are not case sensitive.
Command Name Modifier
DB EB Display/Enter Byte
DH EH Display/Enter Half-Word (16-bit)
DW EW Display/Enter Word (32-bit)
DD ED Display/Enter Double-Word (64-bit)
i
MAJIC User’s Manual 0380-0163-10 Rev 2.01 45

4 MAJIC Probe Debug Services
Bit Fields When a register containing bit fields is displayed in hexadecimal mode (which is the default display mode in MON), the value of each bit field is displayed as well. Single-bit fields in which the bit is set to 1 are displayed with their name in upper case, and Single-bit fields in which the bit is 0 are displayed with their name in lower case. Fields with more than one bit show the field name and value in hexadecimal. It is also possible to read and write bit fields directly by appending the field name to the register name.
Example:
NOTE: EPI debuggers and the MAJIC probe library for third party debuggers have built-in knowledge of the registers supported by each CPU type. You can also define register names and fields for registers that are unique to your own hardware through a register definition file. See Register Definition File on page 23 for details on how to define your own registers.
Interactive Mode If no data (or instruction) is provided in an Enter command, MON will display the first location and then prompt for the value to enter there, and then advance interactively as each datum is entered. This technique is particularly useful when poking instructions into memory (see MIPS Mini Assembler on page 47).
Entering a backslash (\) at this prompt leaves the current location unmodified, and backs up the display by one line. Entering a period (.) at this prompt exits interactive mode, and returns to normal command processing mode. If the enter command specified a range, as opposed to a single address, then interactive mode is automatically terminated when the end of the range is reached.
MON> dw cpsr // ARM7 Current Processor Status Register.cpsr 000000D3 (n z c v F I t mode=svc)
MON> dw cpsr.f // Display FIQ bit.cpsr.f 00000001
MON> dw sr // MIPS Status Register (display varies between CPU types).sr 00440000 (cu=0 re icd dcd BEV nmi cm SR isc im=0
swm=0 kuo ieo kup iep kuc iec)
MON> ew sr.im = 2 // Set IM field to 2MON> dw sr.im
.sr.im 00000002
i
46 0380-0163-10 Rev 2.01 MAJIC User’s Manual

MAJIC Probe Debug Services 4
Example:
MIPS Mini Assembler When the EW format qualifier “i” is specified, the mini-assembler is invoked. The mini-assembler supports all standard machine level instructions defined in the MIPS RISC Architecture manual, and some higher level macro instructions (as long as they assemble into one machine level instruction). The default number base for fields follows the MIPS conventions, which is often decimal, except on jump, branch and a few other instructions. The recommended approach is to use 0x in front of any hex constant and not rely on the default radix.
For the general registers, the mini-assembler accepts both the “hardware” names and “software” names, except that the names must not be preceded with a dot “.”. In addition, the standard MIPS $n notation is accepted. Coprocessor registers may only be referred to by their $n names, except for floating point registers which also accept the fn and dn notation.
The mini-assembler is not a full assembler in that it does not provide any directives, symbolic constants, macros and the like. But unlike the assemblers provided with most debuggers, the mini-assembler does support local statement labels and existing global symbols. Statement labels and global symbols can be used whenever a constant is called for.
Local statement labels take the form $Ln, where n is from one to five decimal digits having a value less than 32767. A statement label is defined when the label, followed by a colon, begins an instruction statement. References to the label do not include a colon, and may occur before or after the label is defined. Labels can be referenced in one invocation of the Enter command and defined in a later invocation, but they are not accessible outside the context of the mini-assembler.
Once defined, a label retains its value until the debug session is terminated. Re-definitions of an existing label are not allowed, even if the value is exactly the same. Until a label is defined, instructions that reference the label are assembled with the value zero.
NOTES:
• No warning is given if labels remain undefined when code execution is begun with the Step or Go commands.
• The mini-assembler does not currently support MIPS16 instructions.
MON> ew A0001234
a0001234: 00000000 ? 11223344
a0001238: 00000000 ? 5566788
a000123c: 00000000 ? \
a0001238: 05566788 ? 55667788
a000123c: 00000000 ? 12345678
a0001240: 00000000 ? .
MON> dw a0001234 L 4
a0001234: 11223344 55667788 12345678 00000000
i
MAJIC User’s Manual 0380-0163-10 Rev 2.01 47

4 MAJIC Probe Debug Services
Example:
Address Expressions
An Address Expression combines addresses using Address Operators (described on page 49). Parenthesized sub-expressions are allowed. An Address consists of an offset and optionally a space designator. An offset is a 32- or 64-bit value, giving the byte address of an object relative to the start of a space.
There are three classifications of addresses: external (memory mapped) addresses, register addresses, and “debugger local” addresses. External addresses reference data and instruction memory, or memory mapped devices. These addresses can include virtual address segments, and physical (main) memory. Register addresses reference the processor’s General Registers, Coprocessor Registers, and special registers. Refer to Debugger Local Variables on page 66 for a description of the debugger local address space.
NOTES:
• Hexadecimal is the default base for addresses. However, symbolic names take precedence over register names, which take precedence over address values, where ambiguity exists.
For example, DW a0 will display the symbol named a0, if there is one, or register a0, if there is no a0 symbol but there is an a0 register, or memory location a0 if it is not a symbol or register. Prepending 0x or a period eliminates this ambiguity: DW 0xa0 will display memory location a0, and .a0 will reference the register.
MON> ew 2000:1,i
a0002000: 000a0002 srl zero,t2,0
? j $L3000
a0002004: 004a0002 srl zero,t2,0
? lui r5, 0x1fc0
a0002008: 008a0002 srl zero,t2,0
? \
a0002004: 3c051fc0 lui a1,0x1fc0
? lui r5, 0xbfc0
a0002008: 008a0002 srl zero,t2,0
? jr r5
a000200c: 00ca0002 srl zero,t2,0
? $L3000: nop
a0002010: 010a0002 srl zero,t2,0
?
a0002014: 014a0002 srl zero,t2,0
? .
i
48 0380-0163-10 Rev 2.01 MAJIC User’s Manual

MAJIC Probe Debug Services 4
• The way the MAJIC probe accesses target memory is controlled by the Memory Configuration table. Setting this table to match your target system’s memory layout is covered in Setting MC Attributes on page 35.
ARM Addresses The ARM architecture defines a flat 32-bit address space. Therefore, a memory address is entered simply as a hexadecimal number. Physical addresses are specified by appending :P. ARM register names are given in the table in ARM Register Names on page 136.
Examples:
dw cpsr /* Display current processor status register */
dw 1234 L 10, i /* Display first 10 instructions from 1234 */
dw 1C00:P /* Display word at 1C00 in physical memory */
MIPS Addresses The MIPS architecture defines memory in terms of virtual address segments (for example kseg0 and kuseg) mapped into a common physical address space. Virtual addresses may be entered directly (e.g. 80000080), or as the offset within a segment (e.g. 80:0 is offset 80 in kseg0, which is 80000080). Physical addresses are specified by appending :P.
Registers may be referred to by their number, or conventional name (for example r31 or ra). For a listing of space designators see Address Space Designator on page 138. MIPS register names are given in the table in MIPS Register Names on page 135.
Examples:
dw sr /* Display status register */
dd 1C00:0 /* Display double word at offset 1C00 in kseg0 */
dw 1C00:P /* Display word at 1C00 in physical memory */
eh 1C00:1=1234 /* Enter 0x1234 at half-word 1C00 in kseg1 */
dw 0:r L 10, i /* Display first 10 instructions at the reset vector */
h addr /* Help on address expression syntax */
Address Operators In general, address expressions use standard C operators (described in Expression on page 129). However, the indirection operator is @, rather than the normal C operator *. This is because the operation is not exactly the same: @ means “fetch the address at”, so a full word or double word will always be fetched depending on the processor type. @.digit addr causes digit bytes (1, 2, 4, or 8) to be fetched from the specified address.
Examples:
main + 20 // Location 32 bytes after the symbol main.
@R2 // Location in memory whose virtual address is in R2.
@PC // Location of the next instruction to be executed. Indirection// through .PC is especially useful. The command // DW @PC L 10,i will disassemble the 10 instructions // beginning with the next instruction to be executed.
MAJIC User’s Manual 0380-0163-10 Rev 2.01 49

4 MAJIC Probe Debug Services
@.1SP // The byte at the stack pointer.
@RA // After reaching a breakpoint set at the start of a function,// G @RA could be used to continue execution until the // function returns to the caller.
@ptr // Virtual address pointed to by the value at the location // defined by the symbol ptr.
(@ptr+5*4) // ptr is a symbol that describes a location in some address// space. This expression fetches the word at that location and // adds 20 (decimal) to it.
(@ptr)|8 // Value at ptr or’ed with 8.
NOTE: All arithmetic and comparisons are performed in unsigned 64-bit integer mode, even if the operands appear signed. For instance, -1 is treated as the unsigned value 0xffffffffffffffff. This also means that the right shift operation always zero fills the high order bits.
Searching Memory
The display commands also serve as memory search commands, when a value list is appended. The search starts from either the start of the specified range, or the end, and displays the first match that it finds. Optionally, a mask value or pattern may be specified to compare only certain bits. Pressing <Enter> continues searching the original range from where it left off. Refer to Display/Find Data on page 81 for details on specifying search direction, search patterns, and masks.
Examples:
DB messages L 4096,s = ”ERROR” // search for ERROR starting at // messages.
DB messages L 4096,s = ”ERROR” #df // case insensitive search
DW 80000000 8000FFFF = 80000000 #f0000000// Find first word in 64K range with 8 in the upper // four bits. (Press <Enter> to find successive matches)
Moving Data
MON provides commands for moving data between target resources. The source data and destination address do not need to be in the same address space. For example, registers can be dumped to or loaded from memory by the Move command.
The data is normally copied forward from the starting addresses in the source and destination ranges, one type-sized piece at a time, with the predictable destructive effect if the source and destination overlap. A reverse move copies the data backwards from the ending address in the source and destination ranges. In this case an overlapping upward move will be non-destructive, while an overlapping downward move will be destructive.
i
50 0380-0163-10 Rev 2.01 MAJIC User’s Manual

MAJIC Probe Debug Services 4
Examples:
mw r0 r3, r4 // move registers r0..r3 to r4..r7.
mw 80001000 L 4, r1 // move four words from memory to // registers r1..r4.
mb 1000 10fe,1001 // fill 1001 through 10ff with byte from 1000.
mrb 1000 10fe,1001 // move-reverse, by byte, non-destructively.
Filling Memory and Registers
The Enter commands described in Display and Enter on page 45 are also used for filling memory and registers by providing an address range instead of a single address. If the address range is larger than the value list, a move operation is used to replicate the fill pattern as necessary to fill the range.
Examples:
EW r0 r7 = 0 // clear 8 registers
EW 0 fffff = 0 // clear 1MB of RAM
EB 1000 1FFF = 1,2,4,8 // fill range with pattern
Memory Test
The MAJIC probe provides a robust set of memory tests to verify the operation of the target memory system. A test may be repeated a set number of times, or loop continuously until stopped by the user, or optionally until an error is detected.
These tests are implemented by the MAJIC probe, and may be accessed with the MT command. They are also provided in a program named ntv_mt (native MT) which can be downloaded to, and run on the target system.
NOTE: The EDTM software for using the MAJIC probe with MIPS processors includes two versions of native MT in the samples directory, one linked in kseg0 and one in kseg1.
The MT command specifies address range, test, mode, and pass count (see Memory Test on page 113). Native MT prompts for the same information in the EDB program I/O window or MON command line.
There are four mode flags that control the operation of the memory test feature. In quiet mode, the normal end-of-pass messages (i.e. number of passes completed) are suppressed. In silent mode, all messages except the end-of-test message are suppressed. Verbose mode displays a status message identifying each test before it starts. If an error is detected in halt-on-error mode, the debugger asks the user if testing should be aborted. Memory test failure messages are displayed in halt-on-error mode, even if silent mode is also enabled.
Example:
H MT // Help on Memory Test syntax and options
MT ram_base ram_bound, 9, HV, 1
i
MAJIC User’s Manual 0380-0163-10 Rev 2.01 51

4 MAJIC Probe Debug Services
Basic Patterns Test #1 walks through the specified address range in ascending order, writing a test pattern to each location, and verifying that it was correctly written. Once the range has been filled and checked, the MAJIC probe makes another pass to check that the correct data is still present, then stores the one's compliment of the pattern and verifies that it was correctly written. Then the same range is tested in descending order.
The whole process is repeated for each of the following six patterns:
00000000 FFFFFFFF AAAAAAAA55555555 01234567 89ABCDEF
Walking Ones and Zeros
In test #2, the MAJIC probe starts by filling the requested memory range with 0. Then it performs a walking ones test on each location by writing and verifying a 1, then shifting left one bit to yield 2, and so on until the bit is shifted past bit 31. After all 33 patterns have been tested, FFFFFFFF is written, and the address is incremented. When the end of the range has been reached, another pass is made with a walking 0 pattern.
Rotating Address In test #3, the MAJIC probe fills the entire range, in ascending order, by writing the address of each location to itself. Then it reads and verifies the entire range. This is repeated eight times, with the values to be written being rotated by four more bits on each pass. Then the whole process is repeated in descending order.
Complimented Rotating Address
In test #4, the MAJIC probe fills the entire range, in ascending order, by writing the one's compliment of each address to that address. Then it reads and verifies the entire range. This is repeated eight times, with the complimented address values being rotated by four more bits on each pass. Then the whole process is repeated in descending order.
Partial Word Access Test #5 verifies byte and half word accessibility in the specified address range. Each word in the specified range is tested by writing 11, 22, 33, and 44 to the four bytes in that word, then reading the whole word and comparing it to 11223344. Then EEDDCCBB is written to the same word, and each byte is read back and verified. The half word test is similar: 1234 and 5678 are written, the word is read and checked, then EDCBA987 is written and both half words are verified.
NOTE: When reading a byte or half-word from an address where partial word access is inhibited (via the memory configuration command), the MAJIC probe reads a word and extracts the portion of interest. Similarly, when writing a byte or half-word to such an area, the MAJIC probe performs a read-modify-write accesses. Of course, the test will still pass if partial word access is not enabled, but partial word accessibility is not actually checked in this case.
Refresh In test #8, the MAJIC probe tests the data retention capability of the specified address range. First it fills and verifies the entire range with a test pattern. Then it waits the specified time period, and rechecks the range. This is repeated with each of the test patterns used in the basic patterns test.
i
52 0380-0163-10 Rev 2.01 MAJIC User’s Manual
MAJIC Probe Debug Services 4
Combination In test #9, the MAJIC probe cycles through the basic patterns test, walking bits test, rotating address test, complimented rotating address test, and partial word test.
Oscilloscope Loops Three memory access oscilloscope loops are provided: read (test #10), write (test #11), and write-then-read (test #12). The MAJIC probe loops through the specified address range, performing the memory accesses as fast as possible, without verifying the data. On the write only and write-then-read tests, the data pattern is complemented before each write access to help illuminate bus timing problems.
Program ExecutionEDBICE provides a better environment for debugging programs written in C, but MONICE can also download and debug such programs. Although MONICE is not source code aware, it does provide symbols for global functions and variables, and can display a call stack summary if execution stops within a C context.
Downloading Executable Programs
The details of downloading a program vary widely depending on which debugger you are using. The following sections explain how to download a program executable (ELF or COFF file), a binary memory image file, and an S-Record file with MONICE and EDBICE.
If you are using another debugger, please refer to the documentation that came with that debugger for information on how to download files in that environment.
ELF and COFF Files The download process normally starts with a reset operation (see Reset Processor vs. Reset Target on page 44), and then the current execute location (PC) is set to the user configurable value in the Reset_Address option. This is because it is usually desirable to start from the reset vector (real or overridden via Reset_Address) after a program download. However, it is possible to inhibit the reset operation by turning off the Reset_At_Load option, for cases where reset is not desirable.
Then the program image is downloaded to target memory. Lastly, if the Load_Entry_Pc option is enabled and the program executable provides an entry point indication (usually set by the linker), then the PC will be set automatically to the program’s entry point.
Downloading with EDBICE
In EDBICE, the Program to Debug selection in the File menu is used to select the program to debug. It is important to note, however, that the program is not actually downloaded at this time. Only the symbolic information is read.
NOTE: When you select the application program, EDBICE runs the cdbtrans utility to convert the application’s debug information from your native compiler’s debug format into the format EDBICE uses. This data is stored in the file created by taking the base-name of your application program and adding .cdb. Once this
i
MAJIC User’s Manual 0380-0163-10 Rev 2.01 53
4 MAJIC Probe Debug Services
file is created, the conversion step is not done again until your application program changes.
The download operation is performed when the Load button is pressed, or the first time you step or start execution. The download operation is repeated on the first GO or single step after hitting the Restart button or selecting a different program. The section types to download can be selected in the Edit/Properties menu. To verify the downloaded image integrity, use the Exec menu and choose Verify Load.
Downloading with MONICE
The L (Load) command initiates the download process, as described in ELF and COFF Files on page 53. Normally all program sections are downloaded, but specific section types can be downloaded or omitted with switches on the L command line (see Load on page 109).
The VL (Verify Load) command is used to verify a program load. When no arguments are specified, all sections of all files previously downloaded are uploaded and checked against the original executable files. Optionally, you can verify only selected section types (see Verify Load on page 122).
The LN (Load Names) command reloads symbols for the current program, or loads symbols for the specified files. The new symbols will replace any existing symbols by default, or they can be added to the existing symbols.
Examples:
L my_prog // load my_progVL // verify download, all sectionsVL -o tl // verify only text and literal sectionsLN new_prog // load symbols from new_prog
NOTES:
• The L, VL, and LN commands are not available in EDBICE. Instead, programs are downloaded as described in Downloading with EDBICE on page 53.
• The load commands are available in EPI’s debugger libraries, but in general it is best to use the program download service provided by your debugger. However, it may be useful to use the LN command so the MON environment has access to symbolic information, and in certain cases it may be better to download from the EPI library instead of the third party debugger.
Hex and Binary Files It is also possible to download binary images or S records with the FR M (File Read, Memory) command, or save a memory range to a binary file with FW M (File Write, Memory).
Examples:
fr m file.hex // load a hex file into addresses embedded// therein
fr m file.bin 1000 // load a binary image starting at 1000fw m file2.bin 0 3fff // write a 16K image from address 0 to
// the file file2.bin
i
54 0380-0163-10 Rev 2.01 MAJIC User’s Manual

MAJIC Probe Debug Services 4
NOTES: The FR M command does NOT initiate the download process described above, it just performs the series of write operations required to transfer the file contents into memory. There is no way to verify a download of this type, except to use FW M to create a temporary file and then use a file compare utility.
Download Performance
The MAJIC probe is optimized to sustain a very high transfer rate between the host computer and target system, but to realize the maximum possible download rate, you need to do your part. When working with a large program file, consider the following:
• Choose the fastest communication method available. If that is a serial port, use the highest baud rate you can.
• Download only those sections that you actually need to, especially when reloading the program (select Program Options from the Edit/Properties menu). By adding a BSS clearing loop to your boot module (typical in the ARM environment), you can avoid downloading that section.
• Make sure to select the highest JTAG clock rate supported by your target processor (see Ice_Jtag_Clock_Freq option, described on page 161).
• If your processor supports DMA via the JTAG port, make sure the MAJIC probe is set to use it wherever possible (see Memory Configuration on page 33).
• The EPI linker can compress specified sections, and add a decompression function to your boot code. Taking advantage of this feature will reduce download times.
Single Stepping
Single stepping is the process of executing one instruction at a time, so that the state of the system can be examined after each instruction. Depending on the capabilities of the processor’s debug support unit, the MAJIC probe can use either of two techniques for the basic stepping mechanism. If the processor provides hardware for single stepping, the MAJIC probe will take advantage of that. Otherwise the MAJIC probe predicts the next address, sets a breakpoint there, and executes to it. Then it builds upon the basic step function to support the various stepping features described below.
NOTES:
• The behavior when stepping in a source-level debugger depends on how the debugger implements its step functions. Refer to your debugger’s documentation for information on how it implements its stepping features.
• During single stepping, the pipelined effect of instruction execution is defeated. That is, each instruction is fully executed in isolation before proceeding to the next.
• When a MIPS branch instruction which has a delay slot is stepped, the delay slot instruction is also executed as part of the step; either advancing to the branch destination, or if it was a conditional branch that was not taken, the next sequential address following the delay slot.
i
i
MAJIC User’s Manual 0380-0163-10 Rev 2.01 55

4 MAJIC Probe Debug Services
Source Stepping with EDB
Regardless of the execution window’s display mode (source, assembly, or both), EDBICE provides both source-level stepping and instruction level stepping, into and over function calls. This makes it possible, for example, to display source code interleaved with assembly, but step by source line. The execution toolbar provides separate buttons for each step mode.
The way that interrupts and exceptions are managed while stepping can be altered for different debug situations. The Edb_Step_Forward_Mode option selects between stepping into exceptions or stepping over exceptions (referred to as step forward mode). If an exception is raised during a step forward operation, the entire exception handler is executed as part of the step, unless a breakpoint is hit along the way. Use the Option Settings button on the main tool bar to set this option.
NOTES:
• In some cases, EDB uses breakpoints to perform single stepping. When stepping through ROM with such a processor, one or more hardware breakpoints must be available in order to step.
• The first time execution is started or stepped after selecting the program to debug or doing a restart, the program image is downloaded (see Downloading with EDBICE on page 53).
Instruction Stepping Instruction stepping is performed by restoring the processor’s context as if preparing for execution, then executing one instruction. After stepping, the context of the processor is unloaded again so the user can observe the effects of executing that instruction.
In MONICE, the S command is used for instruction stepping. In EDBICE, the Edb_Step_Forward_Mode option controls whether instruction stepping or step-forward mode is used.
Examples:
s // step 1 instruction
s =boot // step instruction at boot
Step Forward Mode If an interrupt is pending when the MAJIC probe steps an instruction, then the processor steps into the exception handler. Depending on the specific processor, the stepped instruction may execute first, or it may be preempted by the interrupt request. Similarly, if the stepped instruction raises an exception, the program will enter the exception handler.
The MAJIC probe provides Step-Forward mode to single step through the foreground program. Before each step, the MAJIC probe predicts the next PC. If an exception or interrupt occurs, then the predicted address is not reached, so the MAJIC probe sets a temporary breakpoint at the predicted address, and program execution is started from the exception vector. When execution stops, the context is saved as normal. If the temporary breakpoint set above was hit, then one step has been completed. If execution stopped for any other reason, stepping is aborted, and the new PC is reported.
i
56 0380-0163-10 Rev 2.01 MAJIC User’s Manual

MAJIC Probe Debug Services 4
In MONICE, the SF command is used to step forward. In EDB, the Edb_Step_Forward_Mode is used to select step-forward mode while stepping.
Examples:
SF // step forward by 1 instruction
SFQ 99 // step forward 99 times, quietly
SFV 99 // step forward 99 times, verbosely
NOTE: This feature relies on setting breakpoints. Software breakpoints are used when stepping through RAM, and hardware breakpoints are required when stepping through ROM.
Stepping Over Calls It is often desirable to step through a high level function without having to step through each of the subroutines called by that function. The MAJIC probe provides a third method of stepping, called Step Over (MONICE SO command), which allows this. It works essentially the same way as Step Forward mode, but the breakpoint is set at the return address if the stepped instruction was any form of a call instruction.
Examples:
SO // step over 1 instruction or function
SOQ 16 // step over 16 instructions or functions, quietly
SOV 16 // step over 16 instructions or functions, verbosely
NOTES:
• This feature relies on setting breakpoints. Software breakpoints are used when stepping through RAM, and hardware breakpoints are required when stepping through ROM.
• EDBICE does not use the MAJIC probe’s Step-Over service. It uses either normal instruction stepping or Step-Forward mode (depending on the Edb_Step_Forward_Mode option) until it steps into a subroutine, then runs to a temporary breakpoint at the return address.
Step Command List in MONICE
The MONICE step commands allow a command list to be specified, which will be executed at the end of the single (or multiple) step. Thereafter, the command list will be repeated after each step command completes, or when execution stops on a breakpoint. To clear the command list, use a step command with an empty command list.
Examples:
S {dw r0 L 8} // step, then display eight registers
S 10 // step ten times, then repeat command list
S { } // step and clear command list
S {if (@my_var < 0n100) {S}} // Step repeatedly until my_var >= 100
i
i
MAJIC User’s Manual 0380-0163-10 Rev 2.01 57

4 MAJIC Probe Debug Services
Multi-stepping with MONICE
MONICE supports multi-stepping by including a count with the step command. It is even possible to step-forward or step-over repeatedly. Quiet mode multistepping (SQ command with a step count) is handled by stepping repeatedly, until the terminal count is reached, a breakpoint is encountered, or a stop request is issued from the debugger. Only when stepping finishes will the new PC and instruction be displayed.
In verbose multistepping (SV command with a step count), discrete single steps are performed until the terminal count is reached or a stop request is issued from the debugger. After each step, the new PC and instruction at that address is displayed. Breakpoints are inhibited during verbose multistepping.
A step (S) command that does not specify verbose or quiet mode retains the mode most recently specified (quiet, initially).
Examples:
SQ 5 // step quietly 5 times
S 5 // step 5 more (still quietly)
SV 10 // step verbosely 10 times
S 10 // step 10 more times (still verbosely)
SFQ 500 // step-forward quietly 500 times
SOV 500 // step-over verbosely 500 times )
Breakpoints
The ability to stop the processor automatically at a specific point in a program is called a breakpoint. Execution may also be stopped manually at any arbitrary time with the ^BREAK key in MONICE, or the STOP button or menu command in source-level debuggers.
The MAJIC probe uses two techniques to trigger a breakpoint. The first, called a software breakpoint, places a special instruction at the specified address prior to starting execution. The original instruction at that location is saved and then restored when execution stops. The second type, called a hardware breakpoint, involves using the breakpoint features present in the processor as a trigger to stop program execution.
Examples of using software breakpoints in MONICE are provided below. For information on using software and hardware breakpoints with a source-level debugger, refer to your debugger’s documentation.
Pass Counts When execution stops on a breakpoint, the MAJIC probe checks the breakpoint’s pass count. If the pass count has been reached, it notifies the debugger that execution has stopped. If the pass count has not yet been reached, the MAJIC probe restarts execution as quickly as possible.
NOTE: Many source-level debuggers implement pass counts themselves instead of using the MAJIC probe’s pass count support.
i
58 0380-0163-10 Rev 2.01 MAJIC User’s Manual

MAJIC Probe Debug Services 4
Software Breakpoints Software breakpoints are implemented by temporarily replacing the instruction at the breakpoint location with a breakpoint instruction. When the processor executes the breakpoint instruction, it stops executing instructions and notifies the MAJIC probe, and in turn the debugger.
NOTES:
• In order to set a software breakpoint, it must be possible to modify the memory in the target system. Thus a software breakpoint cannot normally be placed in code executed from ROM. However, for certain processors, software breakpoints in ROM are supported by locking them into the instruction cache. To enable this feature, set the Ice_Cache_Rom_Bp option to on prior to setting the breakpoint (see page 161).
• If a software breakpoint is set in non-writable memory, and Ice_Cache_Rom_Bp is off or unsupported by the processor under test, then the breakpoint is automatically converted to a hardware breakpoint, if possible.
• If no breakpoint is set at the address where execution stops, then it is reported as an “unrecognized breakpoint”. This may happen if the program hits a breakpoint instruction that is hard coded (as opposed to one set with the debugger), or if a memory alias causes a breakpoint set at one location to appear in another.
Breakpoint Commands in MONICE
The BS (Breakpoint Set) command sets or changes a software breakpoint, with optional pass count, and an optional command list to be executed when the breakpoint is hit. If the command is entered without parameters, a breakpoint is set at the current PC.
The BL (Breakpoint List) command displays a list of all breakpoints currently set, showing the break address, initial pass count, remaining pass count, whether or not it’s active (enabled), and the associated command list (if any).
The BC (Breakpoint Clear) command clears one or more software breakpoints previously set with the BS command. To temporarily disable a breakpoint, use the -B and +B commands instead.
Examples:
BC * // clear all breakpoints
BC my_sym // clear breakpoint at my_sym
BS // set breakpoint at current PC.
BC // clear breakpoint at PC
BS 400 // set breakpoint at 400
BS my_label // set breakpoint at my_label
BS @RA // set breakpoint at address in MIPS .ra register.
BS @lr // set breakpoint at address in ARM .lr register.
BS my_label your_label // set two breakpoints
i
MAJIC User’s Manual 0380-0163-10 Rev 2.01 59

4 MAJIC Probe Debug Services
NOTES:
• The breakpoint commands are only available in MONICE. If you are using another debugger, you must use the breakpoint services provided by that debugger.
• Software breakpoints in Thumb or MIPS16 code are not supported by MONICE.
The BS command allows a pass count to be specified as an optional parameter. It is also possible to specify a MON command list to be executed when the breakpoint is hit (and the pass count it met). Refer to Breakpoint Set on page 77 for full information on these options.
BS 80005020, 20 {dv "\nat 80005020 20 more times\n"}// set a breakpoint with pass count = 20.// when it’s hit, display a message.
BS my_label { dv "\n executed my_label\n"; g}// set breakpoint at my_label; when it’s hit, // display message and restart execution.
BS my_label,-3 // set a temporary breakpoint at my_label with// a pass count of 3.
Hardware Breakpoints
Hardware breakpoints are implemented as logic within the processor's debug support unit that monitors the processor's address and optionally data busses, and stop program execution if a specific condition is met. The number and type of hardware breakpoints you can set depends on the capabilities of the processor you are using. The EDB user interface provides a superset of the possible hardware breakpoint capabilities, but the MAJIC probe restricts their use to only those features that are available in your processor. Refer to your processor’s documentation for details on the instruction breakpoint features available to you. MONICE does not directly support setting hardware breakpoints, although it does support hardware breakpoints that the MAJIC probe had converted from software breakpoints that were set in ROM (see Software Breakpoints on page 59).
Instruction Breakpoints An instruction-match breakpoint stops program execution when the PC reaches a certain address. Many processors provide additional capabilities for qualifying instruction breakpoints:
• Some processors provide an address mask capability to trigger a breakpoint for a range of addresses, and some processors even support arbitrary ranges by providing separate start and end addresses.
• Some processors provide PID or ASID qualification, triggering a breakpoint only when the MMU’s PID or ASID field matches.
• Some processors can provide a TracePoint feature to generate an external trigger instead of stopping program execution when the breakpoint is hit. The MAJICPLUS probe can be set to assert its TRIG OUT output (on the rear panel of the MAJIC probe) when a trace point is hit, or trigger trace data acquisition. This is covered in Chapter 6, Tracing and Trace Points, on page 141.
i
60 0380-0163-10 Rev 2.01 MAJIC User’s Manual

MAJIC Probe Debug Services 4
Data Breakpoints A data breakpoint stops program execution if a specified data transfer is initiated. Most processors which offer data breakpoints provide a number of optional break qualifications:
• Most processors can compare the data value as well as the address. Some processors allow the data value to be masked.
• Usually the breakpoint can be restricted to reads, writes, or both reads and writes, and can be restricted to certain byte lanes.
• Some processors provide an address mask capability to trigger a breakpoint for a range of addresses, and some processors even support arbitrary ranges by providing separate start and end addresses.
• Some processors provide PID or ASID qualification, triggering a breakpoint only when the MMU’s PID or ASID field matches.
• Some processors can provide a TracePoint feature to generate an external trigger instead of stopping program execution when the breakpoint is hit. The MAJICPLUS probe can be set to assert its TRIG OUT output (on the rear panel of the MAJIC probe) when a trace point is hit, or trigger trace data acquisition. This is covered in Chapter 6, Tracing and Trace Points, on page 141.
EPI OS and Semi-Hosting
The MAJIC probe can provide your application with access to the host computer’s screen, keyboard, and file system. The underlying technique that is used depends on the processor architecture, but the basic concept is that the program calls Host Interface Functions (HIF) to pass information and control to the debugger, which performs the service and returns results back to your program.
MIPS For processors conforming to the MIPS architecture, HIF support is implemented in the epios.c module, in the samples directory. Most of the sample programs provided in the EDTM software package are built using EPI’s compilation tools, which use this module as the bottom layer of the run-time library. This makes it possible to use standard run-time library functions such as printf() and gets() to interact with the user, or functions such as fopen() and fread() to access the computer’s file system.
When using compilation tools other than EPI’s, you may want to modify your run-time library to work similarly, or you may call the functions in epios.c directly. The public interface for this module is declared in epios.h. The ostest sample program is an example of making direct HIF calls: _hif_init is called from boot.s, and various other HIF calls are made from ostest.c.
NOTE: When making HIF calls directly from your source code, EPI recommends using the macros defined in epios.h so that HIF support can be easily removed from your production build by simply providing an alternate set of macros.
It is important to be aware that most HIF calls are intrusive, meaning that program execution is paused when the HIF call is made, and resumed upon completion, so that the results of the HIF call can be returned to the caller. This intrusion may result in unacceptable latency in tight real-time applications. However, the “debug print” channel provides the ability to display output through the debugger with
i
MAJIC User’s Manual 0380-0163-10 Rev 2.01 61

4 MAJIC Probe Debug Services
minimal, and in some cases no intrusion on the running program. For most processors which support DMA via the EJTAG interface, the messages may be transferred from the target to the MAJIC probe without interfering with processor execution. For other processors, execution must be paused momentarily to transfer the message, but remains stopped for several milliseconds instead of the tens or even hundreds of milliseconds required for normal HIF calls.
NOTE: Since EPI-OS support introduces some intrusion on breakpoint processing, it can be disabled with the Semi_Hosting_Enabled option (see page 163). By turning this option off you can minimize the latency associated with breakpoint pass counts.
ARM For processors conforming to the ARM architecture, HIF support is accessed via the ARM Semi-Hosting Library. When using this feature, HIF calls are made by trapping the software interrupt (SWI) vector. To use this feature, the Semi_Hosting_Enabled option must be turned on. If your application uses the SWI vector for something other than Semi-Hosting calls, then the Semi_Hosting_Enabled option must be turned off.
NOTES:
• If Semi_Hosting_Enabled is on, the Vector_Catch bit corresponding to the SWI (0x04) is ignored.
• The ARM Semi-Hosting library determines the top of target memory (for setting up the heap) from the Top_Of_Memory option. This option should be set to the first address beyond physical RAM on your target (for example, Top_Of_Memory=0x80000 if RAM is from 0 to 0x7FFFF).
Starting Execution
Starting target execution involves restoring the state of the processor to exactly what it was when execution stopped, then allowing the processor to resume its normal instruction fetching and execution. Prior to starting execution, the MAJIC probe flushes any data cache lines that may have become incoherent as the result of memory transfers made by the MAJIC probe, and invalidates corresponding instruction cache lines. Then it restores all of the processor registers to the values they had when execution stopped. Finally, it returns execution control to the application code.
Execution continues until one of several events occurs:
• A breakpoint is hit.
• You ask the debugger to stop.
• The TRIG IN Run Sync or Break event occurs (see Ice_Trigger_In on page 162)
• Your program completes via an exit() call.
• You are using the EDTM sample boot.s module, and an unregistered exception occurs.
• An exception is raised for which the Vector_Catch option is set (see page 167).
i
i
62 0380-0163-10 Rev 2.01 MAJIC User’s Manual

MAJIC Probe Debug Services 4
The case of starting execution from an arbitrary location usually implies that a new value is loaded into the program counter. While this is no problem for the MAJIC probe, it may be for the user. It is the user’s responsibility to ensure that the state of the system, including internal registers, external memory, and stack is initialized correctly for that particular starting point.
Source-level debuggers typically provide buttons and hot keys for starting and stopping the program.
NOTE: When starting execution from a breakpoint, the MAJIC probe must single step off of the breakpoint before actually starting execution.
Concurrent Debug Mode
While executing in concurrent debug mode, the debugger’s user interface and command line remain active. To whatever extent possible, the MAJIC probe provides debug services without intruding on program execution. For example, MIPS processors that support DMA via the EJTAG port can support peeking and poking memory (including variables) without stopping the processor.
Some debug services require that the processor be paused, for example accessing the processor’s register file, and in many cases memory as well. As required, the MAJIC probe pauses program execution to perform the service and then restarts execution. This happens behind the scenes, so it looks as if program execution remained running the whole time. However, in tight real-time systems the intrusion may be disruptive, in which case you should avoid using such debug services while running in concurrent debug mode.
Examples:
G // Go from current PCG =reboot // Go, starting from rebootG main // Go until main is reached, or a breakpoint is hitGI // Go-Interactive; start in concurrent debug mode
Real Monitor The ARM RealMonitor allows real-time applications to be debugged without stopping the target processor. This is different from ordinary JTAG debugging, where the target processor must be halted (put into DEBUG mode) before the emulator can access memory or registers.
RealMonitor may be used to halt, set breakpoints, and step through foreground code while interrupts continue to be serviced. Memory may be examined or modified at any time while interrupts continue to be serviced.
RealMonitor requires RMTarget code (a debug kernel) to be running on the target. This code can either be merged with the other embedded code running on the target or it can implemented as a separate kernel (either downloaded through the MAJIC probe or resident in ROM). The host debugger communicates with the RMTarget code through the DCC (Debug Communication Channel). Please refer to the RealMonitor documentation for details on using the RMTarget code (the documentation, RMTarget_A.pdf, is installed with the RealMonitor package).
For information on configuring AXD for RealMonitor through RDIMAJIC see Configuring AXD for RealMonitor through RDIMAJIC on page 29.
i
MAJIC User’s Manual 0380-0163-10 Rev 2.01 63

4 MAJIC Probe Debug Services
Downloading a RealMonitor Example Program
The RealMonitor must be running before you start AXD. If RealMonitor is installed in your boot ROM, then all you need to do is power up normally. Otherwise, you may download RealMonitor through the MAJIC probe using MONICE, and then start AXD. Refer to Using the Setup Wizard on page 15 for information on creating a MONICE shortcut for this process.
Running AXD
Once the RealMonitor code is running on the target (and after you have quit from monice), you should be able to debug from AXD. When AXD connects to the MAJIC probe, RDIMAJIC opens its own console window. With RealMonitor, it takes several seconds for the connection to be fully established.
NOTE: If you exit with an error condition on the last time you ran AXD, you may find that AXD does not attempt to connect to the MAJIC probe. In that case, go to the Option menu and select Configure target to open the Choose Target dialog box. The selected target will still be RealMonitor, so just click OK. This clears the error condition and AXD should connect to the MAJIC probe. This might happen on the first time after you try to use RealMonitor, because AXD probably had an error when you first selected RealMonitor mode.
Starting Execution with MONICE
The G (Go) command starts or resumes execution of the program from the current PC (or from a new starting point), and the ^BREAK or ^C key stop execution.
The GI (Go-Interactive) command starts execution in Concurrent-Debug Mode which allows debugger commands during program execution. The SP (Stop) command stops in this mode, rather than ^BREAK or ^C.
Starting Execution with EDBICE
To run or resume program execution, click the GO button or select Go from the Exec menu. The Stop button stops program execution. The first time execution is started or stepped after selecting the program to debug or doing a restart, the program image is downloaded (see Downloading with EDBICE on page 53).
The GO button also continues execution after stopping. The Restart or Load button is used to reset the processor and restart from the beginning of your program.
The Edb_Go_Interactive_Mode option (described on page 161) controls whether the GO button enables concurrent debug mode.
MON> l LEDS_uhal.axf // Load the example
MON> vl // Verify that it loaded correctly
MON> gi // Go-Interactive
MON> q y // Quit monice
i
64 0380-0163-10 Rev 2.01 MAJIC User’s Manual

MAJIC Probe Debug Services 4
Advanced Topics
Assigning Names
Symbolic names representing memory locations or registers may be entered, displayed, or killed in MONICE with the EN, DN, and KN commands. Names are automatically read from the debugger information of an executable file when it is downloaded.
MIPS Examples:
en ram_base = 0:1 /* Create a name for the start of RAM */en ram_bound = FFFFFF:1 /* Create a name for the end of RAM */en HW_REG0 = 18000000:P /* Create a name for a hardware register’s
physical address */dn ram* /* Display all names starting with RAM */
ARM Examples:
en flash_base = 20000000 /* Create a name for the start of flash */en HW_REG0 = 30000000
dn flash* /* Display all names starting with flash */
Command Aliases
The EA (Enter Alias) command creates an alias (synonym) for a list of one or more commands. It is normally used to create a short abbreviation (one or more characters) for a longer command or sequence of commands that are frequently needed.
Combining EA with FR C allows you to create your own custom commands. A command file may accept parameters, generate output, and supports expression evaluation and flow control for creating loops – everything you need to create your own intelligent command (see Command (script) Files on page 67). The EA command allows you to define a name to use for running your command.
Aliases can be displayed with the Display Alias (DA) command, and removed with the Kill Alias (KA) command.
The DA (Display Alias) command shows the name and replacement text for one or all currently defined aliases. If the command is entered without a parameter, all aliases are displayed
The KA (Kill Alias) command deletes the name and replacement text for one or all of the currently defined command aliases.
Examples:
ea DIA DW @pc L 10,i // Disassemble instructions from current pc
ea rc fr c // Read command file without echo
MAJIC User’s Manual 0380-0163-10 Rev 2.01 65

4 MAJIC Probe Debug Services
da DIA // Display DIA alias
da * // Display all aliases
ka rc // Kill rc alias
Debugger Local Variables
Debugger local variables provide temporary storage which does not impact the target memory. Debugger local variables are referenced by a symbolic name that starts with a dollar sign (for example: $temp_var). These local symbols can be used anywhere a normal target address can be used. They are useful in command files for holding expression results or loop counts and the like without intruding on target memory or registers, as in the sample command file below:
NOTE: Memory is allocated for debugger local variables on an as-needed basis. The first time a debugger local symbol name is used, the next available address in the local address space is assigned, the name and address are added to the symbol table, and its size is set. Once referenced, the debugger local symbol’s address and size are fixed. Therefore, the first usage should allocate the maximum space needed with an Enter command.
Example:
eb $buffer64 L 64 = 0 // Create and clear a 64-byte buffer
Formatted Display
The DV command (Display Value) allows the user to generate formatted output. The format string controls the operation of DV much like the format string in a C printf() statement. Many format controls match those used by printf, but there are differences. Refer to the DV command definition on page 88 for full details.
Examples:
DV "Hello, world!\n"DV "Byte at %x is %02bx\n", global_char_var, global_char_var
ew $addr = 0xA0000000 /* Create and initialize $addr variable */
ew $write = 0x55555555 /* Create and initialize $write variable */
:LOOP
ew @$addr = @$write /* Dereference $addr and write $write value there */
mw @$addr, $read /* Dereference $addr and move value to $read variable */
if (@$read == @$write) {ew $write = ~@$write; goto LOOP}/* Toggle and loop if value read matched written */
dv "ERROR: wrote %X to %X, read %X\n", @$write, @$addr, @$read/* display error message */
i
66 0380-0163-10 Rev 2.01 MAJIC User’s Manual

MAJIC Probe Debug Services 4
The following might be useful as a command list in a BS command:
dv "Break at foo(), args = \"%s\", %d, %ld\n", r4, @r5, r6 ; g
NOTES:
• Integer formats assume that int is 32-bits.
• Even trivial uses of DV are not supported in Stand-alone (-z) mode. See MONICE Command Line on page 169.
Saving a Session Log
An FW O (File Write Output) command causes each line printed to the console (including the echo of commands entered) to be logged into the specified file. This allows a permanent record to be made of a debugging session.
Examples:
FW O session.log // Open session.log and enable logging
FW O - // Stop logging and close file
FW O + // Re-open log file in append mode
Command (script) Files
An FW C (File Write, Command) command records only the commands that are entered, but not the prompts and responses from the debugger. This is a convenient way to create script files that can be used to automate repetitive command sequences or to quickly recreate an interrupted debugging session.
The FR C (File Read, Command) command causes the debug monitor to read commands from the specified file. When all the commands in the file have been processed, the monitor resumes reading commands from its previous input source, ultimately returning control back to the console. This is an easy way to input a standard set of commands or to quickly recreate an earlier session. The file can be created manually or can be logged with the File Write commands (FW C). If the FR C command is part of a multi-command line, any commands following it on the line will be executed after all commands in the new file have been executed.
NOTE: Empty lines in a command file are equivalent to hitting <Enter> at the debugger prompt. That is, they may cause the previous command to be repeated if it was a “repeatable” command such as Display or Step. A single space is sufficient to inhibit this behavior, but a comment line is recommended instead.
Command Parameters
Command files can accept and process parameters. Each parameter is an arbitrary string of text delimited by white-space (blank or tab). When each line of the command file is read in, it will be scanned for parameter strings of the form $$* or $$n, where n is a one- or two-digit decimal number.
$$n Parameter to be replaced with the nth parameter of the FR C command.
i
i
MAJIC User’s Manual 0380-0163-10 Rev 2.01 67

4 MAJIC Probe Debug Services
$$0 Special parameter which evaluates to the number of parameters remaining to be processed.
$$* Special parameter which evaluates to all parameters supplied via the FR C command.
NOTE: If no argument was supplied for a particular $$n parameter, the parameter will simply be removed from the command line during parameter substitution.
The replacement text can be “pasted” into a larger token by using “\” as a delimiter character.
Examples:
FR C example A B C // Invocation of command file including following// examples.
$$1\3 // Replaced with A3
MY\$$2\IDENT // Replaced with MYBIDENT
temp\$$3 // Replaced with tempC
Shift/Unshift Commands
The SHIFT and UNSHIFT commands change the correspondence between the arguments supplied on an “FR C filename” command and the parameter strings within the command file.
Normally, the first argument is substituted for $$1, the second argument for $$2, and so forth. The SHIFT command increments the argument number that corresponds to each parameter number, and decrements $$0, effectively shifting the argument array so that a given range of parameter numbers refer to a higher range of arguments. The UNSHIFT command reverses this effect.
Argument shifting is very useful when you want to perform the same series of actions repetitively on an unknown number of arguments (or groups of arguments). The following command file will display the contents of a series of ranges. It expects an argument list of the form: addr count[ addr count]... On the first iteration, it processes the first two parameters; on the second pass, the next two; etc.
:loop
if ($$0 < 2) { dv "Expected address and count\n"; goto done }
dw $$1 L $$2
shift 2
if ($$0 >= 2) { goto loop }
:done
GOTO Command The GOTO command is used to change the order of command execution when reading commands from a command file. It causes the command file reader to jump to the line following the specified label. Labels are defined in the command file by a line of the form:
:label
i
68 0380-0163-10 Rev 2.01 MAJIC User’s Manual
MAJIC Probe Debug Services 4
where label is any valid identifier string (letters, numbers, $, or _). The colon does not have to be in the first column of the line, but there must be no white space between the colon and the label.
GOTO commands may precede or follow the corresponding label definition. Label definitions and GOTO commands have no effect when reading commands from the console, but they will be saved in a command output file if command logging is in effect.
The GOTO command, in combination with debugger local variables and the IF command, can be used to construct arbitrary conditional blocks and loops in command files.
Example:
If Command The IF command supports conditional execution of debug monitor commands. This is extremely useful in breakpoint command lists, where the Go command can be used to automatically continue execution if some condition is not met. It is also useful in command files, where the GOTO command can be used to conditionally alter the flow of control.
Example:
The example uses a combination of breakpoint pass counts, the IF command, and a debugger local variable to implement a breakpoint that will display a message every ten times it is reached, but will not actually stop executing the program until the breakpoint has been reached 100 times.
EW $loop = 0 /* Initialize debugger variable */
:TOP
S 1000 ; DW x /* Look at variable every so often*/
IF (@.4x > 0xffff) { GOTO BOOM } /* Has it been trashed yet? */
EW $loop = @$loop + 1 /* Update loop count */
IF ( @.4$loop < 1000 ){ GOTO TOP}/* Loop, but don’t go forever */
GOTO DONE /* Is working, exit cmd file */
:BOOM /* “x” got trashed */
DW $loop /* Loop count when we noticed trash */
DW x
:DONE
ew $count = 0
bs foo,10 {dv "entered foo 10 times\n"; if (@.4$count < 10) {ew $count = @.4$count + 1; g} }
MAJIC User’s Manual 0380-0163-10 Rev 2.01 69

4 MAJIC Probe Debug Services
+/-Q Enable or disable Quiet mode of command file playback. Normally, debugger prompts and commands read from the command file are displayed just as they would be if the commands were entered from the keyboard. But when Quiet mode is active, the debugger does not display prompts and commands while reading commands from a file.
Quiet mode is automatically turned on while a command alias is being executed. When the alias command is finished, the original state of Quiet mode is restored. This allows alias names that invoke command files to look like built-in commands, because there is no extraneous output beyond what the command file explicitly produces.
70 0380-0163-10 Rev 2.01 MAJIC User’s Manual

MAJIC User’s Manual 0380-0163-10 Rev 2.01
5
MON Command LanguageThis chapter provides full details on the MON Command Language. MON is a powerful command line and scripting language for accessing and exercising the processor and target system. The way the MON Command Language is presented and the extent of MON support depends on the debug environment, as follows:
MONICE: Commands are entered at the MON command prompt.
EDBICE: Commands are entered in the Session window in MON mode. The Memory window’s M button selects between accepting addresses as C expressions or addresses in MON syntax.
MDI: The MDI specification requires the debugger to provide a way to pass commands through to the MDI library, but does not specify how. Check your debugger documentation.
Others: Via the MON console window.
The Debug Monitor produces a summary of MON commands in response to the help command h. Also, a summary of these commands is listed in Appendi xC, MON Quick Reference, on page 169.
This chapter is organized in the following sections:
• MON Command Basics
• Debug Monitor Commands on page 72
• Debug Monitor Operands on page 124
MON Command BasicsIn learning the MON command language, it may help to know some of the design philosophy that it is based on. Commands are usually formed from the first letter of each word in the spoken command name. Command names are of the form Action, Action Object, or Object Action (e.g. Go, Display Word, or File Read).
Command names were chosen that are easy to remember, and the command mnemonics are simple abbreviations. The number of basic commands are kept to a minimum — there is just one Display command, for instance, not “Dump
71

5 MON Command Language
memory” plus “eXamine registers” plus “Unassemble instructions”, etc. With the exception of symbolic names, the fmt operand, and UNIX filenames, debugger commands are not case sensitive.
MON Help MON features a hierarchical help system. The following types of commands are available:
H // shows the list of commands.
H D // gives general help on display commands.
H DW // gives detailed help on the display word commands.
H addr // gives detailed help on arguments.
H ops // shows the list of command operands for which on-line help // is available.
Command Lists You can enter multiple commands on a single line, separated by “;”. For example, the following line will execute a MIPS program up to function foo, display its three argument registers, then continue execution until foo returns to its caller.
G foo ; DW a0 L 3 ; G @ra
If an error is detected in a command, the rest of the command will be ignored but subsequent commands on the same line are executed. The only constraint is when using either the EA command or the OS escape command (!): in either case, the command must be the last command on the line. When the EA command is encountered, the remainder of the line is taken as the alias replacement text; and when the OS escape command (!) is encountered, the rest of the line is taken to be a command to the operating system, regardless of its contents.
Command lines can contain C-style comments (e.g. “/*This is a comment*/”) and C++ comments (e.g. “//...”). Comments are replaced with a single blank when the command is being interpreted. Comments are most useful for documenting command files.
NOTE: Empty lines in a command file are equivalent to hitting <Enter> at the debugger prompt. That is, they can cause the previous command to be repeated, if it was a “repeatable” command such as Display or Step. Use comment lines instead of blank lines to improve readability in command files without this side effect.
Debug Monitor CommandsThe following pages describe the MON command language in detail. Each command is listed at the top of a new page, along with its syntax, description, and examples (where appropriate). Each command also indicates its availability in various debuggers.
Command Availability All of the commands in this chapter are available in the MONICE debugger. Subsets of these commands are also available in the optional EDBICE source-level debugger, and in the backend libraries that allow the MAJIC probe to be used with
i
72 0380-0163-10 Rev 2.01 MAJIC User’s Manual

MON Command Language 5
third party debuggers. For each command, the Availability heading lists one or more of the following keywords for the environments where the command is valid:
MONICE The MONICE debugger.
EDBMON The MON mode in the EDBICE debugger.
EDB Both EDB and MON modes in the EDBICE debugger.
API The various debugger API libraries that third party debuggers use to connect to the MAJIC probe (MDI.DLL, RDIMAJIC.DLL, EPIWRBE.DLL).
ALL All of the above.
MAJIC User’s Manual 0380-0163-10 Rev 2.01 73

5 MON Command Language
+B, -B Enable or Disable Breakpoints
Availability: MONICE
Syntax: �+�-�B �*�
�+�-�B addr ���
Description: The Enable Breakpoint (+B) or Disable Breakpoint (-B) command enables or disables one or more software breakpoints previously set with the BS command.
* All software breakpoints are enabled or disabled.
addr Specifies the address of a software breakpoint to be enabled or disabled.
addr must be an address in a valid code address space. The addr syntax is shown in Address on page 125.
If no parameter is given, and there is a software breakpoint set at the current execute location, that breakpoint is enabled or disabled.
Examples: BS main First Second Third
-B *
+B main Third
74 0380-0163-10 Rev 2.01 MAJIC User’s Manual

MON Command Language 5
BC Breakpoint Clear
Availability: MONICE
Syntax: BC �*�
BC addr ����
Description: The Breakpoint Clear command clears one or more software breakpoints previously set with the BS command. To temporarily disable a breakpoint, use the -B command instead.
* ALL software breakpoints are cleared.
addr Specifies the address of a software breakpoint to be cleared.
addr must be an address in a valid code address space. The addr syntax is shown in Address on page 125.
If no parameter is given and there is a software breakpoint set at the current execute location, that breakpoint is cleared.
Examples: BC
BC *
BC my_sym
MAJIC User’s Manual 0380-0163-10 Rev 2.01 75

5 MON Command Language
BL Breakpoint List
Availability: MONICE
Syntax: BL
Description: The Breakpoint List command displays a list of all breakpoints currently set, showing the break address, initial pass count, remaining pass count, whether or not it is active (enabled), and the associated command list, if any. If a non-empty command list is still active from a previous Go or Step command, it will also be displayed.
76 0380-0163-10 Rev 2.01 MAJIC User’s Manual

MON Command Language 5
BS Breakpoint Set
Availability: MONICE
Syntax: BS �addr�, �-�pass_count����� �{cmd_list}�
Description: The Breakpoint Set command sets or changes one or more software breakpoints with optional pass counts and an optional command list. If the command is entered without parameters, a breakpoint is set at the current PC.
There is no practical limit on the number of breakpoints which may be set at any given time.
addr Specifies the address where execution will break. Note that if addr is not specified, the software breakpoint will be set at the current execute location.
- The minus sign indicates the software breakpoint is temporary and will be removed when it is hit pass_count number of times. A temporary breakpoint is different from the non-sticky breaks that can be specified with the Go command which all disappear when the program stops for any reason.
pass_count Decimal number specifying the number of times the breakpoint location must be reached before the breakpoint is taken. At that time the command list is executed, and the pass counter is reloaded. If no pass_count is given, the breakpoint is taken every time the address is reached.
cmd_list Specifies one or more debugger commands to be executed when program execution is stopped by this breakpoint. Curly braces surrounding cmd_list are required. The command list may contain a Go or Step command, in which case the program will be resumed automatically. If present, the Go or Step command must be last. Combining IF and G commands in a breakpoint command list allows complex conditional breakpoints to be created. If no cmd_list is provided, execution simply stops.
Examples: BS // set breakpoint at current PC.
BS 400:r // set breakpoint 400 (hex) bytes above reset vectorBS my_label // set breakpoint at my_labelBS @RA // set breakpoint at address in register RA.BS my_label your_label
BS my_label {dv "\n executed my_label\n"; g}
BS 5020:0, 20 {dv "\nat 80005020 20 more times\n"}
BS my_label,-3 your_label, 2
BS func1, -5 {dv "\n at func1 fifth time\n"; dw var; dw (@ptr):d; g }
NOTE: The last example, like all debugger commands, must be entered on one line.i
MAJIC User’s Manual 0380-0163-10 Rev 2.01 77

5 MON Command Language
C Calls
Availability: MONICE
Syntax: C �max_levels�
Description: The Calls command walks up the function call chain and displays the functions on the chain.
This command shows how control got to its current location. It is also a convenient way to find where to set a breakpoint to interrupt execution when a function returns to its caller.
max_levels Decimal number specifying the maximum number of stack levels to be displayed. The default is 15.
The debugger requires symbolic and debugging information to perform this function. If the program file does not contain this information or code has not been downloaded to the target via the debugger’s Load command, the operation of this command is undefined.
For each function in the call chain, Calls displays the address of the next instruction to be executed (both in hex and symbolically) and if the function has arguments, the local registers containing those arguments are also displayed. Note: if the function modified the contents of its local registers which contain the arguments, the modified values are displayed.
This command assumes that the program under test follows MIPS or ARM calling conventions. C programs will meet this requirement, but in assembly language programs, adherence to the standard calling convention is the responsibility of the programmer. For MIPS targets, the correct calling convention must be specified with the Calling_Convention configuration option (see page 159).
For static (non-global) functions, the name of the function may not be known, in which case the closest preceding global symbol will be displayed along with an offset (assuming it’s within the range specified by the Sym_Delta configuration option described on page 164).
78 0380-0163-10 Rev 2.01 MAJIC User’s Manual

MON Command Language 5
CF, CFI, CI Cache Flush
Availability: MONICE, EDBMON, API
Syntax: CF �I�D�
CI �I�D�
CFI �I�D�
Description: The Cache commands are used to flush and/or invalidate the contents of the instruction and/or data caches.
CF flushes (writes back to memory).
CI invalidates without updating memory.
CFI flushes and then invalidates.
If an I or a D operand is specified, only the instruction (I) or data (D) cache is affected. If no operand is specified, both caches are affected.
NOTE: Support for Cache Flush (CF) and Cache Invalidate (CI) operations depends on features that are not provided by all processors. If the specific processor you are using does not support the operation, an error message is displayed.
i
MAJIC User’s Manual 0380-0163-10 Rev 2.01 79

5 MON Command Language
DA Display Alias
Availability: ALL
Syntax: DA
DA *
DA ident
Description: The Display Alias command shows the name and replacement text for one or all currently defined aliases. If the command is entered without a parameter, all aliases are displayed. Alias names are not case sensitive.
* Display all aliases. This is the default.
ident The name of a command alias defined with the EA command. ident is not case sensitive.
See Enter Alias on page 89 for more information about creating command aliases. See also Command Aliases on page 65.
80 0380-0163-10 Rev 2.01 MAJIC User’s Manual

MON Command Language 5
DB, DD, DH, DW
Display/Find Data
Availability: MONICE, EDBMON, API
Syntax: D�type�
D�type� range �, fmt�
D�type��R� range �, fmt��= value �# mask��, value �# mask��������
Description: This command displays the contents of the specified registers or memory locations in a variety of formats, or searches a memory range for the specified value list. Registers and “debugger local” address space may not be searched.
Once a Display/Find command has been entered, it may be repeated for successive addresses simply by pressing the <enter> key, until some other command is entered. The = value option causes successive <enter>s to repeat the search from where the last match left off. If no more matches are found, a message indicating that fact is displayed.
type �B�H�W�D�specifies the object size, where B is for Byte, H is for Half-word, W is for Word, and D is for Double word. The default is the type specified in the previous Display command or W, if this is the first Display command.
R the Reverse option causes the searching to start at the end of the range and scan backwards. (Note that type is then required if the DR “display registers” alias is active.)
range may indicate the location and number of objects to display or search. If range does not specify a start address, Display will continue where the previous Display left off, or begin at virtual address 0 if it is the first Display command.See Address Range on page 134.
fmt �d�u�o�x�X�f�e�E�g�G�c�s�i�the display and search value format; default is “X” (hex). For more information and to see a list of valid formats for each type, see Data Format on page 131.
value is the data to match against and must be given in fmt type. For integer fmt types, value may be an expr. If fmt is “s”, value is a string literal (string syntax is shown in String Literal on page 140.). If fmt is “i”, the mini-assembler is invoked (see Enter Data on page 90).
mask is a hex value that specifies which bits of value should be compared with memory. If mask is supplied only for the last value in the list, it will apply to all values in the list.
Examples: DW R0 R31 // Display the general registers.
MAJIC User’s Manual 0380-0163-10 Rev 2.01 81

5 MON Command Language
DB @my_str_ptr,s // Display null-terminated string pointed// to by my_str_ptr.
DW 2000:0 l 100,i = lui r0,0 #fc000000// Find first LUI instruction in range. // (Press <enter> to find successive LUIs)
DB _fdata _edata,s = “ERROR” #DF// Search the data section for “ERROR”, case // insensitive
82 0380-0163-10 Rev 2.01 MAJIC User’s Manual

MON Command Language 5
DF Display Filters
Availability: ALL
Syntax: DF �*�filter_list�
Description: The Display Filters command displays the trace display filters, and indicates their enabled/disabled status.
* Means all filters. This is the default.
filter_list Has the form: �Fid�:id�� ���
id Has the form: �1��50�label�
label Has the form: $ident, where ident contains no more than 15 characters and is not case sensitive.
MAJIC User’s Manual 0380-0163-10 Rev 2.01 83

5 MON Command Language
DI Display Information
Availability: ALL
Syntax: DI
Description: The Display Information command shows the version number and configuration information for the Debug Monitor and the target. This is a duplicate of the information normally displayed when the debugger is first invoked.
84 0380-0163-10 Rev 2.01 MAJIC User’s Manual

MON Command Language 5
DN Display Names
Availability: MONICE, API
Syntax: DN��*�ident�ident*�
Description: The Display Names command displays the values (addresses) of symbols known to the debugger.
* Displays all names. This is the default. ‘*’ is a wildcard character and can be given alone or at the end of sym.
ident Is a global datum, function, or user-defined symbol name (with EN). ident is case sensitive. When used with ‘*’, ident can be the starting characters of one or more global data, functions, or user-defined symbols.
See also Assigning Names on page 65.
MAJIC User’s Manual 0380-0163-10 Rev 2.01 85

5 MON Command Language
DO, DOV Display Options
Availability: ALL
Syntax: DO�V� �*�pattern*�cfg_option�
Description: The Display Options (DO) command displays a table of specified configuration options with a brief description. If the command is entered without parameters, all options are displayed. The Display Options Verbosely (DOV) command fully describes the option or options; it is best used with a particular option.
* Displays all options. This is the default. ‘*’ is a wildcard character and can be given alone or at the end of pattern.
pattern ident Displays all configuration options where the first letters match ident.
cfg_option Displays a specific option. The various options available are described under Appendix B, Configuration Options, on page 159.
To modify configuration options, see the Enter Option on page 95.
86 0380-0163-10 Rev 2.01 MAJIC User’s Manual

MON Command Language 5
DT Display Trace
Availability: ALL
Syntax: DT ?
DT ���+�-��count���td_range��, �R�I�D�M� �A�R�D�N���
Description: The Display Trace command allows the user to request a list of the available frames and the current pointer, to display frames relative to the current pointer or to display specific frames by number. Once a Display Trace command has been entered, hitting the <Enter> key will display the next full screen of frames in the current direction, until some other command is entered. The display mode remains in effect until changed.
? Means report available frames and the current pointer
�+�-��count� Sets the default paging direction and displays the next screen of frames, or one starting count displayable frames away.
td_range Has the form: �start �end�����start� L count�where start and end are decimal numbers or $, and count is a decimal number.
�R�I�D�M � Sets the display mode: Raw�Instruction�Data��Mixed
�A�R�D�N�� Sets the timestamp display mode: Absolute � Relative (to first frame)�Delta (between frames)� None
The default is Relative for Raw mode, None for the rest.
• Specifying start and end displays frames start to end, inclusively.
• Specifying start L count displays count frames forward from start.
• Specifying L count displays count frames in the current paging direction.
• Specifying ‘$’ for start or end means last frame.
MAJIC User’s Manual 0380-0163-10 Rev 2.01 87

5 MON Command Language
DV Display Values
Availability: MONICE, EDBMON, API
Syntax: DV string�, expr�����
Description: The Display Value command allows the user to generate formatted output. The format string controls the operation of DV much like the format string in a C printf() statement.
string a string literal containing characters to be displayed and conversion specifiers. For each conversion format specification, a corresponding expr argument is required to provide the value to be displayed. (The string syntax is shown in String Literal on page 140.)
All the conversion specifiers defined for the “C” printf() function are supported, except the use of * to specify dynamic field width or precision. Also, as an extension, the conversion letter may be preceded by an object size specifier: B, H, or W (or L) indicating that the value to be displayed is a Byte, Half-word, or Word sized object located at address expr.
The size and conversion letters combine to determine whether to display the value of expr or the data stored at the address expr. For formats s, e, f, and g, the data at the address expr is always displayed. For all other formats, the value of expr is displayed, unless a size specifier is used (in which case the data at expr is displayed).
See also Debugger Local Variables on page 66 and Formatted Display on page 66.
Examples: DV "Hello, world!\n" // Note that even trivial uses of DV are not// supported in Stand-alone (-z) mode.
DV "Byte at %x is %02bx\n", global_char_var,global_char_var
// the following might be useful as a cmd_list in a BS command.
dv "In printf, args = \"%s\", %d, %ld\n",@r4, @r5, r6 ; g
88 0380-0163-10 Rev 2.01 MAJIC User’s Manual
MON Command Language 5
EA Enter Alias
Availability: ALL
Syntax: EA ident cmd_list
Description: This command creates an alias (synonym) for a list of one or more commands. The alias can then be used as a command name. EA is normally used to create a short abbreviation (one or more characters) for a longer command or sequence of commands that are frequently needed.
ident the name of the alias that is being created or re-defined. When ident is used as an alias name, ident is not case sensitive. (See Identifier on page 132.)
cmd_list command�;command����one or more debugger commands, separated by semicolons. If the last command in cmd_list is not complete (missing some parameters at the end) they must be provided when the alias is used.
When a command is being processed, the debugger first checks to see if the command name matches an existing alias name, ignoring alphabetic case. If a match is found, the alias name is replaced by the text of cmd_list, and the command is re-scanned. If a match is not found, the debugger checks for built-in commands. This means that aliases can be used to re-define existing built-in commands, and the alias replacement text can contain other alias names. Recursive alias references are not supported, however.
If cmd_list includes a “FR C file” command, the command file will be read in Quiet mode to provide the illusion that the alias name is a built-in command.
Aliases can be displayed with the Display Alias command, and removed with the Kill Alias command.
See also Command Aliases on page 65.
Examples: EA DIA DW @pc l 10,i // Disassemble instructions from current pc
ea rc fr c // Read command file without echo
MAJIC User’s Manual 0380-0163-10 Rev 2.01 89

5 MON Command Language
EB, ED, EH, EW
Enter Data
Availability: MONICE, EDBMON, API
Syntax: E�type��K� �range��,fmt�
E�type� �range��,fmt� = value�, value�����
Description: The Enter Data command allows the contents of the specified registers or memory locations to be altered. If a value list is not given, the Enter command displays the current value of each object in turn, prompting for a new value. If range is not supplied, the Enter command picks up where the last Enter command left off. Enter with i fmt invokes a mini-assembler.
If a value list is given, the Enter command will store the values immediately without reading the old values (i.e. there will be no interactive prompting). If the number of values supplied would overflow the specified range, the excess values are ignored. If the supplied values do not completely fill the range, the value list will be replicated as necessary to fill the range.
Note: Such replicating “fill” operations are implemented as an Enter followed by a “destructive” overlapping Move. When the entire range is read/write memory, the effect is as expected. But the results may be non-intuitive if write-only or read-only resources are involved (e.g. ew r0 r31=123 will have the effect of filling the registers with 00000000).
type Specifies the object size. Has the form: �B�H�W�D�.�where B is for Byte, H is for Half-word, W is for Word, and D is for Double word. The default is the type specified in the previous Enter command or W, if this is the first Enter command.
K Causes input to be read directly from the keyboard, even when reading commands from a command file. It is ignored if “= value” is given. If K is not specified and an Enter command without a value list is executed from a command file, the input data items are also read from the command file.
range Specifies the location(s) where the values will be stored. The syntax of range is described in Address Range on page 134.
If range does not specify a start address, Enter continues where the previous Enter left off, or begins at virtual address 0 if it is the first Enter command. If range includes a length or end address, an interactive Enter command will automatically terminate after the last value is entered. If range does not specify a number of objects, the default range is determined by the number of values supplied. And if no values are supplied, the default range is unlimited.
i
90 0380-0163-10 Rev 2.01 MAJIC User’s Manual

MON Command Language 5
fmt Specifies the display and data entry format. Has the form: �d�u�o�x�X�f�e�E�g�G�c�s �i�The default format is X (hex). The i (instruction) format is supported only for MIPS processors, and invokes the mini-assembler (see MIPS Mini Assembler on page 47 for details). For more information and to see a list of valid formats for each type, see Data Format on page 131.
value Is the data to be written to the location(s) specified in range and must be given in fmt type. For integer fmt types, value may be an expr. If fmt is “s”, value is a string literal. If fmt is “i”, value is an instruction. For more information on fmt and expr, see Data Format on page 131 and Expression on page 129, respectively.
If an explicit value list is not supplied, Enter displays the location and current value of each object in turn, prompting for a new value interactively. Entering a backslash “\” instead of a value will cause the Enter command to redisplay the previous location and its current value for modification or verification. Hitting the <enter> key by itself will skip over the current object without modification. A period “.” instead of a value will terminate the interactive Enter command.
See also Debugger Local Variables on page 66.
Examples: MON> eb 0:1,c =a,,, ,b,,, ,c // the string “a, b, c”
MON> eb 0:1 l 10,d = 16,17,18 // fill with value pattern
MON> ew 1028:0,i = mfc0 a0,$12 // use mini-assembler
MON> dw 2000:1 l 6,i
a0002000: 08000803 j 0xa000200c
a0002004: 3c05bfc0 lui a1,0xbfc0
a0002008: 00a00008 jr a1
a000200c: 00000000 nop
a0002010: 010a0002 srl zero,t2,0
a0002014: 014a0002 srl zero,t2,0
MON> eb r2=55 // Sets R2 to 0x55.
MON> ew $saved=@loop // Saves the contents of the variable// loop in the debugger local variable// $saved.
MON> ew $saved=@$saved+1 // Increments the contents of the// debugger local variable $saved.
MAJIC User’s Manual 0380-0163-10 Rev 2.01 91

5 MON Command Language
EDB, MON EDB Command Mode and MON Command Mode
Availability: MONICE, EDBMON, EDB
Syntax: +�EDB�MON�
-�EDB�MON�
�EDB�MON�
Description: The EDB source-level debugger has its own command language interpreter. Some MON commands are also supported in the EDB command language, but most are available only by invoking the MON command interpreter within EDB. This is called “Entering MON mode”. Manually switching between the EDB and MON command interpreters is normally done by clicking the M button next to the command entry area in the Session window. These commands allow command files to switch modes as necessary, so they can be safely invoked from either mode in EDB or from MONICE.
The +EDB and +MON commands save the current command mode and enable EDB and MON mode, respectively. The -EDB and -MON commands restore the saved command mode. Any command file to be used in EDB should start with a +MON or +EDB command and end with the corresponding -EDB and -MON command. If the command file includes both EDB and MON commands, each group of commands should be bracketed by the appropriate enable/disable commands.
The EDB and MON commands switch to the specified command mode and cancel the effect of all +EDB and +MON commands currently in effect. These commands would be used in a command file only when it is intended to leave the corresponding command interpreter active rather than restoring the original state.
Notes:
• The -MON command is meaningless when in EDB mode and will be ignored in that case. Similarly, -EDB is ignored in MON mode.
• When “EDB mode” is activated via EDB or +EDB in MONICE or a back end, the command interpreter will ignore all but the mode changing commands until “MON mode” is restored via -EDB, +MON, or MON. This allows EDB-specific commands to be included in command files being read by debuggers other than EDB.
i
92 0380-0163-10 Rev 2.01 MAJIC User’s Manual

MON Command Language 5
EF Enter Filter
Availability: ALL
Syntax: EF�id�� �$ident�� filter_clause �& filter_clause�����
Description: The Enter Filter command allows the user to define Trace Display filters. A filter is a set of clauses that define states, values or ranges of values for one or more Trace Names. Multiple filters may be active at the same time. When filtering is enabled, only those frames which satisfy all of the clauses of any active filter will be displayed. This can be very useful in finding a particular frame of interest in the trace buffer. Once the frame is located, filtering can be disabled (using -F) or modified to allow the surrounding frames to be seen.
id Has the form: �1��50�
ident Optional filter name, up to 15 characters. ident is not case sensitive.
filter_clause Specifies the name of a trace datum and the value(s) it should have to match the filter. It has the form:
where: bit_name is the name of a single bit trace signal or a specified bit of a multi-bit trace signal (such as EXCEPT or U3). Field_name is the name of a multi-bit trace signal taken as a whole (such as U).location and value are the address and instruction or data values synthesized by the trace disassembly logic.
For a list of trace signal names, see MAJICPLUS Probe Trace Inputs on page 145, or use the DTN * command to display the list.
mask A hex number specifying the bits of the value that should be tested for a match with range.
Note: If a numeric id is not specified, the next available filter number will be assigned.
�!�bit_name
�!�field_name = value
�!��location�value�= range # mask
i
MAJIC User’s Manual 0380-0163-10 Rev 2.01 93

5 MON Command Language
EN Enter Names
Availability: MONICE, API
Syntax: EN ident = addr
Description: The Enter Name command is used to create user-defined names within the debugger. The name is entered in the debugger’s internal symbol table with the specified address as its value. The name can then be used in place of the address in all debugger commands.
ident The symbol name to be created. ident is case sensitive.
addr The address to associate with the symbol name. See Address on page 125.
See also Assigning Names on page 65.
Examples: EN uart_ctl = 81000000 // name for memory-mapped register
EN uart_data = 81000004 // name for memory-mapped register
94 0380-0163-10 Rev 2.01 MAJIC User’s Manual

MON Command Language 5
EO Enter Option
Availability: ALL
Syntax: EO cfg_option = value
Description: The Enter Option command provides a mechanism to configure the operation of the debugger and emulator. The various configuration options available and their valid values are described in Appendix B, Configuration Options, on page 159.
cfg_option The long or short name of a valid debugger configuration option.
value Depends on the specific option.
Examples: eo dp_color = on
eo dco=green
MAJIC User’s Manual 0380-0163-10 Rev 2.01 95

5 MON Command Language
ETM Enter Trace Mode
Availability: ALL
Syntax: ETM �R�I�D�M�
Description: The Enter Trace Mode command is used to specify the default format for the Display Trace command and EDB’s Trace Data window. If can be used to specify an initial default mode without causing trace data to be uploaded and processed.
R Specifies Raw format (all frames are displayed).
I Specifies Instruction format (only valid instruction frames are displayed).
D Specifies Data format (only data access frames are displayed).
M Specifies Mixed format (both instruction frames and data access frames are displayed).
96 0380-0163-10 Rev 2.01 MAJIC User’s Manual

MON Command Language 5
+F, -F Enable or Disable Trace Display Filter
Availability: ALL
Syntax: �+F�-F���*�filter_list�
Description: This command enables or disables trace display filters previously created with the EF command, described in Enter Filter on page 93.
* Enables or disables all filters. This is the default.
filter_list Has the form: �Fid�:id�� ���
id Has the form: �1��50�label�
label Has the form: $ident, where ident contains no more than 15 characters and is not case sensitive.
MAJIC User’s Manual 0380-0163-10 Rev 2.01 97

5 MON Command Language
FR File Read
Availability: ALL
Syntax: FR C file_name �p_value ����
FR M file_name �addr�
FR �RD�TD� file_name
Description: This command is used to open a file for reading. The type of file is specified by the first operand.
M Reads a memory image file (binary or Motorola s-record file). The default filename extension is .mem.
RD Reads user-defined register names from a Register Definition File. See Register Definition File on page 23 for details. The default filename extension is .rd.
TD Reads a Trace Display file. The default filename extension is .td.
file_name Is the name of the file to be read. If file_name does not include an extension, the debugger will supply the default file name extension. If no extension is desired, file_name should end with a “.”, which will be removed before opening the file. The debugger searches for file_name using the algorithm as described in File Search Order on page 22.
addr The starting address where the memory image will be loaded. It is not necessary that this address match the starting address used to write the file. addr is optional on memory image files containing Motorola S-Records. If given, addr specifies an offset relative to the addresses in the S-Record file.
C Reads commands from the specified file. The default filename extension is .cmd. For details on how to create and use command files see Command (script) Files on page 67.
NOTE: Command files can contain FR C commands which execute other command files. Command file reads may be nested up to 20 levels deep.
p_value An argument to be passed to the Command file.Each p_value is an arbitrary string of text delimited by white-space (blank or tab).
i
98 0380-0163-10 Rev 2.01 MAJIC User’s Manual
MON Command Language 5
FW File Write
Availability: ALL
Syntax: FW�O� TD filename
FW�A�O� M filename range
FW�A�O� �C�O� �filename�+�-�
Description: The File Write command allows the user to write a file. The type of file is specified by the first parameter. The valid types for a File Write are described below.
TD Specifies a Trace Display file. The default filename extension is .td.
M Specifies a memory image file (binary or Motorola S-record file). The default filename extension is .mem.
C Specifies a command log file. The default filename extension is .cmd.
O Specifies an output capture log file. The default filename extension is .out.
�A�O� Normally, if the file specified exists, you will be prompted for permission to overwrite or (for command and output files) append to it. To avoid that prompt, use the FWA command to append without prompt or the FWO command to overwrite without prompt.
filename Is the path and filename of the file to be written, relative to the current working directory. If filename does not include an extension, the debugger will supply the default file name extension. If no extension is desired, filename should end with a “.”, which will be removed before opening the file.
range Specifies the region of memory (or block of registers) to be written to the memory image file. See Address Range on page 134.
�+�-� Once writing to a Command or Output file has been initiated, output may be temporarily suspended with “-” and later resumed with “+”.
Doing a File Write to the O (Output) file type causes each line printed to the console (including the echo of commands entered) to be logged into the specified file. This allows a permanent record to be made of a debugging session. Whereas using the C (Command) file type records only the commands entered, but not the prompts and responses from the debugger. This is a convenient way to create script files that can be used to automate repetitive command sequences or to quickly recreate an interrupted debugging session.
MAJIC User’s Manual 0380-0163-10 Rev 2.01 99

5 MON Command Language
Memory image files contain raw binary data “uploaded” from the target. They normally represent the contents of some range of memory at the time they were created, but they can also contain a dump of the processor’s register contents. The file contains no control information (such as the original address range written to the file), so a Memory file can be written from one location and later read back into a different location.
See also Saving a Session Log on page 67 and Command (script) Files on page 67.
100 0380-0163-10 Rev 2.01 MAJIC User’s Manual

MON Command Language 5
G Go
Availability: MONICE
Syntax: G�I� �=addr� �addr ���� �{�cmd_list�}�
Description: The Go command starts or resumes execution of the program. Execution continues until a breakpoint or the end of the program is encountered. The I option starts execution in interactive mode. This mode allows a subset of debugger commands to be used while the target is executing. The SP (Stop) command interrupts the running program and returns MON to normal debug mode. Note that MON’s interactive mode command prompt differs from the normal prompt (e.g. MON(r) means the target is running).
=addr If specified, execution begins at the addr address. Otherwise execution begins at the current Program Counter location.
NOTE: Some programs require initialized data sections or registers to be reloaded before the program may be restarted from its entry point. In such cases, the Load command (described on page 109) should be used rather than G =addr.
addr��� Remaining addresses on the command line specify temporary (non-sticky) breakpoints, which will disappear when execution stops for any reason.
NOTE: Each addr must be a valid code address.
cmd_list If specified, the list of commands will be executed each time execution stops for any reason. This type of automatic command list is useful for displaying interesting values every time execution stops. If execution stops due to hitting a breakpoint that also has an associated command list, the breakpoint’s command list is executed first. A cmd_list may contain a Go or Step command, in which case program execution will resume automatically. Note that it is legal for additional commands to follow a Go or Step command in a command list. They will be stacked for execution in the proper order when execution finally stops for the last time, but this can be confusing. It’s recommended that this situation be avoided by making sure that a Go or Step is the last command to be executed in the list.
Remember, curly braces surrounding cmd_list are required and the entire Go command must be entered without any intervening carriage returns. The current “end execution” cmd_list can be displayed with the BL command. It remains in effect until canceled by a Go or Step command with a new or empty command list (i.e. G {}).
i
i
MAJIC User’s Manual 0380-0163-10 Rev 2.01 101

5 MON Command Language
GOTO GOTO
Availability: ALL
Syntax: :ident
GOTO ident
Description: The GOTO command is used to change the order of command execution when reading commands from a command file. It causes the command file reader to jump to the line following the specified label. Labels are defined in the command file by a line of the form:
:ident
where ident is any valid identifier string. The colon does not have to be in the first column of the line, but there must be no white space between the colon and the label.
ident The name of the label being defined or referenced. ident is not case sensitive.
GOTO commands may precede or follow the corresponding label definition. Label definitions and GOTO commands have no effect when reading commands from the console, but they will be saved in a command output file if command logging is in effect.
The GOTO command, in combination with debugger local variables and the IF command, can be used to construct arbitrary conditional blocks and loops in command files.
See also GOTO Command on page 68.
Examples: ED $loop = 0 /* Initialize debugger variable */
:TOP
S 1000 ; DD x /* Look at variable every so often*/
IF (@x > 0xffff) {GOTO BOOM } /* Has it been trashed yet? */
ED $loop = @$loop + 1 /* Update loop count */
IF (@$loop < 1000) {GOTO TOP} /* Loop, but don't go forever */
GOTO DONE /* Is working, exit cmd file */
:BOOM /* “x” got trashed */
DW $loop /* Loop count when we noticed trash */
DW x
:DONE
102 0380-0163-10 Rev 2.01 MAJIC User’s Manual
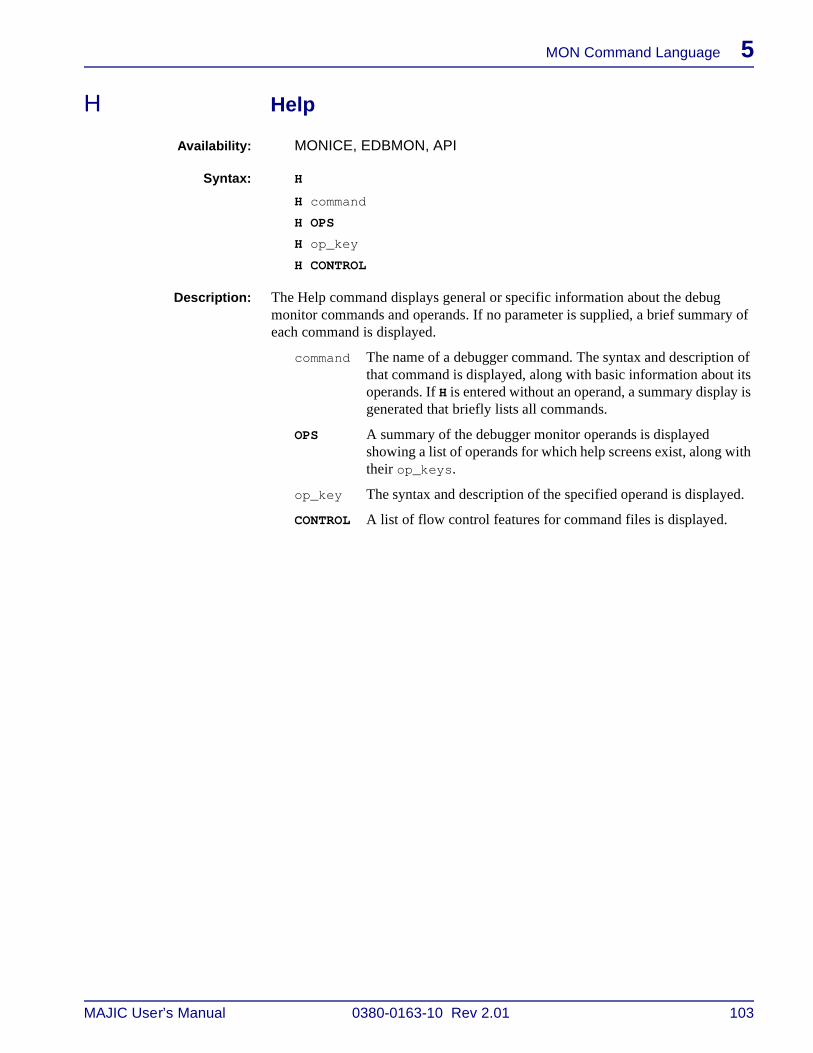
MON Command Language 5
H Help
Availability: MONICE, EDBMON, API
Syntax: H
H command
H OPS
H op_key
H CONTROL
Description: The Help command displays general or specific information about the debug monitor commands and operands. If no parameter is supplied, a brief summary of each command is displayed.
command The name of a debugger command. The syntax and description of that command is displayed, along with basic information about its operands. If H is entered without an operand, a summary display is generated that briefly lists all commands.
OPS A summary of the debugger monitor operands is displayed showing a list of operands for which help screens exist, along with their op_keys.
op_key The syntax and description of the specified operand is displayed.
CONTROL A list of flow control features for command files is displayed.
MAJIC User’s Manual 0380-0163-10 Rev 2.01 103

5 MON Command Language
IF IF
Availability: MONICE, EDBMON, API
Syntax: IF expr {then_cmds} �{else_cmds}�
Description: The IF command supports conditional execution of debug monitor commands. This is extremely useful in breakpoint command lists, where the Go command can be used to automatically continue execution if some condition is not met. It is also useful in command files, where the GOTO command can be used to conditionally alter the flow of control.
expr is an address expression. It is evaluated (remember that a symbol evaluates to its address unless preceded by @) and if the resulting value is non-zero, the commands in the then_cmds are executed. If the value is zero and the else_cmds is specified, those commands are executed.
then_cmds cmd_list
else_cmds cmd_list
NOTE: Curly braces must surround the cmd_list, and the entire IF command must be entered on one line.
See also If Command on page 69.
Examples: ew $count = 0
bs foo,10 {dv "entered foo 10 times\n"; if (@count<10) {ew $count = @$count + 1; g} }
The example uses a combination of breakpoint pass counts, the IF command, and a debugger local variable to implement a breakpoint that will display a message every ten times it is reached, but will not actually stop executing the program until the breakpoint has been reached 100 times.
NOTE: The cmd_list is shown here as two lines because of paper width limitations. But like all debugger commands, the entire BS command must be entered on one line.
i
i
104 0380-0163-10 Rev 2.01 MAJIC User’s Manual

MON Command Language 5
KA Kill Alias
Availability: ALL
Syntax: KA *
KA ident
Description: The Kill Alias command deletes the name and replacement text for one or all of the currently defined command aliases. Command aliases are created with the Enter Alias command. See Enter Alias on page 89 for more information.
* Remove all aliases.
ident The name of a specific alias to remove. ident is not case sensitive.
See also Command Aliases on page 65.
MAJIC User’s Manual 0380-0163-10 Rev 2.01 105

5 MON Command Language
KF Kill Filter
Availability: ALL
Syntax: KF �*�filter_list�
Description: This command deletes trace display filters previously created with the EF command (described in Enter Filter on page 93).
* Deletes all filters. This is the default.
filter_list Has the form: �Fid�:id�� ���
id Has the form: �1��50�label�
label Has the form: $ident, where ident contains no more than 15 characters and is not case sensitive.
106 0380-0163-10 Rev 2.01 MAJIC User’s Manual

MON Command Language 5
KN Kill Names
Availability: MONICE, API
Syntax: KN �*�ident�ident*�
Description: The Kill Names command deletes one or more symbols from the debugger’s symbol table.
* Kills all symbols. ‘*’ is a wildcard character and can be given alone or at the end of ident. When used with ident all matching names are deleted.
ident Is a global data, function, or user-defined (with EN) symbol name. ident is case sensitive. When used with ‘*’, ident can be the starting characters of one or more global data, functions, or user-defined symbols.
See also Assigning Names on page 65.
MAJIC User’s Manual 0380-0163-10 Rev 2.01 107

5 MON Command Language
KT Kill Trace Data
Availability: ALL
Syntax: �KT�KTD���Y�
Description: The Kill Trace Data commands (KT and KTD) delete all execution trace data captured by the MAJIC probe. Unless the Y operand is specified, KT and KTD prompt for confirmation before deleting the data.
KT and KTD perform the same function. Both names are supported for compatibility with older versions of the MON command language.
108 0380-0163-10 Rev 2.01 MAJIC User’s Manual

MON Command Language 5
L Load
Availability: MONICE, API
Syntax: L ���-�N�O scn_types��filename���� ������
Description: The Load command downloads one or more executable files to target memory, loads symbol information from the files into the debugger’s symbol table, and prepares the program for execution. The -�N�O scn_types operands can be used to specify the section types to load or execute from loading for subsequent files.
In addition to loading the program files and symbol tables, the Load command can produce a number of other “side effects” controlled by several configuration options (see Configuration Options on page 159). Specifically:
• If the Reset_At_Load option is on (the default), Load first performs a Reset operation equivalent to the R command (see page 116).
• If the Load_Osboot option is on (default is off), Load automatically loads the program file whose name is osboot.sys before the files specified on the Load command itself.
• If the Load_Entry_Pc option is on (the default), after the load is completed, the PC is set to the entry point address contained in the first filename.
Each of the file names and their respective scn_types are remembered for future Load commands until explicitly changed in a subsequent Load command.
So if there is no filename explicitly specified, the current program is reloaded. In this case the symbol table is not normally reloaded, but you can use the -O option to force a reload. If new files to be loaded are specified, the existing global symbol table is purged and symbols are loaded from the new files by default.
scn_types A set of letters specifying section types to load (-O) or not load (-NO):
t text (program code)
d data (initialized data)
b bss (uninitialized data)
l literals (read-only initialized data)
s symbols
filename specifies an executable file to be loaded according to the current scn_types.
Examples: L // reload the current program (using the current options)
L -o db // reload only data and bss sections of current programL -o ts myprog // load text and symbols of myprogL myboot -no s myprog1 -o tdbls mymain
// load all sections and symbols of myboot, load all but // symbols of myprog1, load all of mymain
MAJIC User’s Manual 0380-0163-10 Rev 2.01 109

5 MON Command Language
LN Load Names
Availability: MONICE, API
Syntax: LN�A�O� �filename�����
Description: The Load Names command reloads symbols for the current program, or loads symbols from the specified files. The new symbols will replace any existing symbols by default, or they can be added to the existing symbols.
LN, LNO Overwrite the existing symbol table.
LNA Add to the existing symbol table.
filename The name of an executable file whose symbols are to be loaded.
See also the Load command on page 109.
110 0380-0163-10 Rev 2.01 MAJIC User’s Manual

MON Command Language 5
MB, MD, MH, MW
Move Move Reverse
Availability: MONICE, EDBMON, API
Syntax: M�type� range, addr
MR�type� range, addr
Description: This command copies data in range to the destination beginning at addr.
The source data and destination address do not need to be in the same address space. For example, registers can be dumped to or loaded from memory by the Move command.
The data is normally copied forward from the starting addresses in the source and destination ranges, one type-sized piece at a time, with the resultant predictable destructive effect if a portion of the range implied by addr falls within range. If R is specified, the command becomes Move Reverse and the data will be copied backwards from the ending address in the source and destination ranges. In this case an overlapping upward move will be non-destructive, while an overlapping downward move will be destructive. Of course if the source and destination are in different address spaces, a move can only be destructive if the two spaces overlap in the same physical memory.
type Specifies the object size. Has the form: �B�H�W�D�.�where B is for Byte, H is for Half-word, W is for Word, and D is for Double word. The default is the type specified in the previous Move command or W, if this is the first Move command.
range Specifies the address space plus starting and ending addresses of the source data. See Address Range on page 134 for more details.
addr Specifies the address space plus the starting address of the destination. The ending address is implied by the length of range.
Examples: mw a0 a3, t0 // move argument registers a0..a3 to t0..t3.
mw 3000:0 l 4, r1 // move four words to registers r1..r4.
mrb 1000:1 10fe:1,1001:1 // move up one byte non-destructively.
MAJIC User’s Manual 0380-0163-10 Rev 2.01 111

5 MON Command Language
MC Memory Configuration
Availability: ALL
Syntax: MC �range�, mc_opt� ��� �
Description: The Memory Configuration command allows display and configuration of the following properties of the target’s physical address space:
• Invalid address ranges.
• Address ranges where the MAJIC probe can use the faster DMA access method to read/write values.
• Address ranges where partial word access is allowed.
See Memory Configuration on page 33 for more information.
Entered without any parameters, MC displays configuration information for the entire addressing space. If range is given but not mc_opt, the configuration of the specified address range is displayed. If an mc_opt is given, the setting is applied to the specified address range.
range Specifies a range of physical memory to be displayed or where the specified options apply. range must specify the physical address space (:p).
mc_opt �JAM�DMA�INV�
�PWD�PWE�
JAM the MAJIC probe uses “instruction jamming” (executing Load/Store instructions) to access target memory.
DMA When supported by the target processor, the MAJIC probe uses DMA to access target memory.
INV the MAJIC probe never accesses the target memory.
PWD Partial word access is disabled, so the MAJIC probe reads/modifies/writes full words when accessing the target memory.
PWE Partial word access is enabled, so the MAJIC probe accesses bytes and half words in a single operation.
112 0380-0163-10 Rev 2.01 MAJIC User’s Manual

MON Command Language 5
MT Memory Test
Availability: MONICE, EDBMON, API
Syntax: MT range �,mt_id��,�H�V�Q�S���������,repeat_cnt��
MT range,8,delay�,�H�V�Q�S���������,repeat_cnt��
MT range,mt_loop�,data� �,repeat_cnt�
Description: The Memory Test command initiates a test of the target’s memory system, or one of three “scope loops”.
range Specifies memory space, starting and ending addresses to be tested.
mt_id Is a decimal number specifying the test type. The default is 9.
mt_loop Is a decimal number specifying a type of scope loop.
delay Is a decimal number specifying the delay time in milliseconds, between writes and reads. It is required only for test 8 (refresh test).
data Specifies that data and its one’s complement are alternatively written. (Required if mt_loop = 11 or 12.)
H Halt-on-error: prompt to abort testing upon error.
V Verbose: constant updates on test in progress.
Q Quiet: pass completions are not reported individually.
S Silent: errors are not reported individually.
repeat_cnt Is a decimal number specifying the number of times to run the test. Default is forever. Either mt_id, mt_loop, H, V, Q, or S is required if repeat_cnt is to be specified.
1 Basic patterns
2 Walking 1’s and 0’s
3 Rotating address
4 Inverted rotating address
5 Partial word access
8 Refresh
9 Each of 1, 2, 3, 4, and 5 in turn.
10 read only
11 write only
12 write then read
MAJIC User’s Manual 0380-0163-10 Rev 2.01 113

5 MON Command Language
Q Quit
Availability: MONICE
Syntax: Q �Y�
Description: The Quit command terminates execution of the debug monitor and returns control to the host operating system.
Normally you will be prompted for confirmation before the debugger actually exits. If you would prefer not to be prompted, or if you want to issue the Quit command from a command file, you can supply the “answer” in advance by supplying the optional parameter “Y”.
If you wish, you can “permanently” remove the prompt by creating an alias for the Quit command in the ustrtsys.cmd file: EA Q Q Y.
114 0380-0163-10 Rev 2.01 MAJIC User’s Manual

MON Command Language 5
+Q, -Q Enable or Disable Quiet Mode
Availability: ALL
Syntax: �+Q�-Q�
Description: This command enables or disables Quiet mode of command file playback. Normally, the debugger prompts and commands read from the command file are displayed just as they would be if the commands were entered from the keyboard. But when Quiet mode is active, the debugger does not display prompts and commands while reading commands from a file.
NOTE: Quiet mode is automatically turned on while a command alias is being executed. When the alias command is finished, the original state of Quiet mode is restored.
See also +/-Q on page 70.
i
MAJIC User’s Manual 0380-0163-10 Rev 2.01 115

5 MON Command Language
R, RP, RT Reset
Availability: MONICE, EDBMON, API
Syntax: R
RP
RT
Description: The RP (Reset Processor) command resets only the processor.
The RT (Reset Target) command resets the whole target system.
The R (Reset) command performs either an RP or RT, depending on how the Ice_Reset_Output option is set.
Certain CPU registers will be initialized as specified in the processor’s data sheet for a reset operation, and the current execute location (PC) will be set back to the address specified by the Reset_Address option.
116 0380-0163-10 Rev 2.01 MAJIC User’s Manual

MON Command Language 5
SHIFT UNSHIFT
Shift/Unshift
Availability: ALL
Syntax: SHIFT �number�
UNSHIFT �number�*�
Description: The SHIFT and UNSHIFT commands change the correspondence between the arguments supplied on an “FR C filename” command and the formal parameter tokens within the command file.
Normally, the first argument is substituted for $$1, the second argument for $$2, and so forth. The SHIFT command increments the argument number that corresponds to each parameter number, effectively shifting the argument array so that a given range of parameter numbers refer to a higher range of arguments. The UNSHIFT command reverses this effect. Argument shifting is very useful when you want to perform the same series of actions repetitively on an unknown number of argument (or groups of arguments).
number is the number of arguments to shift or unshift.
* is valid only for UNSHIFT, and it restores the arguments so that $$1 again refers to the first argument.
See also Shift/Unshift Commands on page 68.
NOTE: The $$0 parameter is also affected by shifting: if there were originally 10 arguments, after a SHIFT 2 command $$0 will be replaced with 8. $$* is not affected by shifting - it is always replaced with the entire argument list.
Examples: The following command file will display the contents of a series of ranges. It expects an argument list of the form:
addr count �addr count�����if ($$0 < 2) { dv "Expected address and count\n";
goto done }
:loop
dw $$1 L $$2
shift 2
if ($$0 >= 2) { goto loop }
:done
NOTE: The first if command in the example, like all debugger commands, must be entered on one line.
i
i
MAJIC User’s Manual 0380-0163-10 Rev 2.01 117

5 MON Command Language
S Step
Availability: MONICE
Syntax: S�F�O��Q�V� �=addr� �number� �{�cmd_list�}�
Description: This command executes number instructions (default is 1) starting at addr (default is the current execute address), one at a time. Execution terminates after number instructions, or when a breakpoint is encountered. If a command list is given, it is executed every time execution or stepping stops. It remains in effect until canceled by a Step or Go command with an empty command list (e.g. “S {}”).
A Step command may be repeated by hitting the <Enter> key, until some other command is entered.
O Step Over (SO) allows the current instruction to fully complete before returning control to the debugger prompt. In this mode, both subroutines and exceptions are allowed to finish before control is returned to the user.
F Step Forward (SF) steps into calls but over exceptions (including interrupts).
V Verbose mode. When a step count is given, each instruction will be displayed before it is executed. A side effect of this is that breakpoints are not enabled.
Q Quiet mode. When a step count is given, nothing is displayed until execution terminates, at which point the next instruction to be executed is displayed.
Q/V If neither Q nor V are specified, the mode of the previous Step command is retained, with Quiet mode as the initial default.
=addr If specified, this is the address where stepping begins. Otherwise stepping begins at the current Program Counter location. Note: the address must be in a valid address space for instructions. addr must be an address in a valid code address space. See addr and expr in Address on page 125 and Expression on page 129, respectively.
number The (decimal) number of instructions to be executed. If not specified, one (1) instruction will be executed. In Quiet mode, execution will terminate before number instructions have been executed if a breakpoint is encountered. number is decimal by default. See Number on page 133 for more information.
cmd_list If specified, the list of commands will be executed each time execution stops for any reason. This type of automatic command list is useful for displaying interesting values every time execution stops. If execution stops due to hitting a breakpoint that also has an associated command list, the breakpoint’s command list is
118 0380-0163-10 Rev 2.01 MAJIC User’s Manual

MON Command Language 5
executed first. A cmd_list may contain a Go or Step command, in which case program execution will resume automatically. Note that it is legal for additional commands to follow a Go or Step command in a command list. They will be stacked for execution in the proper order when execution finally stops for the last time, but this can be confusing. It’s recommended that this situation be avoided by making sure that a Go or Step is the last command to be executed in the list.
Remember, curly braces surrounding cmd_list are required and the entire Step command must be entered on one line. The current “end execution” cmd_list can be displayed with the BL command. It remains in effect until canceled by a Go or Step command with a new or empty command list (i.e. S {}).
A Step command may be repeated (except for the effect of =addr) until some other command is entered, simply by hitting <Enter> at the MON> prompt.
Examples: s 100 {if (@global_var<100) {s 100}{dv "clobbered global_var = %ld\n", @global_var} }
This examples executes the program, 100 instructions at a time, until the variable global_var is detected to have an invalid value.
Note: This example, like all debugger commands, must be entered on one line.i
MAJIC User’s Manual 0380-0163-10 Rev 2.01 119

5 MON Command Language
SP Stop
Availability: MONICE, EDBMON, EDB
Syntax: SP
Description: The Stop command halts a currently executing program in interactive mode. Interactive mode is normally entered via the go interactive (GI) command and allows a subset of debugger commands to be used while the program is executing.
120 0380-0163-10 Rev 2.01 MAJIC User’s Manual

MON Command Language 5
+TE, -TE Enable or Disable Trace Execution
Availability: ALL
Syntax: �+�-�TE
Description: When using a MAJICPLUS probe with a target processor that provides execution trace data, the +TE command enables capturing the trace data whenever the processor is executing. The -TE command disables trace capture. Execution tracing is normally enabled by default, and there is seldom any reason to disable it.
MAJIC User’s Manual 0380-0163-10 Rev 2.01 121

5 MON Command Language
VL Verify Load
Availability: MONICE, API
Syntax: VL ���-�N�O scn_types��filename���� ������
Description: The Verify Load command is used to verify that the program was downloaded correctly.
The Verify Load command is used to verify a program load. When no arguments are specified, all sections of all files previously downloaded are uploaded and checked against the original executable files.
scn_types A set of letters specifying section types to verify (-O) or not verify (-NO):
t text (program code)
d data (initialized data)
b bss (uninitialized data)
l literals (read-only initialized data)
filename If specified, the executable file filename is uploaded from the target and verified against the original COFF file. Otherwise, the previously loaded file(s) are verified. The sections to verified are determined by scn_types.
122 0380-0163-10 Rev 2.01 MAJIC User’s Manual

MON Command Language 5
! Execute Operating System Shell
Availability: MONICE
Syntax: !�os_command�
Description: The Execute Operating System Shell command allows the user to execute a host operating system command without having to exit the debug monitor. Remember that ! must be either last or alone in a cmd_list. Furthermore, attempts to insert debug monitor comments within the os_command will result in them being sent to and interpreted by the operating system with the rest of the os_command text.
os_command is any valid operating system command. If it is not supplied, a command shell is started up allowing you to execute any number of host commands, finally returning to the debugger by executing the operating system’s “exit” (MS-DOS, UNIX) command.
MAJIC User’s Manual 0380-0163-10 Rev 2.01 123

5 MON Command Language
Debug Monitor OperandsThis section describes the operands common to many of the commands in the MON command language.
With the exception of the fmt operand, symbolic names, and UNIX filenames; commands and operands are not case sensitive. Commands are usually formed from the first letter of each word in the spoken command name. Command names are of the form Action, Action Object, or Object Action (e.g. Go, Display Word, or File Read). The commands were chosen to be easy to remember and the command mnemonics are simple abbreviations. The number of basic commands are kept to a minimum. There is one Display command, for instance.
A summary of all operands is listed in Debug Monitor Operands on page 175.
124 0380-0163-10 Rev 2.01 MAJIC User’s Manual

MON Command Language 5
addr Address
Syntax: memory addresses:
�number �(expr)��:space� sym_name
expr
register addresses:
�.�reg_name�.field�
debugger local addresses:
$ident
Description: This operand specifies the location of an object. An address consists of an offset and a space. An offset is a 32 or 64 bit value giving the byte address of an object relative to the start of an address space (virtual memory, physical memory, general register, etc.).
There are three classifications of addresses: memory addresses, register addresses and “debugger local” addresses. For a description of “debugger local” address space, see Debugger Local Variables on page 66. The register addresses reference the processor’s general and special registers, user-defined registers, and optionally specific bit fields within registers.
The memory addresses reference data and instruction memory or memory mapped devices. These addresses include virtual address segments, and physical (main) memory. The MIPS architecture defines memory in terms of virtual address segments (e.g. kseg0, kuseg) mapped into a common physical address space. The debugger accesses data or instructions either by their physical address (:P) or by their virtual address, which may be expressed as an offset from the start of an address segment. (For more information, see the space operand in Address Space Designator on page 138.)
number Specifies an offset in bytes from the start of a space. The default base for number is hexadecimal. If an ambiguity arises between a hex digit string, and a sym_name or reg_name, the symbol always takes precedence. In such cases, the hex digit string must be preceded by 0x.
expr Specifies both offset and a space. An expr must be enclosed in parentheses to allow addition of an explicit space designator. The offset will be aligned to a word boundary for word objects, and to a half word boundary for half word objects. The offset for double words is rounded to either 32 or 64 bits depending on the processor bus width.
space Specifies the memory address spaces. If a space is not explicitly indicated, a virtual address is assumed. See Address Space Designator on page 138.
MAJIC User’s Manual 0380-0163-10 Rev 2.01 125

5 MON Command Language
This operand must be appropriate for the command being invoked. For example, the Go and Step commands require virtual address segments; physical addresses may not be used.
sym_name An ident specifying the name of a global or static variable, or function in the program being debugged, or a name previously defined via EA (refer to Enter Names on page 94).
reg_name An ident specifying the name of a processor register. In general, MON recognizes the register names documented in the processor’s data sheet, as well as any names read from a Register Definition File. See Register Name on page 135 for a list of the register names for your processor.
field An ident specifying the name of a specific bit field within a register that contains multiple fields. The complete field breakdown is shown when such a register is displayed, but the reg_name.field syntax allows a single field to be easily displayed or modified.
ident An ident naming a debugger local variable. The name will be defined and assigned an address the first time it is referenced.
Sometimes an ident may match a valid symbol name and a register name, and may even be a valid hexadecimal number as well. In such cases, it will be interpreted as the symbol name by default, and will need to be prefixed with “.” to be interpreted as the register name, or 0x to be interpreted as the hex number. For example, a0 is a sym_name if it exists, while .a0 is always the MIPS reg_name, and 0xa0 is always the number.
An addr that consists of a special register field name (such as SR.IEC) is a special case. It can be used in Display and Enter commands, but it cannot appear in any other context, and ranges of fields are not supported.
Examples: 1000 // Virtual address 0x1000.
1000:u // MIPS. Same as above: virtual address 0x1000.
0n1000 // Virtual address 1000 (decimal).
1000:0 // MIPS. Offset 0x1000 in kseg0 (virtual address // 0x80001000 or FFFFFFFF80001000 depending on// CPU type).
1000:p // Physical location 0x1000 (pointed to by virtual// addresses 1000:1 and 1000:0).
@0x1234:1 // Location whose virtual address is fetched from// offset 1234 in kseg1.
R16 // General Register $16. This register can also be// referred to by its software name S0.
SR // The current processor Status Register.
sr.kuc // The current value of the Kernel/User mode bit.
126 0380-0163-10 Rev 2.01 MAJIC User’s Manual
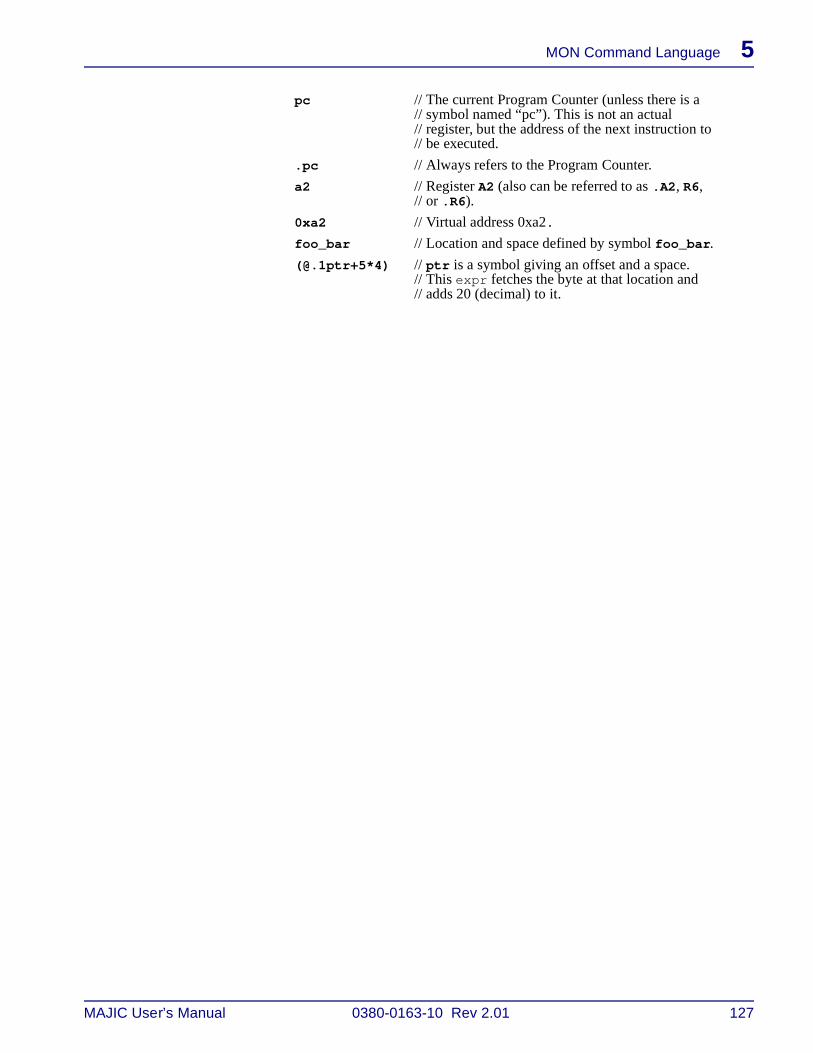
MON Command Language 5
pc // The current Program Counter (unless there is a// symbol named “pc”). This is not an actual// register, but the address of the next instruction to// be executed.
.pc // Always refers to the Program Counter.
a2 // Register A2 (also can be referred to as .A2, R6,// or .R6).
0xa2 // Virtual address 0xa2.
foo_bar // Location and space defined by symbol foo_bar.
(@.1ptr+5*4) // ptr is a symbol giving an offset and a space.// This expr fetches the byte at that location and// adds 20 (decimal) to it.
MAJIC User’s Manual 0380-0163-10 Rev 2.01 127

5 MON Command Language
cmd_list Command List
Syntax: command �; command����
Description: This operand specifies one or more commands to be executed. The debugger accepts command lists, as well as simple commands, in response to the main prompt or when playing back a command file. In this case the commands are executed immediately. Some commands also accept a cmd_list enclosed in curly-braces as an operand (such as IF, BS, S, G).
A null cmd_list in response to a MON> prompt will result in the previously entered command being repeated if it was a “repeatable” command such as Display or Enter. Note that empty lines in a debugger Command File are equivalent to hitting <enter> at the prompt.
command is any valid debugger command or alias. With the exception of the fmt operand, symbolic names, and UNIX filenames; commands and operands are not case sensitive.
The following commands MUST be either the last command or alone in a cmd_list: EA, L -c, and !, and any interactive commands (such as “EW” with no list of values).
Command lists (and individual commands themselves within reason) may contain embedded comments as described under Command Lists on page 72.
Quiet mode (described under Enable or Disable Quiet Mode on page 115) is automatically turned on while a command alias is being executed. When the alias command is finished, the original state of Quiet mode is restored.
Examples: dw a2
dw var; g
fr c setup.cmd
s 100; dw pe; g
l -o s prog.elf;s 10; dw @loop_count l 10
128 0380-0163-10 Rev 2.01 MAJIC User’s Manual

MON Command Language 5
expr Expression
Syntax: addr
(expr)
expr op expr
unary-op expr
Description: This operand describes the expressions constructed from addresses. Expressions combine addresses using the operators listed below. Parenthesized sub-expressions are allowed.
All arithmetic and comparisons are performed in unsigned 64-bit integer mode, even if the operands appear signed. For instance, “-1” is treated as the unsigned value “0xffffffffffffffff”. This also means that the right shift operation always zero fills the high order bits.
The operators are listed below in order of decreasing precedence. Unless modified by parentheses, the associativity of operators of the same precedence is left-to-right except unary operators, which associate right-to-left.
Type information (int, float, pointer-to, etc.) is not available. All numeric operands are assumed to be integers, all arithmetic is performed unsigned, and symbols evaluate to their address.
Note: The indirection operator is “@”, rather than the normal C operator “*”. This is to emphasize that MON does not have the data type information that the C operator requires. “@” means “fetch the address at”, so a full word (or double word,
( ) Parenthesized sub-expressions
unary-op + - ~ ! @ Unary plus, unary minus, bit wise complement, logical NOT, address at
@.�1�2�4�8� 1, 2, 4, or 8 byte value at (indirection)
op * / % Multiply, Divide, Modulo
+ - Add, Subtract
<< >> Left shift, Right shift
< <= > >= Relational
== != Equals, Not equals
& Bitwise AND
^ Bitwise XOR
| Bitwise OR
&& Logical AND
|| Logical OR
i
MAJIC User’s Manual 0380-0163-10 Rev 2.01 129

5 MON Command Language
for 64-bit MIPS targets) will always be fetched. @.digit causes digit bytes (1, 2, 4, or 8) to be fetched from addr.
Any reference to a register designator or symbolic name is replaced by the address of the object, not its contents. The first such reference in the expression will also cause the register or symbol’s address space (e.g. “General Registers” or “kuseg”) to become the address space associated with the whole expression. This may sound strange, especially since most debuggers do not support the concept of address spaces, but in most cases the results are what you would expect without thinking about it.
Examples: main + 20 // Location 32 bytes after the symbol main.
@R2 // Location in memory whose virtual address is in R2/V0.
@PC // Location of the next instruction to be executed.// Indirection through .PC is especially useful. The// command “DW @PC L 10,i” will disassemble the 10// instructions beginning with the next instruction to be// executed.
@RA // After reaching a breakpoint set at the start of a function,// G @RA could be used to continue execution until the// function returns to the caller.
@ptr // Virtual address pointed to by the value at the location// defined by the symbol ptr.
(@ptr+5*4) // ptr is a symbol that describes a location in some// address space. This expr fetches the word at that// location and adds 20 (decimal) to it.
(@ptr)|8 // Value at ptr or’ed with 8.
130 0380-0163-10 Rev 2.01 MAJIC User’s Manual

MON Command Language 5
fmt Data Format
Syntax: �d�u�o�x�X�f�e�E�g�G�c�s�i�
Description: The fmt operand specifies the format used by the Display and Enter commands, as follows:
d Signed decimal integer.
u Unsigned decimal integer.
o Unsigned octal integer.
x�X Unsigned hexadecimal integer. Default is “X”.
f Signed floating point value in decimal notation, with six decimal places.
e�E Signed floating point value in scientific notation, with six decimal places.
g�G Signed floating point value in either decimal or scientific notation, whichever is more compact.
c Single ASCII character.
s Character string.
i Assembled/disassembled instruction (see Enter Data on page 90).
The case of the x, e, and g formats determines whether alphabetic characters in the formatted data will be in upper or lower case. The fmt operand is the sole exception to the rule that keywords are not case-sensitive in monitor commands.
Some formats are not valid for some object sizes. Refer to the table below for valid combinations.
See Display/Find Data on page 81 and Enter Data on page 90 for examples.
Type Valid Formats:
for Enter for Display
B d, u, o, x, X, c, s d, u, o, x, X, c, s
H d, u, o, x, X d, u, o, x, X
W any except c or s any except c or s
D f, e, E, g, G, x, X f, e, E, g, G, x, X
MAJIC User’s Manual 0380-0163-10 Rev 2.01 131

5 MON Command Language
ident Identifier
Syntax: �A��Z�a��z�_ ��A��Z�a��z�0��9�$�_ �. �����
Description: ident specifies the name of an entity known to the debugger. The type of entity depends on the context. It can be a symbol, register, command file label, debugger local variable, command alias, or trace filter.
NOTE: ident is case sensitive only for symbol names and debugger local variable names. For all other uses, ident is not case sensitive.
i
132 0380-0163-10 Rev 2.01 MAJIC User’s Manual

MON Command Language 5
number Number
Syntax: �0x�0n�0o� digit_string
Description: The number operand is used in address expressions and to specify counts in commands.
Ox Specifies that digit_string is hexadecimal (base 16), regardless of the context.
On Specifies that digit_string is decimal, regardless of the context.
Oo Specifies that digit_string is octal (base 8), regardless of the context.
digit_string A series of digits in the specified radix, or the default radix for the context in which number appears.
The default number base is hexadecimal for addr and mask, elsewhere it is decimal. If there is a conflict between a hexadecimal number and a register name or symbolic name, the 0x base must be explicitly provided.
Note: Unlike standard “C” notation, a leading zero does not specify octal.
Examples: 0o377 == 0ff == 0xff == 0n255 == 255
i
MAJIC User’s Manual 0380-0163-10 Rev 2.01 133

5 MON Command Language
range Address Range
Syntax: �addr���L number�addr addr2
*�:space�
Description: The range operand specifies the location of one or more objects in either a memory address space or a register space for the Display and Enter commands.
addr Specifies the starting address for the range.
number Decimal number of objects in the range.
addr2 addr specifying the last address in the range.The range consists of the objects through and including the object at this address.
*�:space� All addresses in the virtual or specified memory space.
If addr is not supplied, the range begins where the range of the previous Display or Enter command left off, or at virtual address 0 if this is the first Display or Enter command. If neither “L number” nor addr2 is supplied, the range consists of a default number of objects.
Examples: 100:0 L 10 // 10 objects beginning at offset 100 in kseg0 space.
my_ptr // Default number of objects at offset in space// indicated by the symbol my_ptr.
dw 0 l 10 // Display 10 words.
db 0 L 10 // Display 10 bytes.
db 0 10 // Display 11 bytes.
134 0380-0163-10 Rev 2.01 MAJIC User’s Manual

MON Command Language 5
reg_name Register Name
Syntax: See tables below.
Description: The reg_name operand is used to specify the address of any of the processor’s internal registers or, in the case of PC, the current execution address. Some registers have multiple names such as a generic name as well as the specific name defined in the processor architecture manual.
In addition to the predefined names listed below, reg_name may be a user-defined register name. See Register Definition File on page 23 for details. If a reg_name matches the name of a symbol in the program being debugged, the name must be prefixed with a “.” to be recognized as a register name.
MIPS Register Names
Register Name Description
r�0��31� Generic names for the 32 general registers.
zero Register r0 (always has the value 0).
at Register r1 (Assembler Temporary).
v0�v1 Registers r2 and r3 (results/expressions).
a0��a3 Registers r4��r7 (Arguments).
t0��t9 Registers r8��r15 and r24��r25 (Temporaries).
s0��s8 Registers r16��r23 and r30 (Saved temporaries).
k�t��0�1� Registers r26 and r27 (Kernel/OS Usage).
gp Register r28 (Global data Pointer).
sp Register r29 (Stack Pointer).
ra Register r30 (Return Address).
mdhi�mdlo Multiply/divide special registers.
g�0��2�_�0��31� General registers $0��$31 for coprocessors 0..2.
c�0��2�_�0��31� Control registers $0��$31 for coprocessors 0..2.
fgr�0��31� Alternate naming convention for Coprocessor 1 general registers $0��$31.
fcr�0��31� Alternate naming convention for Coprocessor 1 control registers $0��$31.
MAJIC User’s Manual 0380-0163-10 Rev 2.01 135

5 MON Command Language
ARM Register Names
�f�d��0��31� Alternate naming convention for Coprocessor 1 general registers $0��$30 (only even numbers are valid). An f reference implies single precision, a d double precision.
sr�cause�epc�prid�index��random�entrylo�context�badvaddr�entryhi
System coprocessor (CP0) registers
tle# // TLB entry #Lo, even
tlo# // TLB entry #Lo, odd
th# // TLB entry #High
tm# // TLB entry #Mask
pc The current Program Counter. This is not an actual register, but the address of the next instruction to be executed.
Register Name Description
r0, r1, r2, r3, r4, r5, r6, r7, cpsr
Unique registers.
r8, r9, r10, r11, r12, r13, sp, r14, lr, r15, pc, spsr
Banked registers, selected by the mode of the processor (as determined by the 5 LSBs currently found in cpsr).
r8_fiq, r9_fiq, r10_fiq, r11_fiq, r12_fiq, r13_fiq, r14_fiq, sp_fiq, lr_fiq, spsr_fiq
Selects the FIQ mode registers.
r8_user, r9_user, r10_user, r11_user, r12_user, r8_usr, r9_usr, r10_usr, r11_usr, r12_usr
user indicates non-FIQ mode registers.
r13_user, r14_user, lr_user, sp_user, r13_usr, r14_usr, lr_usr, sp_usr
Selects the user mode or system mode registers.
r13_svc, r14_svc, sp_svc, lr_svc, spsr_svc
Selects the supervisor mode registers.
r13_irq, r14_irq, sp_irq, lr_irq, spsr_irq
Selects the IRQ mode registers.
Register Name Description
136 0380-0163-10 Rev 2.01 MAJIC User’s Manual

MON Command Language 5
Examples: r5
.a1
c0_12
CAUSE
sr.bev
mdhi
r13_abort, r14_abort, sp_abort, lr_abort, spsr_abort, r13_abt, r14_abt, sp_abt, lr_abt, spsr_abt
Selects the Abort mode registers.
r13_undef, r14_undef, sp_undef, lr_undef, spsr_undef, r13_und, r14_und, lr_und, sp_und, spsr_und
Selects the Undefined mode registers.
Register Name Description
MAJIC User’s Manual 0380-0163-10 Rev 2.01 137

5 MON Command Language
space Address Space Designator
Syntax: See tables below
Description: The space operand specifies an explicit address “space” for the address value it is applied to. If no space is given, the address value is an offset in the default virtual memory address space. In addition to the default virtual memory space, MON supports the following spaces for all processors.
Space Designators For All Processors
The MIPS architecture maps several virtual address segments into a common physical address space. These segments are not distinct address spaces in the usual sense. Instead, accessing a memory location through a segment implies: a base address in physical memory, the privilege level required to access the memory, and a cacheable or uncacheable attribute. Refer to a description of the MIPS RISC architecture for the complete details of memory segments.
The space designator tells the debugger to use the physical space, or to modify the given virtual address by adding the base address of the segment specified. (See Address on page 125.)
The exact mapping from virtual address to physical address is dependent on the particular processor variant in use.
Space Designators for 32-bit MIPS Processors
Space Location
:P Physical Memory space
:DA Debug Agent Memory space
Space Location
:U offset from kuseg (default): 0
:0 offset from kseg0: 0x80000000
:1 offset from kseg1: 0xA0000000
:2 |:S offset from kseg2: 0xC0000000
:3 offset from kseg3: 0xE0000000
:R offset from reset vector: 0xBFC00000
138 0380-0163-10 Rev 2.01 MAJIC User’s Manual

MON Command Language 5
Space Designators for 64-bit MIPS Processors
Space Location
:U offset from kuseg (default): 0
:XU offset from xuseg: 0
:XS offset from xsseg: 0x4000000000000000
:XP offset from xkphys: 0x8000000000000000
:XK offset from xkseg: 0xC000000000000000
:0 offset from kseg0: 0xffffffff80000000
:1 offset from kseg1: 0xffffffffA0000000
:R offset from reset vector: 0xffffffffBFC00000
:S offset from sseg: 0xffffffffC0000000
:3 offset from kseg3: 0xffffffffE0000000
MAJIC User’s Manual 0380-0163-10 Rev 2.01 139

5 MON Command Language
string String Literal
Syntax: "text"
Description: Quoted strings are used in string format find (DB,s) commands, string format Enter Byte commands, and in the Display Value command.
text is any sequence of printable characters. Non-printable characters may be included by using any of the following C-style “escape sequences”:
To perform a “DB,s” command with no search value, or an interactive “EB,s” command, the debugger searches for a null character as the string terminator and automatically inserts a null at the end of a replacement string. But to perform a search for a specific string (DB,s= “string”) or non-interactive Enter (EB,s= “string”), the debugger will neither require a null character for the string to match, nor insert a null automatically at the end of a replacement string. Such strings can be explicitly given a null terminator by including \0 immediately before the closing quote.
\b backspace (0x08)
\f formfeed (0x0C)
\n newline (0x0A)
\r carriage-return (0x0D)
\t tab (0x09)
\v vertical tab (0x0B)
\” quote
\’ apostrophe
\\ backslash
\ooo octal value (ooo is 1 to 3 octal digits)
\xhh hex value (hh is 1 or 2 hex digits)
140 0380-0163-10 Rev 2.01 MAJIC User’s Manual

MAJIC User’s Manual 0380-0163-10 Rev 2.01
6
Tracing and Trace PointsTracing is the ability to store or capture successive states of the target processor’s operation. This information represents the processor’s flow of execution through the program under test, and in some cases, data loads and stores as well. Once a Trace Acquisition has been completed, it may be displayed by the debugger to show a record of program flow. Most often this information is used to see how the program made its way to a breakpoint, but in many cases you can use triggers to capture an event in your system without stopping program execution. In some cases, you can even display the trace data and then re-arm a new acquisition without stopping program execution.
This chapter explains the trace buffer, trace control logic, and trace point implementation of the MAJICMX and MAJICPLUS probes. It also shows examples of using the trace features with the MON Command Language, and EDBICE Trace Window. If you are using another debugger, please refer to their documentation for information on displaying trace data and setting control options from within their debugger.
Trace BufferThe Trace Buffer is dedicated memory that captures the trace information in real-time for subsequent processing and display. The collection of signals that are captured by each trace-clock cycle is known as a trace frame.
Some processors provide a trace buffer right on chip. The MAJICMX and MAJICPLUS probes read on-chip trace buffers via the JTAG interface. With some processors this may take place while the processor is running (see Concurrent Debug Mode on page 63); with other processors the execution must be stopped in order to retrieve the trace data.
Some processors emit trace data on special pins rather than accumulating it in an on-chip buffer. The MAJICPLUS probe provides its own trace buffer composed of high speed memory and control logic for capturing trace data presented on an external trace interface. The MAJICPLUS probe trace buffer is 512k frames deep, so as many as 512k trace-clock cycles may be captured.
141

6 Tracing and Trace Points
Killing the Trace Buffer
The contents of the trace buffer can be killed with the kt command (described in Kill Trace Data on page 108). This action cannot be undone. The trace acquisition is automatically killed when execution is restarted if the acquisition had been processed (displayed or saved). If execution resumes without having processed the acquisition, however, then trace acquisition also resumes (subject to trace control conditions, as described in Trace Control on page 149).
Trace Display Modes
The trace buffer can be displayed in either raw or formatted (disassembled) mode. The display format of each mode can be set by the user to show only those signals of interest, and assign meaningful names to the MAJICPLUS probe user inputs (or any other signal). Customizing trace displays is described in Trace Display Customization on page 147.
Many source-level debuggers provide a separate window to display the trace buffer. In EDBICE, a scroll bar is used to scroll through the trace buffer, and buttons or menu choices select the display mode and timestamp format. The Refresh button in the trace window uploads a new acquisition from the MAJIC probe, if there is one.
The dt command displays the trace buffer, and may also be used to select the display mode and timestamp format. The first dt command after a new capture normally starts with the most recent frame, and subsequent display trace commands move backward in time. It is also possible to start at any arbitrary frame number, and scroll in either direction. See Display Trace on page 87 for details.
Examples:
dt 1,i /*Display from the oldest frame, in instruction format*/
dt 1,rd /*Display oldest frames in raw mode with delta timestamp*/
dt $,i /*Display from most recent frames in instruction format*/
dt - /*Display next screen, scrolling backward in time*/
dt + /*Display next screen, scrolling forward in time*/
dt /*Display next screen in current direction*/
The EDBICE Session window also supports the display trace (dt) command, allowing the trace display to be logged in an ASCII file. This also allows you to view two regions of the trace capture, or view it in two different modes (one view in the Trace window and the other in the Session window).
NOTE: If your source-level debugger does not provide a trace window, you can use the DT command to display trace data. For information on entering MON commands in foreign debuggers, see MON Command Basics on page 71.
i
142 0380-0163-10 Rev 2.01 MAJIC User’s Manual

Tracing and Trace Points 6
Disassembled Trace Display
In disassembled, or formatted mode, the contents of the trace buffer are deciphered, and displayed as a history of disassembled instructions and possibly data. A sample disassembled trace display is shown below. .
The frame number indicates the frame’s location within the trace buffer. The oldest frame is number 1, more recent frames have higher frame numbers. In disassembled mode, the frame may not always increment by 1. This is because only those cycles where an instruction was executed or a data transfer completed are displayed. The address and instruction value are displayed next, followed by the disassembled instruction.
The EDBICE Trace window interleaves source lines wherever an instruction address corresponds to the first instruction of a source line. Clicking with the right mouse button on one of these source lines allows you to “hyperlink” the execution window view-point to the corresponding line in your source code. The eXDI Plug-In for Microsoft Platform Builder provides a similar trace window. The DT command does not provide any source information, but does include symbols where possible.
A time stamp can be displayed to show how much time elapsed between frames.The Time Stamp column may be disabled or enabled, and its display format may be changed by right-clicking in the trace window.
MAJIC User’s Manual 0380-0163-10 Rev 2.01 143

6 Tracing and Trace Points
Raw Trace Display In raw mode, the state of each of the traced signals is displayed for every captured cycle, along with the time stamp. The display has a header on top, including an indication of each signal’s polarity (active level). A sample raw trace display is shown below:
The frame number is in the left most column, with more recent cycles having higher numbers, and the oldest frame as number 1. In MONICE, the minus signs in the column separator (beneath the word “FRAME”) change to plus signs when scrolling forward in time.
NOTE: The raw trace information is not normally uploaded because this information is not typically useful. If you do want to view the raw signals, when using the MAJICPLUS mini-probes for example, you should enable the Trace_Upload_Raw configuration option (see page 166). You will need to refresh the window after changing this option.
Time Stamp
The MAJICPLUS probe trace buffer does not record a timestamp because the disassembly algorithm requires a continuous stream of information, so every clock cycle must be captured. However, not every cycle has information that is useful to the debugger, so normally only the frames that are useful are uploaded, and a timestamp is synthesized to account for those cycles which were filtered. This trace upload optimization can be defeated with the Trace_Upload_Raw configuration option (see page 166).
Although the MAJICPLUS probe disassembly algorithms for PCTrace and ETM require contiguous frames, there are two reasons why there may be gaps between periods of contiguous frames. The first is if program execution (and hence tracing) stops and is then restarted without first processing the trace buffer, either by user command or because a breakpoint is hit whose pass count has not been reached.
i
144 0380-0163-10 Rev 2.01 MAJIC User’s Manual

Tracing and Trace Points 6
The second is if a trace gate is used to control trace acquisition (see Conditional Tracing on page 151). When the disassembly algorithm encounters such gaps in the trace buffer, it reports a 1,000,000 cycle gap, because it cannot determine the actual duration of the gap.
NOTES:
• The on-chip trace buffer within the Intel® XScaleTM Micro-Architecture does not provide any timing information, so the timestamp simply increments by one on each frame.
• The Lexra internal trace buffer provides an optional stall counter. If present, the stall count is used to compute an approximate timestamp.
The time stamp can be displayed in three formats: the absolute number of cycles which have elapsed since Trace Control was enabled; the number of cycles relative to the first frame in the trace buffer; or the delta from each frame to the previously displayed frame. It is also possible to inhibit the time stamp display altogether. The display mode in effect is shown in the column header, beneath the word “TIMESTAMP”. By default, the timestamp is included in raw mode displays and omitted from disassembled displays, but the timestamp mode can be changed with the dt command, or by right-clicking in the Trace window.
MAJICPLUS Probe Trace Inputs
Each MAJICPLUS probe frame consists of all the target processor’s trace signals, several internal emulator signals, and optionally, 8 additional user probe signals. These signals are part of the “raw” information that normally is not uploaded. To upload these signals, you must make sure to enable the Trace_Upload_Raw option (described on page 166).
EJTAG/PCTrace Trace Signals
NOTE: Not all processors provide the same level of PCTrace support. The MAJICPLUS probe automatically detects the level of PCTrace that is supported, and reports that when the JTAG interface is initialized. The
i
Signal Description
PCSTA[2:0] This is the primary execution status code.
PCSTB[2:0] This is the second execution status code, if the trace clock is half or less of the internal pipeline clock.
PCSTC[2:0] This is the third execution status code, if the trace clock is one third or less of the internal pipeline clock.
PCSTD[2:0] This is the fourth execution status code, if the trace clock is one quarter of the internal pipeline clock.
TPC[7:0] This is the bus where PC information is presented. The processor may provide 1, 2, 4, or 8 TPC bits.
i
MAJIC User’s Manual 0380-0163-10 Rev 2.01 145
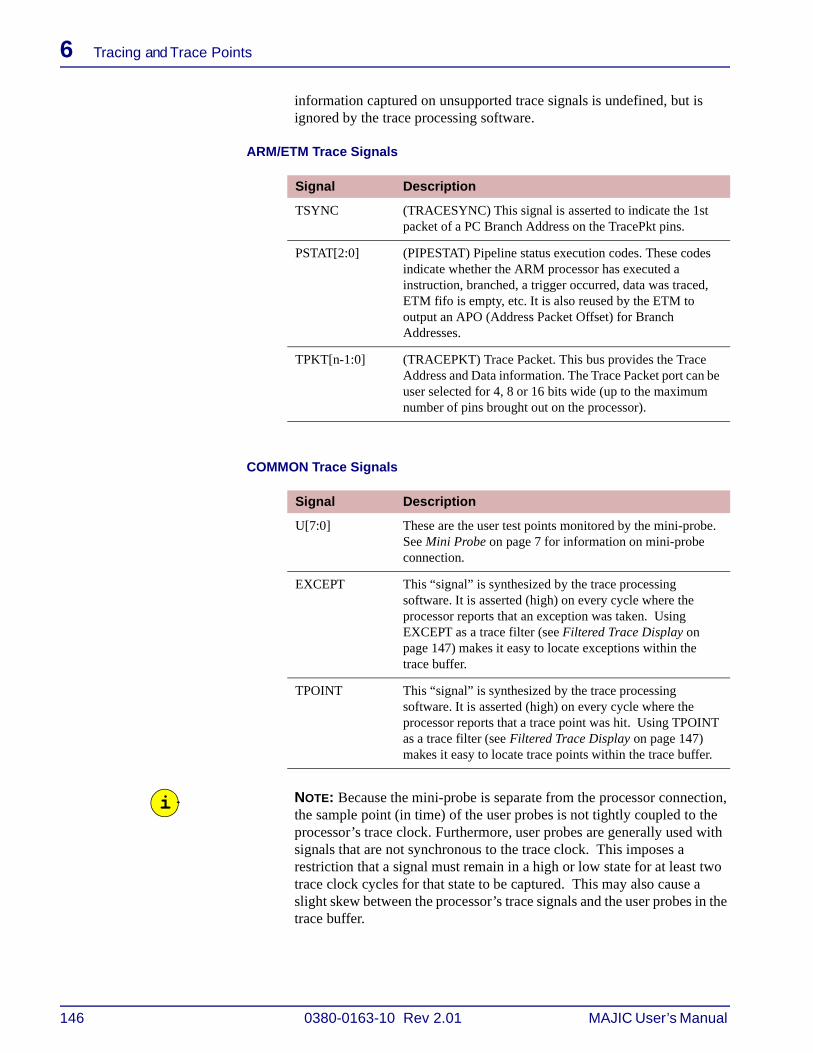
6 Tracing and Trace Points
information captured on unsupported trace signals is undefined, but is ignored by the trace processing software.
ARM/ETM Trace Signals
COMMON Trace Signals
NOTE: Because the mini-probe is separate from the processor connection, the sample point (in time) of the user probes is not tightly coupled to the processor’s trace clock. Furthermore, user probes are generally used with signals that are not synchronous to the trace clock. This imposes a restriction that a signal must remain in a high or low state for at least two trace clock cycles for that state to be captured. This may also cause a slight skew between the processor’s trace signals and the user probes in the trace buffer.
Signal Description
TSYNC (TRACESYNC) This signal is asserted to indicate the 1st packet of a PC Branch Address on the TracePkt pins.
PSTAT[2:0] (PIPESTAT) Pipeline status execution codes. These codes indicate whether the ARM processor has executed a instruction, branched, a trigger occurred, data was traced, ETM fifo is empty, etc. It is also reused by the ETM to output an APO (Address Packet Offset) for Branch Addresses.
TPKT[n-1:0] (TRACEPKT) Trace Packet. This bus provides the Trace Address and Data information. The Trace Packet port can be user selected for 4, 8 or 16 bits wide (up to the maximum number of pins brought out on the processor).
Signal Description
U[7:0] These are the user test points monitored by the mini-probe. See Mini Probe on page 7 for information on mini-probe connection.
EXCEPT This “signal” is synthesized by the trace processing software. It is asserted (high) on every cycle where the processor reports that an exception was taken. Using EXCEPT as a trace filter (see Filtered Trace Display on page 147) makes it easy to locate exceptions within the trace buffer.
TPOINT This “signal” is synthesized by the trace processing software. It is asserted (high) on every cycle where the processor reports that a trace point was hit. Using TPOINT as a trace filter (see Filtered Trace Display on page 147) makes it easy to locate trace points within the trace buffer.
i
146 0380-0163-10 Rev 2.01 MAJIC User’s Manual
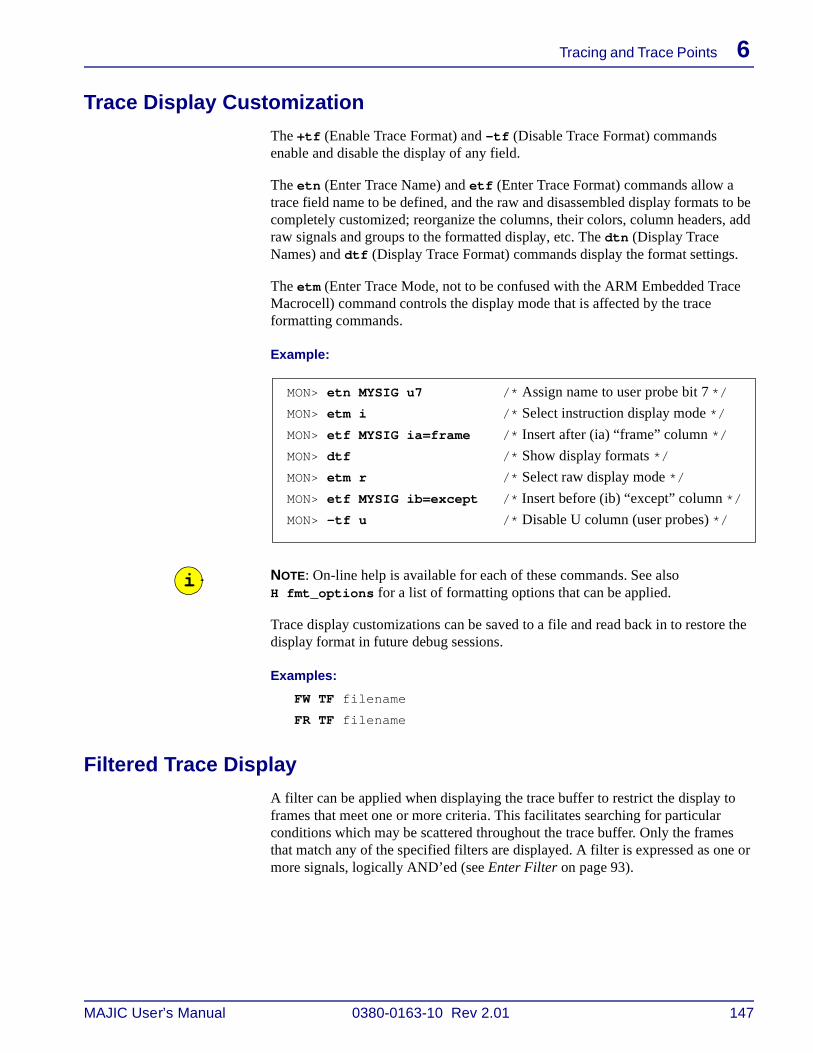
Tracing and Trace Points 6
Trace Display Customization
The +tf (Enable Trace Format) and -tf (Disable Trace Format) commands enable and disable the display of any field.
The etn (Enter Trace Name) and etf (Enter Trace Format) commands allow a trace field name to be defined, and the raw and disassembled display formats to be completely customized; reorganize the columns, their colors, column headers, add raw signals and groups to the formatted display, etc. The dtn (Display Trace Names) and dtf (Display Trace Format) commands display the format settings.
The etm (Enter Trace Mode, not to be confused with the ARM Embedded Trace Macrocell) command controls the display mode that is affected by the trace formatting commands.
Example:
NOTE: On-line help is available for each of these commands. See also H fmt_options for a list of formatting options that can be applied.
Trace display customizations can be saved to a file and read back in to restore the display format in future debug sessions.
Examples:
FW TF filename
FR TF filename
Filtered Trace Display
A filter can be applied when displaying the trace buffer to restrict the display to frames that meet one or more criteria. This facilitates searching for particular conditions which may be scattered throughout the trace buffer. Only the frames that match any of the specified filters are displayed. A filter is expressed as one or more signals, logically AND’ed (see Enter Filter on page 93).
MON> etn MYSIG u7 /* Assign name to user probe bit 7 */
MON> etm i /* Select instruction display mode */
MON> etf MYSIG ia=frame /* Insert after (ia) “frame” column */
MON> dtf /* Show display formats */
MON> etm r /* Select raw display mode */
MON> etf MYSIG ib=except /* Insert before (ib) “except” column */
MON> -tf u /* Disable U column (user probes) */
i
MAJIC User’s Manual 0380-0163-10 Rev 2.01 147

6 Tracing and Trace Points
Examples:
ef tpoint /* Display frames where TPOINT is asserted */
ef location = 0 FFFFF /* Display instructions executed infirst 1Meg */
df /* Display Filters */
-f1 /* Disable Filter 1*/
+f2 /* Enable Filter 2 */
It is an important distinction that the display of trace frames is filtered, not the accumulation of them. The filters may be enabled, changed, or disabled without affecting the contents of the trace buffer. Conditional capturing is accomplished using Trace Control features (see Trace Control on page 149).
NOTE: When trace filtering is enabled, but there are not many frames that match the filter(s), it will take a long time to refresh or scroll the trace window.
Searching for Trace Frames
Filters can be used to search for a particular condition by restricting the display to 1 frame. The following example shows how to find the first, second, and last call to strcmp:
Example:
NOTE: It is best to close the trace window during this process.
Trace Display Files
The trace buffer can be saved to a disk file, and later read back in. The file is a binary representation of the captured signals and buses, plus additional information derived from the traced information to identify instruction and data cycles.
When a trace file is read back in, it supersedes the existing trace information, and can then be displayed as usual. However, the symbolic information is not saved in the trace file, so no symbolic information is shown if a trace file is displayed without having the executable loaded. Furthermore, if the executable file which is loaded when a trace file is displayed is a different version than when it was captured, it could present misleading symbol information.
Only the entire trace buffer can be saved in this way - it is not possible to save only certain frames. Of course, it is possible to capture specific frames in an ASCII file by logging screen output, but such a file can get quite large. Also, it is not possible to read the trace information back into the debugger from an ASCII file.
i
MON> etm i /* Set trace mode = instruction */
MON> ef location = strcmp /* enter filter */
MON> dt 1 L 1 /* find first */
MON> <Enter> /* find next */
MON> dt $ L 1 /* find last */
i
148 0380-0163-10 Rev 2.01 MAJIC User’s Manual

Tracing and Trace Points 6
Examples:
fw td tbuf1 /* Saves the trace buffer as tbuf1.td */
fr td tbuf1 /* Reads tbuf1.td, superseding current traceinformation*/
fw o mytrace /* Opens a log file */
dt 1234 5678,i /* Displays and logs frames 1234 through 5678 in instruction format in ASCII*/
fw o - /* Closes the output log file */
Trace ControlBy default, trace information is captured whenever tracing is armed and the processor is executing. That way whenever a breakpoint is hit, the trace buffer provides a record of how the processor made it’s way through the program to reach that point. However, it is often desirable to capture only certain information based on criteria other than execution status.
The MAJICPLUS probe provides two basic means of controlling what information gets captured: a trigger defines a point in time when trace frame acquisition either starts or stops, thereby preserving either the history leading up to the trigger event, or program flow following the trigger event; a gate suspends trace frame acquisition while a certain condition is true, and resumes acquisition when the condition is no longer true. The MAJICPLUS probe provides several types of triggers and gates, and both techniques may be used together for more sophisticated scenarios.
With processors that provide a trace buffer on-chip, the MAJICMX or MAJICPLUS probes may not be able to provide the same level of control. The trigger capability depends on the trace buffer implementation of the processor.
Trace Enable
Trace acquisition is enabled by the +te command (or button), and disabled with the -te command (or by toggling the +te button). Tracing may be enabled and disabled without losing trace data that has already been acquired, so by using these commands in breakpoint command lists, you can selectively enable tracing only when executing in certain areas of your code. For best results, you should enable tracing prior to a function call or branch, as opposed to right at the function’s entry point or branch target.
Trace Triggers
Two configuration options are used to specify a trigger event and trigger action. Configuration options can be set with either the Option Settings dialog box, or the EO command, as described in Setting Configuration Options on page 32.
MAJIC User’s Manual 0380-0163-10 Rev 2.01 149

6 Tracing and Trace Points
NOTE: With the Intel® XScaleTM on-chip trace buffer, only Trace_Trigger_Action is supported; Trace_Trigger always behaves as in auto mode.
Trigger Position The Trace_Trigger_Action configuration option controls the trigger position.
Stop Trace acquisition starts when program execution starts, and stops when the trigger event occurs; this is the default, and is often referred to as a pre-trigger acquisition. If the trace buffer fills up before the trigger event stops the acquisition, then older frames are removed as necessary to make room for newer frames, until the trigger event. That way, the execution history leading up to the trigger event is preserved.
In the automatic trigger mode (described below), trace acquisition will resume when program execution is restarted. In any other trigger mode, once the trigger event has occurred, the trace buffer is preserved until the trace buffer has been processed (displayed, saved to a file, or deleted).
Start Trace acquisition starts when the trigger event occurs, and stops when the trace buffer is full; the trace buffer is then frozen until it has been processed (displayed, saved to a file, or deleted). That way, the execution history starting from the trigger event is preserved.
In the automatic trigger mode (described below), trace acquisition starts when program execution is started. In any other trigger mode, the MAJICPLUS probe trace buffer actually starts capturing shortly before the trigger event to help the trace disassembly algorithm establish the program context at the trigger point.
Trigger Event The Trace_Trigger configuration option specifies the trigger event.
Auto Trace acquisition is automatically triggered by the start or stop of program execution; this is the default.
TPoint Trace acquisition is triggered by the first trace point reported by the target processor. Please see Trace Points in EJTAG/PCTrace on page 152 for details on setting trace points.
External Trace acquisition is triggered the first time the external TRACE ENABLE input is asserted. This is a BNC type connector on the rear panel of the MAJICPLUS probe that may be connected to the trigger output of another MAJIC probe, or other external test equipment.
The Trace_Enable_Polarity option specifies the active level of the TRACE ENABLE input. When set to high, tracing is triggered on the rising edge, and when to low, tracing is triggered on the falling edge.
i
150 0380-0163-10 Rev 2.01 MAJIC User’s Manual

Tracing and Trace Points 6
Ext_or_TP Trace acquisition is triggered by the first occurrence of either a trace point or the external TRACE ENABLE input, as defined above.
NOTE: External trigger is not supported with on-chip trace buffers. The Trace_Trigger option is not supported with Intel® XScale™ Micro-Architecture; it always behaves as in auto mode.
Conditional Tracing
The Trace_Gate configuration option specifies whether or not trace acquisition is conditional. Note that Trace_Gate only qualifies trace data acquisition, not trigger event detection.
None Trace acquisition is not qualified by anything other than the trigger; this is the default.
External Trace acquisition is inhibited when the external TRACE ENABLE input is in its negated state, as defined by the Trace_Enable_Polarity option, and allowed when the external TRACE ENABLE input is in its asserted state.
Stall Trace acquisition is inhibited after the processor has been in a stalled state (i.e. has not executed any instructions) for approximately 500 consecutive cycles. This makes it very easy to trace program execution leading to a hung system condition. If program execution does resume after stalling for such a long time, tracing will resume (because this is a gate, not a trigger). However, there is a slight delay is restarting the trace acquisition, so several instructions may be omitted from the trace buffer in this case.
Stall_Or_Ext Tracing is inhibited if either the external TRACE ENABLE input or excessive stall condition would inhibit it, as described above.
NOTES:
• Remember that in order to process the trace buffer, it is necessary to fetch some instructions from memory. If the processor stalled because the memory controller hung, as many will do if an illegal memory access is initiated, then it may be necessary to reset the target before displaying the trace buffer. Furthermore, if such a reset will destroy the contents of your code space, you should re-download the code prior to processing the trace acquisition.
• With ARM/ETM, the Stall mode may be used to suspend tracing while in a non-trace area, providing that cycle accurate trace mode is not enabled.
• Trace_Gate is not supported with on-chip trace buffers.
i
i
MAJIC User’s Manual 0380-0163-10 Rev 2.01 151

6 Tracing and Trace Points
Trace PointsSome processors provide Trace Points, a variation on hardware breakpoints that assert an external indication when hit, instead of stopping program execution. The MAJICPLUS probe builds upon the processor’s trace point capability to provide a number of higher level debug features:
• Trigger the start or stop of trace data acquisition.
• Set marker flags in the trace buffer to facilitate searching for particular events within the acquisition.
• Assert an external trigger signal suitable for triggering other test equipment.
NOTE: If you are using a third-party debugger with the MAJIC probe, these additional features will be available only if the debugger user interface supports setting trace points.
Trace Points in ARM/ETM
With ARM/ETM, the MAJICPLUS probe uses the ETM Trigger event as the Trace Point.
Trace Points in EJTAG/PCTrace
With EJTAG/PCTrace, a Trace Point is a variation on hardware breakpoints that emits a trigger indication rather than stopping program execution. A Trace Point is set within the Breakpoint Editor dialog box. The breakpoint type must be one of the hardware breakpoint types, and the Trace Point checkbox must be checked, as shown below.
i
152 0380-0163-10 Rev 2.01 MAJIC User’s Manual

MAJIC User’s Manual 0380-0163-10 Rev 2.01
A
Ethernet ConsiderationsThis appendix describes how to connect the MAJIC Intelligent Debug Probe to a new or existing network. The Ethernet set-up information is divided into three sections:
• Considerations for All Networks below
• Considerations for PC Networks on page 156
• Information for Network Administrators on page 156
Considerations for All Networks
Cabling
The MAJIC probe supports both 100Base-T and 10Base-T (twisted-pair) network cabling. It can be connected to an existing network just like any PC or workstation. If the MAJIC probe is being connected point-to-point, directly to a host computer’s Ethernet port, then a cross-over cable is required.
The Ethernet connector (RJ-45) has the following pin-outs:
Pin 1 TD+ (leftmost pin on the MAJIC probe connector)
Pin 2 TD-
Pin 3 RD+
Pin 4 Not used
Pin 5 Not used
Pin 6 RD-
Pin 7 Not used
Pin 8 Not used
The Ethernet cable uses four wire-pairs with the pin-outs as shown below:
153
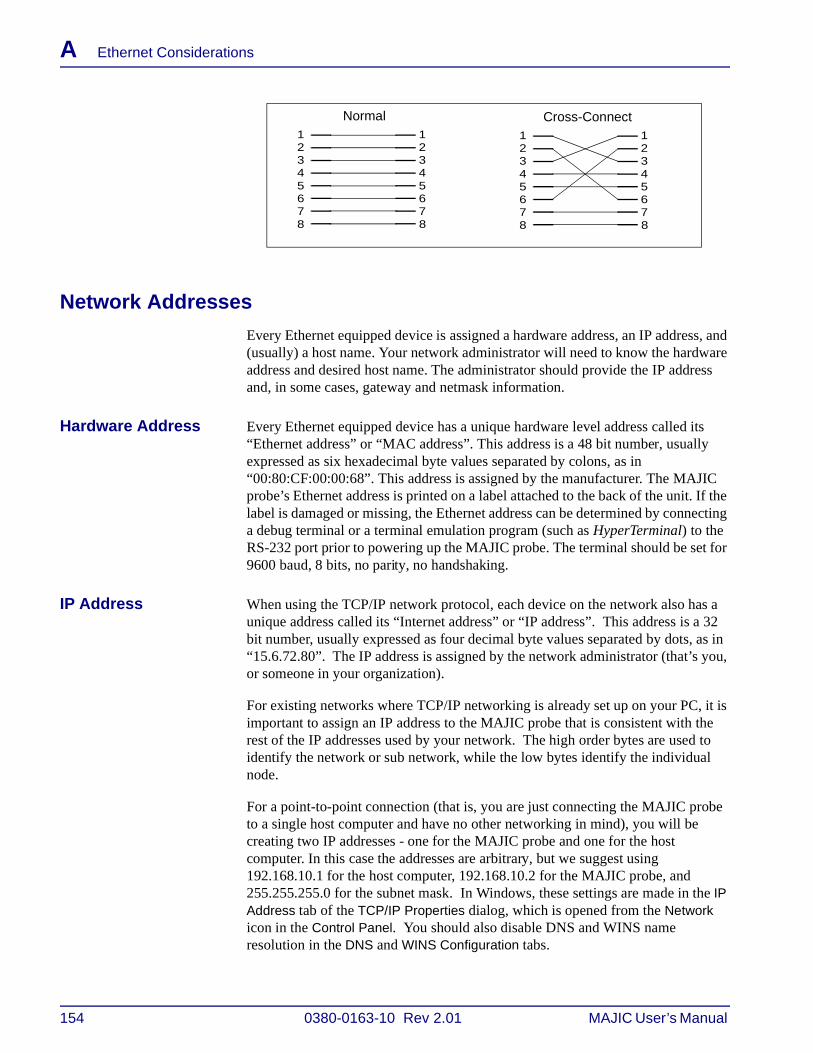
A Ethernet Considerations
Network Addresses
Every Ethernet equipped device is assigned a hardware address, an IP address, and (usually) a host name. Your network administrator will need to know the hardware address and desired host name. The administrator should provide the IP address and, in some cases, gateway and netmask information.
Hardware Address Every Ethernet equipped device has a unique hardware level address called its “Ethernet address” or “MAC address”. This address is a 48 bit number, usually expressed as six hexadecimal byte values separated by colons, as in “00:80:CF:00:00:68”. This address is assigned by the manufacturer. The MAJIC probe’s Ethernet address is printed on a label attached to the back of the unit. If the label is damaged or missing, the Ethernet address can be determined by connecting a debug terminal or a terminal emulation program (such as HyperTerminal) to the RS-232 port prior to powering up the MAJIC probe. The terminal should be set for 9600 baud, 8 bits, no parity, no handshaking.
IP Address When using the TCP/IP network protocol, each device on the network also has a unique address called its “Internet address” or “IP address”. This address is a 32 bit number, usually expressed as four decimal byte values separated by dots, as in “15.6.72.80”. The IP address is assigned by the network administrator (that’s you, or someone in your organization).
For existing networks where TCP/IP networking is already set up on your PC, it is important to assign an IP address to the MAJIC probe that is consistent with the rest of the IP addresses used by your network. The high order bytes are used to identify the network or sub network, while the low bytes identify the individual node.
For a point-to-point connection (that is, you are just connecting the MAJIC probe to a single host computer and have no other networking in mind), you will be creating two IP addresses - one for the MAJIC probe and one for the host computer. In this case the addresses are arbitrary, but we suggest using 192.168.10.1 for the host computer, 192.168.10.2 for the MAJIC probe, and 255.255.255.0 for the subnet mask. In Windows, these settings are made in the IP Address tab of the TCP/IP Properties dialog, which is opened from the Network icon in the Control Panel. You should also disable DNS and WINS name resolution in the DNS and WINS Configuration tabs.
1 2 3 4 5 6 7 8
1 2 3 4 5 6 7 8
1 2 3 4 5 6 7 8
1 2 3 4 5 6 7 8
Normal Cross-Connect
154 0380-0163-10 Rev 2.01 MAJIC User’s Manual

Ethernet Considerations A
Host Name While the network software identifies each network node by its IP address, the user needs some more meaningful method. Therefore each node is also assigned a unique “host name”, an alphanumeric identifier that is easier for humans to remember and use (for example: “joes_pc”). Host names are also assigned by the network system administrator, and the network software maintains a table of host names and their corresponding IP addresses.
If you are connecting the MAJIC probe directly to the PC, and the PC is not connected to a network, a name-to-IP address table named hosts must be created on your PC, since there is no network-wide name server. You should find a hosts file (or sample named hosts.sam) in your main Windows directory (usually C:\WINDOWS or C:\WINNT\system32\drivers\etc). With a text editor such as notepad, add a line to the end with the IP address and name you want to use for the MAJIC probe, as described by the comments already in the file.
Making a Connection
In order for the debugger program to establish a connection to the MAJIC probe over the network, both the host and the MAJIC probe must know each other’s Ethernet and IP addresses.
When you start the debugger, you specify the host name of the MAJIC probe. The host computer first translates the MAJIC probe’s host name to an IP address, either by looking it up in a local “hosts” table, or by sending a query to another machine on the net that provides name translation services. Alternatively, you can specify the IP address directly instead of a host name.
Before the first data packet can be sent to the MAJIC probe, the host must know the MAJIC probe’s Ethernet address. If the IP address to Ethernet address translation is not already known, the host will broadcast an ARP (Address Resolution Protocol) request packet to all nodes on the network. If the MAJIC probe is connected, turned on, and knows its IP address, it will respond to this request with an ARP response packet containing its Ethernet address. At that point the host has all the information it needs to establish the communications session with the MAJIC probe.
In order to respond to the ARP broadcast, the MAJIC probe must know its IP address. Normally, the MAJIC probe’s IP address is permanently stored in non-volatile flash ROM via a debugger command (see Static IP on page 9 and Configuration Options on page 159). If this internal value is 0.0.0.0 (the factory default), then the MAJIC probe must acquire its IP address from some other host on the network each time it is powered up. You can do this manually or set up a server to automatically set the MAJIC probe’s IP address.
NOTE: Windows supports the arp -s command but it does not work correctly in Windows 95/98 if you are connecting your PC directly to the MAJIC probe rather than to a network.
i
MAJIC User’s Manual 0380-0163-10 Rev 2.01 155

A Ethernet Considerations
Considerations for PC NetworksThe MAJIC probe uses TCP/IP to communicate over Ethernet. Windows comes with TCP/IP support built-in. You need to make sure the TCP/IP protocol is installed and properly configured using the Network icon in the Control Panel.
Information for Network AdministratorsThis section provides additional details about the MAJIC probe’s Ethernet firmware. It is not necessary to read this section to successfully attach the MAJIC probe to your network, but it is provided in case the network system administrator wants complete information.
The MAJIC probe uses UDP/IP for communicating with the debugger. It supports ARP/RARP and BOOTP for automatic IP assignment (but not DHCP, presently), and ICMP for network connectivity testing. The MAJIC probe has only its Ethernet address built-in; until it is configured, it does not know its IP address, or any other Internet related information.
In general, EPI recommends using static IP addresses programmed into non-volatile memory (NVRAM) using the Tv_Ip_Address option as described on page 167. If this is not done, the MAJIC probe attempts to discover its IP address by broadcasting a BOOTP request packet onto the local Ethernet. It also broadcasts a RARP request packet onto the local Ethernet.
If a BOOTP response packet is received, the MAJIC probe will use information from that packet. If the packet is in the form described by RFC-1048 and RFC-1084, then the gateway and subnet mask information will also be taken from that packet.
If a RARP response packet is received, then the MAJIC probe will use the IP address supplied by that packet.
If both BOOTP and RARP are supported on the local network, then the first response received will be used to initialize the MAJIC probe. Since the BOOTP request is sent first, it is likely, though not guaranteed, that the BOOTP response will be received first.
If the IP address is not configured in NVRAM, and neither BOOTP nor RARP are supported on the local network, then the first system which sends an IP packet to the MAJIC probe will cause the MAJIC probe to assign its IP address from that packet. The only way that this is feasible is if the host sending the packet has had its ARP table initialized to know about the MAJIC probe. Under most systems, the arp -s... command can be used to achieve this effect. In any event, if a subsequent BOOTP or RARP response packet is received, that information will override any IP address assignment.
For subnetted networks, the subnet mask and gateway IP address can be configured into NVRAM using the Tv_Ip_Netmask and Tv_Ip_Gateway
156 0380-0163-10 Rev 2.01 MAJIC User’s Manual

Ethernet Considerations A
options described on page 167. If this is not done, and the MAJIC probe can not get the subnet mask and gateway IP address from a BOOTP server, the debugger can pass this information in the initial connection packet. To do this, the gateway IP address, and optionally the subnet mask, can be added to the debugger’s device name parameter using the syntax:
icename:e�,gateway_IP�,subnet_mask���
MAJIC User’s Manual 0380-0163-10 Rev 2.01 157

A Ethernet Considerations
158 0380-0163-10 Rev 2.01 MAJIC User’s Manual

MAJIC User’s Manual 0380-0163-10 Rev 2.01
B
Configuration OptionsThis appendix describes the configuration options. Note that not all options are supported for all target types or debugger environments (see also Configuration Options on page 32).
The following list shows the options which must be set correctly to successfully connect the MAJIC probe to your target (discussed in Chapter 3, Debug Environment, on page 15):
• Ice_Jtag_Clock_Freq
• Ice_Jtag_Use_Trst
• Ice_Power_Sense
• Ice_Reset_Output
• Trgt_Little_Endian
• Trgt_Resets_Jtag
Option Valid values Default
At_Go_Command " " " "
The At_Go_Command option string is executed as a command each time target execution starts, except when instruction stepping (step-over can sometimes do a go operation with an automatic breakpoint set). High-level code stepping can also lead to go operations. In such a case, a go operation is done then the command string is executed at that time.
NOTE: Execution commands like continue (C) and (S) single stepping must NOT be used in this option. Results are not predicable.
At_Stop_Command " " " "
The At_Stop_Command option string is executed as a command each time target execution stops, except when completing an instruction step (step-over can sometimes do a go operation with an automatic breakpoint set). High-level code stepping can also lead to go operations. In such a case, a go operation is done and upon stopping this command string is executed.
Calling_Convention n32, o32, o64 o32 (32-bit MIPS)n32 (64-bit MIPS)
The Calling_Convention option allows you to tell the debugger which calling convention was followed by the compiler for the program under test. o32 is the original MIPS standard R3000 calling convention. n32 is the newer MIPS standard for R4000 (MIPS 3 ISA and later) processors with 32 bit pointers. The EPI compiler generates n32 by default. o64 refers to the calling convention used by many GNU compilers for the R4000.
159
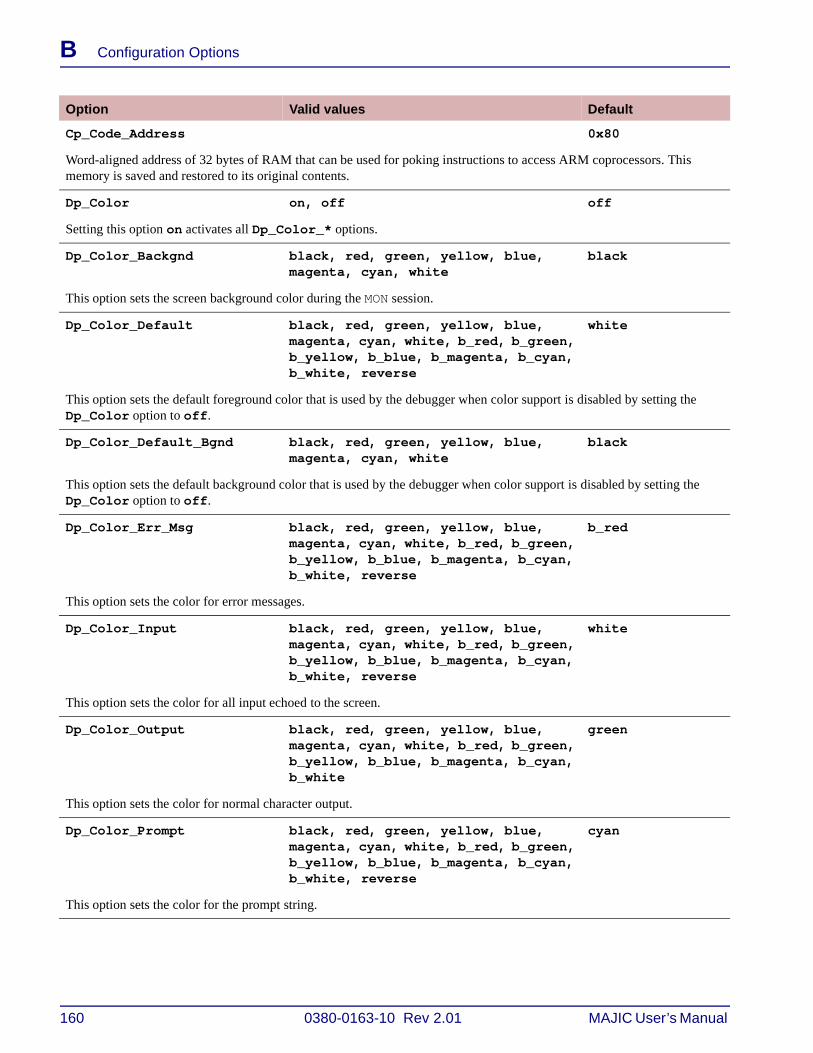
B Configuration Options
Cp_Code_Address 0x80
Word-aligned address of 32 bytes of RAM that can be used for poking instructions to access ARM coprocessors. This memory is saved and restored to its original contents.
Dp_Color on, off off
Setting this option on activates all Dp_Color_* options.
Dp_Color_Backgnd black, red, green, yellow, blue, magenta, cyan, white
black
This option sets the screen background color during the MON session.
Dp_Color_Default black, red, green, yellow, blue, magenta, cyan, white, b_red, b_green, b_yellow, b_blue, b_magenta, b_cyan, b_white, reverse
white
This option sets the default foreground color that is used by the debugger when color support is disabled by setting the Dp_Color option to off.
Dp_Color_Default_Bgnd black, red, green, yellow, blue, magenta, cyan, white
black
This option sets the default background color that is used by the debugger when color support is disabled by setting the Dp_Color option to off.
Dp_Color_Err_Msg black, red, green, yellow, blue, magenta, cyan, white, b_red, b_green, b_yellow, b_blue, b_magenta, b_cyan, b_white, reverse
b_red
This option sets the color for error messages.
Dp_Color_Input black, red, green, yellow, blue, magenta, cyan, white, b_red, b_green, b_yellow, b_blue, b_magenta, b_cyan, b_white, reverse
white
This option sets the color for all input echoed to the screen.
Dp_Color_Output black, red, green, yellow, blue, magenta, cyan, white, b_red, b_green, b_yellow, b_blue, b_magenta, b_cyan, b_white
green
This option sets the color for normal character output.
Dp_Color_Prompt black, red, green, yellow, blue, magenta, cyan, white, b_red, b_green, b_yellow, b_blue, b_magenta, b_cyan, b_white, reverse
cyan
This option sets the color for the prompt string.
Option Valid values Default
160 0380-0163-10 Rev 2.01 MAJIC User’s Manual

Configuration Options B
Dp_Color_Standout black, red, green, yellow, blue, magenta, cyan, white, b_red, b_green, b_yellow, b_blue, b_magenta, b_cyan, b_white, reverse
yellow
This option sets the color for all important (non-error) information.
Dp_Color_Use_Ansi on, off off
Setting the Dp_Color_Use_Ansi option to on causes the debugger to implement color changes via ANSI escape sequences rather than using the Win32 Console API functions.
This option is provided because the Console API does not work reliably on Windows 95, 98, and ME systems, apparently due to a bug in the DOS box emulator. The Console API method is reliable and recommended for Windows NT, 2000, and XP users. Enabling this option requires that the ANSI.SYS driver is loaded by your CONFIG.SYS file.
Edb_Go_Interactive_Mode on, off off
By default, the GO button starts or continues execution in normal non-interactive mode. Setting this option On causes the GO button to start or continue execution in interactive (concurrent) mode.
NOTE: This option is only available in EDBICE.
Edit_Insert_Mode on, off off
Setting the Edit_Insert_Mode option to on sets MON’s edit mode to INSERT. Normally, the default edit mode is OVERTYPE (like DOS). You can still toggle between these modes with the Ins key during a session.
Ice_Cache_Rom_Bp off, on off
The Ice_Cache_Rom_Bp (icrb) configuration option controls whether software breakpoints in ROM are supported by locking them into the instruction cache. Not available with all target processors.
Ice_Debug_Boot on, off
Normally, the MAJIC probe will configure the processor to enter debug mode immediately when reset. If the Ice_Debug_Boot (idb) configuration option is off, the processor will execute code from the reset vector until the MAJIC probe halts it and takes control.
Ice_Jtag_Clock_Delay 0 0 - 250
When the software JTAG engine is enabled (by setting the Ice_Jtag_Clock_Freq option to 0), this option can be used to specify a minimum pulse width for the JTAG clock (TCK), in microseconds. Slowing down the JTAG clock may be necessary in some special situations. A value of 0 disables the extra clock delay logic, and the minimum TCK pulse width will be less than one microsecond.
Ice_Jtag_Clock_Freq 0 - 40 10
A setting from 1-40 sets the frequency of the JTAG clock (TCLK), in MHz. A value of 0 disables the hardware JTAG engine, and uses a JTAG driver implemented in software. In this mode, TCLK will normally be stopped, and then when a JTAG operation is performed, will burst at a variable frequency, typically less than 10kHz.
Ice_Jtag_Tap_Count 1 0 - 1023
This option lists the number of devices (TAP controllers) detected on the JTAG scan chain. If there is more than 1 device on the chain, then the Ice_Jtag_Tap_Select (ijts) option must be set to select the device that the MAJIC probe should connect to.
Option Valid values Default
MAJIC User’s Manual 0380-0163-10 Rev 2.01 161

B Configuration Options
Ice_Jtag_Tap_Select 1 0 - 1023
If the JTAG interface (TAP controller) of the CPU to be controlled is one of several in a JTAG daisy-chain, this option is used to select which device on the JTAG scan chain should be used. Devices are numbered 1 to N, where N is the number of JTAG controllers (see the Ice_Jtag_Tap_Count option). Device 1 is connected to the MAJIC probe’s TDO signal, and device N is connected to the MAJIC probe’s TDI signal. See JTAG Interface on page 40.
Ice_Jtag_Use_Rtclk on, off off
The Ice_Jtag_Use_Rtclk enables or disables adaptive clocking mode on the JTAG interface. This option should be on if the RTCLK signal on the JTAG connector is used by your target system. Otherwise it should be off.
Ice_Jtag_Use_Trst on, off on
The Ice_Jtag_Use_Trst option specifies whether your target system uses the TRST* signal to reset the JTAG port. This option should be on if you have connected TRST* on the JTAG connector to your processor in a standard way. If your target uses the TRST* signal in a non standard way, or simply does not use it, this option should be off.
Ice_Power_Sense off, rst, trst, vref off
The Ice_Power_Sense option specifies which signal to use for target power detection. If the debug connector on your board has a dedicated voltage reference pin, then vref should be selected. Otherwise, if RST* or TRST* is pulled up to the I/O voltage of your processor, then rst or trst should be selected. Setting this option to off disconnects the MAJIC probe from the target processor. See Target Power Management on page 40.
Ice_Reset_Output on, off off
The Ice_Reset_Output (iro) configuration option controls whether the probe asserts its reset output signal when a Reset command is issued by the debugger. Note that the EPI debuggers perform a reset whenever the program is downloaded. This option does not affect the operation of the Reset Processor (RP) or Reset Target (RT) command. See Reset Management on page 43.
Ice_Reset_Peripheral on, off on
The Ice_Reset_Peripheral (irp) configuration option controls whether the probe resets peripherals via the EJTAG control register when a Reset (R), Reset Processor (RP), or Load (L) command is issued by the debugger. This option does not affect the operation of the Reset Target (RT) command (see Reset Management on page 43).
Ice_Trigger_In none, run_sync, break, jtag_sync none
The Ice_Trigger_In (iti) configuration option controls what action is taken when the MAJIC probe’s TRIGGER IN (BNC) input is asserted (low):
none TRIGGER IN is ignored.
run_sync Start of program execution is delayed until TRIGGER IN is asserted, and stopped when TRIGGER IN is negated.
break Start of program execution is not qualified, but the assertion of TRIGGER IN stops program execution.
jtag_sync If Ice_Jtag_Clock_Freq is set to 0, then the software JTAG driver delays each TCK edge until the previous edge is detected on TRIGGER IN. This allows the speed of the JTAG clock to be dynamically limited by a target-synchronized version of TCK connected to TRIGGER IN. Please see the Using MAJIC with Hardware Emulation Systems Application Note for more information on this feature.
Option Valid values Default
162 0380-0163-10 Rev 2.01 MAJIC User’s Manual

Configuration Options B
Ice_Trigger_Out none, run_sync, mem_acc, mt_err, tpoint
none
The Ice_Trigger_Out (ito) configuration option controls when the MAJIC probe’s TRIGGER OUT (BNC) output is asserted (low):
none Always negated (high).
run_sync Asserted when stepping or running, and negated between steps or upon stopping.
mem_acc Asserted before and negated after each emulator generated target memory access.
mt_err Asserted momentarily when MT detects a memory test failure.
tpoint Asserted momentarily when a trace point is encountered (valid only with the MAJICPLUS probe and trace capable processors). See Trace Points in EJTAG/PCTrace on page 152 for additional information.
Load_Absolute_Syms on, off off
This option specifies that absolute-valued symbols are included when MON loads a program.
Load_Entry_Pc on, off on
The load_entry_pc option is set to on so that the PC register is loaded with the entry point value of the loaded program at load time. For MONICE users: if multiple programs are loaded via the same load (l) command, the entry point is taken from the first referenced program.
Load_Osboot on, off on
The boot code may either be linked directly with your application code, or it may be provided in a separate executable module. If the boot code is linked with the application code, then the load_osboot option should be turned off. If you prefer to use a separate program module for your boot code, then it must be named osboot.sys, it must be available according to the file search algorithm described in the debugger manual, and the load_osboot option must be turned on.
Reset_Address 0xa0000000 - 0xbfffffff 0xbfc00000
The Reset_Address option controls the initial program pointer (PC) after a reset operation is issued through the debugger. When set to the actual reset vector, no special processing takes place. When set to any other value, the debugger sets the (conceptual) PC as specified by this option after each reset or download command. Note that the EPI debuggers normally perform a reset whenever the program is downloaded, unless inhibited with the Reset_At_Load option.
NOTE: For MIPS processors, the Reset_Address must be set somewhere within kseg1. For 64-bit processors, this requires that you either enter 8 leading Fs, or use offset:seg notation (for example: 1000:1, which means offset 1000 within kseg1).
The initial setting of this option can be set with the -x switch on the MONICE invocation line.
Reset_At_Load on, off on
This option is set on by default so that a processor reset occurs before program download.
Semi_Hosting_Enabled on, off on
Set this option to on to enable system calls like (open, close, read, write) from your program to be serviced via the debugger.
NOTE: This feature should be disabled when debugging ARM code that begins at address 0.
Semi_Hosting_Vector 0x8 (the SWI vector)
Word-aligned address to be trapped for ARM semihosting I/O calls. When set to 0x8, semihosting is called by the SWI instruction.
Option Valid values Default
MAJIC User’s Manual 0380-0163-10 Rev 2.01 163

B Configuration Options
Serial_Speed 0 - 7 3
Serial communication speed. Set it to the integer that corresponds to the desired baud rate.
0 = 12001 = 24002 = 48003 = 96004 = 190005 = 384006 = 576007 = 115200
This option is typically set with the -�0..7� switch on the MONICE or EDBICE invocation line.
Sym_Delta 0xffff 0x0 - 0xffffffff
This option is the maximum offset for symbol+offset display.
Td_Columns 1 - 132 80
This option specifies the number of columns per screen for the trace display.
Td_Rows 10 - 32768 25
This option specifies the number of rows per screen for the trace display.
Top_Of_Memory 0x80000
Word-aligned value used by the ARM semi-hosting library in setting up a stack.
Trace_Active_Probe on, off off
The Trace_Active_Probe controls how the MAJICPLUS probe expects to receive the trace data. It should be on if an active probe is used for trace acquisition, otherwise it should be off.
Trace_Asid off, on off
The Trace_Asid (ta) configuration option controls whether the MAJIC probe will configure the processor to include ASID values in the trace data. This option should be enabled only if you are actually using multiple virtual address spaces in your target program.
Trace_Buffer_Activity none, tracing, waiting, filling, stopped
none
The Trace_Buffer_Activity (tba) configuration option reports the current activity status of the tracing system.
none Tracing is not enabled and the buffer is empty.
tracing Tracing is underway, with no termination condition.
waiting Conditional trace capture has not begun.
filling Tracing is under way, with a conditional termination condition that has not occurred yet.
stopped Conditional trace capture has completed.
Trace_Enable_Polarity low, high low
The Trace_Enable_Polarity (tep) configuration option controls whether the MAJIC probe’s TRACE ENABLE (BNC) input is active low or active high. See also options Trace_Gate and Trace_Trigger.
Option Valid values Default
164 0380-0163-10 Rev 2.01 MAJIC User’s Manual

Configuration Options B
Trace_Gate none, external, stall, ext_or_stall
none
The Trace_Gate (tg) configuration option controls whether trace frame capturing is qualified (gated). Note that gating is independent of the trigger state, except that selecting the external TRACE ENABLE input as a trigger takes precedence over using it as a gate. See also options Trace_Enable_Polarity and Trace_Trigger.
none Trace frame acquisition is not qualified.
external Trace frame acquisition is inhibited when MAJIC probe’s TRACE ENABLE (BNC) input is not asserted.
stall Trace frame acquisition is inhibited after approximately 500 consecutive trace clock cycles with no execution activity. If execution subsequently resumes, tracing will resume within a few trace clock cycles.
ext_or_stall Trace frame acquisition is inhibited whenever either the external mode or stall mode would inhibit it.
Trace_Inst16 off, on off
The Trace_Inst16 (ti) configuration option controls whether the MAJIC will attempt to distinguish 16-bit from 32-bit mode instructions in the trace data. This option should be disabled for best results when tracing 32-bit code. It should be enabled only if you are actually using 16-bit instructions in your target program.
Trace_Mips16 off, on off
The Trace_Mips16 (tm) configuration option controls whether the MAJIC probe will attempt to identify MIPS16 instructions in the trace data. This option should be disabled for best results when tracing 32-bit code. It should be enabled only if you are actually using MIPS16 instructions in your target program.
Trace_Real_Time off, on on
The Trace_Real_Time (trt) configuration option controls whether the processor executes at full speed when tracing is enabled. When enabled, the processor’s trace capability is set to maintain real time performance, which is likely to result in some loss of trace history. When disabled, the processor’s trace capability is set to stall the processor’s execution of instructions as necessary to ensure that complete trace history is captured. Not all processors support both modes.
Trace_Trigger auto, external, tpoint, ext_or_tp
auto
The Trace_Trigger (tt) and Trace_Trigger_Action (tta) configuration options control when the MAJIC probe starts and stops collecting trace information. Trace_Trigger selects the trigger event:
auto Automatically starts tracing when program execution starts. If the tta option is set to start, tracing stops when the buffer is full. If tta is set to stop, tracing continues until execution stops.
external Triggers on asserting edge of the TRACE ENABLE (BNC) input.
tpoint Triggers on the first trace point (see Trace Points in EJTAG/PCTrace on page 152).
ext_or_tp Triggers on the first occurrence of a TRACE ENABLE assertion or a trace point.
Trace_Trigger_Action start, stop stop
The Trace_Trigger_Action (tta) configuration option controls what the MAJIC probe does when the trigger event specified by the Trace_Trigger (tt) option occurs:
start Tracing is started by the trigger event and stops when the trace buffer is full.
stop Tracing starts when execution starts and stops when triggered. If the buffer fills up, older frames are discarded to make room for newer frames.
Option Valid values Default
MAJIC User’s Manual 0380-0163-10 Rev 2.01 165

B Configuration Options
Trace_Upload_Inst off, on on
The Trace_Upload_Inst (tui) configuration option controls whether executed instructions are included in uploaded trace data. When enabled, the MAJIC probe fetches all executed instructions from memory and adds them to the trace data. When disabled, the MAJIC probe still fetches the instructions needed to interpret the trace information, but does not upload them. This can improve trace upload times if the debugger can fetch the instructions from the executable file instead of memory, but code executed outside of the executable file can not be disassembled (unless you re-enable this option and refresh the trace window).
Trace_Upload_Raw off, on off
The Trace_Upload_Raw (tur) configuration option controls whether raw trace data, which includes the mini probe signals, is uploaded. When disabled, frames in which no instructions were executed are not uploaded to improve trace upload performance. Such cycles are represented as delta timestamps in the trace display. As a further performance optimization, the raw trace signals are not uploaded, only the instruction execution history is.
Trgt_Cache_Type unknown, none, unified, instruction, data, separate
unknown
The Trgt_Cache_Type (tct) configuration option reports the type of primary cache(s) provided by the CPU, if it is known.
Trgt_Cpu_State run, halt, sleep, doze, off halt
The Trgt_Cpu_State (tcs) configuration option reports the state of the CPU.
Trgt_Dcache_Linesize 0 - 1024 0
The Trgt_Dcache_Linesize (tdl) configuration option reports the size in bytes of each line in the CPU’s primary data cache, if it is known.
Trgt_Dcache_Memsize 0x0 - 0xffffffff 0x0
The Trgt_Dcache_Memsize (tdm) configuration option reports the size in bytes of the CPU’s primary data cache, if it is known.
Trgt_Dcache_Sets 0 - 1024 0
The Trgt_Dcache_Sets (tds) configuration option reports the number of sets in the CPU’s primary data cache, if it is known.
Trgt_Icache_Linesize 0 - 1024 0
The Trgt_Icache_Linesize (til) configuration option reports the size in bytes of each line in the CPU’s primary instruction or unified cache, if it is known.
Trgt_Icache_Memsize 0x0 - 0xffffffff 0x0
The Trgt_Icache_Memsize (tim) configuration option reports the size in bytes of the CPU’s primary instruction or unified cache, if it is known.
Trgt_Icache_Sets 0 - 1024 0
The Trgt_Icache_Sets (tis) configuration option reports the number of sets in the CPU’s primary instruction or unified cache, if it is known.
Option Valid values Default
166 0380-0163-10 Rev 2.01 MAJIC User’s Manual

Configuration Options B
Trgt_Little_Endian on, off off
Setting Trgt_Little_Endian on indicates that your target system has a little-endian memory architecture.
The initial setting of this option can be set with the -l switch on the MONICE invocation line.
Trgt_Resets_Jtag no, yes no
The Trgt_Resets_Jtag (trj) configuration option specifies whether a target system reset also causes JTAG TAP controller to be reset. Although it is not recommended, some target systems tie these reset signals together. See also options Ice_Reset_Output and Ice_Jtag_Use_Trst.
Tv_Ip_Address 0.0.0.0 0.0.0.0
The Tv_Ip_Address (tia) configuration option is used to set and display a static (permanent) IP address stored in non-volatile RAM in the target vehicle (ICE). A value of 0.0.0.0 disables the static IP address and causes the ICE to acquire its IP address dynamically.
Tv_Ip_Gateway 0.0.0.0 0.0.0.0
The Tv_Ip_Gateway (tig) configuration option is used to set and display a static (permanent) gateway IP address stored in non-volatile RAM in the target vehicle (ICE). This option and the Tv_Ip_Netmask option should be used if the host and target are on different subnets and must communicate through a gateway.
Tv_Ip_Netmask 0.0.0.0 0.0.0.0
The Tv_Ip_Netmask (tin) configuration option is used to set and display a static (permanent) subnet mask stored in non-volatile RAM in the target vehicle (ICE). This option and the Tv_Ip_Gateway option should be used if the host and target are on different subnets and must communicate through a gateway.
Vector_Catch 0x3b see below
A bit mask specifying that selected exception vectors are to be trapped. Some processors provide special hardware for trapping these vectors (except for the Error vector at 0x20). For other processors, the selected vectors are trapped by setting breakpoints. For compatibility, the Vector_Catch bit corresponding to the Error vector may be set, but the Error vector is not actually trapped. If you require this vector to be trapped, set a breakpoint at 0x20. Note that software breakpoints can only be set when the vectors are in RAM.
This feature should be disabled when debugging code that begins at address 0.
Option Valid values Default
Bit Value Default Setting Exception Name Exception Vector Address
0x001 on Reset 0x00
0x002 on Undefined instruction 0x04
0x004 off SWI 0x08
0x008 on Reserved 0x0C
0x010 on Data Abort 0x10
0x020 on Prefetch Abort 0x14
0x040 off IRQ interrupt 0x18
0x080 off FIQ interrupt 0x1C
0x100 off Error 0x20
MAJIC User’s Manual 0380-0163-10 Rev 2.01 167

B Configuration Options
Vector_Load_Low off, target, user target
The Vector_Load_Low option controls how the MAJIC probe manages the low vector table. Usually the MAJIC probe overlays a 32-byte block of debug memory, called an exception interceptor, over the low vector table memory area. By default, the MAJIC probe initializes this exception interceptor block from the corresponding physical memory before starting execution, but the exception interceptor can be initialized to user-defined values, or it can be disabled.
target The low exception interceptor is enabled and initialized from target memory prior to starting execution.
user The low exception interceptor is enabled and initialized to user supplied values prior to starting execution.
off The low exception interceptor is disabled (not recommended).
Vector_Load_High off, target, user off
The Vector_Load_High option controls how the MAJIC probe manages the high vector table. The MAJIC probe can be set to overlay a 32-byte block of debug memory, called an exception interceptor, over the high vector table memory area. The exception interceptor block can be initialized from the corresponding physical memory or user-defined values before starting execution, or it can be disabled. By default, the low vector table is intercepted instead (see Vector_Load_Low above).
target The high exception interceptor is enabled and initialized from target memory prior to starting execution.
user The high exception interceptor is enabled and initialized to user supplied values prior to starting execution.
off The high exception interceptor is disabled.
Option Valid values Default
168 0380-0163-10 Rev 2.01 MAJIC User’s Manual

MAJIC User’s Manual 0380-0163-10 Rev 2.01
C
MON Quick ReferenceThis appendix is a reference for the MON command language, and contains information on the following topics:
• MONICE command line, below.
• Debug monitor commands, on page 171.
• Debug monitor operands, on page 175.
• Command line editor, on page 176.
• History file, on page 177.
MONICE Command LineThe MONICE debugger is started with the monice command, and can use the invocation switches listed below.
monice ���-options����� �filename��������
Where:
options is one or more of the options listed in the following table.
filename is the name of a command file to be run (after startice.cmd). If multiple command files are present on the invocation line, they are processed in reverse order (i.e. the last, rightmost file, is processed first).
Options Description
-�0��7� Sets the initial value of the Serial_Speed option (see page 164). The default is 9600.
Valid serial speeds: 1200, 2400, 4800, 9600, 19.2k, 38.4k, 57.6k, 115.2k. The limit for unix hosts is 38.4k. This limit for PC’s vary, depending on the processor type, system speed, and serial driver, but can usually run up to 115.2k.
169

C MON Quick Reference
-d device�:e� Specifies the communication device name.
The device parameter is the serial device name or Ethernet host name. An Ethernet host name must have “:e” appended to the end.
NOTES:
• Without :e, device specifies a serial port name such as COM2 (for a PC) or /dev/ttyb (for UNIX). Appending :e specifies an ethernet connection, where device is described in the hosts file on your network server. Refer to Ethernet Setup on page 9 for more information on Ethernet connections.
• The space between the switch and device is required. There is no space between device and :e.
-h MONICE switch for displaying help on MONICE invocation (instead of starting the debugger).
-ni Non-intrusive startup mode. Normal startup mode resets the processor and clears any breakpoints. Use of -ni allows connection to a target without losing this target state information. Also, if the target is currently executing in interactive mode, the debugger will enter interactive mode and not disturb the running program.
NOTE: Since the optional breakpoint command lists are not recorded on the target, they cannot be recovered from the target. However, your original breakpoint will be recovered with an empty command list.
-l Specifies the target as Little-endian (-l). This MONICE switch sets the initial value of the Trgt_Little_Endian option to on (see page 167).
-q Start monitor in Quiet mode (no loading messages, etc.).
-vh Display the list of CPU types supported by MONICE.
-vX Specifies the processor type (5KC, ARM922T, ...) that is installed in the probe head. If grouped with other options with a single “-”, the vX option should be the last in that group.
For a complete list of processors supported by MONICE, use -vh (but note that the MAJIC probe supports only a subset of these).
NOTE: There must be no space between -v and the processor type.
-z Start in “stand-alone” mode. Allows usage of the help system and access to previously saved trace files without being connected to the MAJIC.
Options Description
170 0380-0163-10 Rev 2.01 MAJIC User’s Manual

MON Quick Reference C
MON CommandsThe following table shows the syntax of the MON commands and identifies those that are available in each debugger environment. The table uses the following abbreviations in the Availability field to indicate the debuggers:
MON for MONICE.
M for the MON mode of EDBICE.
EM for the EDB mode of EDBICE.
A for the API libraries that third party debuggers use.
ALL for all debuggers.
Refer to Chapter 5, MON Command Language, on page 71 for complete information on these commands.
You can use the H command for on-line help (or H H for help on using help).
Availability Command Syntax
MON �+�-�B Enable or Disable Breakpoints
�+�-�B �*�addr ��� �
MON BC Breakpoint Clear
BC �*�addr�
MON BL Breakpoint List BL
MON BS Breakpoint Set
BS �addr�, �-�pass_cnt�� ��� �{cmd_list}�
MON C Call Stack Summary
C �max_levels�
MON, M, A CF Cache Flush
C�F�I�FI� �I�D�
ALL DA Display Aliases
DA �*�ident�
MON, M, A DB Display or Find Byte
DB�R� �range�, fmt� �=value �# mask��, value��# mask��������� �
MON, M, A DD Display or Find Double Word
DD�R� �range�, fmt� �=value �# mask��, value��# mask��������� �
ALL DF Display Filter
DF � *�filter_list�
MON, M, A DH Display or Find Half-Word
DH�R� �range�, fmt� �=value �# mask��, value��# mask��������� �
MAJIC User’s Manual 0380-0163-10 Rev 2.01 171

C MON Quick Reference
ALL DI Display Information DI
MON, A DN Display Symbolic Name
DN �*�ident�ident*�
ALL DO Display Option
DO�V� �*�pattern*�cfg_option�
ALL DT Display Trace
DT �?���+�-��count����start��end�����start� L�count���,�R�I�D�M��A�R�D�N� ��
MON, M, A DV Display Values, Formatted
DV string�, expr�...
MON, M, A DW Display or Find Word
DW�R� �range�, fmt� �=value �# mask��, value��# mask��������� �
ALL EA Enter Alias EA ident cmd_list
MON, M, A EB Enter Byte
EB�K� �range��,fmt� = value�, value�����
MON, M, A ED Enter Double Word
ED�K� �range��,fmt� = value�, value�����
MON, M, EM �+�-�EDB Enable, Disable, or Set EDB Command Mode
�+�-�EDB
ALL EF Enter Filter
EF� id� �$ident � filter_clause � & filter_clause�...
MON, M, A EH Enter Half Word
EH�K� �range��,fmt� = value�, value�����
MON, A EN Enter Symbolic Name EN ident = addr
ALL EO Enter Option EO cfg_option = value
ALL ETM Enter Trace Mode
ETM �R�I�D�M�
MON, M, A EW Enter Word
EW�K� �range��,fmt� = value�, value�����
ALL �+�-�F Enable or Disable Trace Display Filter
�+F�-F� �*�filter_list�
Availability Command Syntax
172 0380-0163-10 Rev 2.01 MAJIC User’s Manual

MON Quick Reference C
ALL FR File Read
FR C filename �p_value �����FR M filename �addr�FR �RD�TD� filename
ALL FW File Write
FW�O� TD filenameFW�A�O� M filename range
FW�A�O� �C�O� �filename�+�-�
MON G Go
G�I� �=addr� �addr ���� �{�cmd_list�}�
ALL GOTO Go To (used in command files) GOTO ident
MON, M, A H Help
H �command�op_key�CONTROL�OPS�
MON, M, A IF If
IF expr {then_cmds} �{else_cmds}�
ALL KA Kill Aliases
KA �*�ident�
ALL KF Kill Filter
KF �*�filter_list�
MON, A KN Kill Symbolic Name
KN �*�ident�ident*�
ALL KT Kill Trace Data
�KT�KTD� �Y�
MON, A L Load Program
L ���-�N�O �t�d�b�l�s���filename���� ������
MON, A LN Load Symbolic Names
LN�A�O� �filename� ���
MON, M, A M Move
M�R��B�H�W�D� range, addr
ALL MC Memory Configuration
MC �range �, ��pwe�pwd��dma�jam�inv���� ��� �
MON, M, EM �+�-�MON Enable, Disable, or Set MON Command Mode
�+�-�MON
Availability Command Syntax
MAJIC User’s Manual 0380-0163-10 Rev 2.01 173

C MON Quick Reference
MON, M, A MT Memory Test
MT range�,�1�2�3�4�5�8�9���,�H�V�Q�S��������,repeat_cnt��MT range,8,delay�,�H�V�Q�S������� �,repeat_cnt��MT range,�10�11�12��,data � �,repeat_cnt�
MON Q Quit (valid in EDB mode also, but deprecated)
Q �Y�
ALL �+�-�Q Enable or Disable Quiet Mode
�+Q�-Q�
MON, M, A R Reset Processor or Reset Target R // See ice_reset_output on page 162.
MON, M, A RP Reset Processor RP
MON, M, A RT Reset Target RT
ALL �UN�SHIFT Shift Command File Arguments
SHIFT �number��UNSHIFT �number�*�
MON S Single Step, Step Forward, Step Over
S�F�O��Q�V���=addr� �number���{�cmd_list�}�
MON, M, EM SP Stop Processor (in concurrent debug mode)SP
ALL �+�-�TE Enable or Disable Trace Execution
�+TE�-TE�
MON, A VL Verify Load
VL � �-�N�O �t�d�b�l�s�� filename ���� ���
MON ! Operating System Shell or Command
! � os_command �
Availability Command Syntax
174 0380-0163-10 Rev 2.01 MAJIC User’s Manual

MON Quick Reference C
Debug Monitor OperandsDetailed descriptions of each operand listed below is provided in Debug Monitor Operands on page 124.
addr Address��number�(expr)��:space��sym_nameexpr
�.�reg_name�.field�$ident
cmd_list Command Listcommand �; command� ���
expr Address Expression �addr�(expr)�expr op expr�unary-op expr�
fmt Format�d�u�o�x�X�f�e�E�g�G�c�s�i�
ident Identifier�A��Z�a��z�_ ��A��Z�a��z�0��9�$�_ �. �����
number Constant Number�0x�0o�0n��digit_string
range Address Range��addr� �L number��addr addr2�*�:space��
reg_name Register NameMIPS and ARM Register names are provided on page 135.
space Memory SpaceMIPS: �U�0�1�2�3�R�S�XU�XS�XP�XK�P�DA�ARM: �P�DA�
string ASCII String"text"
MAJIC User’s Manual 0380-0163-10 Rev 2.01 175

C MON Quick Reference
Command Line EditorThis section describes the keys used to perform command line editing in MONICE, and the MON console window provided by most of EPI’s debugger interface libraries. These special keys provide a convenient way to edit command lines and recall recently entered command lines.
Key Description
<Ins> (Insert) Toggles between Insert and Over-type modes. In Insert mode, normal characters are inserted at the current cursor position. In Over-type mode, normal characters replace the character at the current cursor position. On MS-DOS systems the cursor size reflects the mode. Insert mode is a half field block, Over-type mode is an underline. UNIX systems do not support cursor size changes.
<BS> (Backspace) Deletes the character to the left of the current cursor position.
<Del> (Delete) Deletes the character at the current cursor position.
<Up> (Up Arrow) Replaces the current line (if any) with the previous line in the circular buffer.
<Down> (Down Arrow) Replaces the current line (if any) with the next line in the circular buffer.
<Left> (Left Arrow) Moves the cursor to the left one character.
<Right> (Right Arrow) Moves the cursor to the right one character.
<Home> Moves the cursor to the beginning of the current line.
<End> Moves the cursor to the end of the current line.
<PgUp> (Page Up) Replaces the current line (if any) with the first (oldest) line in the circular buffer.
<PgDn> (Page Down) Replaces the current line (if any) with the last (most recent) line in the circular buffer.
<C-PgUp> (Control-Page Up) Deletes the entire contents of the circular buffer.
<C-PgDn> (Control-Page Down) Deletes the currently selected line (if any) from the circular buffer.
<Esc> (Escape) Deletes all text from the current line. The circular buffer is not affected.
<Enter> (Return) Enters the current line as input to MON. The cursor does not have to be at the end of the line.
<F1> (Function key F1) Entered once, searches the circular buffer for a line whose beginning matches the text typed so far. The search starts from the last (most recent) entry in the buffer. If a match is found, the matching line replaces the current line. If a match is found, <F1> can be hit again to find the next match for the original text.
176 0380-0163-10 Rev 2.01 MAJIC User’s Manual

MON Quick Reference C
NOTE: Many Unix consoles have different shell modes which can alter or filter out the keyboard codes used for command line editing and history recall. If these keys seem not to perform their function, try switching to a different mode. Specifically on Sun machines be sure to use a “shell tool” rather than a “cmd tool.” “Cmd tool” does not work properly, even with scrolling disabled.
History FileMONICE, EDBICE, and the debugger “back ends” maintain a history file called startedb.hst that contains the current command history from your last debug session. This file is read at debugger startup time, and written out upon exiting.
A default (empty) history file is provided in the bin directory with the debuggers. Typically this is sufficient for most users, but if you are using a shared bin directory you might want to create your own history file in a private directory. The private directory must be in the search path for the debugger to find it.
NOTES:
• The history file is maintained in ASCII form and is modifiable with any text editor.
• If the history file was read from the current working directory when MON was started, and the current working directory was changed subsequently, then the history file will not be saved upon exit.
i
i
MAJIC User’s Manual 0380-0163-10 Rev 2.01 177

C MON Quick Reference
178 0380-0163-10 Rev 2.01 MAJIC User’s Manual

MAJIC User’s Manual 0380-0163-10 Rev 2.01
D
MAJIC Probe Update ProcedureThis appendix provides information on updating the EDT software package, the MAJIC probe firmware, and the MAJICPLUS probe Trace Control hardware. EPI customers with a current Maintenance, Upgrade, and Support (MUS) contract, as well as those still covered by the original warranty, will receive a notification whenever updates become available.
Information on the current EDT software release and the MAJIC probe firmware version is available on the support page of the EPI web site (www.epitools.com).
Software UpdateThere are two types of software updates from EPI: a production update and an engineering update. A production update could be in the form of an EDT update CD or a zip file with the name edt_rel_xx.zip. An engineering update is a zip file with a name such as edtxx_spxx.zip.
Production Update1. Locate the serial number of your software on the label of your original
EDT installation CD. The serial number can also be found in the root directory of an EDT installation. The serial number is in the file name of the .sn file. (For example: if the serial number is 654321 then the filename is 654321.sn).
2. If you have an update CD, insert the CD into your CDROM drive. If the update program does not start automatically, then start Windows Explorer, browse to your CDROM drive, and start the update program by double clicking setup.exe.
If you have the edt_rel_xx.zip file, unzip it to a temporary directory, and then double click setup.exe to start the installer.
3. Follow the instructions of the update program to install the update.
179

D MAJIC Probe Update Procedure
Engineering Update1. If you have not already done so, install the EDT software CD or zip file as
instructed above. Make a note of the root directory where you choose to install the tools.
2. Unzip the update file into the same root directory, making sure to preserve the directory structure of the files within the zip file. This will update some of the installed files, and may also install some new files. The new MAJIC probe firmware image, to be programmed into the MAJIC probe’s flash memory, will be installed in the root\ice\majic.xyz directory (where xyz is the firmware version number).
Firmware UpdateAfter performing the appropriate EDT software update, follow these steps to update the MAJIC probe firmware.
1. Power up the MAJIC probe. You can leave the target system turned off or disconnected during the update process, or you can connect it normally. Make sure the Status LED is green before proceeding.
2. Start the MAJIC Setup Wizard from the Programs folder in the Windows Start menu.
3. Read the information presented, and then click the NEXT button to display the Choose Operation form, shown below.
4. Select Firmware Update from the Choose Update Type drop-down list, and click Go.
The MAJIC Firmware Update Installer form appears.
180 0380-0163-10 Rev 2.01 MAJIC User’s Manual

MAJIC Probe Update Procedure D
5. In the MAJIC Firmware Update Installer form, use the Browse button to select the location of the update files.
For the firmware included in a production release, browse to root\ice\majic. For engineering update service packs, browse to root\ice\majic.xyz where xyz is the firmware version number. The three files shown in the lower text box should all be present in the selected directory.
6. Once you have the correct location selected, click NEXT to display the MAJIC Connection Parameters form.
7. Specify the communication method to be used during the update. If you select serial, make sure the COM port is not in use by another program, and that the serial cable is correctly installed. If you select ethernet, make sure you can ping the MAJIC before proceeding.
For information on setting up the serial or ethernet connection, see to Host Computer Connections on page 8.
8. Click Update then OK on the Install Update form to begin the update process. A console window (DOS box) will open to update the MAJIC firmware using MONICE.
MAJIC User’s Manual 0380-0163-10 Rev 2.01 181

D MAJIC Probe Update Procedure
CAUTION: The Status LED will go RED for several seconds during the critical stage of the update. DO NOT disturb the MAJIC or console window while the LED is red. The LED will turn off when it is safe to proceed.
9. After the Status LED turns off, click OK on the Check Your Installation Result form and close the console window. If the Status LED does not turn off, click Cancel and check the console window for errors.
10. After completing the update, power cycle the MAJIC probe so the update can take effect.
Hardware UpdateThe MAJICPLUS trace control features described in Chapter 6, Tracing and Trace Points, on page 141 utilize a programmable logic device (PLD) that monitors the processor’s trace interface. When switching between processors with different trace interfaces (e.g. MIPS/PCTrace and ARM/ETM), the PLD must be reprogrammed.
PLD Version
The PLD version programmed into a MAJICPLUS probe can be identified with the DI command. The last digit of the Hardware Rev line indicates the trace control logic that is installed. The possible values are:
!
182 0380-0163-10 Rev 2.01 MAJIC User’s Manual

MAJIC Probe Update Procedure D
4 - ARM/ETM v4 (passive probe only)
6 - ATM/ETM v6 (active or passive probe)
If any other number is reported, please contact EPI technical support.
Hardware Update Process
To update the MAJIC hardware, follow these steps:
1. Power up the MAJIC probe. You can leave the target system turned off or disconnected during the update process, or you can connect it normally. Make sure the Status LED is green before proceeding.
2. Start the MAJIC Setup Wizard from the Programs folder in the Windows Start menu.
3. Read the information presented, and then click the NEXT button to display the Choose Operation form, shown below.
4. Select Hardware PLD Update from the Choose Update Type drop-down list, and click Go.
The MAJIC PLD Update Installer form appears.
MAJIC User’s Manual 0380-0163-10 Rev 2.01 183

D MAJIC Probe Update Procedure
5. In the MAJIC PLD Update Installer form, use the Browse button to select the location of the update files.
If you are running the setup wizard from EPI’s standard tools installation tree, you will see the sub-directory ice added. This directory contains sub-directories with the extension .pld. Browse to the directory you wish to install files from. If you are installing a non-standard update then please browse to the location of your update files.
6. Once you have the correct location selected, click NEXT to display the MAJIC Connection Parameters form.
7. Specify the communication method to be used during the update. If you select serial, make sure the COM port is not in use by another program, and that the serial cable is correctly installed. If you select ethernet, make sure you can ping the MAJIC before proceeding.
For information on setting up the serial or ethernet connection, see to Host Computer Connections on page 8.
8. Click Update then OK on the Install Update form to begin the update process. A console window (DOS box) will open to update the Trace Control PLD using MONICE.
184 0380-0163-10 Rev 2.01 MAJIC User’s Manual

MAJIC Probe Update Procedure D
9. After the Status LED turns off, click OK on the Check Your Installation Result form and close the console window. If the Status LED does not turn off, click Cancel and check the console window for errors.
CAUTION: Please cycle power only AFTER instructed to do so. Once the new hardware has been programmed, the command file will ask you to cycle power on the MAJIC probe. The command file will automatically exit the MONICE program. After cycling power, run MONICE again, and verify the new hardware version number in the sign-on or DI screen.
During the update, the Command Prompt window displays the progress of the update. The status LED on the front of the MAJIC probe remains red during the update, and turns off when the update completes successfully.
10. After the update completes and the status LED turns off, power cycle the MAJIC probe so the update can take effect.
!
MAJIC User’s Manual 0380-0163-10 Rev 2.01 185

D MAJIC Probe Update Procedure
186 0380-0163-10 Rev 2.01 MAJIC User’s Manual

Index
Symbols!, command 123$$*, parameter 68, 117$$0, parameter 68, 117$$1, parameter 117$$2, parameter 117$$n, parameter 67^BREAK key 64^C key 64
Numerics100Base-T 9, 15310Base-T 9, 153
Aabout this manual viiAC source 6accessing
memory 34, 44registers 44
addr operand 125address 125
expressions 48offset 125operand 125operators 49space 125space designator 138
address operandsexpr 125number 125reg_name 126space 125
Address Range operand 134address space designators 138addresses
classifications of 125complimented rotating 52dynamic IP 11hardware 154host name 155IP 154network 154reset 163rotating 52static IP 9
addresses, classifications ofdebugger local 125register 125
administrator information 156advanced MAJIC probe configuration 30ADW 2alerts ixAlias commands 65ARM
addresses 49register names 136semi-hosting library 62trace signals 146
ARP, manual 12assembler, MIPS mini 47assigning names 65At_Go_Command option 159At_Stop_Command option 159attaching the MAJIC probe to Ethernet 9AXD 2
configuring for RealMonitor 29running via RealMonitor 64
BB, command 74basic patterns test 52
MAJIC User’s Manual 0380-0163-10 Rev 2.01 187

Index
BC, command 75binary files 54bit fields 46BL, command 76BOOTP 12, 156BREAK key 64Breakpoint Clear command 75Breakpoint List command 76Breakpoint Set command 77breakpoints
EDB 58hardware 60MON 59software 59
BS, command 77buffer, trace 141
CC key 64C, command 78cable, serial 8cabling 6, 153Cache Flush command 79Calling_Convention option 78, 159Calls command 78cdb.rc 27CF, command 79CFI, command 79checking out the system 12CI, command 79cmd_list, operand 128COFF files 53combination test 53command 128
aliases 65files 67lists 72parameters 67
command language, MON 71command line
editor 176monice 169
Command List operand 128COMMON trace signals 146complimented rotating address 52concurrent debug mode 63confidence test 13configuration
advanced 30files 22
memory 33option display 33options, table 159process 22setting options 32with EDBICE 27with eXDI, MDI, RDI 28with MONICE 27with other debuggers 28with Tornado 28
configuration options 32CONNECT LED 13connections 8
EPI debugger 155ethernet 155host computer 8, 155network 153power 6RS232C 8serial 8target 6
contacting EPI ixCp_Code_Address option 160custom initialization file 31
DDA, command 65, 80data
moving 50retention capability 52
data width 35DB, command 45, 81DD, command 45, 81debug
environment 15mode, concurrent 63monitor commands 72monitor operand summaries 175monitor operands 124services 39terminal 8
debuggercommands, MON 71, 171local address 125local variables 66operand summaries 175overview 2setting the static IP 11source level 2symbolic 2
188 0380-0163-10 Rev 2.01 MAJIC User’s Manual

Index
debugging hardware 39DF, command 83DH, command 45, 81DI, command 84Disable Breakpoints command 74disassembled trace display 143Display Alias command 65, 80Display commands 45
data format 131Display Configuration Options command 86Display Data command 81Display filters command 83Display Information command 84Display Names command 85Display Trace command 87Display Values command 88DMA 34DN, command 65, 85DO, command 33, 86DOV, command 33, 86download performance 55downloading executable programs 53Dp_Color option 160Dp_Color_Backgnd option 160Dp_Color_Default option 160Dp_Color_Default_Bgnd option 160Dp_Color_Err_Msg option 160Dp_Color_Input option 160Dp_Color_Output option 160Dp_Color_Standout option 161Dp_Color_Use_Ansi option 161DT, command 87, 142DTF, command 147DTN, command 147DV, command 88DW (data width) 35DW, command 45, 81dynamic IP 11
EEA, command 65EB, command 45, 90ED, command 45, 90EDB, command mode 92Edb_Go_Interactive_Mode option 64, 161Edb_Step_Forward_Mode option 56EDBICE
configuring via Setup Wizard 16MAJIC probe configuration 27starting execution 64
Edit_Insert_Mode option 161editor, command line 176EDTA software package 3EF, command 93EH, command 45, 90EJTAG trace signals 145ELF files 53emulator, protocols used 156EN, command 65, 94Enable Breakpoints command 74enable, trace 149endian selection 170ENET LED 13engineering update procedure 180Enter commands 45
data format 131filling memory and registers 51interactive mode 46
Enter Data command 90Enter Filter command 93Enter Names command 94Enter Option command 95Enter Trace Mode command 96EO, command 31, 95, 149EPI OS 61ethernet
attaching the MAJIC probe 9considerations 153host name 170set-up 9, 153
ETM trace signals 146ETM, command 96, 147ETN, command 147EW, command 45, 90eXDI, MAJIC probe configuration 28Execute Operating System Shell command 123execution
program 53program, starting 64starting 62
expr operand 129expr, used in address operand 125Expression operand 129expressions, address 48
FF, command 97failure message in memory test 51File Read command 98File Write command 99
MAJIC User’s Manual 0380-0163-10 Rev 2.01 189

Index
filescommand 67script 67
Find Data command 81firmware update procedure 180fmt operand 131Format operand 131FR C, command 67FR, command 98full trace format 147FW C, command 67FW, command 99
GG, command 64, 101GDB
configuring via Setup Wizard 17using in Linux or UNIX 15
getting help ixgetting started 5Go command 64, 101GOTO command 68, 102
HH, command 103halt-on-error mode 51handling the system ixhardware
addresses 154breakpoints 60debugging 39installation 6update procedure 182
help ixHelp command 103
in MON 72hex files 54HIF 61history file 177host computer connections 8host interface functions 61host name 155
IIce_Cache_Rom_Bp option 59, 161Ice_Debug_Boot option 161Ice_Jtag_Clock_Delay option 161Ice_Jtag_Clock_Freq option 55, 161Ice_Jtag_Tap_Count option 42, 161
Ice_Jtag_Tap_Select option 42, 162Ice_Jtag_Use_Rtclk option 162Ice_Jtag_Use_Trst option 41, 162Ice_Power_Sense option 40, 41, 162Ice_Reset_Output option 44, 116, 162Ice_Reset_Peripheral option 44, 162Ice_Trigger_In option 162Ice_Trigger_Out option 163ident operand 132Identifier operand 132IF command 69, 104installation, hardware 6instruction stepping 56interactive mode, Enter commands 46internal peripherals, resetting 44intrusive startup mode 170INV 34invocation switches, MONICE 169IP address 154
dynamic 11static 9
JJAM 34JTAG
bypass test 13chain dimensions 41clock 32initialization 40user initialization sequence 42
KKA, command 65, 105KF, command 106Kill Alias command 65, 105Kill Filter command 106Kill Names command 107Kill Trace Data command 108killing the trace buffer 142KN, command 65, 107KT, command 108, 142
LL, command 109language, MON 71LEDs
CONNECT 13ENET 13POWER 13
190 0380-0163-10 Rev 2.01 MAJIC User’s Manual
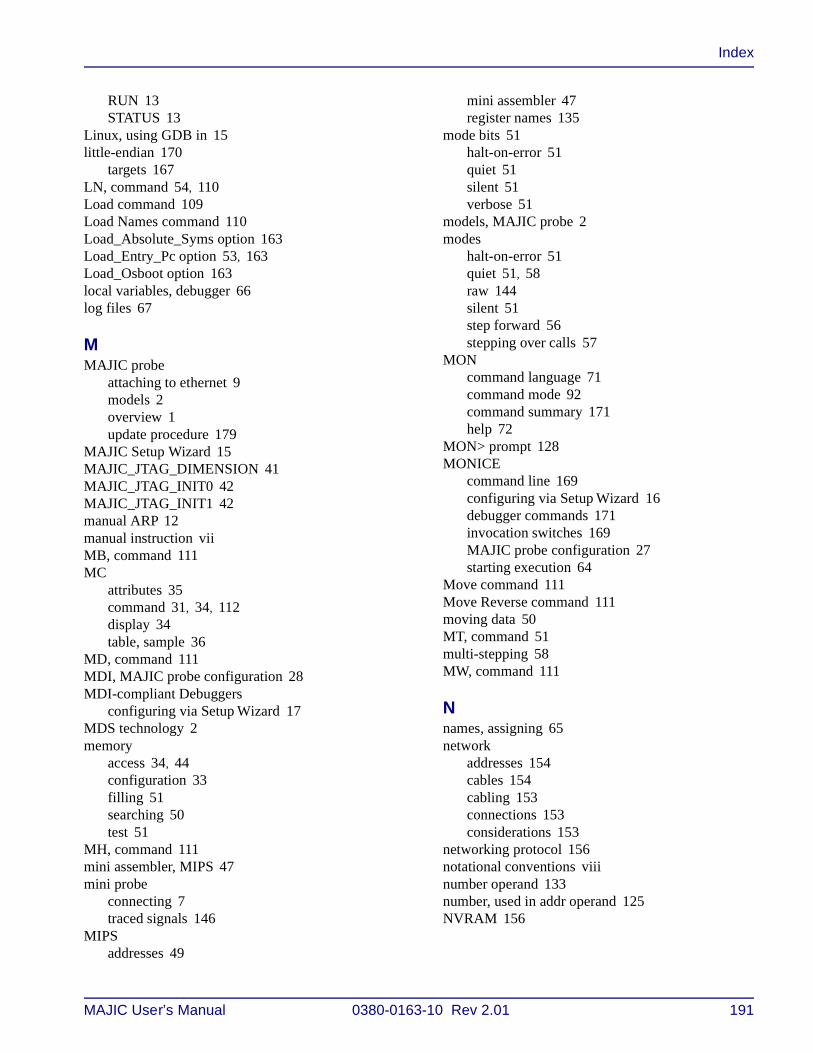
Index
RUN 13STATUS 13
Linux, using GDB in 15little-endian 170
targets 167LN, command 54, 110Load command 109Load Names command 110Load_Absolute_Syms option 163Load_Entry_Pc option 53, 163Load_Osboot option 163local variables, debugger 66log files 67
MMAJIC probe
attaching to ethernet 9models 2overview 1update procedure 179
MAJIC Setup Wizard 15MAJIC_JTAG_DIMENSION 41MAJIC_JTAG_INIT0 42MAJIC_JTAG_INIT1 42manual ARP 12manual instruction viiMB, command 111MC
attributes 35command 31, 34, 112display 34table, sample 36
MD, command 111MDI, MAJIC probe configuration 28MDI-compliant Debuggers
configuring via Setup Wizard 17MDS technology 2memory
access 34, 44configuration 33filling 51searching 50test 51
MH, command 111mini assembler, MIPS 47mini probe
connecting 7traced signals 146
MIPSaddresses 49
mini assembler 47register names 135
mode bits 51halt-on-error 51quiet 51silent 51verbose 51
models, MAJIC probe 2modes
halt-on-error 51quiet 51, 58raw 144silent 51step forward 56stepping over calls 57
MONcommand language 71command mode 92command summary 171help 72
MON> prompt 128MONICE
command line 169configuring via Setup Wizard 16debugger commands 171invocation switches 169MAJIC probe configuration 27starting execution 64
Move command 111Move Reverse command 111moving data 50MT, command 51multi-stepping 58MW, command 111
Nnames, assigning 65network
addresses 154cables 154cabling 153connections 153considerations 153
networking protocol 156notational conventions viiinumber operand 133number, used in addr operand 125NVRAM 156
MAJIC User’s Manual 0380-0163-10 Rev 2.01 191

Index
Ooffset 125operand summaries 175operating system, EPI 61operations 39os_command 123oscilloscope loops 53overview
debugger 2MAJIC probe 1
Pparameters, command file 67partial word access 34, 52pass counts 58PC network considerations 156PCTrace trace signals 145performance, downloading 55Platform Builder,
configuring via Setup Wizard 16PLD version 182power
connections 6requirements 6source 6target management 40
power-onreset 40self test 12
predefined spacesfor ARM and XScale 25for MIPS 26
probe, connecting 7processor.rd 22, 28production update procedure 179program downloading 53program execution 53, 64
starting 62, 64program.rc 28protocols used by emulator 156PWD 34PWE 34
QQ, command 114quiet
command playback 70memory test 51mode 51, 58, 170
stepping 58Quiet mode commands (+Q, -Q) 70, 115Quit command 114
RR, command 116range operand 134RARP 11, 156raw mode 144raw trace display 144RDI, MAJIC probe configuration 28RDIMAJIC 29read-only 35RealMonitor 29, 63refresh test 52reg_name operand 135register access 44register definition file 23
sample 26Register Name operand 135registers
accessing 44filling 51
resetaddress 163vector override 163
Reset command 116reset management 43, 163Reset Processor 44Reset Target 44Reset_Address option 43, 53, 116, 163Reset_At_Load option 53, 163resetting
internal peripherals 44target system 44
RO 35rotating address 52RP, command 116RS232C connection 8RT, command 116RW 35
SS, command 118saving a session log 67script files 67searching memory 50self test 12Semi_Hosting_Enabled option 62, 163Semi_Hosting_Vector option 163
192 0380-0163-10 Rev 2.01 MAJIC User’s Manual

Index
semi_hosting_vector option 163semi-hosting 61serial connection 8
using to set static IP 11serial device name 170Serial_Speed option 164, 169servicing the MAJIC probe ixsession log 67setting
configuration options 32MC attributes 35
Setup Wizard 15choosing your debugger 15setting the static IP 9specifying processor and connection type 18specifying your config files’ location 19specifying your connection type 18verifying your target interface properties 19
set-up, ethernet 9, 153SF, command 118Shift command 68, 117silent mode 51single stepping 55, 56SO, command 118software
breakpoints 59update 179
source level debugger 2source stepping with EDB 56SP, command 120space
designators 138memory address 125of address 125operand 138
space namesfor ARM and XScale 25for MIPS 26
SQ, command 58, 118stand alone mode 170startedb.hst 177startice.cmd 28, 29, 31, 169starting
execution 62, 64program execution 64
static IP 9setting via MAJIC Setup Wizard 9setting via the debugger 11
Step command 118step command list in MONICE 57
step forward mode 56stepping over calls 56, 57stepping through a program 56Stop command 120string
literal 140operand 140
SV, command 58, 118Sym_Delta option 78, 164symbolic debugger 2syntax descriptions viiisystem
administrator information 156check-out 12configuration 15handling ixunpacking ix
Ttarget
connections 6interface properties form 19power management 40
TCP/IP 154, 156Td_Columns option 164Td_Rows option 164TE, command 121, 149technical support ixterminal for debugging 8tests
basic patterns 52combination 53memory 51oscilloscope loops 53power-on 12refresh 52self-test 12walking ones and zeros 52
TF, command 147time stamp 144Top_Of_Memory option 62, 164Tornado
MAJIC probe configuration 28MAJIC probe support 17
tracebuffer 141buffer, killing 142enable 149points 152signals 145
MAJIC User’s Manual 0380-0163-10 Rev 2.01 193

Index
triggers 149trace display
disassembled 143files 148raw 144
TRACE ENABLE 8Trace_Active_Probe option 164Trace_Asid option 164Trace_Buffer_Activity option 164Trace_Enable_Polarity option 150, 151, 164Trace_Gate option 151, 165Trace_Inst16 option 165Trace_Mips16 option 165Trace_Real_Time option 165Trace_Trigger option 150, 165Trace_Trigger_Action option 150, 165Trace_Upload_Inst option 166Trace_Upload_Raw option 144, 145, 166traced signals 145tracing 141Trgt_Cache_Type option 166Trgt_Cpu_State option 166Trgt_Dcache_Linesize option 166Trgt_Dcache_Memsize option 166Trgt_Dcache_Sets option 166Trgt_Icache_Linesize option 166Trgt_Icache_Memsize option 166Trgt_Icache_Sets option 166Trgt_Little_Endian option 167, 170Trgt_Resets_Jtag option 41, 44, 167TRIG IN 8, 62TRIG OUT 8, 60, 61triggers 8Tv_Ip_Address option 156, 167Tv_Ip_Gateway option 156, 167Tv_Ip_Netmask option 156, 167
UUDP/IP 156UNIX, using GDB in 15unpacking the system ix, 5Unshift command 68, 117updating
firmware 180hardware 182MAJIC probe 179software 179
user JTAG initialization 42
VVector_Catch option 62, 167Vector_Load_High option 168Vector_Load_Low option 168verbose
memory test 51stepping 58
Verify Load command 122virtual address segments, MIPS 49VL, command 122
Wwalking ones and zeros test 52
194 0380-0163-10 Rev 2.01 MAJIC User’s Manual