main production and financial indicators, july 2021
TRANSCRIPT

Plataforma de Producción PB-KU-S, Sonda de Campeche.
August 19, 2021
Main production and
financial indicators,
July 2021
2021. Petróleos Mexicanos. All the rights reserved.

2021. Petróleos Mexicanos. All the rights reserved.2
Forward-Looking Statement & Cautionary Note
Variations
If no further specification is included, comparisons are made against the same realized period of the last year.
Rounding
Numbers may not total due to rounding.
Financial Information
Excluding budgetary and volumetric information, the financial information included in this report and the annexes hereto is based on unaudited consolidated financial statements prepared in accordance with International Financial Reporting Standards as issued by the
International Accounting Standards Board (“IFRS”), which PEMEX has adopted effective January 1, 2012. Information from prior periods has been retrospectively adjusted in certain accounts to make it comparable with the unaudited consolidated financial information
under IFRS. For more information regarding the transition to IFRS, see Note 23 to the consolidated financial statements included in Petróleos Mexicanos’ 2012 Form 20-F filed with the Securities and Exchange Commission (SEC) and its Annual Report filed with the
Comisión Nacional Bancaria y de Valores (CNBV). EBITDA is a non-IFRS measure. We show a reconciliation of EBITDA to net income in Table 33 of the annexes to PEMEX’s Results Report as of March 31, 2015. Budgetary information is based on standards from
Mexican governmental accounting; therefore, it does not include information from the subsidiary companies or affiliates of Petróleos Mexicanos. It is important to mention, that our current financing agreements do not include financial covenants or events of default that
would be triggered as a result of our having negative equity.
Methodology
We might change the methodology of the information disclosed in order to enhance its quality and usefulness, and/or to comply with international standards and best practices.
Foreign Exchange Conversions
Convenience translations into U.S. dollars of amounts in Mexican pesos have been made at the exchange rate at close for the corresponding period, unless otherwise noted. Due to market volatility, the difference between the average exchange rate, the exchange rate
at close and the spot exchange rate, or any other exchange rate used could be material. Such translations should not be construed as a representation that the Mexican peso amounts have been or could be converted into U.S. dollars at the foregoing or any other rate.
It is important to note that we maintain our consolidated financial statements and accounting records in pesos. As of June 30, 2021, the exchange rate of MXN 19.8027 = USD 1.00 is used.
Fiscal Regime
Beginning January 1, 2015, Petróleos Mexicanos’ fiscal regime is governed by the Ley de Ingresos sobre Hidrocarburos (Hydrocarbons Revenue Law). From January 1, 2006 and to December 31, 2014, PEP was subject to a fiscal regime governed by the Federal
Duties Law, while the tax regimes of the other Subsidiary Entities were governed by the Federal Revenue Law.
On April 18, 2016, a decree was published in the Official Gazette of the Federation that allows assignment operators to choose between two schemes to calculate the cap on permitted deductions applicable to the Profit-Sharing Duty: (i) the scheme established within
the Hydrocarbons Revenue Law, based on a percentage of the value of extracted hydrocarbons; or (ii) the scheme proposed by the SHCP, calculated upon established fixed fees, USD 6.1 for shallow water fields and USD 8.3 for onshore fields.
The Special Tax on Production and Services (IEPS) applicable to automotive gasoline and diesel is established in the Production and Services Special Tax Law “Ley del Impuesto Especial sobre Producción y Servicios”. As an intermediary between the Ministry of
Finance and Public Credit (SHCP) and the final consumer, PEMEX retains the amount of the IEPS and transfers it to the Mexican Government. In 2016, the SHCP published a decree trough which it modified the calculation of the IEPS, based on the past five months of
international reference price quotes for gasoline and diesel.
As of January 1 2016, and until December 31, 2017, the SHCP will establish monthly fixed maximum prices of gasoline and diesel based on the following: maximum prices will be referenced to prices in the U.S. Gulf Coast, plus a margin that includes retails, freight,
transportation, quality adjustment and management costs, plus the applicable IEPS to automotive fuel, plus other concepts (IEPS tax on fossil fuel, established quotas on the IEPS Law and value added tax).
PEMEX’s “producer price” is calculated in reference to that of an efficient refinery operating in the Gulf of Mexico. Until December 31, 2017, the Mexican Government is authorized to continue issuing pricing decrees to regulate the maximum prices for the retail sale of
gasoline and diesel fuel, taking into account transportation costs between regions, inflation and the volatility of international fuel prices, among other factors. Beginning in 2018, the prices of gasoline and diesel fuel will be freely determined by market conditions. However
the Federal Commission for Economic Competition, based on the existence of effective competitive conditions, has the authority to declare that prices of gasoline and diesel fuel are to be freely determined by market conditions before 2018.
Hydrocarbon Reserves
In accordance with the Hydrocarbons Law, published in the Official Gazette on August 11, 2014, the National Hydrocarbons Commission (CNH) will establish and will manage the National Hydrocarbons Information Center, comprised by a system to obtain, safeguard,
manage, use, analyze, keep updated and publish information and statistics related; which includes estimations, valuation studies and certifications. On August 13, 2015, the CNH published the Guidelines that rule the valuation and certification of Mexico’s reserves and
the related contingency resources.
As of January 1, 2010, the Securities and Exchange Commission (SEC) changed its rules to permit oil and gas companies, in their filings with the SEC, to disclose not only proved reserves, but also probable reserves and possible reserves. Nevertheless, any description
of probable or possible reserves included herein may not meet the recoverability thresholds established by the SEC in its definitions. Investors are urged to consider closely the disclosure in our Form 20-F and our Annual Report to the CNBV and SEC, available at
http://www.pemex.com/.
Forward-looking Statements
• This report contains forward-looking statements. We may also make written or oral forward-looking statements in our periodic reports to the CNBV and the SEC, in our annual reports, in our offering circulars and prospectuses, in press releases and other written
materials and in oral statements made by our officers, directors or employees to third parties. We may include forward-looking statements that address, among other things, our:
• exploration and production activities, including drilling;
• activities relating to import, export, refining, petrochemicals and transportation, storage and distribution of petroleum, natural gas and oil products;
• activities relating to our lines of business, including the generation of electricity;
• projected and targeted capital expenditures and other costs, commitments and revenues;
• liquidity and sources of funding, including our ability to continue operating as a going concern;
• strategic alliances with other companies; and
• the monetization of certain of our assets.
• Actual results could differ materially from those projected in such forward-looking statements as a result of various factors that may be beyond our control. These factors include, but are not limited to:
• changes in international crude oil and natural gas prices;
• effects on us from competition, including on our ability to hire and retain skilled personnel;
• limitations on our access to sources of financing on competitive terms;
• our ability to find, acquire or gain access to additional reserves and to develop the reserves that we obtain successfully;
• uncertainties inherent in making estimates of oil and gas reserves, including recently discovered oil and gas reserves;
• technical difficulties;
• significant developments in the global economy;
• significant economic or political developments in Mexico;
• developments affecting the energy sector; and
• changes in our legal regime or regulatory environment, including tax and environmental regulations.
Accordingly, you should not place undue reliance on these forward-looking statements. In any event, these statements speak only as of their dates, and we undertake no obligation to update or revise any of them, whether as a result of new information, future events or
otherwise. These risks and uncertainties are more fully detailed in our most recent Annual Report filed with the CNBV and available through the Mexican Stock Exchange (http://www.bmv.com.mx/) and our most recent Form 20-F filing filed with the SEC
(http://www.sec.gov/). These factors could cause actual results to differ materially from those contained in any forward-looking statement.

2021. Petróleos Mexicanos. All the rights reserved.
PEMEX's contributions to Mexico's public treasury

2021. Petróleos Mexicanos. All the rights reserved.4
PEMEX: contributions to SHCPBillion pesos
128
182
260 243
Jan-Jul 2020 Jan-Jul 2021
Direct
(DUC 1/ &
others)
Indirect
(IEPS e IVA)
425
389
In 2021, PEMEX
continues to be the main
taxpayer in the country.
From January-July,
PEMEX has contributed
MXN 182to the Federal
Government
Through DUC and
DEXTH.
That is a MXN 54increase as compared to
the same period of 2020.
PEMEX continues to
generate oil income to
finance Mexico’s
development.
2021. Petróleos Mexicanos. All the rights reserved.5
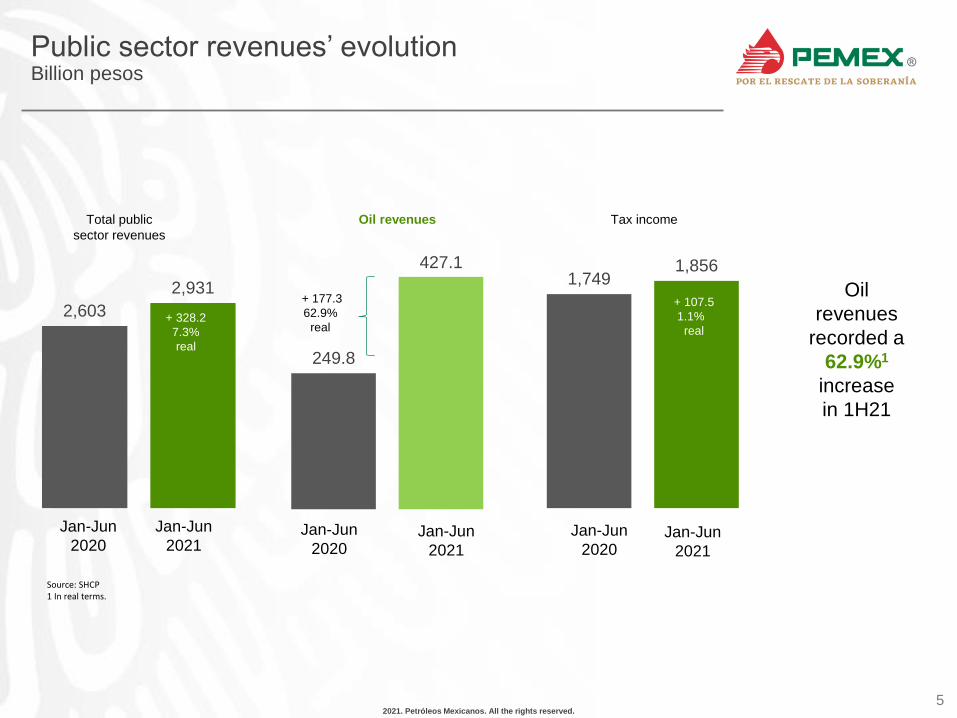
Public sector revenues’ evolutionBillion pesos
249.8
427.1
Jan-Jun
2020
Jan-Jun
2021
2,603
2,9311,749
1,856
+ 328.2
7.3%
real
+ 177.3
62.9%
real
+ 107.5
1.1%
real
Jan-Jun
2020Jan-Jun
2021
Jan-Jun
2020Jan-Jun
2021
Source: SHCP1 In real terms.
Tax incomeOil revenuesTotal public
sector revenues
Oil
revenues
recorded a
62.9%1
increase
in 1H21

2021. Petróleos Mexicanos. All the rights reserved.6
Evolution of oil revenues in public budgetary incomeMXN billion (constant), June 2021
Note: Oil revenues include PEMEX's own revenues and those of the Federal Government.
(65.3%) (62.0%) (60.6%)(64.6%)
(69.3%)
(80.2%)
(83.7%) (83.3%)(80.9%)
(82.3%)
(88.7%)
(85.2%)
(34.7%)(38.0%) (39.4%)
(35.4%)(30.7%)
(19.8%)
(16.3%)(16.7%)
(19.1%)(17.7%) (11.3%)
(14.8%)
(65.3%) (61.9%) (60.6%)(64.6%)
(69.3%)
(80.2%)
(83.7%)(83.3%)
(80.9%)
(82.2%)
(88.7%)
(85.2%)
(34.7%)(38.1%)
(39.4%)
(35.4%)
(30.7%)
(19.8%)
(16.3%)
(16.7%)(19.1%)
(17.8%)
(11.3%)
(14.8%)
(Jan-Jun)
2,916 2,944 2,985 3,313 3,580
4,345
4,9814,739
4,5384,725
4,896
2,504
1,549 1,808 1,945 1,814
1,583
1,070
969 951 1,073
1,020 627
427
4,465 4,752
4,930 5,127 5,163
5,416
5,950 5,690 5,612
5,745 5,523
2,931
2010 2011 2012 2013 2014 2015 2016 2017 2018 2019 2020 2021
Non-oil revenues Oil revenues

2021. Petróleos Mexicanos. All the rights reserved.
Crude Oil Production
2021. Petróleos Mexicanos. All the rights reserved.
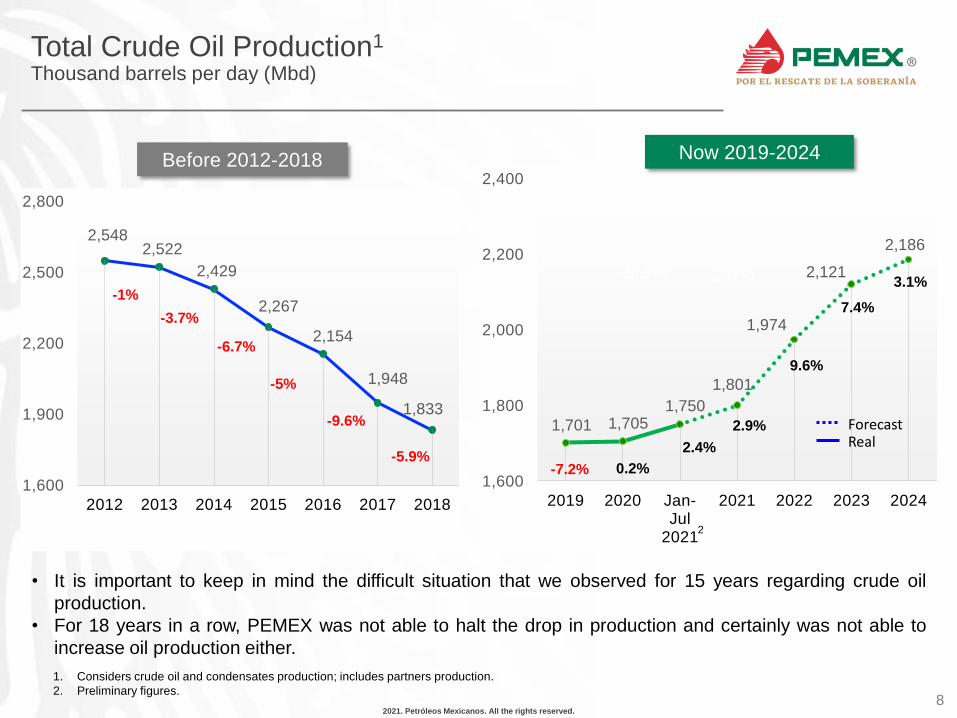
1,701 1,7051,750
1,801
1,974
2,121
2,186
1,600
1,800
2,000
2,200
2,400
2019 2020 Jan-Jul
2021
2021 2022 2023 2024
8
Total Crude Oil Production1
Thousand barrels per day (Mbd)
1. Considers crude oil and condensates production; includes partners production.
2. Preliminary figures.
-2.1%
2,5482,522
2,429
2,267
2,154
1,948
1,833
1,600
1,900
2,200
2,500
2,800
2012 2013 2014 2015 2016 2017 2018
-6.7%
-5%
-9.6%
-5.9%
-3.7%
-1%
Before 2012-2018
-2.4% -5.3% -2.9%-2.4% -5.3% -2.9%
Now 2019-2024
-7.2% 0.2%
2.9%
9.6%
7.4%
3.1%
ForecastReal2.4%
• It is important to keep in mind the difficult situation that we observed for 15 years regarding crude oil
production.
• For 18 years in a row, PEMEX was not able to halt the drop in production and certainly was not able to
increase oil production either.
2

2021. Petróleos Mexicanos. All the rights reserved.9
Total Crude Oil Production1
Thousand barrels per day (Mbd)
1. Considers crude oil and condensates production, including partners.
* Preliminary figures.
1,647
1,772
1,300
1,350
1,400
1,450
1,500
1,550
1,600
1,650
1,700
1,750
1,800
July 2020 July 2021*
1,6801,689
1,711 1,713
1,732
1,7591,751 1,755
1,768 1,772
1,600
1,620
1,640
1,660
1,680
1,700
1,720
1,740
1,760
1,780
1,800
Oct Nov Dec Jan Feb Mar Apr May Jun Jul*
2020 2021
In July, crude oil production increased by 7.6%, in annual terms,
equivalent to a 125 thousand barrels per day increase.
+7.6%
2021. Petróleos Mexicanos. All the rights reserved.
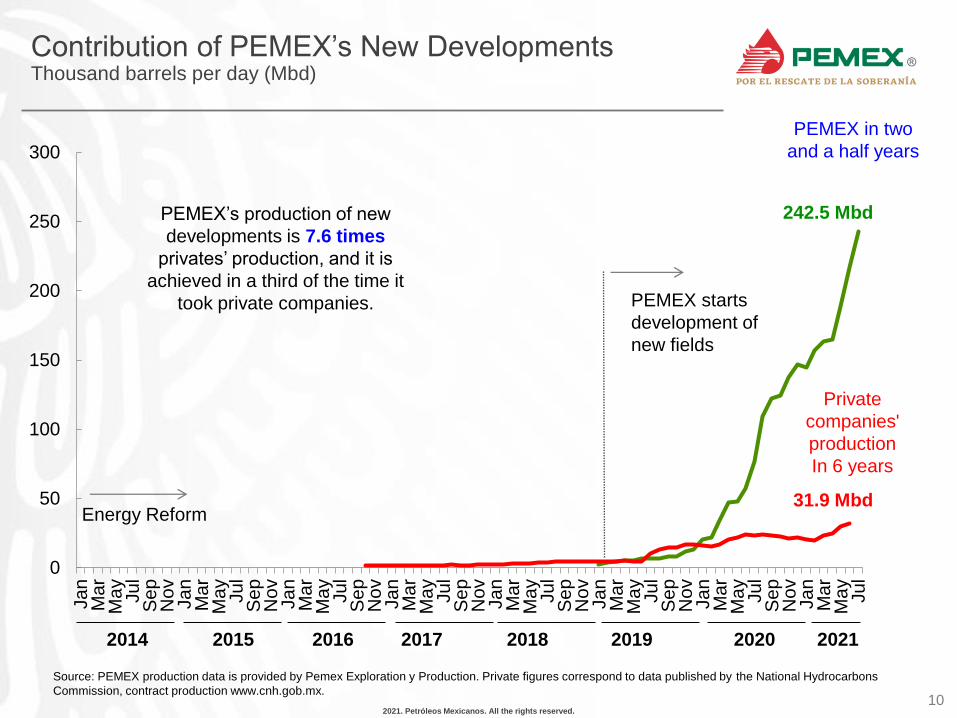
242.5 Mbd
31.9 Mbd
0
50
100
150
200
250
300
Ja
nM
ar
Ma
yJu
lS
ep
No
vJa
nM
ar
Ma
yJu
lS
ep
No
vJa
nM
ar
May
Ju
lS
ep
No
vJa
nM
ar
Ma
yJu
lS
ep
No
vJa
nM
ar
Ma
yJu
lS
ep
No
vJa
nM
ar
Ma
yJu
lS
ep
No
vJa
nM
ar
Ma
yJu
lS
ep
No
vJa
nM
ar
Ma
yJu
l
10
Contribution of PEMEX’s New DevelopmentsThousand barrels per day (Mbd)
Energy Reform
PEMEX starts
development of
new fields
PEMEX in two
and a half years
Private
companies'
production
In 6 years
2014 2015 2016 2017 2018 2019 2020 2021
Source: PEMEX production data is provided by Pemex Exploration y Production. Private figures correspond to data published by the National Hydrocarbons
Commission, contract production www.cnh.gob.mx.
PEMEX’s production of new
developments is 7.6 times
privates’ production, and it is
achieved in a third of the time it
took private companies.
2021. Petróleos Mexicanos. All the rights reserved.
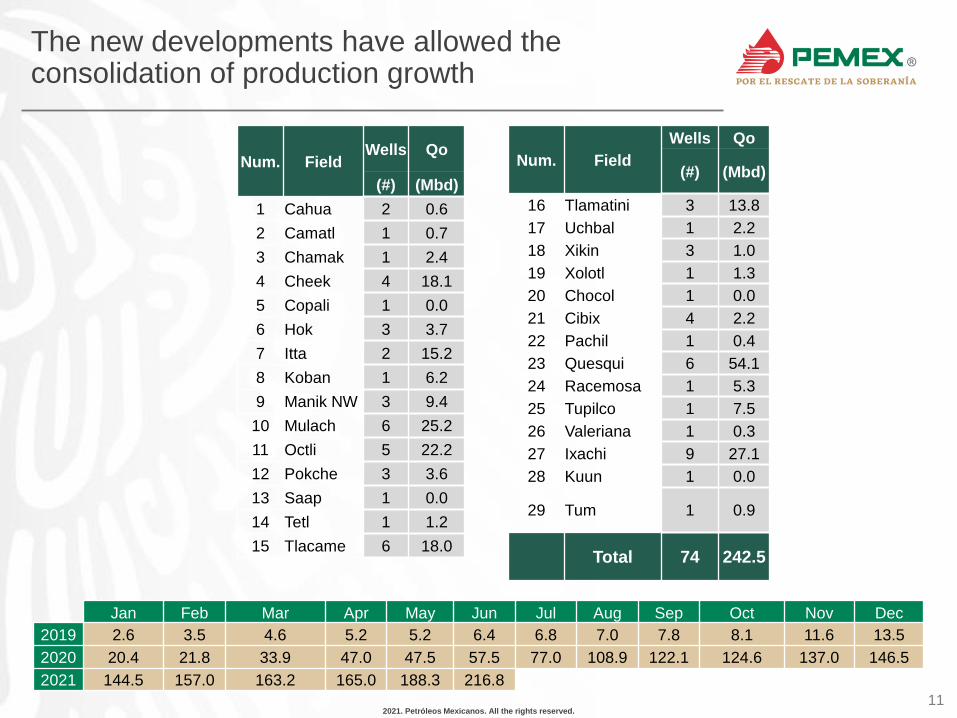
The new developments have allowed the consolidation of production growth
11
Num. FieldWells Qo
(#) (Mbd)
1 Cahua 2 0.6
2 Camatl 1 0.7
3 Chamak 1 2.4
4 Cheek 4 18.1
5 Copali 1 0.0
6 Hok 3 3.7
7 Itta 2 15.2
8 Koban 1 6.2
9 Manik NW 3 9.4
10 Mulach 6 25.2
11 Octli 5 22.2
12 Pokche 3 3.6
13 Saap 1 0.0
14 Tetl 1 1.2
15 Tlacame 6 18.0
Num. Field
Wells Qo
(#) (Mbd)
16 Tlamatini 3 13.8
17 Uchbal 1 2.2
18 Xikin 3 1.0
19 Xolotl 1 1.3
20 Chocol 1 0.0
21 Cibix 4 2.2
22 Pachil 1 0.4
23 Quesqui 6 54.1
24 Racemosa 1 5.3
25 Tupilco 1 7.5
26 Valeriana 1 0.3
27 Ixachi 9 27.1
28 Kuun 1 0.0
29 Tum 1 0.9
Total 74 242.5
Jan Feb Mar Apr May Jun Jul Aug Sep Oct Nov Dec
2019 2.6 3.5 4.6 5.2 5.2 6.4 6.8 7.0 7.8 8.1 11.6 13.5
2020 20.4 21.8 33.9 47.0 47.5 57.5 77.0 108.9 122.1 124.6 137.0 146.5
2021 144.5 157.0 163.2 165.0 188.3 216.8

2021. Petróleos Mexicanos. All the rights reserved.12
Mexico’s Total Oil ProductionThousand barrels per day (Mbd)
Note: For PEMEX and partners as of July 2021: PEMEX (1,729 Mbd) + Partners (21 Mbd). For private companies, it corresponds to the January-July average,
which is the latest figure published by CNH.
Private
companies'
production
25 Mbd (1.4%)
98.6%
PEMEX
• More than 7 years after the Energy
Reform, PEMEX contributes with most
of the oil production in Mexico.
• Last June, third parties' production
totaled 32 Mbd, averaging 25 Mbd in
1H21.
• During 2021, 99% of the total oil
production in Mexico came from
PEMEX.
1,750
Jan-Jul 2021
1,775

2021. Petróleos Mexicanos. All the rights reserved.
Crude oil prices and exports

2021. Petróleos Mexicanos. All the rights reserved.14
Mexican Crude Oil Mix Export PriceUSD/b
Note: Weighted average price based on volume,
Source: PEMEX Institutional Data Base
48.7
40.3
28.5
17.1
22.7
33.836.6
39.1 38.3 38.9 39.344.8
52.457.3
60.0 61.4 62.367.3 68.6
Jan Feb Mar Apr May Jun Jul Aug Sep Oct Nov Dec
2020 2021
For 2Q21, the average
price of the Mexican
Crude Oil Mix was
USD 63.8 per barrel,
higher than the
USD 56.5/b recorded in
1Q20.
Preliminary figures
show that July recorded
the highest average
price for this year.
2021. Petróleos Mexicanos. All the rights reserved.15
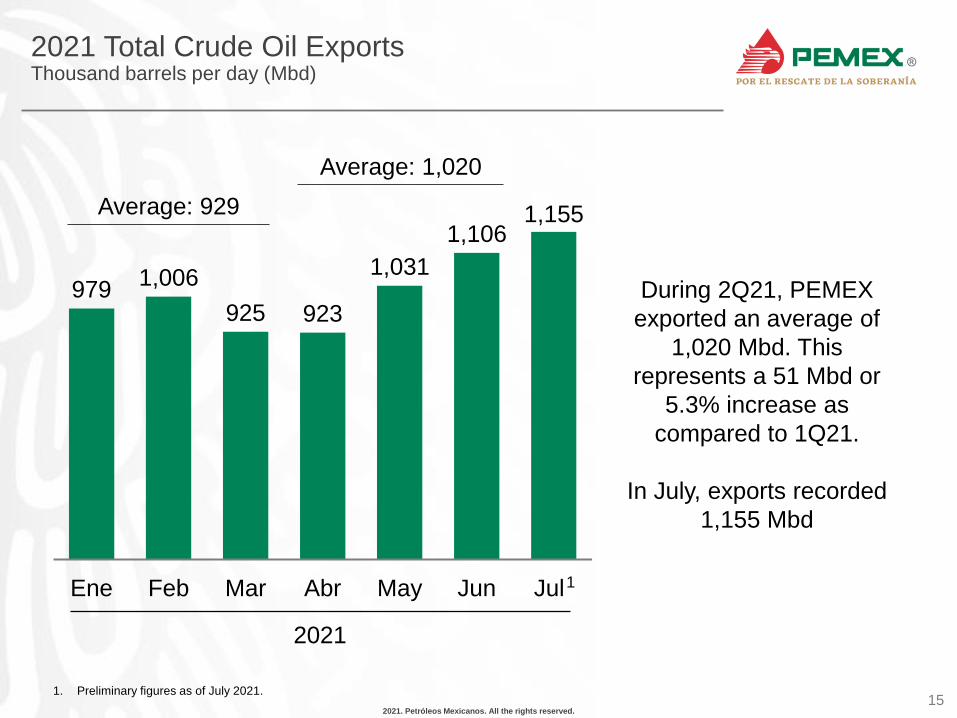
2021 Total Crude Oil ExportsThousand barrels per day (Mbd)
During 2Q21, PEMEX
exported an average of
1,020 Mbd. This
represents a 51 Mbd or
5.3% increase as
compared to 1Q21.
In July, exports recorded
1,155 Mbd
2021
1. Preliminary figures as of July 2021.
9791,006
925 923
1,031
1,1061,155
Ene Feb Mar Abr May Jun Jul*
Average: 929
Average: 1,020
1

2021. Petróleos Mexicanos. All the rights reserved.16
Light Crude Oil CommercializationThousand barrels per day
Export Import
While PEMEX imported light crude oil in the past, it is currently exporting an average of
165 thousand barrels per day of light crude oil.
85
112
21 7 8
110
89 97
158 146
122
77
55
97
40
151
32
- - - - - - - - - - - - - - - - - -
48 48
103
65
133
109
152 163
204
181
66
180
273
141
158
124114
128
211
275
-20
30
80
130
180
230
280
Ja
n-1
7
Ma
r-17
Ma
y-1
7
Ju
l-1
7
Sep
-17
No
v-1
7
Ja
n-1
8
Ma
r-18
Ma
y-1
8
Ju
l-1
8
Sep
-18
No
v-1
8
Ja
n-1
9
Ma
r-19
Ma
y-1
9
Ju
l-1
9
Sep
-19
No
v-1
9
Ja
n-2
0
Ma
r-20
Ma
y-2
0
Ju
l-2
0
Sep
-20
No
v-2
0
Ja
n-2
1
Ma
r-21
Ma
y-2
1
Ju
l-2
1
2017 2018 2019 202112020
86 Mbd 31 Mbd 4 Mbd 140 Mbd 165
Mbd
1. Preliminary figures as of July 2021.
