mahindra lifespace developers jan 15, 2017 - … pcg - pick of the week...mahindra lifespace...
TRANSCRIPT

1 | P a g e
Mahindra Lifespace Developers INVESTMENT IDEA
Jan 15, 2017
Recommendation
Buy at CMP and add on Dips
Add on dips to
Rs. 444-491
Target
Rs. 635
Time Horizon
4 - 6 Quarters
Industry
Real Estate
CMP
Rs. 491
Company Background
Mahindra Lifespace Developers is a real estate development company from the Mahindra Group. The Company,
along with its subsidiary companies, is engaged in the development of residential projects and large format
developments, such as integrated cities and industrial clusters. The Company is engaged in the construction of
buildings. Its segments include Projects, Project Management and Development activities, and operating of
commercial complexes. It serves both consumer households and businesses. Its projects in Chennai include
Aqualily, Iris Court and Nova. Its projects in Mumbai include Vivante, The Serenes and Happinest. The Company's
projects in Pune include L'Artista and Antheia. The Company's projects in Gurgaon include Aura and Luminare. The
Company's projects in Hyderabad include Ashvita. Its projects in Bangalore include Windchimes. Its projects in
Nagpur include Bloomdale. Company's subsidiaries include Mahindra Infrastructure Developers and Mahindra World
City Developers.
Investment Rationale
Mahindra Life had issued 1.03cr equity shares at Rs.292 and successfully raised ~Rs.300 crore via rights issue in
May 2017. Consequently, in Q2 FY18, company’s debt to equity ratio has halved to 0.2x from 0.38x in Q4 FY17.
Going ahead, we expect the company’s gross debt to equity ratio to remain around 0.2x and by FY19E, we expect
it to become almost net-debt free on the back of the expected healthy financial performance. As we believe cash
flows generated from residential and SEZ sales would compensate for the CAPEX. A focus on collections from home
buyers, and a lower dependency on external borrowings has led the company to maintain an unlevered balance
sheet. We expect the company’s unlevered balance sheet and unique business strategies to help it to continue
reporting growth.
SEZ Business: a long-term story
Mahindra Lifespaces is developing two integrated business cities “Mahindra World City (MWC)”, i.e. one each in
Chennai (~1,600 acres) and Jaipur (~3,000 acres) with a total area of ~4,600 acres on lines of work-live-plug-n-
play infrastructure. These cities are meticulously planned and have been divided into zones for business and
lifestyle. These comprise of Special Economic Zone (SEZ) and Domestic Tariff Area (DTA). The lifestyle zone,
located in close proximity to the Business Zone, offers residential units, school, medical centers, retail malls,
business hotels, and recreation and leisure facilities amidst wide open green spaces.
Mahindra World City Chennai has been in existence for the last 13 years, with 3 broad sectors functioning - IT
Services, Apparel & Fashion Accessories, and Auto Ancillaries (which is a domestic tariff area, DTA). It added five
new customers and an existing client leased additional land, taking the total number of industrial customers to 72;
57 of these companies were operational as on Sep 2017.
Kushal Rughani
HDFC Scrip Code MAHLIF
BSE Code 532313
NSE Code MAHLIFE
Bloomberg MLIFE
CMP as on 12 Jan-18 491
Equity Capital (Rs cr) 51.3
Face Value (Rs) 10
Equity O/S (cr) 5.13
Market Cap (Rs Cr) 2520
Book Value (Rs) 405
Avg. 52 Week Vol 117188
52 Week High (Rs) 528
52 Week Low (Rs) 320
Shareholding Pattern (%)
Promoters 51.6
Institutions 30.9
Non Institutions 17.5
PCG Risk Rating*
Yellow
* Refer Rating explanation

2 | P a g e
Mahindra Lifespace Developers INVESTMENT IDEA
Jan 15, 2017
After the success of MWC Chennai, Mahindra Life had entered the Jaipur SEZ market through its 74%
subsidiary MWC, Jaipur. Of the total ~2,061 acres of saleable area, the SEZ accounts for 1,026 acres,
DTA accounts for 349 acres and the remaining 686 acres are residential. Given the better than expected
absorption of DTA, MWC Jaipur applied for conversion of residential land to DTA and it recently got all
approvals for the 500 acres land parcel. As a result, now DTA area stands at 793 acres and the residential
areas stands at 186 acres. The residential area is yet to be launched. We expect that on attaining more
maturity from DTA space, the company would announce the launch of residential project.
The Company expects to further benefit from the ability to market to wider customer base at Jaipur upon
conversion of the sector specific SEZs into a multi-product SEZ. In addition, it is gearing up to launch
two new industrial clusters near Chennai and Ahmedabad — in line with its strategy for growth in this
segment. This is discussed in greater detail in the next section on ‘Opportunities and Strategy’, whereas
developments in the two ongoing projects are discussed in ‘Operations’.
Partnered with HDFC Capital for Affordable Housing
2016-17 saw an increase in contribution from the integrated cities and the industrial clusters business.
Over 75 acres of land leases were concluded during the year across the two operational World Cities in
Jaipur and Chennai, versus 29 acres in the previous year. This was possible primarily due to the launch
of the second phase of the domestic tariff area (DTA) in Jaipur after successful area reallocation and
product-mix approvals. Mahindra World City (MWC), Chennai, also added around 40 acres to its saleable
area that was previously not marketable due to pending approvals. Both these developments allowed the
business to reach out to a larger base of potential customers.
Mahindra Life has partnered with HDFC Capital advisors to develop affordable housing. It would jointly
invest Rs.500 crore over the next three years to develop affordable housing projects across cities in
India. This partnership will help the company to expand its affordable housing portfolio with an estimated
development footprint of ~5-10 msf under the brand name of "Happinest".
Further, the year also saw the addition of 40 acres of marketable land, in Mahindra World City, Chennai.
The Company has identified upcoming industrial destinations and corridors in the western and southern
regions, where it is looking to create a network of smaller industrial clusters as part of its growth strategy
for this business.
Key Highlights
Company is engaged in real estate
development along with its subsidiary
companies, is engaged in the
development of residential projects and
large format developments, such as
integrated cities and industrial clusters.
It had issued 1.03cr equity shares at Rs
292 and successfully raised ~Rs 300 crore
through rights issue in May 2017. After
Rights, company’s debt/equity has come
down to ~0.1x.
Mahindra Lifespaces is developing two
integrated business cities “Mahindra
World City (MWC)”, i.e. one each in
Chennai (~1,600 acres) and Jaipur
(~3,000 acres) with total area of ~4,600
acres.
Company has partnered with HDFC Capital advisors to develop affordable housing. It would jointly invest Rs 500 crore over next three years to develop affordable housing projects across cities in India. Company announced strategic partnership with International Finance
Corporation (IFC) to develop multiple industrial parks across Gujarat, Rajasthan and Maharashtra. IFC has made an investment commitment of US$ 50mn to Mahindra Life. Initially, IFC would make investment in industrial park near Ahmedabad. We see 8% revenue cagr and 21% PAT cagr over the same period led by its Mahindra World Clusters at Jaipur and Chennai and higher sales from its residential units.

3 | P a g e
Mahindra Lifespace Developers INVESTMENT IDEA
Jan 15, 2017
Project Portfolio
Region Ongoing Forthcoming Land Inventory
Area in msft. Saleable Area Saleable Area Saleable Area
Mumbai Metro Region (MMR) 0.31 1.95 0.94
Pune 0.66 0.32
Chennai 0.42 1.64 9.5
Nagpur 0.79 0.34
NCR 0.78 0.32
Nasik 0.6
Bengaluru 0.87
Total 3.83 4.9 11.04
Source: Company, HDFC sec Research
Projected Cashflow as per company’s presentation
Cashflow Potential Rs cr
Ongoing Sales Completed in ongoing projects 1504
Less: Amount collected from Sales 718
Net Amount to be collected on completed sales 786
Estimated sales from finished goods 1531
Less: Estimated Construction cost to be spent on ongoing projects 747
Cashflow from ongoing & completed projects 1570
Subsequent Phases of Ongoing Projects Estimated Sales Potential 893
Less: Estimated Construction Cost 502
Cashflow from future phases of ongoing projects 392
Total Estimated Cashflows 1961
Source: Company, HDFC sec Research

4 | P a g e
Mahindra Lifespace Developers INVESTMENT IDEA
Jan 15, 2017
Industrial Clusters
The four operational residential projects at Mahindra World City, Chennai saw occupancy increase from around 700 families in the previous
year to 1,100 families in 2016-17. On the retail and social infrastructure front, a hostel for young working professionals started operations
during the year.
Mahindra World City, Jaipur, leased 67 acres during the year adding 7 new customers while 2 existing customers took up additional space.
At the end of the year, the Company had 77 industrial customers, 47 in the SEZs and 30 in the DTA, of which 45 companies are operational
and 9 have initiated development activities. An important development during the year was the completion of the economic land use plan
for around 450 acres of residential, institutional and social infrastructure zone and the signing up of an anchor customer for the
establishment of Bharat Skill Development University in the World City.
In the industrial clusters space, Mahindra Life, through its subsidiary, secured environmental clearances for its 264 acres project near
Chennai in a joint venture with Sumitomo Corporation. It has also received in-principle approval for commencement of construction
activities from the relevant authority.
The Company, through its subsidiary, also acquired around 268 acres of land near Ahmedabad (Ahmedabad – Rajkot Highway, Limbdi) in
Gujarat for its second industrial cluster and has initiated the master planning for the project. It is in the process of securing necessary
approvals, following which infrastructure development and launch of the project can be initiated.
Company announced strategic partnership with International Finance Corporation (IFC) to develop multiple industrial parks across Gujarat,
Rajasthan and Maharashtra. IFC has made an investment commitment of US$ 50mn to Mahindra Life. At first, IFC would make investment
in industrial park near Ahmedabad.
Outlook on Real Estate
The outlook for the world economy has improved towards the end of 2016-17 driven by stronger activity in most advanced economies and
easing of recessionary conditions in large commodity-exporting emerging market economies. Despite slower growth in 2016-17 than the
year earlier, India has performed better than its peers in the emerging markets over the last few years.
Proposals in the Union Budget are expected to stimulate capital expenditure and rural demand; and the step-up in government spend on
physical infrastructure and housing is likely to benefit the real estate industry. In addition, policy breakthroughs such as Real Estate
(Regulation and Development) Act (RERA) and structural reforms like the Goods and Services Tax (GST) should not only stimulate demand,
but make the sector more efficient and organised.
The RERA seeks to improve transparency and accountability in the industry thereby protecting the rights of home buyers. The key
provisions of the Act includes the registration of projects with requisite approvals in place before the launch of any project, penalties for
delayed delivery, 70 percent of collection from customers to be mandatorily set aside for use in the specific project etc. RERA will pave
the way for stronger and robust real estate sector in India by bringing in greater uniformity in the processes followed by developers and
removing trust deficit between them and the buyers.

5 | P a g e
Mahindra Lifespace Developers INVESTMENT IDEA
Jan 15, 2017
The Company is already compliant on many aspects pertaining to RERA and its level of preparedness for adherence continues to be high.
It also believes that RERA will throw up opportunities for investments in green field / brown field real estate projects.
As RERA shapes a new way forward for the Real Estate industry, the introduction of Goods and Services Tax (GST) will be significant
structural reform as it will subsume a myriad of indirect taxes, eliminate their cascading impact and harmonise tax rates across the country.
The benefits of GST will not be limited to better tax administration and reduction in compliance costs. In the longer run, it is also expected
to bring in considerable efficiencies and stimulate demand, resulting in higher economic growth and buoyancy in tax collections.
As far as the real estate sector is concerned, the introduction of GST is expected to bring in multiple benefits: seamless credit on all inputs;
streamlining of a complicated web of taxes, authorities and jurisdictions under the current regime; and greater transparency in pricing for
the consumers as well as establishing better audit trails and monitoring mechanisms from the point of view of investors.
Other Highlights
GST Impact: Due to GST, there was hike of 2-3% in construction costs, resulting in price rise impacting residential sales volumes
during the quarter
Demand environment: The demand environment remained weak for the premium and luxury projects while strong demand was
seen for affordable housing.
World Cities Update: Company leased 5.98 acres & 4.12 acres in DTA area at MWCJ & MWCC, respectively. The management has
indicated that there has been a slowdown in leasing activity at MWCJ. For MWCC, there is a strong client pipeline but client
conversion is taking time.
New launches: New launches may be delayed as several projects are stuck due to approval delays. The launch of Vivante phase II
project is delayed due to height approval and dumping ground issue in Mumbai. Also, the Kandivali project is stuck due to dumping
ground issue. The Happinest Palghar project is stuck due to environment clearance issue.

6 | P a g e
Mahindra Lifespace Developers INVESTMENT IDEA
Jan 15, 2017
View and Valuations
Mahindra Lifespaces has strong balance sheet and has been able to raise capital at competitive terms even during challenging times. With
its focus on execution, it has been successful in attracting equity participation in both residential and industrial projects, thereby increasing
efficiency in the utilisation of its risk capital. As the economic environment improves further, company is well positioned to benefit from
the opportunities.
Mahindra Life had booked Rs 325cr sales proceeds from Byculla land development rights in FY15, which had resulted in PAT of Rs 266
crore. Going ahead, with better sales from the residential segment coupled with moderate contribution from high margin land leases
translating into better EBITDA margin, we expect net profit to grow robustly post FY18 and would surge to Rs 177cr in FY20. We expect
revenues to see robust growth post FY18 as its projects get operational. Similarly EBITDA margin would also see strong expansion over
FY17-20E. We see 8% revenue cagr and 21% PAT cagr over the same period led by its Mahindra World Clusters at Jaipur and Chennai
and higher sales from its residential units. Stock trades at ~14x FY20E earnings and 1.1x FY20 Book Value. Based upon ~1.4x Price/Book
and ~18x FY20 earnings, we recommend Mahindra Life as BUY at cmp of Rs 491 and add on dips to Rs 444 with TP of Rs 635 over the
next 4-6 quarters.
Key Risks
Delays in getting project as well as land approvals across cities could delay the projects. These delays could act as a major risk to
estimates.
Lower than expected traction from its Industrial Clusters
Slower Ramp up from Industrial Clusters

7 | P a g e
Mahindra Lifespace Developers INVESTMENT IDEA
Jan 15, 2017
Revenues to witness strong ~20% cagr over FY17-20E
Source: Company, HDFC sec Research
1086 593 762 633 765 960
51.8
-40.3
27.8
-17.2
16.8 23.8
-60
-40
-20
0
20
40
60
0
200
400
600
800
1000
1200
FY15 FY16 FY17 FY18E FY19E FY20E
Revenue Growth
EBITDA trend over FY17-20E
Source: Company, HDFC sec Research
486 177 163 141 210 297
119.6
-63.5
-7.9 -13.6
48.4 41.8
-100
-50
0
50
100
150
0
100
200
300
400
500
600
FY15 FY16 FY17 FY18E FY19E FY20E
EBITDA Growth
PAT to see strong 21% cagr over FY17-20E
Source: Company, HDFC sec Research
265
95 102
73
120
177
0
50
100
150
200
250
300
FY15 FY16 FY17 FY18E FY19E FY20E
D/E
Source: Company, HDFC sec Research
0.7
0.20.1
0.10.0 0.0
0.0
0.1
0.2
0.3
0.4
0.5
0.6
0.7
0.8
FY15 FY16 FY17 FY18E FY19E FY20E
D/E

8 | P a g e
Mahindra Lifespace Developers INVESTMENT IDEA
Jan 15, 2017
Customer Collection (Rs cr)
Source: Company, HDFC sec Research
0
20
40
60
80
100
120
140
160
180
200
Q2 FY17 Q3 FY17 Q4 FY17 Q1 FY18 Q2 FY18
No. of Units Handed Over to clients
Source: Company, HDFC sec Research
0
100
200
300
400
500
600
700
Q2 FY17 Q3 FY17 Q4 FY17 Q1 FY18 Q2 FY18
Ahmedabad SEZ Proposed Park Area (Acres)
Source: Company, HDFC sec Research
268
175
0
50
100
150
200
250
300
Gross Area Leasable Area
North Chennai Park Area (Acres)
Source: Company, HDFC sec Research
264
187
0
50
100
150
200
250
300
Gross Area Leasable Area
9 | P a g e
Mahindra Lifespace Developers INVESTMENT IDEA
Jan 15, 2017
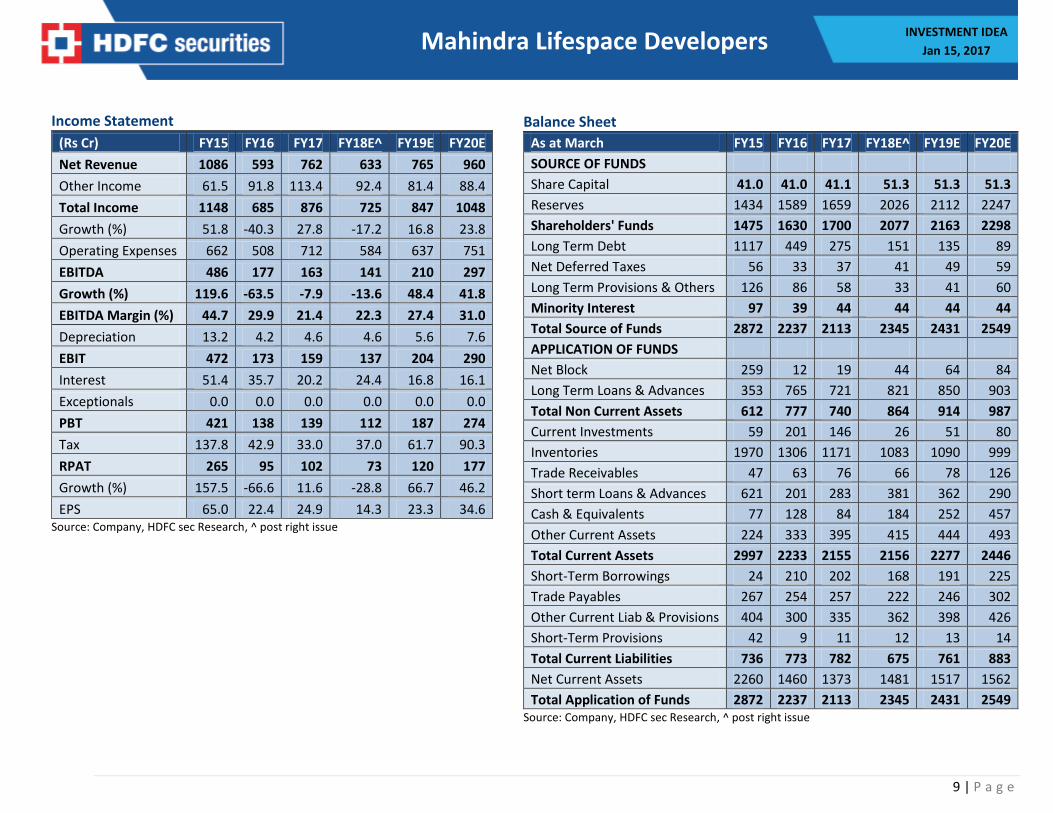
Income Statement
(Rs Cr) FY15 FY16 FY17 FY18E^ FY19E FY20E
Net Revenue 1086 593 762 633 765 960
Other Income 61.5 91.8 113.4 92.4 81.4 88.4
Total Income 1148 685 876 725 847 1048
Growth (%) 51.8 -40.3 27.8 -17.2 16.8 23.8
Operating Expenses 662 508 712 584 637 751
EBITDA 486 177 163 141 210 297
Growth (%) 119.6 -63.5 -7.9 -13.6 48.4 41.8
EBITDA Margin (%) 44.7 29.9 21.4 22.3 27.4 31.0
Depreciation 13.2 4.2 4.6 4.6 5.6 7.6
EBIT 472 173 159 137 204 290
Interest 51.4 35.7 20.2 24.4 16.8 16.1
Exceptionals 0.0 0.0 0.0 0.0 0.0 0.0
PBT 421 138 139 112 187 274
Tax 137.8 42.9 33.0 37.0 61.7 90.3
RPAT 265 95 102 73 120 177
Growth (%) 157.5 -66.6 11.6 -28.8 66.7 46.2
EPS 65.0 22.4 24.9 14.3 23.3 34.6 Source: Company, HDFC sec Research, ^ post right issue
Balance Sheet
As at March FY15 FY16 FY17 FY18E^ FY19E FY20E
SOURCE OF FUNDS
Share Capital 41.0 41.0 41.1 51.3 51.3 51.3
Reserves 1434 1589 1659 2026 2112 2247
Shareholders' Funds 1475 1630 1700 2077 2163 2298
Long Term Debt 1117 449 275 151 135 89
Net Deferred Taxes 56 33 37 41 49 59
Long Term Provisions & Others 126 86 58 33 41 60
Minority Interest 97 39 44 44 44 44
Total Source of Funds 2872 2237 2113 2345 2431 2549
APPLICATION OF FUNDS
Net Block 259 12 19 44 64 84
Long Term Loans & Advances 353 765 721 821 850 903
Total Non Current Assets 612 777 740 864 914 987
Current Investments 59 201 146 26 51 80
Inventories 1970 1306 1171 1083 1090 999
Trade Receivables 47 63 76 66 78 126
Short term Loans & Advances 621 201 283 381 362 290
Cash & Equivalents 77 128 84 184 252 457
Other Current Assets 224 333 395 415 444 493
Total Current Assets 2997 2233 2155 2156 2277 2446
Short-Term Borrowings 24 210 202 168 191 225
Trade Payables 267 254 257 222 246 302
Other Current Liab & Provisions 404 300 335 362 398 426
Short-Term Provisions 42 9 11 12 13 14
Total Current Liabilities 736 773 782 675 761 883
Net Current Assets 2260 1460 1373 1481 1517 1562
Total Application of Funds 2872 2237 2113 2345 2431 2549 Source: Company, HDFC sec Research, ^ post right issue

10 | P a g e
Mahindra Lifespace Developers INVESTMENT IDEA
Jan 15, 2017
Cash Flow Statement
(Rs Cr) FY15 FY16 FY17 FY18E^ FY19E FY20E
Reported PBT 421 138 139 112 187 274
Non-operating & EO items -96 -11 -126 -92 -81 -88
Interest Expenses 51 36 20 24 17 16
Depreciation 13 4 5 5 6 8
Working Capital Change -76 851 66 58 31 157
Tax Paid -138 -43 -33 -37 -62 -90
OPERATING CASH FLOW ( a ) 176 974 70 70 97 275
Capex -23 247 -7 -25 -20 -20
Free Cash Flow 153 1,221 64 45 77 255
Investments -54 -412 44 -99 -30 -52
Non-operating income 61 92 113 92 81 88
INVESTING CASH FLOW ( b ) -16 -73 150 -32 32 16
Debt Issuance / (Repaid) -63 -731 -199 -145 -1 -17
Interest Expenses -51 -36 -20 -24 -17 -16
FCFE 38 454 -155 -124 60 223
Share Capital Issuance 14 -59 5 10 0 0
Dividend -29 -29 -30 -28 -39 -49
FINANCING CASH FLOW ( c ) -130 -855 -244 -187 -57 -81
NET CASH FLOW (a+b+c) 30 46 -23 -149 72 210 Source: Company, HDFC sec Research, ^ post right issue
Key Ratios
(Rs Cr) FY15 FY16 FY17 FY18E^ FY19E FY20E
EBITDA Margin 44.7 29.9 21.4 22.3 27.4 31.0
EBIT Margin 43.5 29.2 20.8 21.6 26.6 30.2
APAT Margin 26.1 15.9 13.9 11.9 16.4 19.1
RoE 19.3 5.9 6.1 3.9 5.6 8.0
RoCE 16.4 7.7 7.5 5.8 8.4 11.4
Solvency Ratio
Net Debt/EBITDA (x) 2.1 1.9 1.5 0.8 0.1 -0.7
D/E 0.8 0.4 0.3 0.2 0.2 0.1
Net D/E 0.7 0.2 0.1 0.1 0.0 -0.1
Interest Coverage 9.2 4.9 7.9 5.6 12.1 18.0
PER SHARE DATA
EPS 65.0 22.4 24.9 14.3 23.3 34.6
CEPS 67.8 23.4 25.9 15.2 24.4 36.1
BV 360 397 414 405 421 448
Dividend 6.0 6.0 6.0 4.5 6.5 8.0
Turnover Ratios (days)
Debtor days 16 39 36 38 37 48
Inventory days 630 1008 593 625 520 380
Creditors days 147 183 132 139 141 147
VALUATION
P/E 7.2 20.8 18.7 32.6 20.0 13.4
P/BV 1.3 1.2 1.1 1.1 1.1 1.0
EV/EBITDA 6.0 16.4 17.9 20.7 13.9 9.8
EV / Revenues 2.7 4.9 3.8 4.6 3.8 3.0
Dividend Yield (%) 1.3 1.3 1.3 1.0 1.4 1.7 Source: Company, HDFC sec Research, ^ post right issue

11 | P a g e
Mahindra Lifespace Developers INVESTMENT IDEA
Jan 15, 2017
Rating Chart
R E T U R N
HIGH
MEDIUM
LOW
LOW MEDIUM HIGH
RISK
Ratings Explanation:
RATING Risk - Return BEAR CASE BASE CASE BULL CASE
BLUE LOW RISK - LOW RETURN STOCKS
IF RISKS MANIFEST PRICE CAN FALL 20% OR MORE
IF RISKS MANIFEST PRICE CAN FALL 15%
& IF INVESTMENT RATIONALE
FRUCTFIES PRICE CAN RISE BY 15%
IF INVESTMENT RATIONALE
FRUCTFIES PRICE CAN RISE BY 20% OR
MORE
YELLOW MEDIUM RISK - HIGH RETURN STOCKS
IF RISKS MANIFEST PRICE CAN FALL 35% OR MORE
IF RISKS MANIFEST PRICE CAN FALL 20%
& IF INVESTMENT RATIONALE
FRUCTFIES PRICE CAN RISE BY 30%
IF INVESTMENT RATIONALE
FRUCTFIES PRICE CAN RISE BY 35% OR
MORE
RED HIGH RISK - HIGH RETURN STOCKS
IF RISKS MANIFEST PRICE CAN FALL 50% OR MORE
IF RISKS MANIFEST PRICE CAN FALL 30%
& IF INVESTMENT RATIONALE
FRUCTFIES PRICE CAN RISE BY 30%
IF INVESTMENT RATIONALE
FRUCTFIES PRICE CAN RISE BY 50%
OR MORE
12 | P a g e
Mahindra Lifespace Developers INVESTMENT IDEA
Jan 15, 2017
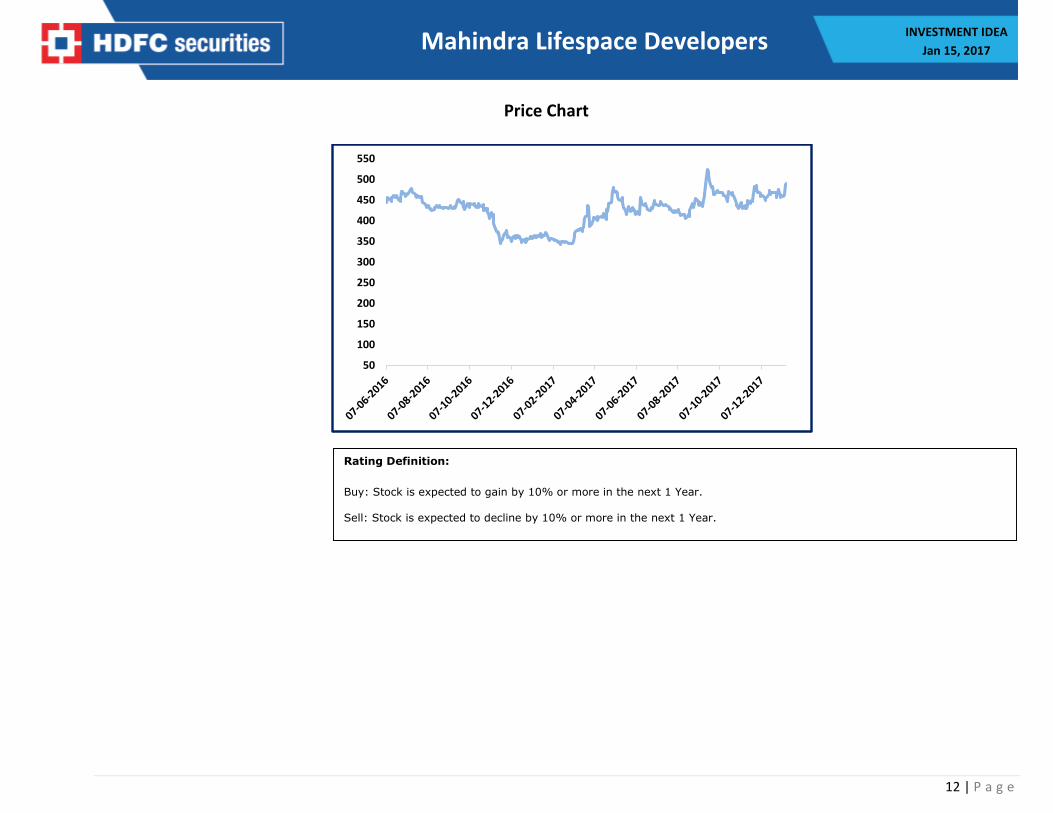
Price Chart
50
100
150
200
250
300
350
400
450
500
550
Rating Definition:
Buy: Stock is expected to gain by 10% or more in the next 1 Year. Sell: Stock is expected to decline by 10% or more in the next 1 Year.

13 | P a g e
Mahindra Lifespace Developers INVESTMENT IDEA
Jan 15, 2017
Disclosure: I, Kushal Rughani, MBA, authors and the names subscribed to this report, hereby certify that all of the views expressed in this research report accurately reflect our views about the subject issuer(s) or securities. HSL has no material adverse disciplinary history as on the date of publication of this report. We also certify that no part of our compensation was, is, or will be directly or indirectly related to the specific recommendation(s) or view(s) in this report. Research Analyst or HDFC Securities Ltd. Does not have financial interest in the subject company. Also Research Analyst or his relative or HDFC Securities Ltd. or its Associate may have beneficial ownership of 1% or more in the subject company at the end of the month immediately preceding the date of publication of the Research Report. Further Research Analyst or HDFC Securities Ltd. or its associate does not have material conflict of interest. Any holding in stock – No HDFC Securities Limited (HSL) is a SEBI Registered Research Analyst having registration no. INH000002475. Disclaimer: This report has been prepared by HDFC Securities Ltd and is meant for sole use by the recipient and not for circulation. The information and opinions contained herein have been compiled or arrived at, based upon information obtained in good faith from sources believed to be reliable. Such information has not been independently verified and no guaranty, representation of warranty, express or implied, is made as to its accuracy, completeness or correctness. All such information and opinions are subject to change without notice. This document is for information purposes only. Descriptions of any company or companies or their securities mentioned herein are not intended to be complete and this document is not, and should not be construed as an offer or solicitation of an offer, to buy or sell any securities or other financial instruments. This report is not directed to, or intended for display, downloading, printing, reproducing or for distribution to or use by, any person or entity who is a citizen or resident or located in any locality, state, country or other jurisdiction where such distribution, publication, reproduction, availability or use would be contrary to law or regulation or what would subject HSL or its affiliates to any registration or licensing requirement within such jurisdiction. If this report is inadvertently send or has reached any individual in such country, especially, USA, the same may be ignored and brought to the attention of the sender. This document may not be reproduced, distributed or published for any purposes without prior written approval of HSL. Foreign currencies denominated securities, wherever mentioned, are subject to exchange rate fluctuations, which could have an adverse effect on their value or price, or the income derived from them. In addition, investors in securities such as ADRs, the values of which are influenced by foreign currencies effectively assume currency risk. It should not be considered to be taken as an offer to sell or a solicitation to buy any security. HSL may from time to time solicit from, or perform broking, or other services for, any company mentioned in this mail and/or its attachments. HSL and its affiliated company(ies), their directors and employees may; (a) from time to time, have a long or short position in, and buy or sell the securities of the company(ies) mentioned herein or (b) be engaged in any other transaction involving such securities and earn brokerage or other compensation or act as a market maker in the financial instruments of the company(ies) discussed herein or act as an advisor or lender/borrower to such company(ies) or may have any other potential conflict of interests with respect to any recommendation and other related information and opinions. HSL, its directors, analysts or employees do not take any responsibility, financial or otherwise, of the losses or the damages sustained due to the investments made or any action taken on basis of this report, including but not restricted to, fluctuation in the prices of shares and bonds, changes in the currency rates, diminution in the NAVs, reduction in the dividend or income, etc. HSL and other group companies, its directors, associates, employees may have various positions in any of the stocks, securities and financial instruments dealt in the report, or may make sell or purchase or other deals in these securities from time to time or may deal in other securities of the companies / organizations described in this report.
HSL or its associates might have managed or co-managed public offering of securities for the subject company or might have been mandated by the subject company for any other assignment in the past twelve months. HSL or its associates might have received any compensation from the companies mentioned in the report during the period preceding twelve months from t date of this report for services in respect of managing or co-managing public offerings, corporate finance, investment banking or merchant banking, brokerage services or other advisory service in a merger or specific transaction in the normal course of business. HSL or its analysts did not receive any compensation or other benefits from the companies mentioned in the report or third party in connection with preparation of the research report. Accordingly, neither HSL nor Research Analysts have any material conflict of interest at the time of publication of this report. Compensation of our Research Analysts is not based on any specific merchant banking, investment banking or brokerage service transactions. HSL may have issued other reports that are inconsistent with and reach different conclusion from the information presented in this report. Research entity has not been engaged in market making activity for the subject company. Research analyst has not served as an officer, director or employee of the subject company. We have not received any compensation/benefits from the Subject Company or third party in connection with the Research Report. HDFC securities Limited, I Think Techno Campus, Building - B, "Alpha", Office Floor 8, Near Kanjurmarg Station, Opp. Crompton Greaves, Kanjurmarg (East), Mumbai 400 042 Phone: (022) 3075 3400 Fax: (022) 2496 5066 Compliance Officer: Binkle R. Oza, Email: [email protected], Phone: (022) 3045 3600 HDFC Securities Limited, SEBI Reg. No.: NSE-INB/F/E 231109431, BSE-INB/F 011109437, AMFI Reg. No. ARN: 13549, PFRDA Reg. No. POP: 04102015, IRDA Corporate Agent License No.: HDF 2806925/HDF C000222657, SEBI Research Analyst Reg. No.: INH000002475, CIN - U67120MH2000PLC152193 Mutual Funds Investments are subject to market risk. Please read the offer and scheme related documents carefully before investing.