magnum opus: humanity at crossroads - advisor · pdf filemagnum opus: humanity at crossroads...
TRANSCRIPT

Magnum opus: Humanity at crossroadsJune 7, 2017
by Wim Grommenof Transfer Solutions
Magnum opus: Humanity at crossroads
Every production phase or civilization or other human invention goes through a so calledtransformation process. Transitions are social transformation processes that cover at least onegeneration. In this article I will use one such transition to demonstrate that humanity is at a crossroads:up to a third world war or will humanity create new heaven on earth.
When we consider the characteristics of the phases of a social transformation we may find ourselvesat the end of what might be called the third industrial revolution. Transitions are social transformationprocesses that cover at least one generation (= 25 years). A transition has the followingcharacteristics:
- it involves a structural change of civilization or a complex subsystem of our civilization- it shows technological, economical, ecological, socio cultural and institutional changes atdifferent levels that influence and enhance each other- it is the result of slow changes (changes in supplies) and fast dynamics (flows)
Examples of historical transitions are the demographical transition and the transition from coal tonatural gas which caused transition in the use of energy. A transition process is not fixed from the startbecause during the transition processes will adapt to the new situation. A transition is not dogmatic.
Page 1, ©2018 Advisor Perspectives, Inc. All rights reserved.

Figure: demographical transition
Four transition phases
In general transitions can be seen to go through the S curve and we can distinguish four phases (seefig. 1):
1. a pre development phase of a dynamic balance in which the present status does not visiblychange
2. a take off phase in which the process of change starts because of changes in the system3. an acceleration phase in which visible structural changes take place through an accumulation of
socio cultural, economical, ecological and institutional changes influencing each other; in thisphase we see collective learning processes, diffusion and processes of embedding
4. a stabilization phase in which the speed of sociological change slows down and a new dynamicbalance is achieved through learning
A product life cycle also goes through an S curve. In that case there is a fifth phase:
5. the degeneration phase in which cost rises because of over capacity and the producer will finallywithdraw from the market.
Page 2, ©2018 Advisor Perspectives, Inc. All rights reserved.

The S curve of a transition
Figure: Four phases in a transition best visualized by means of an
S – curve: Pre-development, Take off, Acceleration, Stabilization.
Spreading process of transitions
The process of the spreading of transitions over civilizations is influenced by a number of elements:
- physical barriers: oceans, deserts, mountain ranges, swamps, lakes- socio cultural barriers: difference in culture and languages- religious barriers- psychological barriers
The Neolithic transition was the most transition for mankind. This first agricultural revolution (10000 –3000 BC) forms the change from societies of hunter gatherers (20 – 50 people) close to water with anomadic existence to a society of people living in settlements growing crops and animals. Ahierarchical society came into existence. Joint organizations protected and governed the interests ofthe individual. Performing (obligatory) services for the community could be viewed as a first type oftaxation. Stocks were set up with stock management, trade emerged, inequality and theft. Ways ofadministering justice were invented to solve conflicts within and between communities and war becamea way of protecting interests.
Page 3, ©2018 Advisor Perspectives, Inc. All rights reserved.

The Neolithic revolution started in those places that were most favorable because of the climate andsources of food. In very cold, very hot or dry areas the hunter gatherer societies lasted longer. Severalareas are pointed out as possible starting points: southern Anatolia, the basins the Yangtze Kiang andYellow river in China, the valley of the Indus, the present Peru in the Andes or what is now Mexico inCentral America. From these areas the revolution spread across the world.
The start of the Neolithic era and the spreading process are different in each area. In some areas thechanges are relatively quick and some authors therefore like to speak of a Neolithic revolution. Modernhistorians prefer to speak of the Neolithic evolution. They have come to realize that in many areas theprocess took much longer and was much more gradual than they originally thought.
Three drastic transitions
When we look back over the past two centuries, we see three transitions taking place with far-reachingeffects.
1. The first industrial revolution
The first industrial revolution lasted from around 1780 tot 1850. It was characterized by a transitionfrom small scale handwork to mechanized production in factories. The great catalyst in the processwas the steam engine which also caused a revolution in transport as it was used in railways andshipping. The first industrial revolution was centered around the cotton industry. Because steamengines were made of iron and ran on coal, both coal mining and iron industry also flourished.
Britain was the first country that faced the industrial revolution. The steam engine was initially mainlyused to power the water pumps of mines. A major change occurred in the textile industry. Because ofpopulation growth and colonial expansion the demand for cotton products quickly increased. Becausespinners and weavers could not keep up with the demand, there was an urgent need for a loom with anexternal power unit, the power loom.
A semi-automatic shuttleless loom was invented, and a machine was created that could spin severalthreads simultaneously. This "Spinning Jenny", invented in 1764 by James Hargreaves, was followedin 1779 by a greatly improved loom: 'Mule Jenny’. At first they were water-powered, but after 1780 thesteam engine had been strongly improved so that it could also be used in the factories could be usedas a power source. Now much more textiles could be produced. This was necessary because in 1750,Europe had 130 million inhabitants, but in 1850 this number had doubled, partly because of theagricultural revolution. (This went along with the industrial revolution; fertilizers were imported,drainage systems were designed and ox was replaced by the horse. By far the most important elementof the agricultural revolution was the change from subsistence to production for the market.)
All those people needed clothing. Thanks to the machine faster and cheaper production was possibleand labor remained cheap. The textile industry has been one of the driving forces of the industrialrevolution.
Belgium becomes the first industrialized country in continental Europe. Belgium is "in a state ofindustrial revolution" under the rule of Napoleon Bonaparte. The industrial centers were Ghent (cotton
Page 4, ©2018 Advisor Perspectives, Inc. All rights reserved.

and flax industries), Verviers (mechanized wool production), Liège (iron, coal, zinc, machinery andglass), Mons and Charleroi. On the mainland, France and Prussia followed somewhat later. In Americathe northeastern states of the United States followed quickly. After 1870 Japan was industrialized asthe first non-Western country. The rest of Europe followed only around 1880.
The beginning of the end of this revolution was in 1845 when Friedrich Engels, son of a German textilebaron, described the living conditions of the English working class in “The condition of the workingclass in England“.
2. The second industrial revolution
The second industrial revolution started around 1870 and ended around 1930. It was characterized byongoing mechanization because of the introduction of the assembly line, the replacement of iron bysteel and the development of the chemical industry. Furthermore coal and water were replaced by oiland electricity and the internal combustion engine was developed. Whereas the first industrialrevolution was started through (chance) inventions by amateurs, companies invested a lot of money inprofessional research during the second revolution, looking for new products and production methods.In search of finances small companies merged into large scale enterprises which were headed byprofessional managers and shares were put on the market. These developments caused the transitionfrom the traditional family business to Limited Liability companies and multinationals.
The United States (U.S.) and Germany led the way in the Second Industrial Revolution. In the U.S.there were early experiments with the assembly line system, especially in the automotive industry. Inaddition, the country was a leader in the production of steel and oil. In Germany the electricity industryand the chemical industry flourished. The firms AEG and Siemens were electricity giants. Germanchemical companies such as AGFA and BASF had a leading share in the production of synthetic dyes,photographic and plastic products (around 1900 they controlled some 90% of the worldwide market). Inthe wake of these two industrial powers (which soon surpassed Britain) France, Japan and Russiafollowed. After the Second Industrial Revolution more and more countries, on more continents,experienced a more or less modest industrial development. In some cases, the industrialization wastaken in hand by the state, often with coarse coercion - such as the five-year plans in the Soviet Union.
After the roaring twenties the revolution ended with the stock exchange crash of 1929. Theconsequences were disastrous culminating in the Second World War.
3. The third industrial revolution
The third industrial revolution started around 1940 and is nearing its end. The United States and Japanplayed a leading role in the development of computers. During the Second World War great effortswere made to apply computer technology to military purposes. After the war the American spaceprogram increased the number of applications. Japan specialized in the use of computers for industrialpurposes such as the robot.
From 1970 the third industrial revolution continued to Europe. The third industrial revolution wasmainly a result of a massive development of microelectronics: electronic calculators, digital watchesand counters, the compact disc, the barcode etc.
Page 5, ©2018 Advisor Perspectives, Inc. All rights reserved.

The acceleration phase of the third industrial revolution started around 1980 with the advent of themicroprocessor. The development of the microprocessor is also the basis of the evolution andbreakthrough of computing. This had an impact in
many areas: for calculation, word processing, drawing and graphic design, regulating and controllingmachines, simulating processes, capturing and processing information, monetary transactions andtelecommunications. The communication phase grows enormously at the beginning of the newmillennium: the digital revolution. According to many analysts now a new era has emerged: that of theinformation or service economy. Here the acquisition and channeling of information has become moreimportant than pure production.
By now computer and communication technology take up an irreplaceable role in all parts of the world.More countries depend on the service sector and less on agriculture and industry.
Effects of three industrial revolutions
The first (and second revolution) transformed an agricultural society into an industrial society wheremechanization (finally) relieved man of physical labor. The craft industry could not compete with thefactories that put products of the same or even better quality on the market at a lower price. The resultwas that many small businesses went bankrupt and the former workers went to work in the factories.The effects of industrialization were seen in the process of rapid urbanization of formerly relativelysmall villages and towns where the new plants came. These turned into dirty and unhealthy industrialcities. Still people from the country were forced to go and work there. Because of this a new socialclass emerged: the workers, or the industrial proletariat. They lived in overcrowded slums in poorhousing with little sanitation. The average life expectancy was low, and infant mortality high. The eliteaccepted the filth of the factories as the inevitable price for their success. The chimneys were symbolsof economic power, but also of social inequality. You see this social inequality appear after eachrevolution. The gap between the bottom and the top of society becomes very large. Eventually there areinevitable responses that decrease this gap. It could be argued that the Industrial revolutions havecreated the conditions for a society with little or no poverty.
The third revolution transformed an industrial society into a service society. Where mechanization manrelieved of physical labor, the computer relieved him of mental labor. This revolution made lowerpositions in industry more and more obsolete and caused the emergence of entirely new roles in theservice sector.
The emergence of a stock market boom In the development and take-off phases of the industrialrevolution many new companies emerged. All these companies went through more or less the samecycle simulataneously. During the second industrial revolution these new companies emerged in thesteel, oil, automotive and electrical industries, and during the third industrial revolution the newcompanies emerged in the hardware, software, consulting and communications industries. During theacceleration phase of a new industrial revolution many of these businesses tend to be in theacceleration phase of their life cycle, more or less in parallel.
Page 6, ©2018 Advisor Perspectives, Inc. All rights reserved.
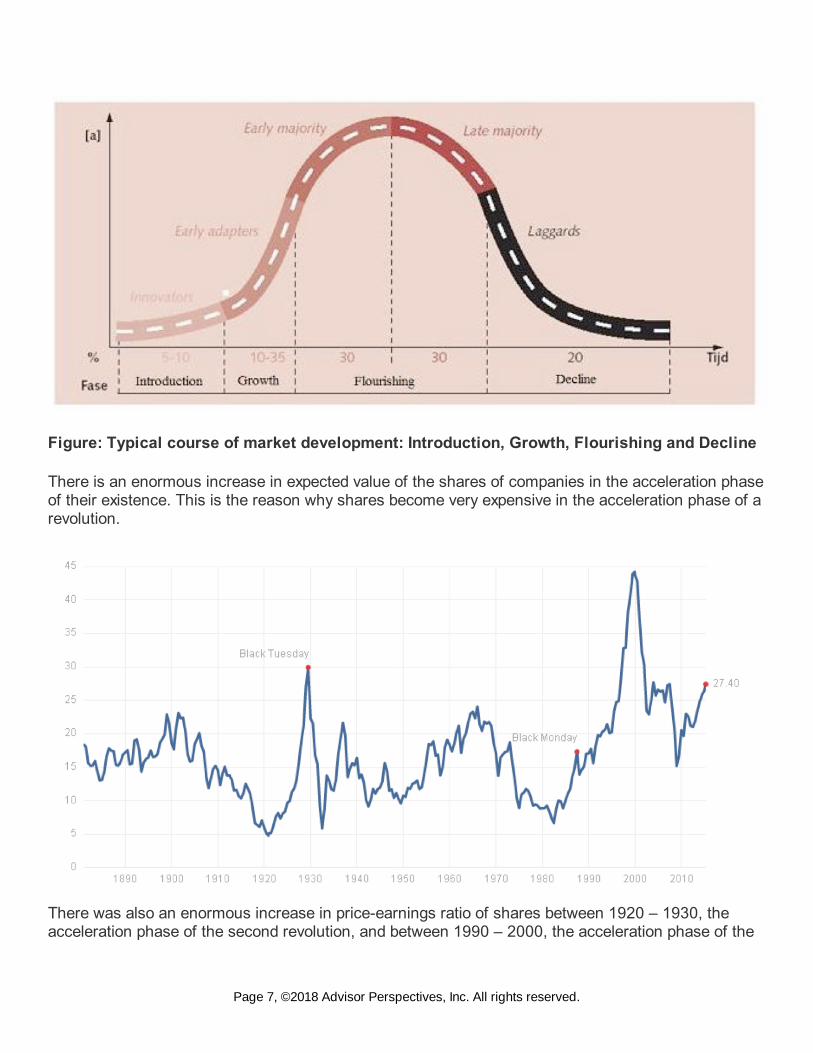
Figure: Typical course of market development: Introduction, Growth, Flourishing and Decline
There is an enormous increase in expected value of the shares of companies in the acceleration phaseof their existence. This is the reason why shares become very expensive in the acceleration phase of arevolution.
There was also an enormous increase in price-earnings ratio of shares between 1920 – 1930, theacceleration phase of the second revolution, and between 1990 – 2000, the acceleration phase of the
Page 7, ©2018 Advisor Perspectives, Inc. All rights reserved.

third revolution.
Figure: Two industrial revolutions: Shiller PE Ratio (price / income) Splitting shares fuelsprice-earnings ratio
The increase in the price-earnings ratio is amplified because many companies decide to split theirshares during the acceleration phase of their existence. A stock split is required if the market value of ashare has grown too large, rendering the marketability insufficient. A split increases the value of theshares because there are more potential investors when they are cheaper. Between 1920 - 1930 and1990 – 2000 there have been huge amount of stock splits that impacted the price-earnings ratiopositively.
Date Company Split
December 31, 1927American Can 6 for 1
December 31, 1927General Electric 4 for 1
December 31, 1927Sears, Roebuck & Company 4 for 1
December 31, 1927American Car & Foundry 2 for 1
December 31, 1927American Tobacco 2 for 1
November 5, 1928 Atlantic Refining 4 for 1
December 13, 1928General Motors 2 1/2 for 1
December 13, 1928International Harvester 4 for 1
January 8, 1929 American Smelting 3 for 1
January 8, 1929 Radio Corporation of America5 for 1
May 1, 1929 Wright-Aeronautical 2 for 1
May 20, 1929 Union Carbide split 3 for 1
June 25, 1929 Woolworth split 2 1/2 for 1
Table 1: Share Splits before the stock market crash of 1929
Page 8, ©2018 Advisor Perspectives, Inc. All rights reserved.

Date Company Split
January 22,1990 DuPont 3 for 1
May 14,1990 Coca-Cola Company 2 for 1
May 22, 1990 Westinghouse Electric stock 2 for 1
June 1, 1990 Woolworth Corporation 2 for 1
June 11, 1990 Boeing Company 3 for 2
May 12, 1992 Coca-Cola Company 2 for 1
May18, 1992 Walt Disney Co 4 for 1
May 26, 1992 Merck & Company 3 for 1
June 15, 1992 Proctor & Gamble 2 for 1
May 5, 1993 Goodyear Tire & Rubber Company 2 for 1
March 15, 1994 AlliedSignal Incorporated 2 for 1
April 11, 1994 Minnesota Mining & Manufacturing2 for 1
May 16, 1994 General Electric Company 2 for 1
June 13, 1994 Chevron Corporation 2 for 1
June 27, 1994 McDonald’s Corporation 2 for 1
September 6, 1994 Caterpillar Incorporated 2 for 1
February 27, 1995 Aluminum Company of America 2 for 1
September 18, 1995International Paper Company 2 for 1
May 13, 1996 Coca-Cola Company 2 for 1
December 11, 1996 United Technologies Corporation 2 for 1
April 11, 1997 Exxon Corporation 2 for 1
Page 9, ©2018 Advisor Perspectives, Inc. All rights reserved.

April 14, 1997 Philip Morris Companies 3 for 1
May 12, 1997 General Electric Company 2 for 1
May 28, 1997 International Business Machine 2 for 1
June 9, 1997 Boeing Company 2 for 1
June 13, 1997 DuPont Company 2 for 1
July 14, 1997 Caterpillar Incorporated 2 for 1
September 16, 1997AlliedSignal 2 for 1
September 22, 1997Proctor & Gamble 2 for 1
November 20, 1997 Travelers Group Incorporated 3 for 2
July 10, 1998 Walt Disney Company 3 for 1
February 17, 1999 Merck & Company 2 for 1
February 26, 1999 Alcoa Incorporated 2 for 1
March 8, 1999 McDonald’s Corporation 2 for 1
April 16, 1999 AT&T Corporate 2 for 1
April 20, 1999 Wal-Mart Incorporated 2 for 1
May 18, 1999 United Technology Corporation 2 for 1
May 27, 1999 International Business Machine 2 for 1
June 1, 1999 Citigroup Incorporated 3 for 2
December 31, 1999 Home Depot 3 for 2
Table 2: Share Splits during the period 1990-2000
Share Splits keep letting the Dow Jones Index explode
The Dow Jones Index was first published on May 26, 1896. The index was calculated by dividing thesum of all the shares of 12 companies by 12:
Page 10, ©2018 Advisor Perspectives, Inc. All rights reserved.

Dow12_May_26_1896 = (S1 + S2 + .......... + S12) / 12
OnOctober 4, 1916, the Dow was expanded to20 companies; 4 companies were removed and 12 wereadded.
Dow20_Oct_4_1916 = (S1 + S2 + .......... + S20) / 20
On December 31, 1927, two years before the stock market crash in October 1929, for the first time anumber of companies split their shares. With each change in the composition of the Dow Jones andwith each share split, the formula to calculate the Dow Jones is adjusted. This happens because theindex, the outcome of the two formulas of the two baskets, must stay the same at the moment ofchange, because there can not be a gap in the graph. At first a weighted average was calculated forthe shares that were split on December 31, 1927.
The formula looks like this: (American Can, split 6 to 1 is multiplied by 6, General Electric, split 4 to 1 ismultiplied by 4, etc.)
Dow20_dec_31_1927 = (6.AC + 4.GE+ ..........+S20) / 20
On October 1st, 1928, the Dow Jones grows to 30 companies.
Calculating the index had to be simplified at this point because all the calculations were still done byhand. The weighted average for the split shares is removed and the Dow Divisor is introduced. Theindex is now calculated by dividing the sum of the share values by the Dow Divisor. Because the indexfor October 1st, 1928, cannot suddenly change, the Dow Divisor is initially set to 16.67. After all, theindex graph for the two time periods (before and after the Dow Divisor was introduced) should still looklike a single continuous line. The calculation is now as follows:
Dow30_oct_1_1928 = (S1 + S2+ ..........+S30) / 16.67
In the fall of 1928 and the spring of 1929 (see Table 1) 8 more stock splits occur, causing the DowDivisor to drop to 10.77.
Dow30_jun_25_1929 = (S1 + S2+ ..........+S30) / 10.77
From October 1st, 1928 onward an increase in value of the 30 shares means the index value almostdoubles. From June 25th, 1929 onward it almost triples compared to a similar increase before stocksplitting was introduced. Using the old formula the sum of the 30 shares would simply be divided by 30.
Page 11, ©2018 Advisor Perspectives, Inc. All rights reserved.

Figure: Dow Jones Index before and after Black Tuesday
The extreme rise in the Dow Jones in the period 1920 - 1929 and especially between 1927 - 1929, wasprimarily caused because the expected value of the shares of companies that are in the accelerationphase of their existence, was increasing enormously. The value of the shares is strengthened furtherby stock splits and as icing on the cake this value of the shares was enlarged again in the Dow JonesIndex, because behind the scenes the formula of the Dow Jones was adjusted due to stock splits.
During the acceleration phase of the third industrial revolution, 1990 - 2000, history has repeated itself.In this period there have again been many stock splits, particularly in the years 1997 and 1999.
Page 12, ©2018 Advisor Perspectives, Inc. All rights reserved.

The formulathatwasused onJanuary 1, 1990to calculatethe Dow Jones:Table 3: Summary DJIA, Dow
Page 13, ©2018 Advisor Perspectives, Inc. All rights reserved.

Divisor and amount share splits between 1990-2000
Dow30_jan_1_1990 = (S1 + S2+ ..........+S30) / 0.586
The formula that was used on December 31, 1999 was to calculate the Dow Jones:
Dow30_dec_31_1999 = (S1 + S2+ ..........+S30) / 0.20145268
On December 31, 1999 on an increase of the 30 stocks again nearly three times as many index points,the same value increase on January 1, 1990. Stock market indices are mirages
What does a stock exchange index like DJIA, S&P 500 or AEX mean?
The Dow Jones Industrial Average (DJIA) Index is the oldest stock index in the United States. This wasa straight average of the rates of twelve shares. A select group of journalists from The Wall StreetJournal decide which companies are part of the most influential index in the world market. Unlike mostother indices the Dow is a price-weighted index. This means that stocks with high absolute share pricehave a significant impact on the movement of the index.
The S & P Index is a market capitalization weighted index. The 500 largest U.S. companies asmeasured by their market capitalization are included in this index, which is compiled by the credit ratingagency Standard & Poor's.
The Amsterdam Exchange index (AEX) is the main Dutch stock market index. The index displays theimage of the price development of the 25 most traded shares on the Amsterdam stock exchange. Froma weighted average of the prices of these shares, the position of the AEX is calculated.
In many graphs the y-axis is a fixed unit, such as kg, meter, liter or euro. In the graphs showing thestock exchange values, this also seems to be the case because the unit shows a number of points.However, this is far from true! An index point is not a fixed unit in time and does not have any historicalsignificance.
An index is calculated on the basis of a set of shares. Every index has its own formula and the formulagives the number of points of the index. Unfortunately many people attach a lot of value to thesegraphs which are, however, very deceptive.
An index is calculated on the basis of a set of shares. Every index has its own formula and theformula results in the number of points of the index. However, this set of shares changesregularly. For a new period the value is based on a different set of shares. It is very strange thatthese different sets of shares are represented as the same unit. After a period of 25 years thevalue of the original set of apples is compared to the value of a set of pears. At the moment only6 of the original 30 companies that made up the set of shares of the Dow Jones at the start ofthe acceleration of the last revolution (in 1979) are still present.Even more disturbing is the fact that with every change in the set of shares used to calculate thenumber of points, the formula also changes. This is done because the index which is the result of
Page 14, ©2018 Advisor Perspectives, Inc. All rights reserved.

two different sets of shares at the moment the set is changed, must be the same for both sets atthat point in time. The index graphs must be continuous lines. For example, the Dow Jones iscalculated by adding the shares and dividing the result by a number. Because of changes in theset of shares and the splitting of shares the divider changes continuously. At the moment thedivider is 0.15 but in 1985 this number was higher than 1. An index point in two periods of time istherefore calculated in different ways: Dow1985 = (S1 + S2 + ........+S30) / 1
Dow2017 = (S1 + S2 + ........ + S30) / 0,146 In the nineties of the last century many shares were split.To make sure the result of the calculation remained the same both the number of shares and thedivider changed (which I think is wrong). An increase in share value of 1 dollar of the set of shares in2017 results is 7.6 times more points than in 1985. The fact that in the 1990’s many shares were splitis probably the cause of the exponential growth of the Dow Jones index. At the moment the Dow is at21000 points. If we used the 1985 formula it would be at 2747 points.
The most remarkable characteristic is of course the constantly changing set of shares. Generallyspeaking, the companies that are removed from the set are in a stabilization or degenerationphase. Companies in a take-off phase or acceleration phase are added to the set. This greatlyincreases the chance that the index will rise rather than go down. This is obvious, especiallywhen this is done during the acceleration phase of a transition. From 1980 onwards 7 ICTcompanies (3M, AT&T, Cisco, HP, IBM, Intel, Microsoft) , the engines of the latest revolution,were added to the Dow Jones and 5 financial institutions, which always play an important role inevery transition. This is actually a kind of pyramid scheme. All goes well as long as companiesare added that are in their take-off phase or acceleration phase. At the end of a transition,however, there will be fewer companies in those phases. The last 18 years were 21 companiesreplaced in the Dow Jones, a percentage of 70%.
Overview modifications Dow Jones from 1997:
21 winners in -- 21 losers out, a figure of 70% March 19, 2015: Apple replaced AT & T. In order tomake Apple suitable for the Dow Jones, there was a share split of Apple seven for one on June 9,2014
September 23, 2013: Hewlett-Packard Co., Bank of America Inc. and Alcoa Inc. replaced GoldmanSachs Group Inc., Nike Inc. and Visa Inc. Alcoa has dropped from $40 in 2007 to $8.08. Hewlett-Packard Co. has dropped from $50 in 2010 to $22.36. Bank of America has dropped from $50 in 2007to $14.48. But Goldman Sachs Group Inc., Nike Inc. and Visa Inc. have risen 25%, 27% and 18%respectively in 2013.
HP is trading at an approximate price of $22, BoA at $14 and Alcoa at $8 (sum total of $44). Theseshares will be replaced by Goldman Sachs at $164, Nike at $67 and Visa at $184 (sum total of $415)which is 9.4 times more. This means that the new sum of the 30 stocks have a value of $2,349 (1978– 44 + 415) and, therefore we expect that the Dow Divisor will be adjusted from 0.130216081 to0.154631 to get back to the original 15,191 index points (15,191 x 0.154631 = $2,349).
Given the above, had the three old shares increased by 10% each in price in the past the Dow 30would have increased by 33.8 points in total (10% x 44 divided by 0.130216081 = 33.79 points)
Page 15, ©2018 Advisor Perspectives, Inc. All rights reserved.

assuming there was no change in the price of the other 27 stocks.
As of September 23rd, however, a corresponding 10% increase in the price of each of the newshares would contribute 268.4 points to the rise of the Dow 30 (10% x 415 divided by 0.154631 =268.38) or 7.94 times more points.
The influence of the 3 losers was: $44 of $1,978. This is 2.2% of the Dow Jones Index. The influenceof the 3 winners becomes: $415 of $2,349. This is 17.67% of the Dow Jones Index.
September 20, 2012: UnitedHealth Group Inc. (UNH) replaces Kraft Foods Inc. Kraft Foods Inc. wassplit into two companies and was therefore deemed less representative so no longer suitable for theDow. The share value of UnitedHealth Group Inc. had risen for two years before inclusion in the Dowby 53%.
June 8, 2009: Cisco and Travelers replaced Citigroup and General Motors. Citigroup and GeneralMotors have received billions of dollars of U.S. government money to survive and were notrepresentative of the Dow.
September 22, 2008: Kraft Foods Inc. replaced American International Group. American InternationalGroup was replaced after the decision of the government to take a 79.9% stake in the insurance giant.AIG was narrowly saved from destruction by an emergency loan from the Fed.
February 19, 2008: Bank of America Corp. and Chevron Corp. replaced Altria Group Inc. andHoneywell International. Altria was split into two companies and was deemed no longer suitable for theDow. Honeywell was removed from the Dow because the role of industrial companies in the U.S. stockmarket in the recent years had declined and Honeywell had the smallest sales and profits among theparticipants in the Dow.
April 8, 2004: Verizon Communications Inc., American International Group Inc. and Pfizer Inc. replaceAT & T Corp., Eastman Kodak Co. and International Paper. AIG shares had increased over 387% inthe previous decade and Pfizer had an increase of more than 675& behind it. Shares of AT & T andKodak, on the other hand, had decreases of more than 40% in the past decade and were thereforeremoved from the Dow. November 1, 1999: Microsoft Corporation, Intel Corporation, SBCCommunications and Home Depot Incorporated replaced Chevron Corporation, Goodyear Tire &Rubber Company, Union Carbide Corporation and Sears Roebuck. March 17, 1997: Travelers Group,Hewlett-Packard Company, Johnson & Johnson and Wal-Mart Stores Incorporated replacedWestinghouse Electric Corporation, Texaco Incorporated, Bethlehem Steel Corporation and WoolworthCorporation.
Page 16, ©2018 Advisor Perspectives, Inc. All rights reserved.

Figure: Changes in the Dow Jones over the last two industrial revolutions
Page 17, ©2018 Advisor Perspectives, Inc. All rights reserved.

Figure: Exchange rates of Dow Jones during the latest two industrial revolutions. During thelast few years the rate increases have accelerated enormously.
Central banks hold out stock exchanges?
Calculating share indexes as described above and showing indexes in historical graphs is a useful wayto show which phase the industrial revolution is in.
The third industrial revolution is clearly in the saturation and degeneration phase. This phase can berecognized by the saturation of the market and the increasing competition. Only the strongestcompanies can withstand the competition or take over their competitors (like for example the take-overs by Oracle and Microsoft in the past few years). The information technology world has not seenany significant technical changes recently, despite what the American marketing machine wants us tobelieve.
During the pre development phase and the take-off phase of a transition many new companies springinto existence. This is a diverging process. Especially financial institutions play an important role hereas these phases require a lot of money. The graphs showing the wages paid in the financial sectortherefore shows the same S curve as both revolutions.
Page 18, ©2018 Advisor Perspectives, Inc. All rights reserved.

Figure: Historical excess wage in the financial sector
Investors get euphoric when hearing about mergers and take overs. Actually, these mergers and takeovers are indications of the converging processes at the end of a transition. When looked at objectivelyeach merger or take over is a loss of economic activity. This becomes painfully clear when we have alook at the unemployment rates of some countries.
New industrial revolutions come about because of new ideas, inventions and discoveries, so newknowledge and insight. Here too we have reached a point of saturation. There will be fewer companiesin the take off or acceleration phase to replace the companies in the index shares sets that havereached the stabilization or degeneration phase.
In a (threatening) recession, the central bank tries to stimulate the economy by lowering interest rates.Loans are thus cheaper, allowing citizens and businesses to spend more. In the event of sharply risingunemployment and falling prices, however, this does significantly less. This is also the case as theofficial interest rates are lower, or even fall to essentially zero. Regardless of the interest rate (big)loans are not concluded and expensive purchases will be delayed. Further rate cuts or even an interestrate of zero may not lead to an increase in economic activity and falling demand leads to further pricedeclines (deflation). The central bank may decide in that case to increase the money supply(quantitative easing). A larger money supply actually leads to price increases and disruption of thedeflationary spiral. In the past the printing presses would be turned on but nowadays the central bankbuys government bonds, mortgage bonds and other securities and finances these transactions byincreasing the personal balance. There are no extra physical bank notes printed. The mechanism
Page 19, ©2018 Advisor Perspectives, Inc. All rights reserved.

works by means of central banks buying bonds in the market or directly from banks. Banks arecredited for the purchase amount in the accounts held with the central bank. In this way, banks obtainliquidity. In response to this liquidity banks can then provide new loans.
Figure: The quantitative easing policy of the Fed (US central bank) and its effect on the S & P500
Due to the combination of interest rate policy and quantitative easing by central banks a lot of moneyhas flowed the stock markets since 2008 and has in fact created a new, fictional bull market. This isevident in the price-earnings ratio chart (Shiller PE Ratio), which has risen again since 2008. Butcentral banks now have no more ammunition to break the deflationary spiral. At the end of the 2ndindustrial revolution in 1932 the PE Ratio dropped to 5. Currently, this ratio, partly due to the behaviorof central banks, is 23.
Page 20, ©2018 Advisor Perspectives, Inc. All rights reserved.

Figure: Two industrial revolutions: price-earnings ratio (PE ratio Shiller)
Will history repeat itself?
Humanity is being confronted with the same problems as those at the end of the second industrialrevolution such as decreasing stock exchange rates, highly increasing unemployment, towering debtsof companies and governments and bad financial positions of banks.
Page 21, ©2018 Advisor Perspectives, Inc. All rights reserved.

Figure: Two industrial revolutions and the debt of America
Transitions are initiated by inventions and discoveries, new knowledge of mankind. New knowledgeinfluences the other four components in a society. At the moment there are few new inventions ordiscoveries. So the chance of a new industrial revolution is not very high. History has shown that fivepillars are indispensable for a stable society.
Page 22, ©2018 Advisor Perspectives, Inc. All rights reserved.

Figure: The five pillars for a stable society: Food, Security, Health, Prosperity, Knowledge.
At the end of every transition the pillar Prosperity is threatened. We have seen this effect after everyindustrial revolution.
The pillar Prosperity of a society is about to fall again. History has shown that the fall of the pillarProsperity always results in a revolution. Because of the high level of unemployment after the secondindustrial revolution many societies initiated a new transition, the creation of a war economy. This typeof economy flourished especially in the period 1940 – 1945.
Now, societies will have to make a choice for a new transition to be started. Without knowledge of thepast there is no future.
Wim Grommen References:
Geschiedenis Werkplaatssite van Wolters-Noordhoff en WikipediaProf J. Rotmans, e.a. (2000), “Transities & Transitiemanagement: de casus van eenemissiearme energievoorziening”
Page 23, ©2018 Advisor Perspectives, Inc. All rights reserved.

Dow Jones Industrial Average Historical Components, S&P Dow Jones Indices McGraw HillFinancialDow Jones Industrial Average Historical Divisor Changes, S&P Dow Jones Indices McGraw HillFinancialW. Grommen, (november 2007), “Nieuwe beurskrach, een kwestie van tijd?”, Technische enKwantitatieve Analyse, (20 – 22)W. Grommen, (January 2010), “Beurskrach 1929, mysterie ontrafeld?”, Technische enKwantitatieve Analyse, (22 – 24)
W. Grommen, (March 2011), “Huidige crisis, een wetmatigheid?”, Hermes, 49, (52 – 58)W. Grommen, (January 2013), paper “The present crisis, a pattern” gepresenteerd opInternational Symposium The Economic Crisis: Time For A Paradigm Shift
W. Grommen, (November 2014), “The Dow Jones Industrial Average , A Fata Morgana”,TRADERS’ Magazine, (14 – 18)
W. Grommen, (April 2015), “Stock Splitting And The Market Crash 1929”, ValueWalkW. Grommen (August 2015), “Stock Market Boom and Crash, the Cause and Effect of ExtremeMarket Movements” , TRADERS’ Magazine, (28 – 30)
Page 24, ©2018 Advisor Perspectives, Inc. All rights reserved.