magnitude and overview of global biodiversity loss by jeffrey a. mcneely chief scientist iucn –...
TRANSCRIPT

Magnitude and Overview of Global Biodiversity Loss
ByJeffrey A. McNeely
Chief ScientistIUCN – The World Conservation Union
Presented toBiodiversity and Agriculture Symposium
Punta Cana, Dominican Republic31 May 2006

Ancient extinctions
• Ordovician: 450 million years ago. Some animal groups lose half their species.
• Devonian: 374 million years ago. Up to 70% of all species disappear.• Permian: 251 million years ago. 95% of all marine life and 70% of land
animals become extinct.• Triassic: 201 million years ago. Up to a quarter of all life dies.• Cretaceous: 65 million years ago. 85% of all species are wiped out,
including the dinosaurs.

These ancientThese ancient extinctions were caused by natural phenomena

For the next 60 million years, diverse forms of life populated our planet

Our early ancestors were part of the African savanna ecosystem.
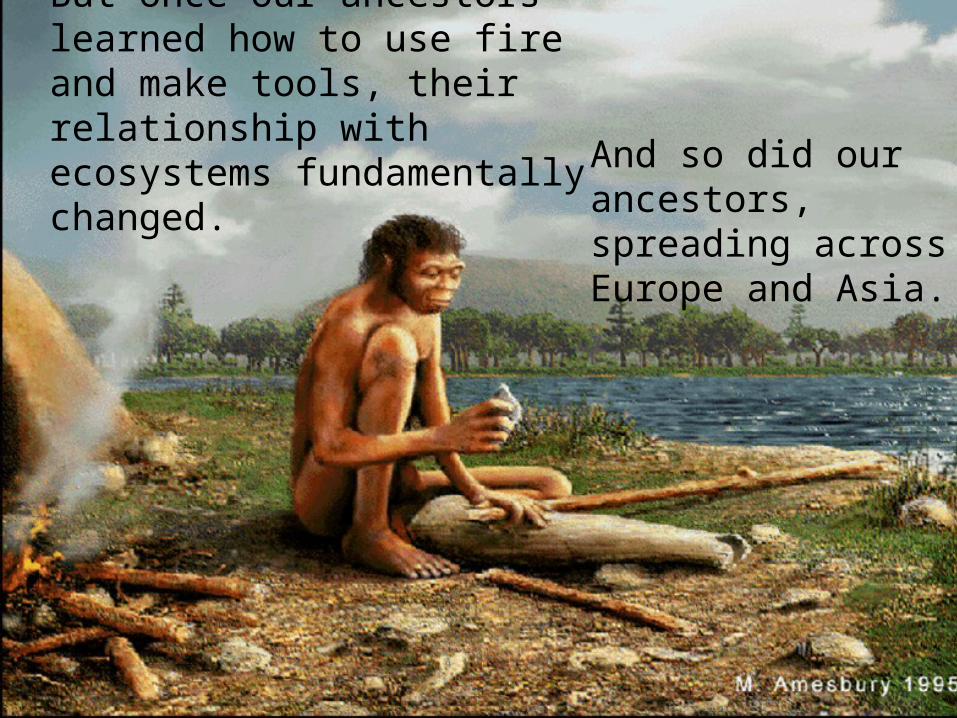
But once our ancestors learned how to use fire and make tools, their relationship with ecosystems fundamentally changed.
And so did our ancestors, spreading across Europe and Asia.

For millions of years, the Americas were left to wildlife and were not part of humanity’s
story.

The first humans came to the Americas 12-30,000 years ago

Once they arrived, things started to change

Glyptodon
Mammut Megatherium
Mylodon
Fire and technology helped early human immigrants to the Americas drive some 43 genera of mammals to extinction.

Megafauna extinctions have been correlated with the arrival of humans on new continents or large islands (Martin, 1984)
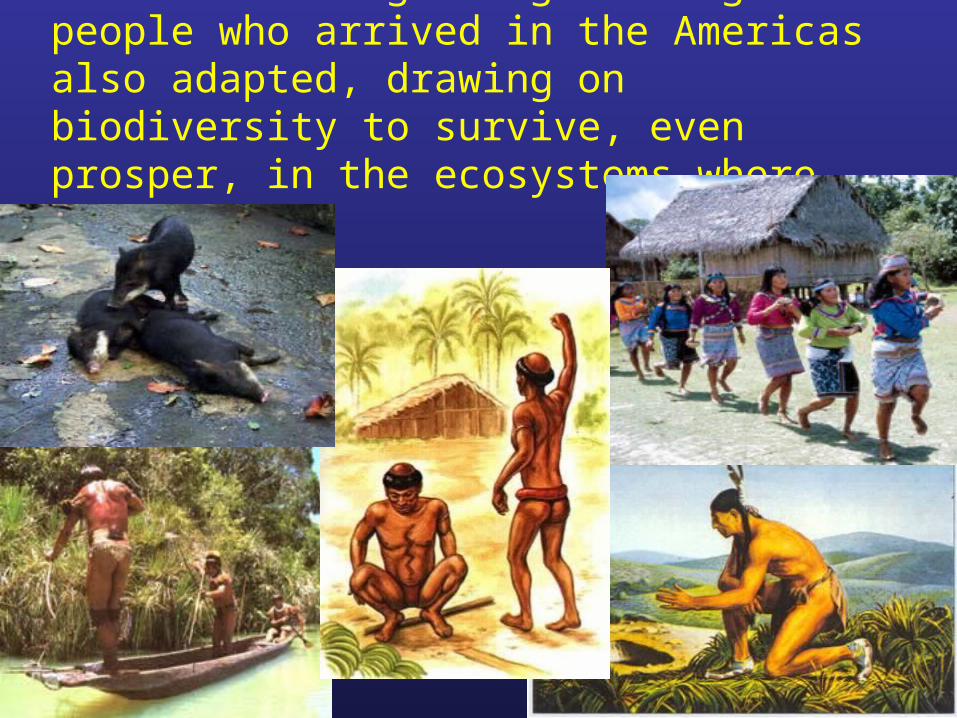
But the hunting and gathering people who arrived in the Americas also adapted, drawing on biodiversity to survive, even prosper, in the ecosystems where they lived.
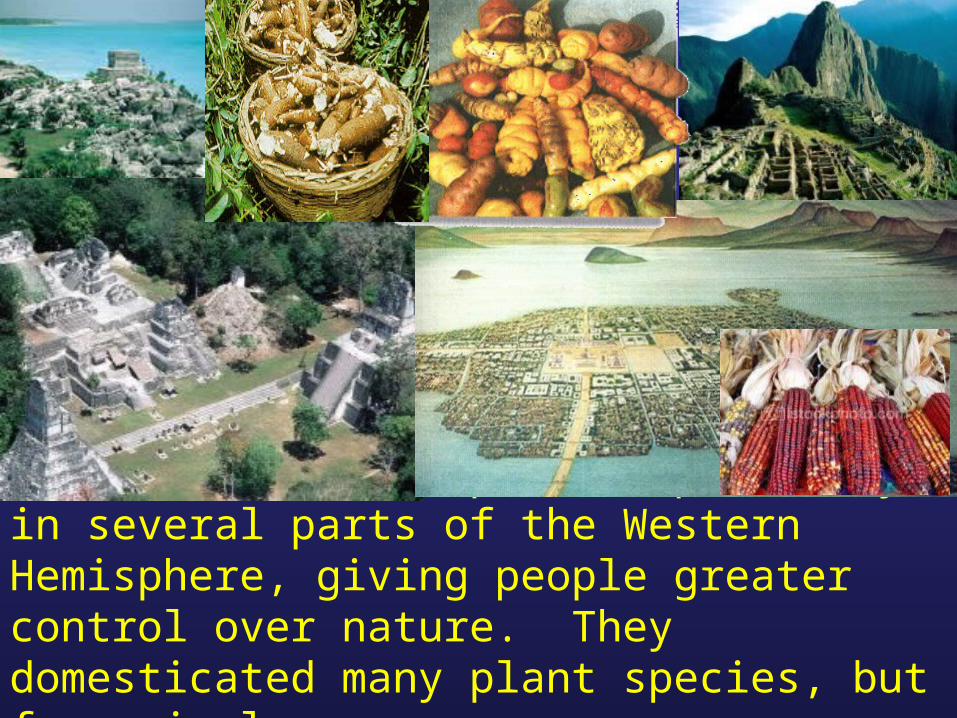
Agriculture developed independently in several parts of the Western Hemisphere, giving people greater control over nature. They domesticated many plant species, but few animals.

Mammutus
Hippidium
Onohippidium
Potentialdomesticated animals?
Equus

With beasts of burden, the Aztec, Inca, and Maya civilizations might have been very different.

Biodiversity loss meant that New World civilizations had fewer options than those of the Old World
• -

According to the Millennium Ecosystem Assessment, we have lost more biodiversity in the last 50 years than ever before in recorded human history.
• Are we in the midst of the sixth great extinction?
• If so, what are the implications for humanity?
• What can be done to reverse the rate of biodiversity loss?

Why Biodiversity is Important for
People
By
Jeffrey A. McNeelyChief Scientist
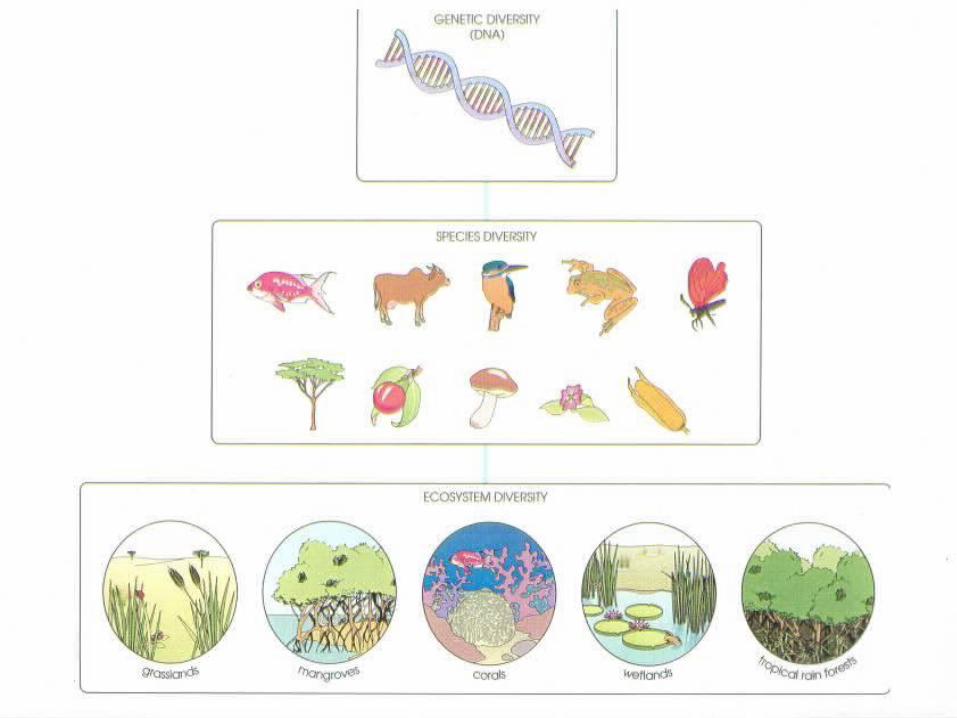
What is biodiversity ?

Genetic diversity gives our crops the characteristics we seek. Losing this diversity constrains our options.
HYV wheat ancestry

Some examples of the loss of genetic diversity in the USA
Varieties of vegetables grown
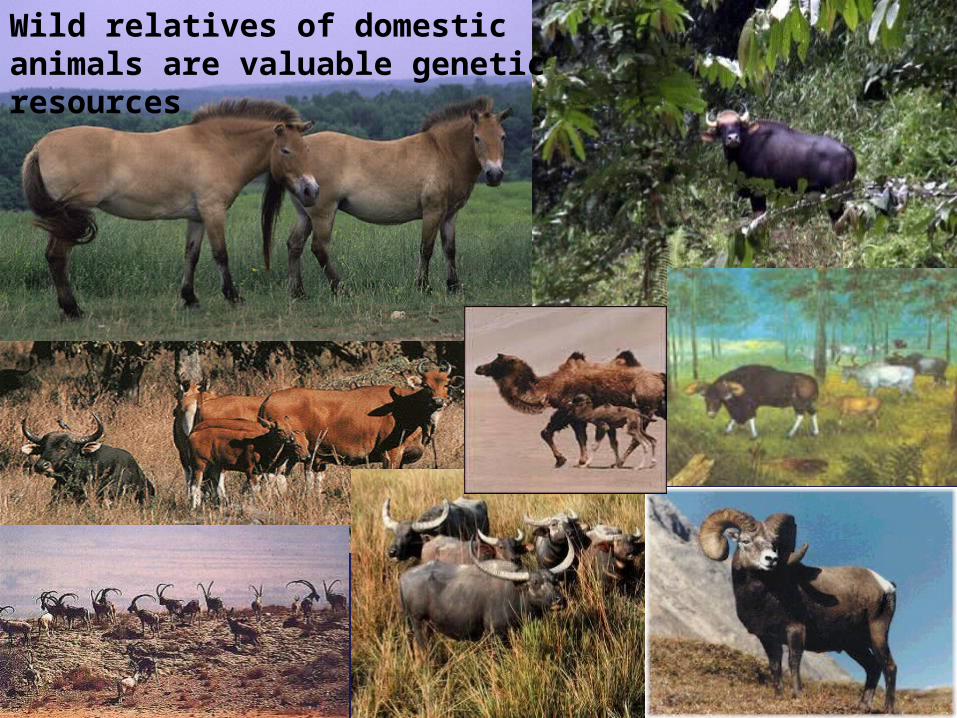
Wild relatives of domestic animals are valuable genetic resources

Species extinctions per thousand species per millennium


Extinction in recent times• The world’s list of documented extinctions
continues to riseThe 2006 Red List includes 784 species
listed as Extinct and 63 Extinct in the Wild30 documented extinctions in the last 20
years• Recent extinction rates are 100 to 1,000 times natural
(background) extinction rates
Source: IUCN/SSC

KNOWN CAUSES OF EXTINCTION SINCE 1600
Hunting23%
Other2%
SpeciesIntroductions
39%
Habitat Destruction36%

Which species are in trouble?Amphibians are the most threatened vertebrates
Birds Mammals Amphibians
Source: IUCN/SSC
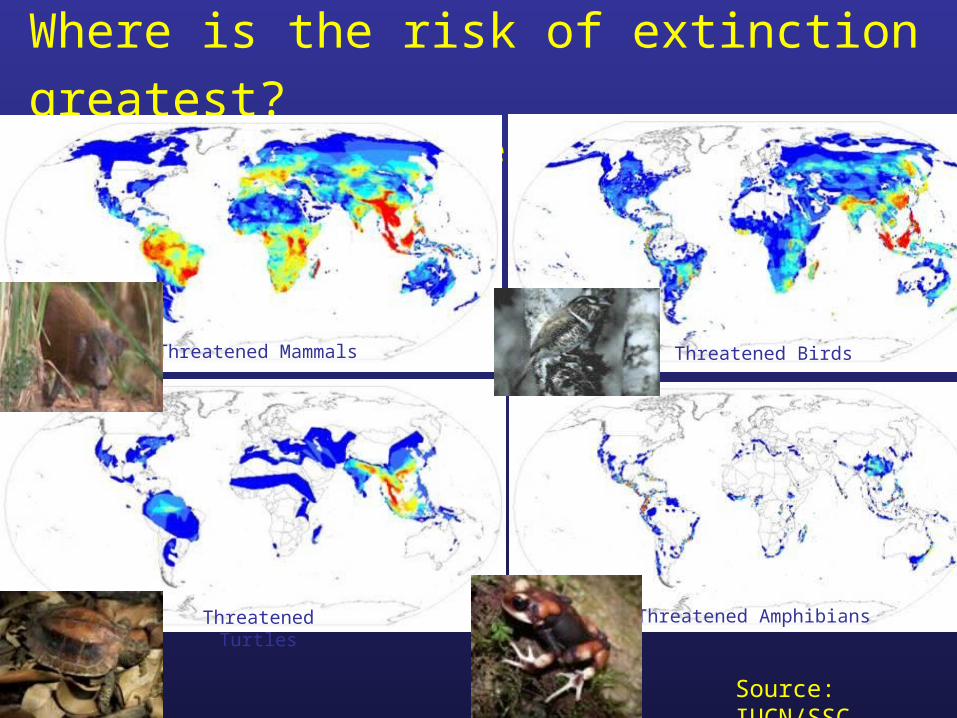
Where is the risk of extinction greatest? Areas of threatened species richness
Threatened Mammals Threatened Birds
Threatened Turtles Threatened Amphibians
Source: IUCN/SSC

SOILS
One of last great frontiers in biological research: we simply do not know the status of soil species

Draft Tree of
Life Science: 13 June 2003
Taxa in Soil
Bacteria
No human eye has ever blinked at them through a microscope, and most human minds have never spent a moment reflecting on them. Yet the sobering fact is: they don’t need us, but we need them (Wilson
1987).
Photos: Norton, Ochoa

Temperate Grasslands & Woodlands
Temperate Broadleaf Forest
Tropical Dry Forest
Tropical Grasslands
Tropical Coniferous Forest
Mediterranean Forests
Tropical Moist Forest
0 50 100
Percent of habitat (biome) remaining
Ecosystem Loss to 1990
Source: Millennium Ecosystem Assessment

WHY BIODIVERSITYIS BEING LOST
1. Converting natural habitats into domestic habitats

Source: NASA
The way we were

The way we are

The process of land conversion continues to accelerate, sometimes encroaching on legally protected areas.

“As you can see, some have adapted to
their reduction of territory quite well.”

WHY BIODIVERSITY IS BEING LOST
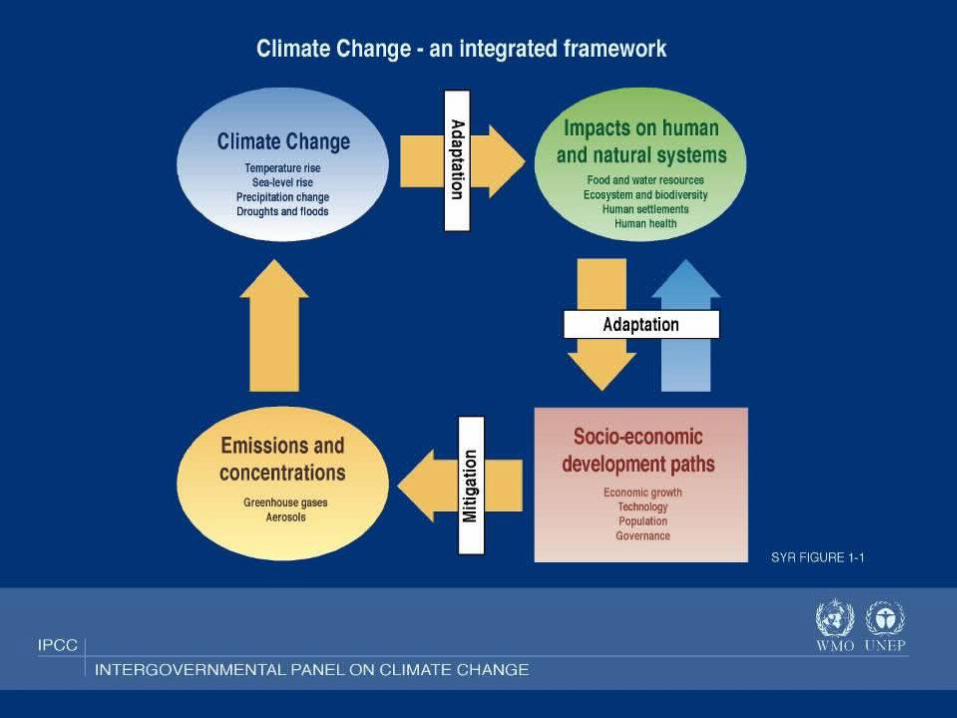
2. Changes inclimate

Source: US Global Change Research Programme
Ocean Circulation Conveyor Belt

Source: Natural Resources Canada
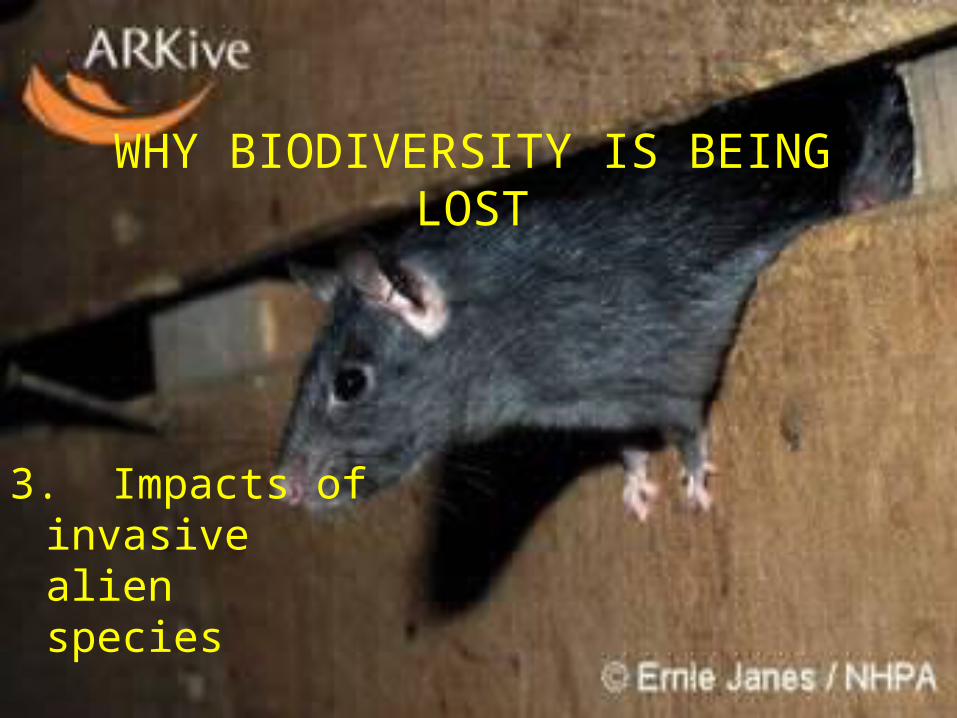
WHY BIODIVERSITY IS BEING LOST
3. Impacts of invasive alien species

International shipping has increased by a factor of 10 over the past several decades.
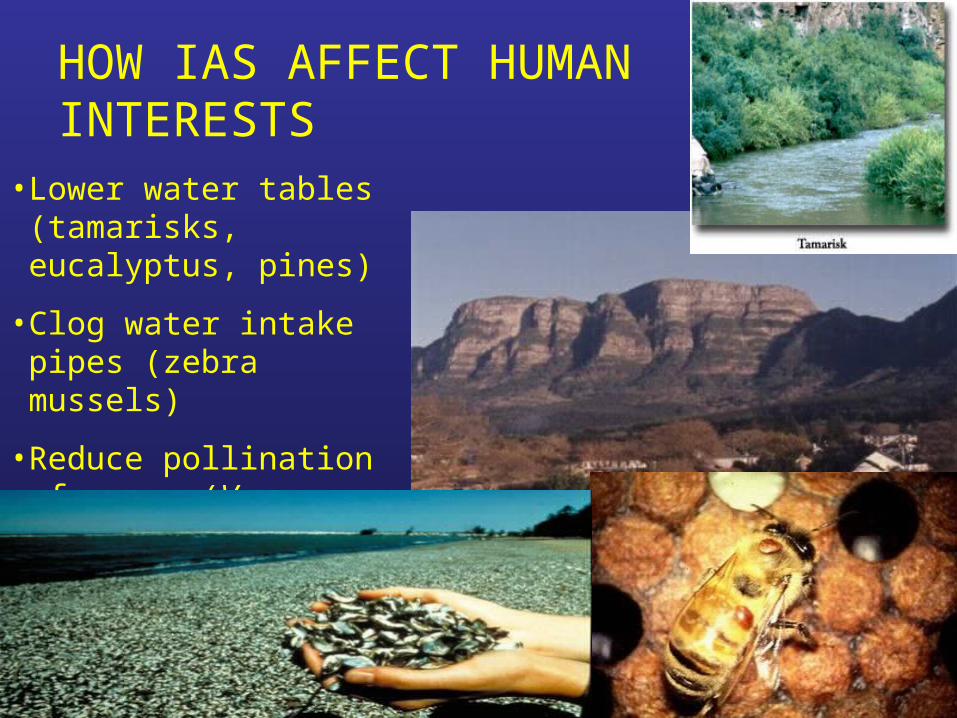
HOW IAS AFFECT HUMAN INTERESTS
• Lower water tables (tamarisks, eucalyptus, pines)
• Clog water intake pipes (zebra mussels)
• Reduce pollination of crops (Verroa mites)

HOW IAS AFFECT HUMAN INTERESTS
•Cause human diseases (West Nile Virus)
•Threaten human safety (fire ants, Africanized bees)
•Block navigation, deplete oxygen (water hyacinth)
“We’re pretty sure it’s the West Nile Virus”

Annual costs associated with IAS
South Africa US$ 7 billion
UK US$ 12 billion
Australia US$ 13 billion
Brazil US$ 50 billion
India US$ 116 billion
(Source: Pimentel, et al., 2001)

WHY BIODIVERSITY IS BEING LOST
4. Excessive harvesting of valuable species
Collapse of the Canadian cod fishery

Biomass of Table Fish (tons per km2)
Source: Millennium Ecosystem Assessment; Christensen et al. 2003
19002000

WHY BIODIVERSITY IS BEING LOST
5. Impacts of pollutants
“Think of it not as pollution, but as the fragrance of prosperity”
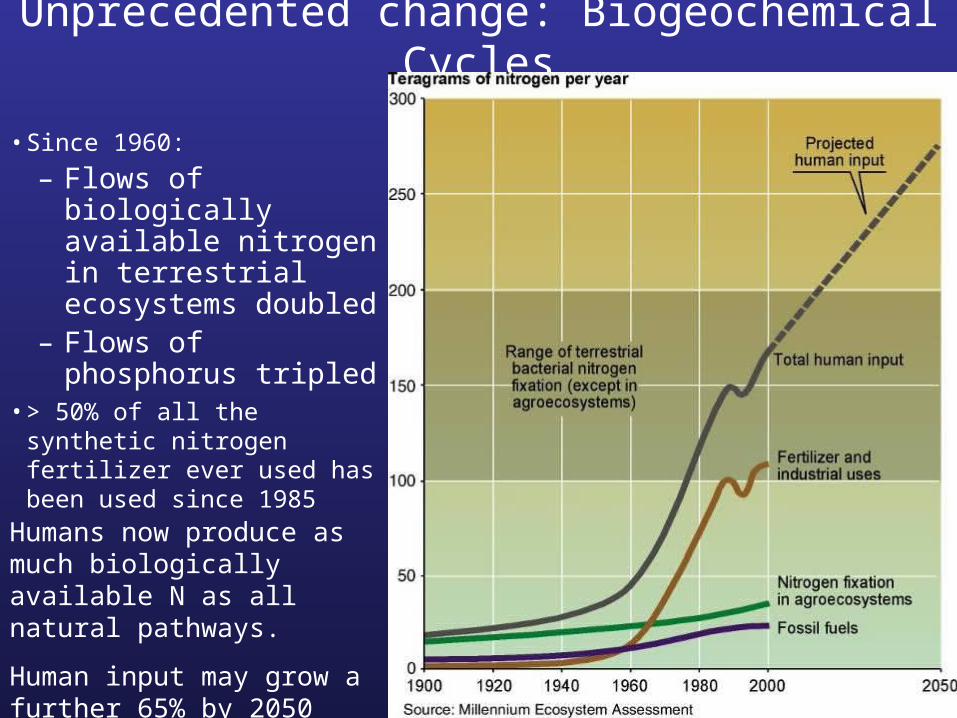
Unprecedented change: Biogeochemical Cycles
• Since 1960:
– Flows of biologically available nitrogen in terrestrial ecosystems doubled
– Flows of phosphorus tripled
• > 50% of all the synthetic nitrogen fertilizer ever used has been used since 1985
Humans now produce as much biologically available N as all natural pathways.
Human input may grow a further 65% by 2050

Source: International Nitrogen Initiative

Source: USEPA
Major Eutrophication-induced Hypoxic Zones of the World
Percentage of years (1985-1997) with summer hypoxia

Trends in DriversSource: Millennium Ecosystem Assessment

IUCN Photo Library © Jim Thorsell
What are the implications of biodiversity loss for people?


Ecosystem Services: the benefits people obtain from ecosystems
RegulatingBenefits obtained from
regulation of ecosystem processes
• climate regulation• disease regulation
• flood regulation
ProvisioningGoods produced or provided
by ecosystems
• food • fresh water• fuel wood
• genetic resources
CulturalNon-material benefits from
ecosystems
• spiritual • recreational
• aesthetic• inspirational• educational
SupportingServices necessary for production of other ecosystem services
• Soil formation• Nutrient cycling
• Primary production
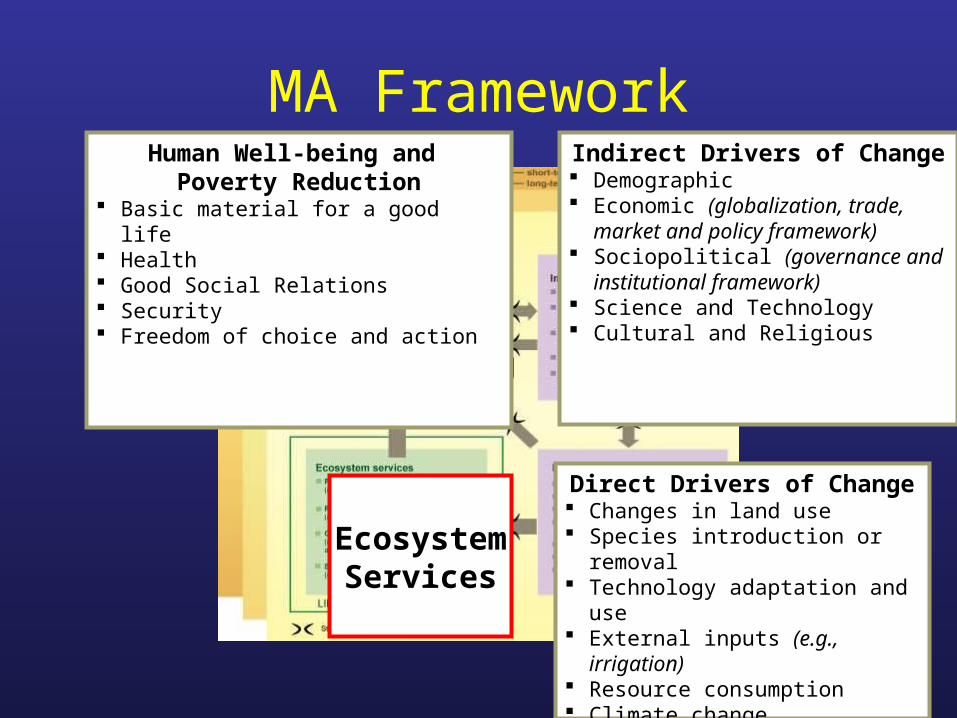
MA Framework
Direct Drivers
Indirect Drivers
EcosystemServices
Human Well-being
Direct Drivers of Change Changes in land use Species introduction or
removal Technology adaptation and
use External inputs (e.g.,
irrigation) Resource consumption Climate change Natural physical and
biological drivers (e.g., volcanoes)
Indirect Drivers of Change Demographic Economic (globalization, trade,
market and policy framework) Sociopolitical (governance and
institutional framework) Science and Technology Cultural and Religious
Human Well-being and Poverty Reduction
Basic material for a good life Health Good Social Relations Security Freedom of choice and action

Biodiversity loss means the loss of genetic diversity provided by wild relatives of domestic plants and animals

The capacity to adapt to changing climates will be compromised
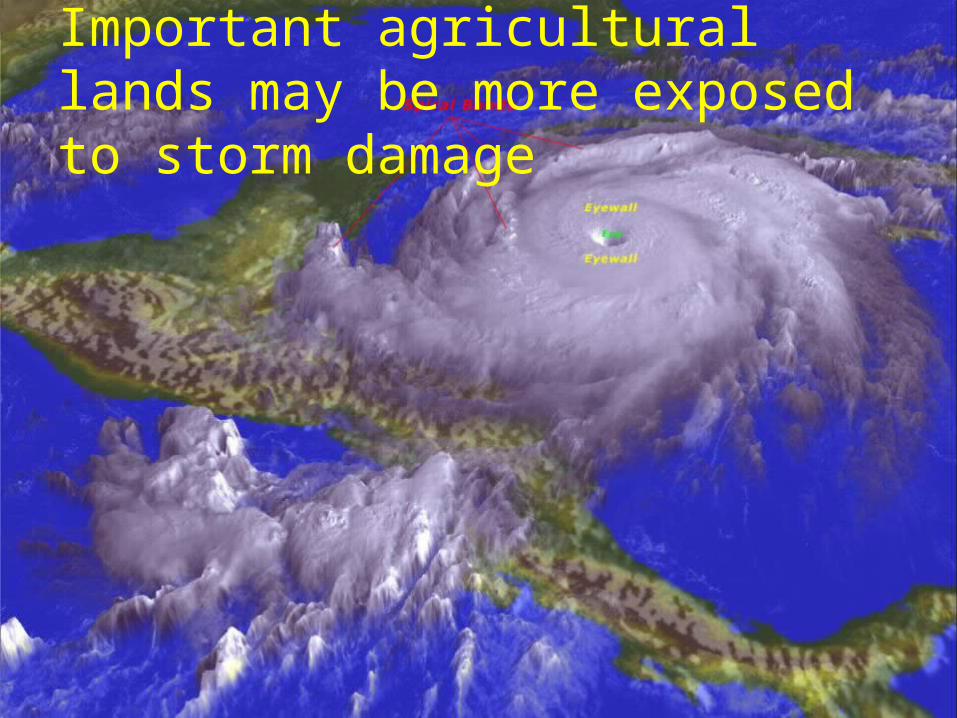
Important agricultural lands may be more exposed to storm damage
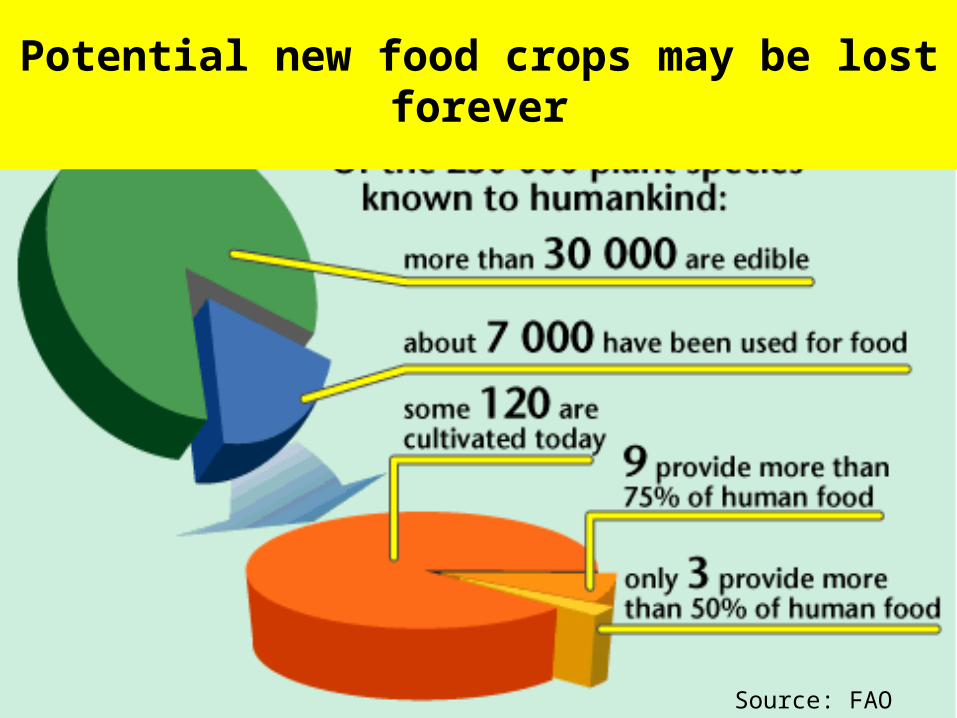
Potential new food crops may be lost forever
Source: FAO

Pollinators may no longer be as effective
In Costa Rica, forest-based pollinators increased coffee yields by 20%

What can be done to reverse the rate of biodiversity loss?
Responses: Key Barriers* Insufficient knowledge
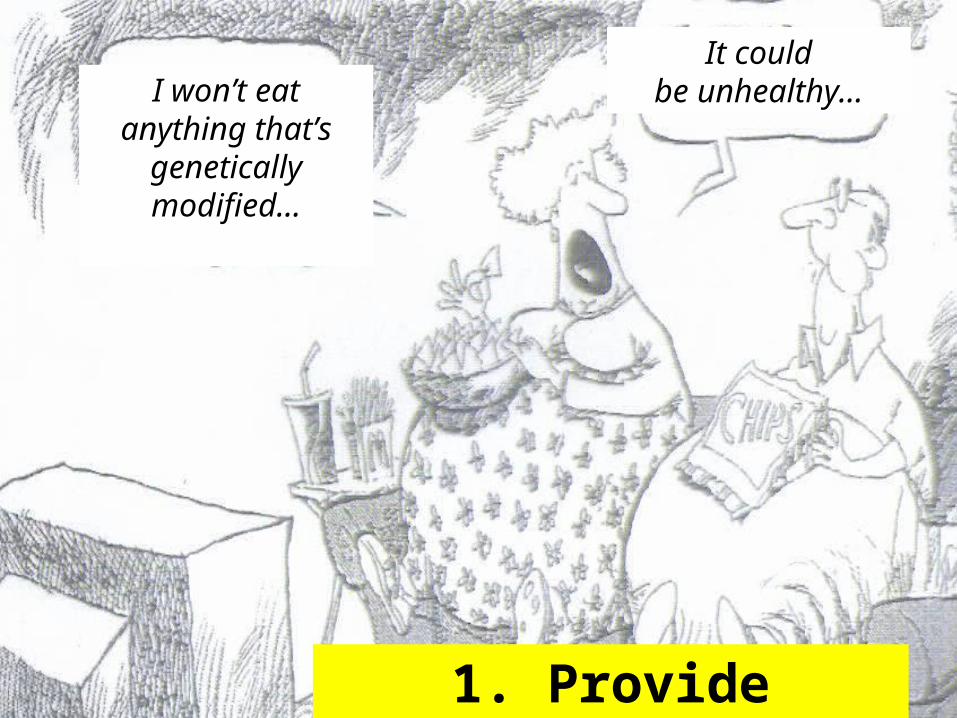
1. Provide information
I won’t eatanything that’s
geneticallymodified…
It couldbe unhealthy…

GBIFSpecies/Specimen
Governments
PP10PromotingInformation
sharingGovernments
Joint PledgeProtected areas
and methodology Big NGOs
IABINSpecies
Governments& NGO
PALNETSharing evidencebased informationParks Managers
Conservation CommonsIntegrating data, information, knowledge, expertise and technology
from all sectors of society to advance durable conservation
SIS-RedlistEndangered
SpeciesAcademia, NGO,
Governments
CHMSharing
ProcessesGovernments
ConserveOnlineConservation
Conservationists,Public
EcolexLaw
EnvironmentalAttorneys
www.conservationcommons.org

2. Invest in development of appropriate technologies
Indirect drivers of change * Technological change

3. Help local people capture biodiversity benefits

We are consuming more food
ResourcePer capita increase
(1950-1990)
Grain40%
Beef and mutton26%
Fish100%

Downstream Users benefit from protection of upstream ecosystem services
Pay upstream landowners to maintain forest cover on their land
$
• Program established 1997• By 2001: 280,000 ha enrolled at cost of $30
million• Typical payments: $35 to $45 per hectare
Costa Rica payment for ecosystem services

4. Promote actions at the landscape level

Response 3: Encouraging private sector involvement in biodiversity
conservation
5. Involve the private sector in biodiversity action

6. Include biodiversity issues in agriculture, fishing and forestry

7. Design governance that supports ecosystem services

Decentralization needs:
• a supporting national framework
• sound information about trade-offs and synergies
• appropriate tenure arrangements

8. Promote international cooperation through conventions and other means
Convention on the Law of the Sea

The 2010 Biodiversity Target:
To achieve by 2010 a significant reduction of the current rate of biodiversity loss as a means of alleviating poverty.
Indicators:• Trends in extent of selected biomes, ecosystems,
and habitats• Trends in abundance and distribution of selected
species• Coverage of protected areas• Water quality in aquatic ecosystems• Official development assistance provided in
support of the Convention on Biological Diversity

0
20,000
40,000
60,000
80,000
100,000
1873
1878
1883
1888
1893
1898
1903
1908
1913
1918
1923
1928
1933
1938
1943
1948
1953
1958
1963
1968
1973
1978
1983
1988
1993
1998
2003
Year
Num
ber o
f Site
s
0
2,000,000
4,000,000
6,000,000
8,000,000
10,000,000
12,000,000
14,000,000
16,000,000
18,000,000
20,000,000
Are
a in
Km
2
Cumulative area sites of known date
Cumulative no. of sites of known date
Note: 38,427 PAs covering approximately 4 million km² have no date and are not included in the cumulative graph
The remarkable growth of protected areas demonstrates their value.

Sinharaja Biosphere Reserve, Sri Lanka: Mango Breadfruit Nutmeg Cinnamon Clove Pepper Durian

Wild cardamomPepperYamsPest-resistant riceBeans

Xishuangbanna Nature Reserve, China Rice Citrus Ginseng Tea
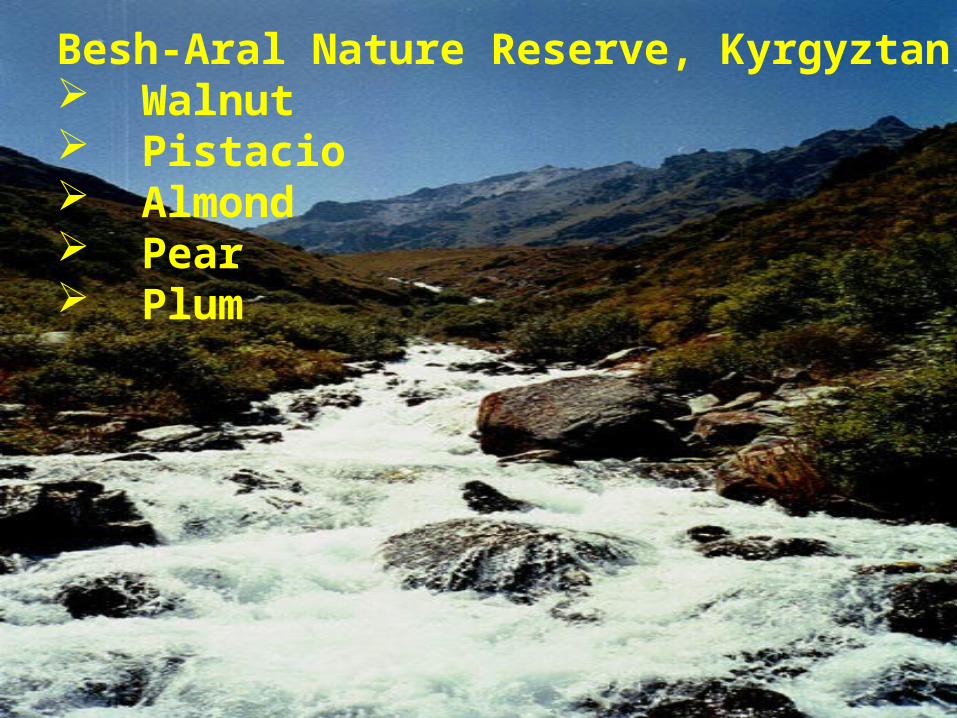
Besh-Aral Nature Reserve, Kyrgyztan Walnut Pistacio Almond Pear Plum

Sierra de Manantlan Biosphere Reserve, Mexico
Last habitat of Teosinte, wild relative of maize

9. Continue active public goods research linking biodiversity with agriculture

10. Support education about biodiversity and ecosystem
services

Responding to the loss of biodiversity will cost money.
Not responding is likely to cost even more.