magnetic testing of straight rods in intense fields - nist...
TRANSCRIPT

MAGNETIC TESTING OF STRAIGHT RODS IN INTENSEFIELDS
By W. L. Cheney
CONTENTS Page
I. Introductory 625
II. Historical : 62
5
III. Apparatus 628
IV. Experimental method 629
1. Normal induction 629
2. Hysteresis values 630
V. Experimental results 632
1. Normal induction 632
2. Reluctivity and intensity of magnetization 634
VI. Summary •. 637
I. INTRODUCTORY
The usual types of permeameter, for the measurement of the
magnetic properties of iron and steel bars, do not permit the
magnetizing force to be carried to very high values. The Bur-
rows permeameter/ for example, is limited to H = 3oo gausses.
Frequently in the testing of the magnetic properties of fairly
long straight rods, it is desirable to carry the magnetizing force
considerably higher in order to determine the sattiration intensity
of magnetization. The majority of methods for doing this (vide
infra) necessitate the use of very small specimens and, therefore,
preclude the possibility of comparing results for low fields with
similar results obtained with a standard permeameter. Thesolenoid method is not entirely satisfactory on account of the
demagnetizing factor of the specimen.
In view of these facts, a method suitable for magnetic measure-
ments of long straight bars of iron or steel in intense fields has
been developed.II. HISTORICAL
Early experiments to ascertain the intensity of magnetization
due to high magnetizing forces were made principally uponspecimens either in the form of rings or toroids ^ or with a long
» Scientific Paper, No. 117, Bureau of Standards. 'Rowland, Phil., Mag., 46 1873; 48, 1874.
150059°—20 625

626 Scientific Papers of the Bureau of Standards
rod in a solenoid.^ The results obtained by these early experi-
menters have since been found not to be very accurate.
In 1887 Ewing and Low* developed the well-known "isthmus
method" for testing the permeability of ferromagnetic materials
under the influence of intense fields. A strong electromagnet
was used because in the air space between the pole pieces there
can be produced more easily a magnetic field of much greater
intensity than in a magnetizing coil where the field is due to the
direct action of the electric current. The specimen was in the
form of a bobbin or isthmus and placed between the conical
pole pieces of the electromagnet (Fig. i). The magnetic induc-
tion in the isthmus was measured by means of a small test coil
woimd around it and connected in series with a ballistic gal-
vanometer. Upon sud-denly rotating the speci-
men through 1 80° about an
axis at right angles to the
direction of the magnetic
flux, the throw of the bal-
listic galvanometer (pre-
viously calibrated) , indi-
cated the induction in the
specimen. To permit the
rotation, the tips of the pole pieces were bored through trans-
versely by a circular hole abed.
To determine the value of the magnetizing force (H) , a second
coil surrounding the first was used. The difference in magnitude
of the throws of the galvanometer caused by the two coils respec-
tively is proportional to the flux through the air space between
the two coils, and can be easily calculated when the difference in
the area turns of the coils is known. When there is a uniform
magnetic field between the pole pieces, the magnetic flux through,
the space included by the two coils is probably only a very
little greater than the mean force within the metal itself, hence
may be taken as a measure of the latter.
Du Bois ^ employed an optical method for determining the
intensity of magnetization of iron in strong fields, having first
examined the material in the weaker fields of a solenoid. Similar
experiments were also carried out by Roessler."
•Weber: 1884.
* Ewing, Magnetic Induction in Iron and Other Metals, pp. 136-158.
* Du Bois, Phil. Mag., 29, p. 253, 1890.
' Roessler, Eldctrotech. Zeit., 14, 1893.
Fig. I. -Illustrating the " isthmus'^ as used by
Ewing and Low

Cheney] Magnetic Testing in Intense Fields 627
Du Bois and Jones ^ tested specimens between the conical pole
pieces of an electromagnet of the Du Bois type. They measured
ballistically the change in induction upon suddenly withdrawing
the specimen, which formed a part of the isthmus, through a
hole in one of the pole pieces.
Weiss ^ employed small ellipsoids of revolution and placed
them symmetrically between the flat pole pieces of an electro-
magnet of great power. The ellipsoid was suddenly extracted
from the field through a hole in the
axis of one of the pole pieces while the
change in flux was measiured by a test
coil outside the iron.
B. O. Peirce* studied the magnetic
properties, particularly the reluctivity
and permeability, of some specimens
of very pure Norway iron. He used
the isthmus method, having for his
apparatus a massive yoke weighing
about 300 kg, excited by a current
through a coil of 2956 turns wound on
spools, as shown in Figure 2 . The speci-
mens were of two forms . The first was
a cylinder about 1.27 cm in diameter
and about 1 5 cm long. Its ends were
tapered to fit snugly into sockets in the
conical ends of the pole pieces. The
other form was much shorter, the exposed portion being constricted
to a smaller diameter than the remainder of the specimen.
Instead of reversing the specimen in the magnetic field, as did
Ewing and Low, Peirce reversed the magnetic field by reversing
the ciu-rent through the windings of the electromagnet. Hefound that this worked satisfactorily, provided he used a ballistic
galvanometer whose period was appreciably greater than the time
lag of the electromagnet. He employed the same method as
Ewing and Low for determining B and H, the latter being meas-
ured by connecting two coils in opposition, so that the throw of
the galvanometer was proportional to the flux in the annular
space between them.
Fig. 2 .
—
Showing theform of the
yoke of B. O. Peirce
'' Du Bois and Jones, Elekt. Zeit., 17, p. 543; 1896. Electrician, 37, p. 595; 1896.
8 P. Weiss, Comptes Rendus, 145, p. 1155; 1907.
• B. O. Peirce, Am. Acad. Arts and Sci., Proc, 44, p. 354; 1909. Am. Jour, of Sci., 27, p. 373, 1909; 28,
p. X, X909.

628 Scientific Papers of the Bureau of Standards
In some of his subsequent experiments Pdrce ^^ used a large
magnetizing solenoid to supplement his observations with the
modified isthmus method.
Gumlich " employed the isthmus method for determining the
intensity of magnetization of some very carefully prepared speci-
mens of iron. He used an electromagnet of the Du Bois type andsuddenly reversed the isthmus (specimens 28 mm long and 3 mmdiameter) , according to the method of Ewing and Low. Later,
Gumlich ^^ used a special yoke which proved satisfactory.
Hadfield and Hopkinson/^ in a very extensive investigation of
the magnetic properties of iron alloys, used a modified isthmus
method somewhat after the man-ner of Peirce, but used very muchsmaller specimens.
Further developments weremade by Campbell and Dye,^^ the
form of whose electromagnet is
shown in Fig. 3. The specimens
tested were either in the form of a
rod 7 cm long and 0.5 cm in diam-
eter, or an equivalent bimdle of
strips or wires. The specimen
was fitted into thick, soft iron disks
E and F, which formed the pole
pieces. These disks did not touch
the magnet poles but were sepa-
rated from them by a small air gap. In the middle portion of
the test specimen was a coil of 40 tuums of wire used for measur-
ing B, and three outer successively larger coaxial coils of 400
turns each used differentially to determine H. By using alter-
nately one set of coils and then the other, the uniformity of the
field between the poles of the electromagnet could be tested.
III. APPARATUS
The apparatus used in the present investigation consists essen-
tially of an electromagnet of the Du Bois t5rpe (Fig. 4) with flat
pole pieces, separated by an air gap of approximately 2 cm and
pierced coaxially so that a rod 6 mm in diameter and several
w B. O. Peirce, Am. Acad. Arts and Sci., Proc, 49, p. 117; 1913.
" E. Gumlich, Elekt. Zeit., 30, pp. 1065-1067; 1909.
" E. Gumlich, Archiv. fiir Elektr., 2, p. 461; 1913-1914.
" Hadfield and Hopkinson, Inst, of Elec. Eng. Jour., 46, p, 235; 1911.
1* Campbell and Dye Inst, of Elec. Eng. Jour., 54, p. 35; 1915.
Fig. 3.
—
Illustrating theform of the elec-
tromagnet used by Campbell and Dye

Scientific Papers of the Bureau of Standards, Vol. 15
Fig. 4.
—
Photograph of the Du Bois electromagnet, showing specimen and test coils
in place

ckeney] Magfietic Testing in Intense Fields 629
centimeters long can be extended through them and the electro-
magnet. Surromiding the specimen are three coaxial coils woimdon brass forms each i cm long and having external diameters of
7 mm, 10.5 mm, and 13.2 mm, respectively. Each coil has 100
turns of No. 40 (B. & S. gage) enameled copper wire. To insure
insulation from the brass form, the latter was first wrapped with
a thin sheet of paper, and to secure a moisture-free coating of
insulating material, the whole coil after winding was well shel-
lacked and baked in an oven at 100° C for several hours. Tomeasture the number of area turns of the coils, they were placed
in the center of a solenoid and the throw of a ballistic galvano-
meter upon reversing a known magnetizing force inside the solenoid
was compared with the throw observed when the current wasreversed through the primary coil of a known mutual inductance.
Fig. 5 is a diagram of the circuits and connections. A Leeds
and Northrup, type R, ballistic galvanometer, calibrated with the
aid of a mutual inductance, is used. There are employed three
sensitivities of the galvanometer, regulated by the parallel resist-
ance i?p and the series resistances i?'hi and i^'ha for low values of
H, as measured by inner and outer annuluses, respectively, i^hi
and i?h2 for high values of //, and i^b for 5, making necessary
five secondary circuits in series with the galvanometer. i?b is
adjusted so that a reversal of 10 000 lines of induction per square
centimeter gives a throw of 10 cm of the galvanometer; i?hi and
Ry,2 so that a reversal of a magnetizing force of 1000 gausses gives
a deflection of 10 cm; and R\,\ and R\,\ so that a reversal of 200
gausses gives a throw of 10 cm. In the latter case it is also nec-
essary to increase the magnitude of R^.
IV. EXPERIMENTAL METHOD1. NORMAL INDUCTION
To determine the value of the magnetic induction B, the inner
coil is connected in series with the ballistic galvanometer. Uponsuddenly reversing the current in the windings of the electromag-
net the throw of the ballistic galvanometer is proportional to the
induction in the specimen. To measure the magnetizing force //,
the inner and middle coils are connected differentially, so that the
throw of the galvanometer is proportional to the flux in the
annular space between the coils. To check the uniformity of the
field, the middle and outer coils are connected in a similar mannerand the throw again observed. Observations obtained by the

630 Scientific Papers of the Bureau of Standards
two sets of coils seldom differ by more than 2 per cent and in
most cases check much more closely.
By measuring B for successively increasing values of H, normalinduction curves can be obtained.
Fig. 5.
—
Diagram of electrical circuits and connections
2. HYSTERESIS VALUES
The part of the whole experiment which requires the greatest
care and yields the least accurate results has to do with the
measurement of the hysteresis constants, residual induction {Br)
and the coercive force {H^),
Cheney] Magnetic Testing in Intense Fields 631
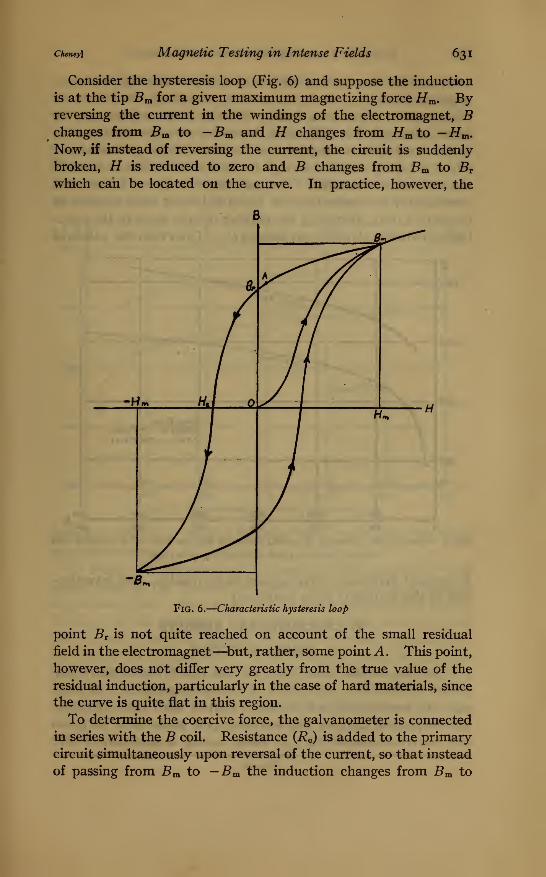
Consider the hysteresis loop (Fig. 6) and suppose the induction
is at the tip Bm for a given maximum magnetizing force Hm, By-
reversing the ciurent in the windings of the electromagnet, Bchanges from Bm to —Bnx and H changes from //mto — /fm.
Now, if instead of reversing the current, the circuit is suddenly
broken, H is reduced to zero and B changes from Bm to Brwhich can be located on the curve. In practice, however, the
Fig. 6.
—
Characteristic hysteresis loop
point Br is not quite reached on account of the small residual
field in the electromagnet—but, rather, some point A . This point,
however, does not differ very greatly from the true value of the
residual induction, particularly in the case of hard materials, since
the curve is quite flat in this region.
To determine the coercive force, the galvanometer is connected
in series with the B coil. Resistance (Ro) is added to the primary
circuit simultaneously upon reversal of the current, so that instead
of passing from Bm to —Bm the induction changes from Bm to

632 Scientific Papers of the Bureau of Standards
zero, and the magnetizing force from a large value i/m to a small
negative value H^. Now, on suddenly breaking the circuit, Hchanges from H^ to zero, from which the coercive force may be
found, although it is difficult to determine very accurately owing
to the small order of magnitude of the throw of the galvanometer,
which is hardly sensitive enough for such small values as occur in
the case of soft material. The galvanometer throw is increased
considerably by connecting the inner and outer coils together in
opposition (thus increasiag the number of area turns in the annu-
lus) by reducing R^ and by increasing R^. Even then the values of
soyao
^0 too /so zoo zso
Fig. 7.
—
Showing the agreement of normal induction data for drill rod as obtained with
regular pole pieces and with auxiliary pole pieces
Ho for soft materials do not appear to be reliable. An investiga-
tion of this feature is beiag continued.
V. EXPERIMENTAL RESULTS
1. NORMAL INDUCTION
It will be recalled that Campbell and Dye ^^ used a short rod,
placed in auxiliary pole pieces of the electromagnet. To com-
pare the results obtained by their method with those obtained
by the present method, two auxiliary pole pieces were prepared
and introduced as in Fig. 3. After testing a specimen of drill
»» I^c. cit.
Cheney\ Magnetic Testing in Intense Fields 633
rod, 6 cm long, the auxiliary pole pieces were removed and the
air gap of the electromagnet adjusted so that 2 cm of each end
of the specimen projected into the regular pole pieces. The
normal induction curve was again observed. No difference
cordd be found in the case of the two sets of observations as
illustrated in Fig. 7.
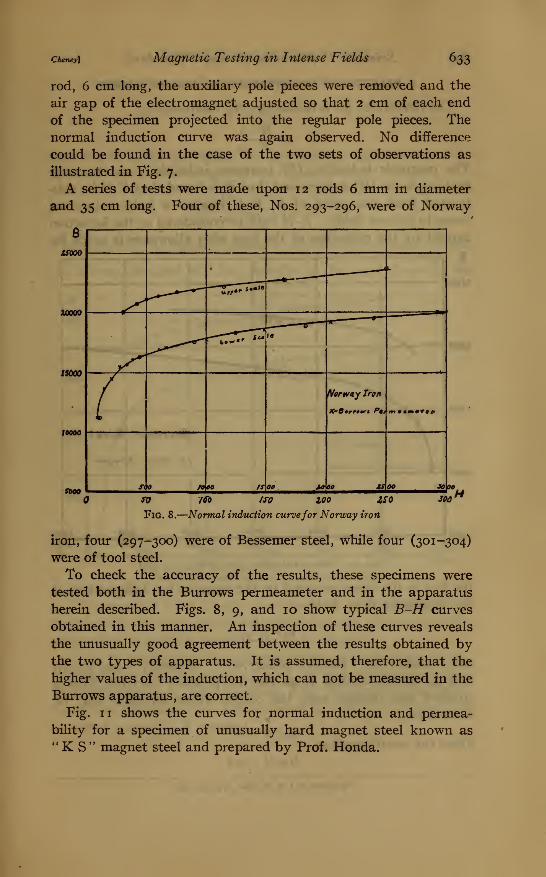
A series of tests were made upon 12 rods 6 mm in diameter
and 35 cm long. Four of these, Nos. 293-296, were of Norway
isooo
zoooo
liOOO
19000
soco
Fig. 8.
76b tSO zoo ZSO
-Normal induction curvefor Norway iron
soo
iron, four (297-300) were of Bessemer steel, while four (301-304)
were of tool steel.
To check the accuracy of the results, these specimens were
tested both in the Burrows permeameter and in the apparatus
herein described. Figs. 8, 9, and 10 show typical B-H curves
obtained in this manner. An inspection of these curves reveals
the unusually good agreement between the results obtained bythe two types of apparatus. It is assumed, therefore, that the
higher values of the induction, which can not be measured in the
Burrows apparatus, are correct.
Fig. II shows the curves for normal induction and permea-
bility for a specimen of unusually hard magnet steel known as" K S " magnet steel and prepared by Prof. Honda.

634 Scientific Papers of the Bureau of Standards
2. RELUCTIVITY AND INTENSITY OF MAGNETIZATION
The reluctivity (p) is defined by the relationship
H I
The magnetic induction {B) increases indefinitely as the mag-netizing force {H) is increased, but it is foimd that if // be sub-
tracted from the value of By B-H reaches a finite saturation
value in intense fields. B-H may be considered as the induction
carried by the molecules of the iron after allowance is made for
uooo
€0000
sooozooso ro9 ISO
Fig. 9.
—
Normal induction curvefor Bessemer steel
zso2£pp
H
the flux in the space occupied by the material but independent of
it. Replacing B by B-H,H
^""-^B^H
and is called the "metallic reluctivity." Kennelly ^" has shownthat po plotted against H as the independent variable gives a
straight line (except near the origin) whose equation may be
written as
Po = a +hHFrom the usual equation
B=H + ^irI
" KZemielly, A. I. E. E., Proc, 8, p. 485; 1891.

Cheney] Mogtietic Testing in Intense Fields
the intensity of magnetization may be written
B-H
635
/= :
47r
and can be easily calculated for successively higher values of H.The reciprocal of the susceptibility {k) is given by
I H 4TrH
k" I'B-H = 4^Po
Therefore, if -r be plotted against H as the independent variable,
the curves obtained will be precisely of the same shape as the
O so IQO ISO too ZS6
Fig. 10.
—
Normal induction curvefor tool steel
Po-H curves and such graphs are shown for five different mate-
rials in Fig. 12, the ordinates representing the reciprocal of the
susceptibility, and the abscissae the field strength.
Now, by calculating the reciprocal of the slope of these graphs,
the value for the maximum value of the intensity of magnetiza-
tion is determined. This has been done for a number of speci-
mens and the results are incorporated in Table i together with
observed values for H = 2000.

636 Scientific Papers of the Bureau of Standards
ZOOOO
6
moo
toeod
sooo
_^^^.J::^--^
-^'^
[>\
1\^. l\S /9d5»e< Sttel
/"*"
'
/^
10
to
10
no 1909 nto tooo xtvo 9*00
HFig. II.
—
Normal induction and permeabilityfor curvesfor "K S ** magnet steel
SCO t*t9 IfOO Mtb iSOO 1PP0
H
Fig. 12.
—
Showing the reciprocal of ike susceptibility plotted against the magnetizing force

CkcTiey] Magnetic Testing in Intense Fields
TABLE 1
637
Specl-menNo.
MaterialImaz(calcu-lated)
I for
H=2000
Sped-menNo.
MaterialImaz
(calcu-lated)
I for
H=2000
293 Norway iron
do
do
do
Bessemer steel
do
do
do
1747
1701
1679
1729
1695
1672
1667
1698
1725
1686
1672
1723
1665
1672
1652
1665
301
302
303
304
Tool steel 1579
1564
1545
1564
1613
1795
1384
1534
1490
294
295
296
297
do
do
do
KS magnet steel..
DriUrod
1525
1515
1530
1412
1465
298
299
300
In the case of the K S magnet steel and drill rod, the slope of
the r- curve changes, thus giving two values for /^ax. In the
case of the former this change occurs in the neighborhood of
H = i^oOy while for the latter it occurs near H = 6oo. B. O.
Peirce ^' has pointed out that the value of /max obtained from
the lower portion of the curve is less than the saturation value,
while /max calculated from the upper portion of the curve
where the slope is different is somewhat larger than the saturation
value. As pointed out by Steinmetz ^^ this change in slope is
indicative of the presence of two constituents of differing degrees
of hardness, which reach the maximum intensity of magnetization
for different values of H.
VI. SUMMARY
1. A resume of previous methods of measuring high inductions
is given.
2. A new modification of the isthmus method which is adapted
to the testing of long straight specimens is described.
3. Data are given to illustrate the accuracy of the method as
compared with standard methods.
4. Normal induction, intensity of magnetization, and reluc-
tivity data are discussed for various materials.
The writer is indebted to R. L. Sanford and Dr. C. Nusbaumfor valuable suggestions throughout the course of the experiments.
Washington, August 29, 191 9.
" B. O. Peirce, Am. Acad. Arts and Sci., Proc, 49, pp. 117-146; 1913.
"Steimnetz, Gen. Elec. Rev.. 20, p. 135; 1917.