magnetic resonance imaging of water ascent in … resonance imaging of water ascent in embolized...
TRANSCRIPT

Magnetic resonance imaging of water ascent in embolizedxylem vessels of grapevine stem segments
Mingtao Wang1, Melvin T. Tyree2,3, and Roderick E. Wasylishen1,4
1Department of Chemistry, University of Alberta, Edmonton, Alberta, Canada T6G 2G2; 2Department of RenewableResources, University of Alberta, Edmonton, Alberta, Canada T6G 2H1; and 3College of Forestry, Northwest A&F
University, Yangling, Shaanxi, China. Received 25 January 2013, accepted 3 May 2013.
Wang, M., Tyree, M. T. and Wasylishen, R. E. 2013.Magnetic resonance imaging of water ascent in embolized xylem vessels
of grapevine stem segments. Can. J. Plant Sci. 93: 879�893. Temporal and spatial information about water refilling ofembolized xylem vessels and the rate of water ascent in these vessels is critical for understanding embolism repair in intactliving vascular plants. High-resolution 1H magnetic resonance imaging (MRI) experiments have been performed onembolized grapevine stem segments while they were subjected to refilling at two different applied water pressures in orderto investigate these important aspects of embolism repair. Magnetic resonance imaging difference images show that vesselslocated near the bark tend to refill faster than do inner ones, suggesting that vessel position within the cross section of thestem may affect the refilling process within the vessel. An MRI method for determining the water ascent velocity ineach individual embolized xylem vessel is presented. At ambient pressure, the water ascent velocity ranges from 0.0090 to0.60 mm min�1, but increases to a range of 0.016 to 0.70 mm min�1 at 9.8 kPa above ambient pressure. A steady-statebubble model that offers analytical solutions of the water ascent velocity in embolized xylem vessels is presented; modelcalculations show that if other parameters are held constant, water ascent velocity is influenced by vessel diameter andposition.
Key words: Magnetic resonance imaging, water ascent velocity in grapevine stems, steady-state bubble model,embolized xylem vessels, Vitis labrusca L.
Wang, M., Tyree, M. T. et Wasylishen, R. E. 2013. Imagerie par resonance magnetique de l’ascension de l’eau dans les
vaisseaux obstrues du xyleme des segments de vigne. Can. J. Plant Sci. 93: 879�893. On a absolument besoin de donneestemporelles et spatiales sur l’ascension de l’eau dans les vaisseaux obstrues du xyleme ainsi que sur la vitesse a laquelle l’eaumonte dans ces vaisseaux pour comprendre comment les plantes vasculaires vivantes se remettent d’une embolie.Les auteurs ont examine des segments de vigne obstrues par IRM 1H a haute resolution durant leur remplissage adeux pressions differentes, cela afin d’etudier ces aspects importants de la reparation des embolies. Les images IRMdifferentielles revelent que les vaisseaux situes pres de l’ecorce ont tendance a se remplir plus vite que ceux situes plus al’interieur, ce qui laisse croire que l’emplacement du vaisseau dans la coupe transversale de la tige est susceptible d’affecterson remplissage. Les auteurs proposent une methode IRM permettant d’etablir la vitesse a laquelle l’eau grimpe danschaque vaisseau du xyleme obstrue. A pression ambiante, cette vitesse varie de 0,0090 a 0,60 mm par minute, mais elleaugmente a 0,016 a 0,70 mm par minute a 9,8 kPa au-dessus de la pression ambiante. Suit la presentation d’un modele abulle de l’etat stable permettant de resoudre les problemes associes a l’analyse de la vitesse d’ascension de l’eau dans lesvaisseaux du xyleme obstrues; les calculs realises avec ce modele indiquent que, lorsque les autres parametres sontconstants, la vitesse d’ascension de l’eau subit l’influence du diametre et de l’emplacement des vaisseaux.
Mots cles: Imagerie par resonance magnetique, vitesse d’ascension de l’eau dans les vignes, modele a bulle de l’etat stable,vaisseaux du xyleme obstrues, Vitis labrusca L.
Water transport in xylem vessels is vital to vascularplants (Raven 1977; Tyree and Sperry 1989; Tyree andZimmermann 2002; Brodbribb 2009); however, thisprocess can be disrupted if water cavitates in individualvessels (Tyree and Sperry 1989; Tyree and Zimmermann2002). When a xylem vessel becomes embolized (i.e., air-filled) after a cavitation event, it can no longer transportwater until it is repaired (Holbrook and Zwieniecki1999; Tyree et al. 1999). The mechanism by which plantsrepair their embolized xylem vessels is only partly
resolved (Yang and Tyree 1992; Salleo et al. 1996;Canny 1998; McCully et al. 1998; Zwieniecki andHolbrook 1998; Pate and Canny 1999; Zwienieckiand Holbrook 2000; Melcher et al. 2001; Clearwaterand Goldstein 2005; Salleo et al. 2009).
Experimental methods, such as hydraulic conductivitymeasurements (Tyree and Yang 1992; Hacke and Sperry2003), cryo-scanning electron microscopy (Facette et al.2001), acoustic emission testing (Borghetti et al. 1991;
4Corresponding author (e-mail: [email protected]).
Abbreviations: i.d., inner diameter; MRI, magnetic resonanceimaging; MSME, multiple slice multiple spin echo; NMR, nuclearmagnetic resonance; ROI, region of interest; T1, spin-latticerelaxation time; T2, spin-spin relaxation time; TR, repetition time
Can. J. Plant Sci. (2013) 93: 879�893 doi:10.4141/CJPS2013-025 879

Laschimke et al. 2006), X-ray imaging (Lee and Kim2008), high-resolution computed tomography (McElroneet al. 2012) and theoretical modeling (Yang and Tyree1992) have been used to investigate embolism repair.Magnetic resonance imaging (MRI) is also well suited toinvestigate water in plants (Callaghan 1991, 2011;Kimmich 1997; Rokitta et al. 1999; Blumich 2000;Narasimhan and Jacobs 2005; Van As et al. 2009; Choatet al. 2010; Borisjuk et al. 2012; MacFall and Johnson2012; Telkki 2012; Gruwel et al. 2013). For example,1H MRI experiments have been used to investigate theloss of xylem conductivity caused by Xylella fastidiosainfection and ethylene exposure (Perez-Donoso et al.2007), to image in vivo xylem vessel content in woodylianas (Clearwater and Clark 2003), and to study thedynamics of water transport in phloem and xylem tissues(Windt et al. 2006; Homan et al. 2007; Scheenen 2007)and in seedlings (Kockenberger et al. 1997) of plants.Previously, Holbrook et al. (2001) reported the successfuluse of 1H MRI experiments to monitor the occurrenceof cavitation and its repair in the stem of an intact,transpiring grape (Vitis vinifera).
Two types of embolism repair have been studiedextensively in the past (Tyree and Zimmermann 2002):(1) refilling of vessels in early spring in dormant stemsbefore leaf emergence and (2) repair in summer whenleaves are present and water is flowing through somevessels to keep up with evaporation from the leaves,while others are refilling. In the former case the water inall vessels is under positive pressure (root pressure orstem pressure). In the latter case water in surroundingwater-filled vessels is under negative pressure whileembolized vessels are refilling by positive pressure.The most definitive study of the latter case used highresolution (1 mm) computer tomography of X-ray imagesto study the dynamics of refilling (Brodersen et al. 2010).In the present study we use lower-resolution MRIimaging (20 to 30 mm) to study refilling in simulatedspringtime conditions as explained below.
In 1992, the first models were tested to gain anunderstanding of how embolisms can collapse in exciseddormant maple stems based on Fick’s Law, Henry’s Lawand surface tension at air-water interfaces (Tyree andYang 1992; Yang and Tyree 1992). These early studiesdocumented embolism collapse indirectly through mea-sured changes in hydraulic conductivity that results asembolisms disappear. The objective of this research is torevisit the old theories with the added power of MRI,which can image individual vessels, to see if the theorycan explain the rate of bubble collapse in excised grapestem segments under well-controlled conditions.
In the work presented here, high-resolution 1H MRIexperiments were performed on grapevine stem seg-ments to investigate the temporal and spatial patterns ofwater refilling of embolized xylem vessels. An MRImethod was developed to determine the rate of collapseof air bubbles and movement of the meniscus, when thefluid pressure in the xylem is under experimental control
and held to a value near to atmospheric pressure. Fluidpressure is easily controlled in excised stem segments,and we believe this is the first study to focus on velocitymeasurements of meniscus movement in biologicalsystems, although such measurements have been under-taken for microchannels in silicon nitride chips (Yanget al. 2004). An enhanced understanding of events undercontrolled conditions (simulated springtime conditions)may allow us to better explain the quite differentbehavior of intact grapevines whereby vessels seem torefill when water is metastable (fluid pressure B�0.1MPa) (Brodersen et al. 2010). Finally, we hope that theresearch described herein will increase the awareness ofresearchers in the plant science community of a powerfultechnique for studying water density in plants that isgenerally associated with medicine, MRI.
MATERIALS AND METHODS
Plant MaterialsStem segments 12�14 cm in length and 4�6 mm indiameter were collected from a Concord grapevine (Vitislabrusca L.) that had been allowed to grow for severalyears with no pruning. All stem segments were �1 yrold and had survived a full winter and had budded toform current year stems and leaves distal of theharvested segment. Embolism in the stems was inducedby injecting air into one end of the stems for approxi-mately 2 min with a pressure of �0.6 MPa, whichembolized most of the vessels. After the embolizationtreatment, the stems were promptly subjected to waterrefilling and 1H MRI measurements.
Magnetic Resonance Imaging RI Experiments1H MRI experiments were performed on the stems whilethey were refilling with water at two different xylempressures, one at ambient pressure and the other at9.8 kPa above ambient pressure, hereafter referred to as9.8 kPa. The experimental setup is shown in Fig. 1a. Thestem segment was positioned in the radio frequencybirdcage coil with its basal end connected via water-filled tubing that ran through the MRI probe to a water-filled bottle whose height could be adjusted to achievedifferent water pressures. The top end of the stemsegment was sealed by a water-filled compression fitting.Escape of air through open vessels was thereby pre-vented and gas trapped in vessels could only dissipatethrough dissolution, thus drawing in water from thebase of the stem. In all experiments, the influx end of thestem segment was maintained approximately 40 mmbelow the center of the resonator (Fig. 1b).
A multiple-slice multiple spin-echo (MSME) MRImethod (Graumann et al. 1986; De Deene and Baldock2002) was used to acquire 1H MRI images of the crosssection of the stems and to determine the water ascentvelocity in embolized xylem vessels. Using this techni-que, an axial slice package containing five 1.5-mm-thickslices with a 0.5-mm inter-slice gap was defined along
880 CANADIAN JOURNAL OF PLANT SCIENCE
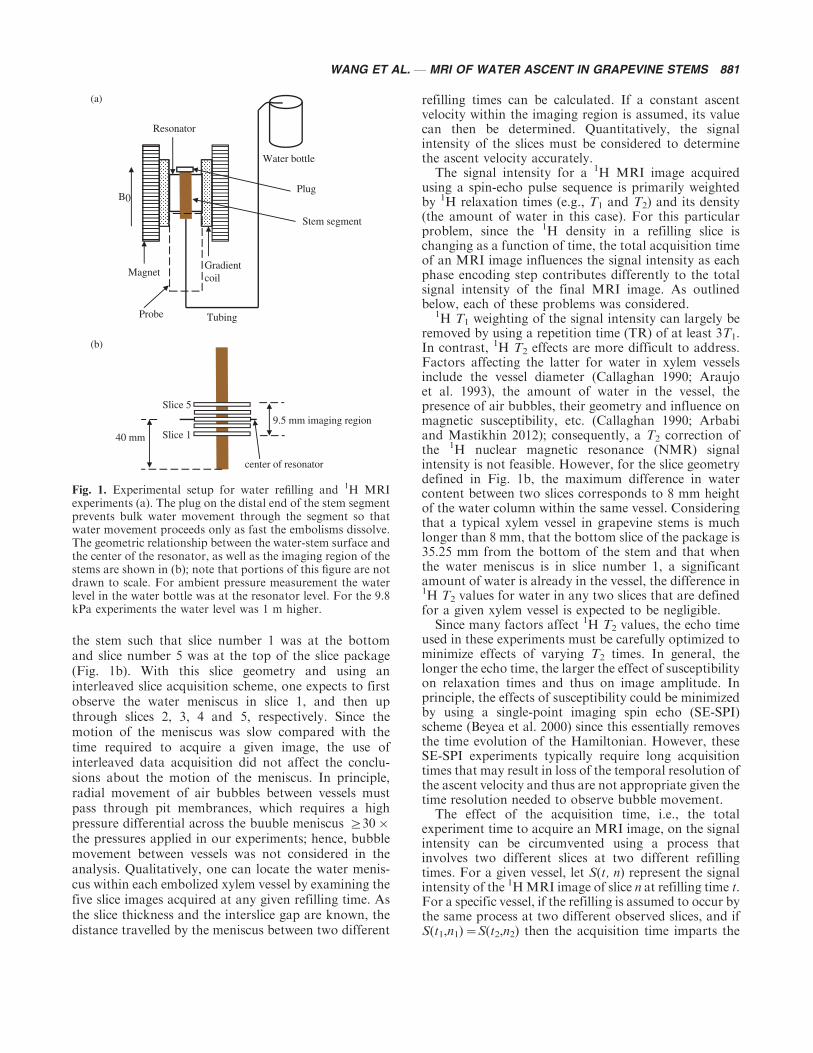
the stem such that slice number 1 was at the bottomand slice number 5 was at the top of the slice package(Fig. 1b). With this slice geometry and using aninterleaved slice acquisition scheme, one expects to firstobserve the water meniscus in slice 1, and then upthrough slices 2, 3, 4 and 5, respectively. Since themotion of the meniscus was slow compared with thetime required to acquire a given image, the use ofinterleaved data acquisition did not affect the conclu-sions about the motion of the meniscus. In principle,radial movement of air bubbles between vessels mustpass through pit membrances, which requires a highpressure differential across the buuble meniscus ]30�the pressures applied in our experiments; hence, bubblemovement between vessels was not considered in theanalysis. Qualitatively, one can locate the water menis-cus within each embolized xylem vessel by examining thefive slice images acquired at any given refilling time. Asthe slice thickness and the interslice gap are known, thedistance travelled by the meniscus between two different
refilling times can be calculated. If a constant ascentvelocity within the imaging region is assumed, its valuecan then be determined. Quantitatively, the signalintensity of the slices must be considered to determinethe ascent velocity accurately.
The signal intensity for a 1H MRI image acquiredusing a spin-echo pulse sequence is primarily weightedby 1H relaxation times (e.g., T1 and T2) and its density(the amount of water in this case). For this particularproblem, since the 1H density in a refilling slice ischanging as a function of time, the total acquisition timeof an MRI image influences the signal intensity as eachphase encoding step contributes differently to the totalsignal intensity of the final MRI image. As outlinedbelow, each of these problems was considered.
1H T1 weighting of the signal intensity can largely beremoved by using a repetition time (TR) of at least 3T1.In contrast, 1H T2 effects are more difficult to address.Factors affecting the latter for water in xylem vesselsinclude the vessel diameter (Callaghan 1990; Araujoet al. 1993), the amount of water in the vessel, thepresence of air bubbles, their geometry and influence onmagnetic susceptibility, etc. (Callaghan 1990; Arbabiand Mastikhin 2012); consequently, a T2 correction ofthe 1H nuclear magnetic resonance (NMR) signalintensity is not feasible. However, for the slice geometrydefined in Fig. 1b, the maximum difference in watercontent between two slices corresponds to 8 mm heightof the water column within the same vessel. Consideringthat a typical xylem vessel in grapevine stems is muchlonger than 8 mm, that the bottom slice of the package is35.25 mm from the bottom of the stem and that whenthe water meniscus is in slice number 1, a significantamount of water is already in the vessel, the difference in1H T2 values for water in any two slices that are definedfor a given xylem vessel is expected to be negligible.
Since many factors affect 1H T2 values, the echo timeused in these experiments must be carefully optimized tominimize effects of varying T2 times. In general, thelonger the echo time, the larger the effect of susceptibilityon relaxation times and thus on image amplitude. Inprinciple, the effects of susceptibility could be minimizedby using a single-point imaging spin echo (SE-SPI)scheme (Beyea et al. 2000) since this essentially removesthe time evolution of the Hamiltonian. However, theseSE-SPI experiments typically require long acquisitiontimes that may result in loss of the temporal resolution ofthe ascent velocity and thus are not appropriate given thetime resolution needed to observe bubble movement.
The effect of the acquisition time, i.e., the totalexperiment time to acquire an MRI image, on the signalintensity can be circumvented using a process thatinvolves two different slices at two different refillingtimes. For a given vessel, let S(t, n) represent the signalintensity of the 1HMRI image of slice n at refilling time t.For a specific vessel, if the refilling is assumed to occur bythe same process at two different observed slices, and ifS(t1,n1)�S(t2,n2) then the acquisition time imparts the
Water bottle
Plug
Gradientcoil
TubingProbe
Resonator
B0
Magnet
40 mm
9.5 mm imaging region
center of resonator
(b)
(a)
Slice 1
Slice 5
Stem segment
Fig. 1. Experimental setup for water refilling and 1H MRIexperiments (a). The plug on the distal end of the stem segmentprevents bulk water movement through the segment so thatwater movement proceeds only as fast the embolisms dissolve.The geometric relationship between the water-stem surface andthe center of the resonator, as well as the imaging region of thestems are shown in (b); note that portions of this figure are notdrawn to scale. For ambient pressure measurement the waterlevel in the water bottle was at the resonator level. For the 9.8kPa experiments the water level was 1 m higher.
WANG ET AL. * MRI OF WATER ASCENT IN GRAPEVINE STEMS 881
same effect on the signal intensity of the 1H MRI imagesof these two different slices. Consequently, the ascentvelocity, v, can be calculated as:
v�(n2 � n1)(l � Dl)
t2 � t1
(1)
where l and Dl denote the slice thickness and interslicegap, respectively.
For a given slice defined for a specific xylem vessel,S(t,n) is a function of t with n fixed. Plotting S(t,n)against t allows the construction of a curve thatcharacterizes the relationship between the signal inten-sity and refilling time for this specific slice. Comparisonof such curves for two different slices permits thedetermination of the time required for these two slicesto acquire the same 1H MRI signal intensity; this timecan then be used to calculate the water ascent velocity inthis specific embolized xylem vessel (vide infra).
High-resolution 1H MRI experiments were performedwith a 7.05 Tesla (300.17 MHz), vertical wide-bore(89 mm i.d.) superconducting magnet with a BrukerAvance 300 console, Micro-2.5 imaging accessory, and a10 mm i.d. birdcage resonator. A microgradient set (40mm i.d.) capable of 1.0 T m�1 was mounted in themagnet bore. The temperature of the gradient unit wasmaintained at 208C using a water-cooling system pro-vided by Bruker, and all MRI experiments were per-formed at room temperature (approximately 228C). 1HT1 and T2 values for water in individual xylem vessels atthe normal water refilled state (i.e., before embolizationtreatment) were measured using saturation-recovery(Roscher et al. 1996; Markley et al. 1971) and spin-echo MRI experiments (Meiboom and Gill 1958),respectively. An MSME MRI pulse sequence wasemployed for all the MRI experiments with the followingparameters: echo time�10.6 ms, TR�3000 ms, numberof averages�1, field of view�6.0 mm�6.0 mm,MTX�256�256, slice thickness�1.5 mm. 1H MRIexperiments were performed every 13 min once refillingof the embolized stems began (see below for details).
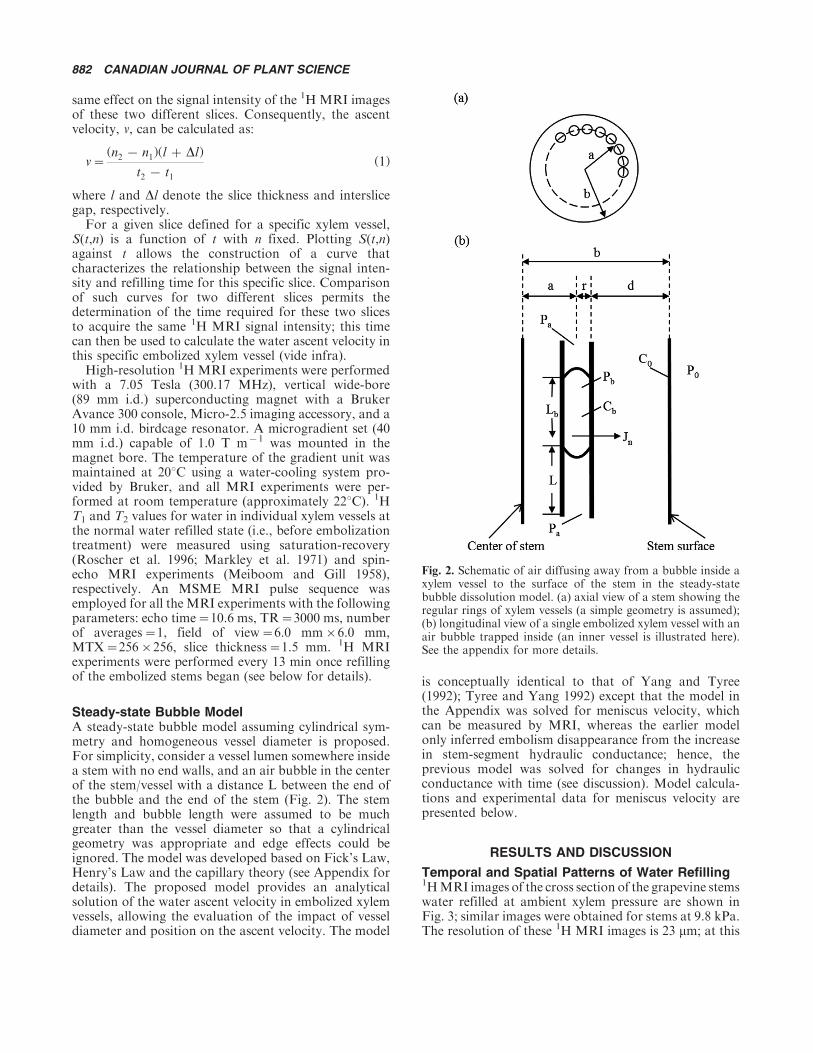
Steady-state Bubble ModelA steady-state bubble model assuming cylindrical sym-metry and homogeneous vessel diameter is proposed.For simplicity, consider a vessel lumen somewhere insidea stem with no end walls, and an air bubble in the centerof the stem/vessel with a distance L between the end ofthe bubble and the end of the stem (Fig. 2). The stemlength and bubble length were assumed to be muchgreater than the vessel diameter so that a cylindricalgeometry was appropriate and edge effects could beignored. The model was developed based on Fick’s Law,Henry’s Law and the capillary theory (see Appendix fordetails). The proposed model provides an analyticalsolution of the water ascent velocity in embolized xylemvessels, allowing the evaluation of the impact of vesseldiameter and position on the ascent velocity. The model
is conceptually identical to that of Yang and Tyree(1992); Tyree and Yang 1992) except that the model inthe Appendix was solved for meniscus velocity, whichcan be measured by MRI, whereas the earlier modelonly inferred embolism disappearance from the increasein stem-segment hydraulic conductance; hence, theprevious model was solved for changes in hydraulicconductance with time (see discussion). Model calcula-tions and experimental data for meniscus velocity arepresented below.
RESULTS AND DISCUSSION
Temporal and Spatial Patterns of Water Refilling1HMRI images of the cross section of the grapevine stemswater refilled at ambient xylem pressure are shown inFig. 3; similar images were obtained for stems at 9.8 kPa.The resolution of these 1H MRI images is 23 mm; at this
Fig. 2. Schematic of air diffusing away from a bubble inside axylem vessel to the surface of the stem in the steady-statebubble dissolution model. (a) axial view of a stem showing theregular rings of xylem vessels (a simple geometry is assumed);(b) longitudinal view of a single embolized xylem vessel with anair bubble trapped inside (an inner vessel is illustrated here).See the appendix for more details.
882 CANADIAN JOURNAL OF PLANT SCIENCE
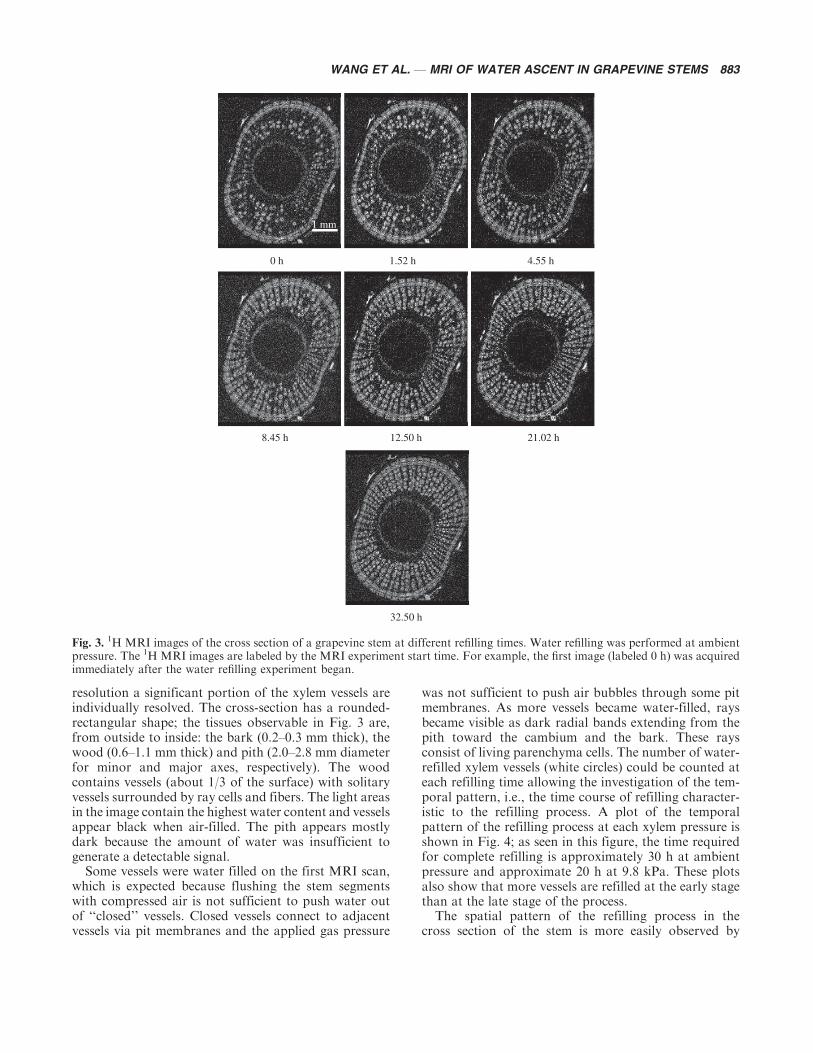
resolution a significant portion of the xylem vessels areindividually resolved. The cross-section has a rounded-rectangular shape; the tissues observable in Fig. 3 are,from outside to inside: the bark (0.2�0.3 mm thick), thewood (0.6�1.1 mm thick) and pith (2.0�2.8 mm diameterfor minor and major axes, respectively). The woodcontains vessels (about 1/3 of the surface) with solitaryvessels surrounded by ray cells and fibers. The light areasin the image contain the highest water content and vesselsappear black when air-filled. The pith appears mostlydark because the amount of water was insufficient togenerate a detectable signal.
Some vessels were water filled on the first MRI scan,which is expected because flushing the stem segmentswith compressed air is not sufficient to push water outof ‘‘closed’’ vessels. Closed vessels connect to adjacentvessels via pit membranes and the applied gas pressure
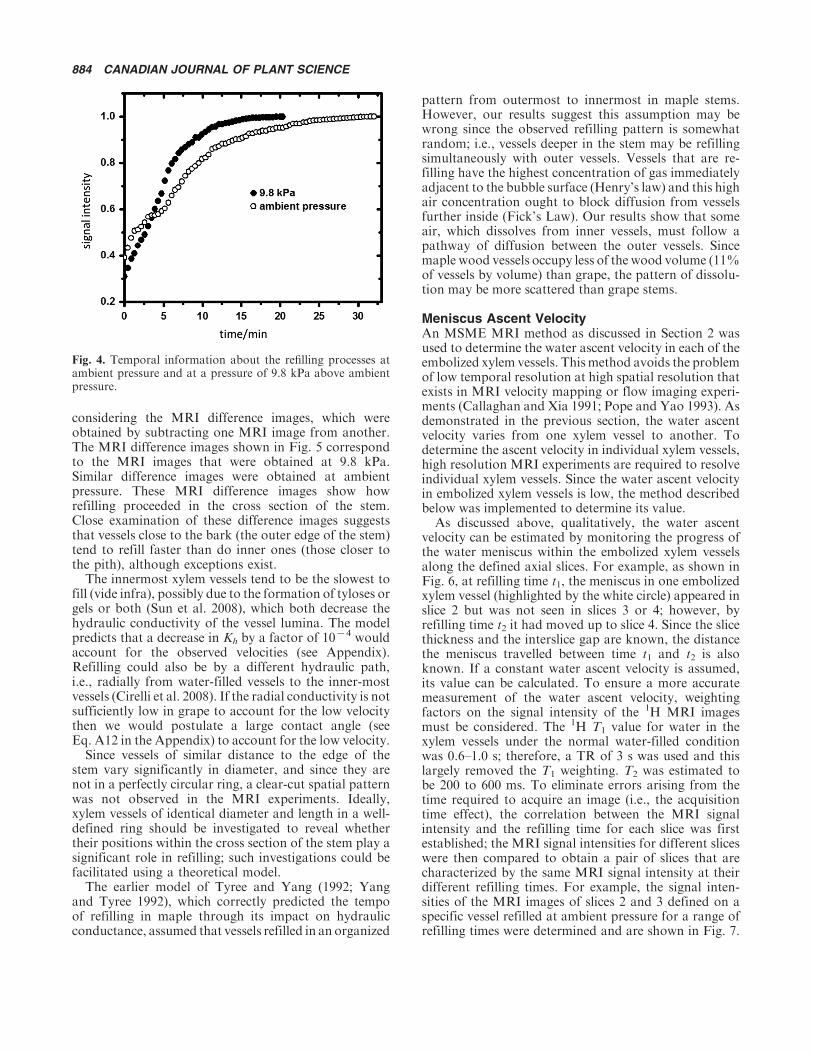
was not sufficient to push air bubbles through some pitmembranes. As more vessels became water-filled, raysbecame visible as dark radial bands extending from thepith toward the cambium and the bark. These raysconsist of living parenchyma cells. The number of water-refilled xylem vessels (white circles) could be counted ateach refilling time allowing the investigation of the tem-poral pattern, i.e., the time course of refilling character-istic to the refilling process. A plot of the temporalpattern of the refilling process at each xylem pressure isshown in Fig. 4; as seen in this figure, the time requiredfor complete refilling is approximately 30 h at ambientpressure and approximate 20 h at 9.8 kPa. These plotsalso show that more vessels are refilled at the early stagethan at the late stage of the process.
The spatial pattern of the refilling process in thecross section of the stem is more easily observed by
0 h 1.52 h 4.55 h
8.45 h 12.50 h 21.02 h
32.50 h
0 1 mm
Fig. 3. 1H MRI images of the cross section of a grapevine stem at different refilling times. Water refilling was performed at ambientpressure. The 1H MRI images are labeled by the MRI experiment start time. For example, the first image (labeled 0 h) was acquiredimmediately after the water refilling experiment began.
WANG ET AL. * MRI OF WATER ASCENT IN GRAPEVINE STEMS 883
considering the MRI difference images, which wereobtained by subtracting one MRI image from another.The MRI difference images shown in Fig. 5 correspondto the MRI images that were obtained at 9.8 kPa.Similar difference images were obtained at ambientpressure. These MRI difference images show howrefilling proceeded in the cross section of the stem.Close examination of these difference images suggeststhat vessels close to the bark (the outer edge of the stem)tend to refill faster than do inner ones (those closer tothe pith), although exceptions exist.
The innermost xylem vessels tend to be the slowest tofill (vide infra), possibly due to the formation of tyloses orgels or both (Sun et al. 2008), which both decrease thehydraulic conductivity of the vessel lumina. The modelpredicts that a decrease in Kh by a factor of 10�4 wouldaccount for the observed velocities (see Appendix).Refilling could also be by a different hydraulic path,i.e., radially from water-filled vessels to the inner-mostvessels (Cirelli et al. 2008). If the radial conductivity is notsufficiently low in grape to account for the low velocitythen we would postulate a large contact angle (seeEq. A12 in the Appendix) to account for the low velocity.
Since vessels of similar distance to the edge of thestem vary significantly in diameter, and since they arenot in a perfectly circular ring, a clear-cut spatial patternwas not observed in the MRI experiments. Ideally,xylem vessels of identical diameter and length in a well-defined ring should be investigated to reveal whethertheir positions within the cross section of the stem play asignificant role in refilling; such investigations could befacilitated using a theoretical model.
The earlier model of Tyree and Yang (1992; Yangand Tyree 1992), which correctly predicted the tempoof refilling in maple through its impact on hydraulicconductance, assumed that vessels refilled in an organized
pattern from outermost to innermost in maple stems.However, our results suggest this assumption may bewrong since the observed refilling pattern is somewhatrandom; i.e., vessels deeper in the stem may be refillingsimultaneously with outer vessels. Vessels that are re-filling have the highest concentration of gas immediatelyadjacent to the bubble surface (Henry’s law) and this highair concentration ought to block diffusion from vesselsfurther inside (Fick’s Law). Our results show that someair, which dissolves from inner vessels, must follow apathway of diffusion between the outer vessels. Sincemaple wood vessels occupy less of the wood volume (11%of vessels by volume) than grape, the pattern of dissolu-tion may be more scattered than grape stems.
Meniscus Ascent VelocityAn MSME MRI method as discussed in Section 2 wasused to determine the water ascent velocity in each of theembolized xylem vessels. Thismethod avoids the problemof low temporal resolution at high spatial resolution thatexists in MRI velocity mapping or flow imaging experi-ments (Callaghan and Xia 1991; Pope and Yao 1993). Asdemonstrated in the previous section, the water ascentvelocity varies from one xylem vessel to another. Todetermine the ascent velocity in individual xylem vessels,high resolution MRI experiments are required to resolveindividual xylem vessels. Since the water ascent velocityin embolized xylem vessels is low, the method describedbelow was implemented to determine its value.
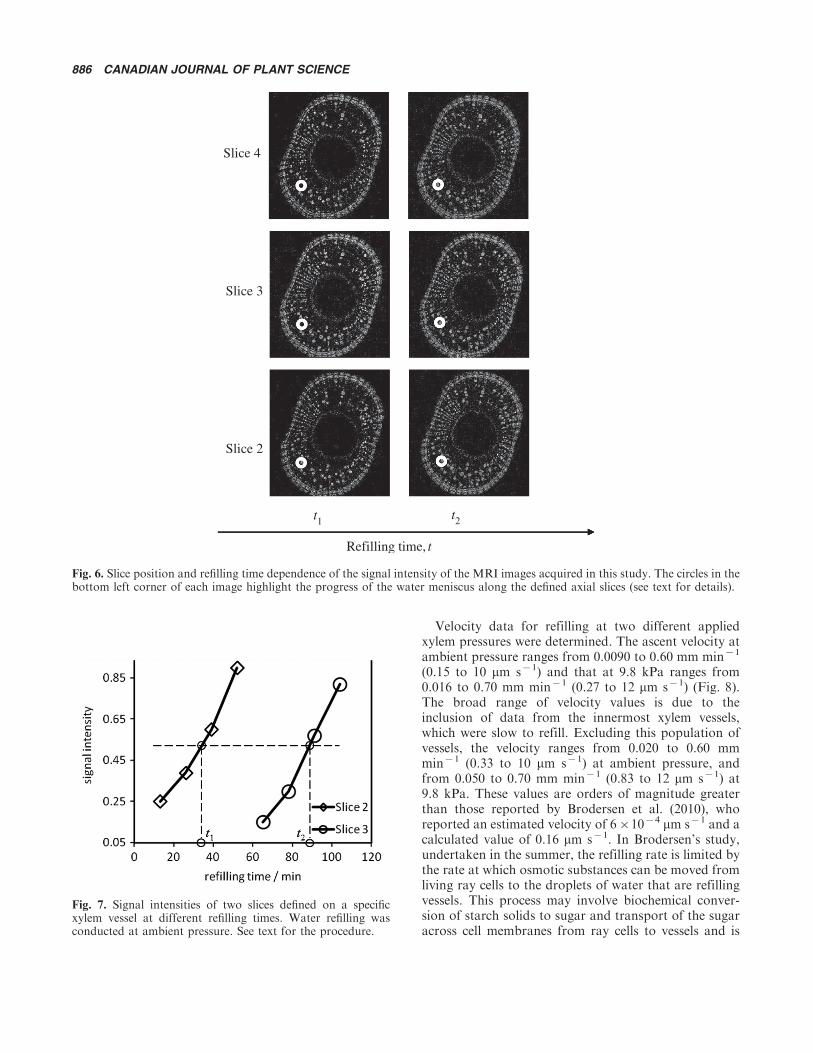
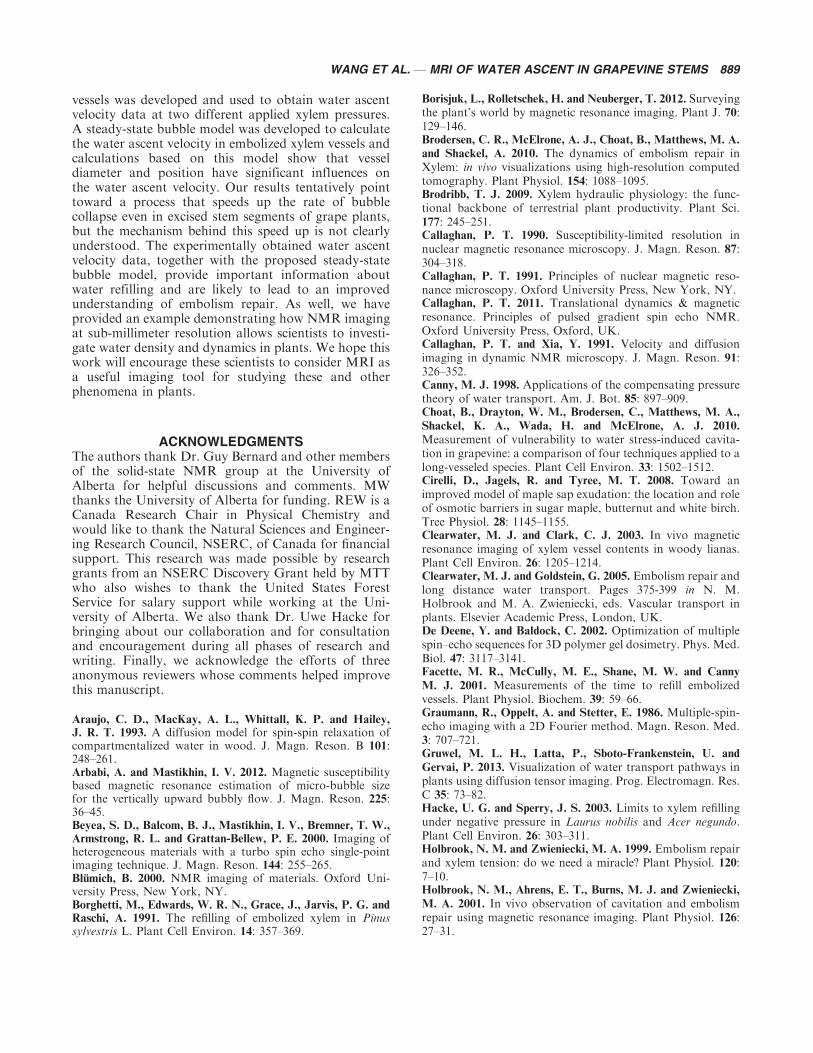
As discussed above, qualitatively, the water ascentvelocity can be estimated by monitoring the progress ofthe water meniscus within the embolized xylem vesselsalong the defined axial slices. For example, as shown inFig. 6, at refilling time t1, the meniscus in one embolizedxylem vessel (highlighted by the white circle) appeared inslice 2 but was not seen in slices 3 or 4; however, byrefilling time t2 it had moved up to slice 4. Since the slicethickness and the interslice gap are known, the distancethe meniscus travelled between time t1 and t2 is alsoknown. If a constant water ascent velocity is assumed,its value can be calculated. To ensure a more accuratemeasurement of the water ascent velocity, weightingfactors on the signal intensity of the 1H MRI imagesmust be considered. The 1H T1 value for water in thexylem vessels under the normal water-filled conditionwas 0.6�1.0 s; therefore, a TR of 3 s was used and thislargely removed the T1 weighting. T2 was estimated tobe 200 to 600 ms. To eliminate errors arising from thetime required to acquire an image (i.e., the acquisitiontime effect), the correlation between the MRI signalintensity and the refilling time for each slice was firstestablished; the MRI signal intensities for different sliceswere then compared to obtain a pair of slices that arecharacterized by the same MRI signal intensity at theirdifferent refilling times. For example, the signal inten-sities of the MRI images of slices 2 and 3 defined on aspecific vessel refilled at ambient pressure for a range ofrefilling times were determined and are shown in Fig. 7.
Fig. 4. Temporal information about the refilling processes atambient pressure and at a pressure of 9.8 kPa above ambientpressure.
884 CANADIAN JOURNAL OF PLANT SCIENCE

Signal intensities were measured based on a region ofinterest (ROI) defined such that it encompassed theentire lumen; the noise level was assumed to be the samefor all images. If the signal intensities for two differentslices of the same xylem vessel are the same, the waterascent velocity can be readily calculated without concernfor the acquisition time effect since under this condition,this effect is the same for both slices and the physicaldisplacement (i.e., slice position change) due to waterascent equals the one determined from situations whereno acquisition time effect is involved. As shown inFig. 7, the signal intensity for slice 2 at refilling time t1 isthe same as that for slice 3 at refilling time t2. The waterascent velocity in this embolized xylem vessel is thencalculated as 0.035 mm min�1 (0.58 mm s�1) accordingto Eq. 1. This process can be repeated on any resolvablexylem vessel to determine the water ascent velocity with-in it. When analyzing the data, some high-velocity rateswere encountered. For example, the water meniscus
appeared in slice 1 in one experiment and then in slice5 in another experiment 13 min later. In fact, theexperimental setup used in this study will not allowthe determination of an ascent velocity that is higherthan 0.72 mm min�1. As long as two data points couldbe collected for each of the two slices, the aforemen-tioned procedure was used to determine the ascentvelocity. In any case, where only one point was available
for one slice or both, scaling factors, Ri �Si
S0
; were
defined where S0 denotes the signal intensity of a slicethat was fully water filled when the imaging experi-ment started, and Si�(i�1,2) denotes the signalintensity of the two slices. Under these conditions, Eq. 1becomes:
v�(n2 �n1 � 1)(l � Dl) � Dl � (1 � R2 �R1)l
t2 � t1
(2)
5.63–7.15 h
1.08–2.60 h 2.60–4.12 h 0–1.08 h
4.12–5.63 h 7.15–10.18 h
10.18–14.08 h 14.08–20.15 h
Fig. 5. Magnetic resonance imaging difference images obtained from the 1H MRI images acquired with water refilling performed at9.8 kPa above ambient pressure. The MRI difference images are labeled in such a way that, for example, the first difference image(labeled 0�1.08 h) was obtained by subtracting the 1H MRI image acquired at 0 h from the one acquired at 1.08 h. For clarity, theoutside edge of the stem is highlighted in white.
WANG ET AL. * MRI OF WATER ASCENT IN GRAPEVINE STEMS 885
Velocity data for refilling at two different appliedxylem pressures were determined. The ascent velocity atambient pressure ranges from 0.0090 to 0.60 mm min�1
(0.15 to 10 mm s�1) and that at 9.8 kPa ranges from0.016 to 0.70 mm min�1 (0.27 to 12 mm s�1) (Fig. 8).The broad range of velocity values is due to theinclusion of data from the innermost xylem vessels,which were slow to refill. Excluding this population ofvessels, the velocity ranges from 0.020 to 0.60 mmmin�1 (0.33 to 10 mm s�1) at ambient pressure, andfrom 0.050 to 0.70 mm min�1 (0.83 to 12 mm s�1) at9.8 kPa. These values are orders of magnitude greaterthan those reported by Brodersen et al. (2010), whoreported an estimated velocity of 6�10�4 mm s�1 and acalculated value of 0.16 mm s�1. In Brodersen’s study,undertaken in the summer, the refilling rate is limited bythe rate at which osmotic substances can be moved fromliving ray cells to the droplets of water that are refillingvessels. This process may involve biochemical conver-sion of starch solids to sugar and transport of the sugaracross cell membranes from ray cells to vessels and is
t1 t2
Refilling time, t
Slice 2
Slice 3
Slice 4
Fig. 6. Slice position and refilling time dependence of the signal intensity of the MRI images acquired in this study. The circles in thebottom left corner of each image highlight the progress of the water meniscus along the defined axial slices (see text for details).
Fig. 7. Signal intensities of two slices defined on a specificxylem vessel at different refilling times. Water refilling wasconducted at ambient pressure. See text for the procedure.
886 CANADIAN JOURNAL OF PLANT SCIENCE

likely to be quite slow. The growth of the water volumeis osmotically induced following the biochemical pro-cesses and membrane transport; hence the measuredrates are quite low. In our case, stem pressurization wasmechanically induced and the rate of water filling waslimited by the rate of diffusion of air from the airbubbles.
Model CalculationsThe steady-state bubble model has the advantage ofhaving an analytical solution that allows the easyevaluation of the impact of vessel diameter and positionon the rate of advance of the meniscus and explicitlyquantifies the co-limiting influence of diffusion andhydraulic conductance on the physical processes occur-ring as a bubble dissolves. Results from model calcula-tions suggest that vessel diameter and position are twoimportant factors controlling the water ascent velocityfor a given stem segment at a given refilling pressure(Fig. 8). Model calculations also indicate that theprocess of water refilling is limited by the diffusionprocess (i.e., by kD) in which air diffuses away frominside the bubble to the edge of the stem. The proposedsteady-state bubble model provides a basis for under-standing the biophysical constraints of embolism repairand a benchmark for estimating the water ascentvelocity in embolized xylem vessels for grapevines.
The discrepancies between the MRI-determined andthe model-calculated water ascent velocities arise fromat least two possible sources. One is the simple stem andxylem vessel geometry adopted in the model and theother is the uncertainty of the values for the modelparameters. Most importantly, the air diffusion coeffi-cient in woody stems and the contact angle betweenvessel walls and the curvature of the air-water interface
are two parameters whose values have a significantinfluence on the predicted results.
According to theory [see the Appendix or Yang andTyree (1992)], vessel diameter should limit the radius ofcurvature of the meniscus if the contact angle of the air-water interface is zero. The meniscus diameter andsurface tension of the fluid determines the pressure ofthe bubble (Eq. A12 in the Appendix). The surfacepressure of the bubble determines the concentration ofthe dissolved air at the bubble surface (Henry’s Law)and surface concentration determines the rate of diffu-sion away from the surface and hence the velocity of themeniscus (Fick’s Law).
A possible explanation for the poor correlation be-tween meniscus velocities and diameter is that the MRIimages might give incorrect diameter data. To investi-gate, the radius of all vessels�25 mm in similar grapestems were measured using a light microscope; a meanand standard deviation of 51938 (N�386) was found,which compared well with the values in Fig. 8 (49913,N�35) (Dr. Jing Cai, personal communication).
The time for bubble dissolution increases with increas-ing vessel diameter. The high variability shown in Fig. 8suggests that other parameters must also influence therefilling process significantly and these effects may cancelout the vessel size effect on water refilling. For instance,if an air bubble trapped inside a xylem vessel disappearsthrough dissolution into water and subsequently diffusesaway from within the vessel to the outside of the stem,then the vessel position within the cross section of thestem is expected to influence the ascent velocity becausethis position determines the length of the diffusionpathway from the center of the vessel to the surface ofthe stem. To evaluate the effect of vessel size on theascent velocity, a regular vessel arrangement within thecross section of the stem is necessary. Once again,
Fig. 8. Water ascent velocity as a function of vessel radius, at ambient pressure and at 9.8 kPa above ambient pressure. Theuncertainty associated with the determined water ascent velocity is estimated to be 20�40%, based on the deviation in the data froma minimum of five experiments. The vessel radius was determined from the corresponding 1H MRI images and the uncertainty is10%. The open triangles represent data points from the outer vessels, while the filled triangles indicate data points from theinnermost vessels. The curves are theoretical values: upper curve�velocity versus vessel radius for vessels 0.4 mm from the surfaceof the stem; lower curve�velocity versus vessel radius for vessels 1.4 mm from the stem surface (see appendix and Fig. 2a).
WANG ET AL. * MRI OF WATER ASCENT IN GRAPEVINE STEMS 887

because ideal uniform vessels do not exist, one is limitedto theoretical modeling.
Model Versus RealityThe advantage of the model developed in the Appendixis that it predicts how fast bubbles entrapped in vesselswill collapse assuming only passive physical processesare occurring (i.e., experimental artifacts do not affectthe calculations). The speed of bubble collapse ismeasured by the velocity of the air/water interface.The derivation allows for two types of limitation ofbubble collapse, i.e., diffusion-limitation (Fick’s law)and mass-flow limitation (Hagen�Poiseuille law), whichis of negligible impact and will be ignored for theremainder of this discussion.
The diffusion rate is controlled by both the drivingforce and the rate constant imposed by Fick’s law ofdiffusion (Callaghan 2011). The driving force is deter-mined by the difference between the bubble pressure andthe atmospheric air pressure (Pb - Po) and the rateconstant is given by kD (see Eq. A2). This equationincludes the coefficient of diffusion (D) of ‘‘air’’ in themix of the water/cell wall and some terms for thediffusion path length and geometry. The exact D is anunknown quantity in the context of wood, whichconsists of water-filled vessel-lumina, cell walls and amix of living cells along the pathway of diffusion. Thetheoretical values of v are within a factor of 2 or 3 of theobserved values. The velocities of the innermost vessels(solid triangles in Fig. 8) are slower than expected fromthe model (for reasons stated above). In contrast theoutermost large vessels refill faster than predicted bytheory (open triangles Fig. 8). Since the temperature ofthe gradient coils was maintained at 208C, the varyingrefilling time is thought to be a property of the stemsand not an experimental artifact arising from tempera-ture gradients. The model assumes that vessels are inuniform concentric rings (five in the grape stems used inthis experiment, see Fig. 3) and that all vessels are thesame radius within a ring for any one solution (see thecurves in Fig. 8). If all vessels were of the same radius inall five rings then the outer rings would have the highestv and its value would decrease gradually to the lowestvalues in the inner ring. Indeed, the inner ring has thelowest experimental values of v but there is littlecorrelation with the outer four rings (Fig. 8). The ring-location of a vessel determines the value of kD but theradius of the vessel within a ring determines Pb (bubblepressure) and hence the driving force. Also note thatthe vessel r value is variable in any given ring hence thebubble pressure of a small vessel radius will exceed thebubble pressure of a large vessel radius. Thus, smallvessels might collapse very quickly because of thepossible rapid diffusion of air between a small vesseland an adjacent large vessel within the same ring or inan adjacent ring. This process might account for the sca-ttered values of v in Fig. 8 and indicates that the modelneeds to be improved to include the spatial effects.
However, this vessel-size affect does not explain thehigh-velocity values of the large vessels in the upperright corner of Fig. 8, because if air moved quickly fromsmall vessels to large vessels the v of the small vesselswould increase at the expense of a decrease in v of largevessels. The current model is one-dimensional, radial,and assumes cylindrical geometry and a near steadystate, whereas a better model would be a two-dimen-sional finite element model assuming a non-steady state.However, it is unclear if a more complex model wouldallow one to determine if the measured values of vexceed what would be expected for a purely physicalprocess involving Henry’s law, Fick’s law, surfacetension and the Hagen�Poiseuille law. Fortunately thereis a more powerful test that might address this question.
That test involves measuring how v increases inresponse to a known change in Pb (Fig. 8). At ambientpressure (upper plot) the bubble pressure is Pb:(2tcos(f))/r, but at 9.8 kPa above ambient pressure,Pb:Pa�(2tcos(f))/r (lower plot). Surface tension de-termines the value of (2tcos(f))/r, which is uncertainbecause the contact angle f is unknown, but it is likelyto be the same at both pressures. Also kD is the same inboth cases, hence the ratio of velocities, vratio, should begiven by:
vratio �Pa�2tcos(f)=r
2tcos(f)=r�
Pa
2tcos(f)=r�1]
Pa
2t=r�1 (3)
because (cos(f)51).Mean values of 2t/r were calculated for the inner ring
of vessels and for all vessels. At ambient pressure, themean value of 2t/r is 3.58 kPa for the inner ring ofvessels and 3.18 kPa for all rings, but for 9.8 kPa aboveambient pressure, Pa�9.8 kPa so the minimum ratio ofpressures is 3.73 for the inner ring and 4.1 for all thevessels. However, the mean ratio of velocities is 1.86 forthe inner ring of vessels and 1.36 for all the vessels.Hence the applied pressure enhances the refilling processless than expected from theory. This may mean that therate of refilling of the stem is more than might beexpected from purely physical processes when there is noexternal applied pressure. The nature of the additionalprocesses must await elucidation by future studies, butthe findings on excised stem segments are consistentwith previous studies on intact grape vines.
CONCLUSIONSHigh-resolution 1H MRI experiments were conducted toinvestigate the temporal and spatial patterns of waterrefilling of embolized xylem vessels in grapevine stems.Magnetic resonance imaging difference images indicatethat vessel position within the cross section of the stemmay influence the refilling process within the xylemalthough a clear correlation was not observed due to thefact that vessels are of varying sizes and are not regularlyarranged in the stems. An MRI method for determiningthe water ascent velocity in individual embolized xylem
888 CANADIAN JOURNAL OF PLANT SCIENCE
vessels was developed and used to obtain water ascentvelocity data at two different applied xylem pressures.A steady-state bubble model was developed to calculatethe water ascent velocity in embolized xylem vessels andcalculations based on this model show that vesseldiameter and position have significant influences onthe water ascent velocity. Our results tentatively pointtoward a process that speeds up the rate of bubblecollapse even in excised stem segments of grape plants,but the mechanism behind this speed up is not clearlyunderstood. The experimentally obtained water ascentvelocity data, together with the proposed steady-statebubble model, provide important information aboutwater refilling and are likely to lead to an improvedunderstanding of embolism repair. As well, we haveprovided an example demonstrating how NMR imagingat sub-millimeter resolution allows scientists to investi-gate water density and dynamics in plants. We hope thiswork will encourage these scientists to consider MRI asa useful imaging tool for studying these and otherphenomena in plants.
ACKNOWLEDGMENTSThe authors thank Dr. Guy Bernard and other membersof the solid-state NMR group at the University ofAlberta for helpful discussions and comments. MWthanks the University of Alberta for funding. REW is aCanada Research Chair in Physical Chemistry andwould like to thank the Natural Sciences and Engineer-ing Research Council, NSERC, of Canada for financialsupport. This research was made possible by researchgrants from an NSERC Discovery Grant held by MTTwho also wishes to thank the United States ForestService for salary support while working at the Uni-versity of Alberta. We also thank Dr. Uwe Hacke forbringing about our collaboration and for consultationand encouragement during all phases of research andwriting. Finally, we acknowledge the efforts of threeanonymous reviewers whose comments helped improvethis manuscript.
Araujo, C. D., MacKay, A. L., Whittall, K. P. and Hailey,J. R. T. 1993. A diffusion model for spin-spin relaxation ofcompartmentalized water in wood. J. Magn. Reson. B 101:248�261.Arbabi, A. and Mastikhin, I. V. 2012. Magnetic susceptibilitybased magnetic resonance estimation of micro-bubble sizefor the vertically upward bubbly flow. J. Magn. Reson. 225:36�45.Beyea, S. D., Balcom, B. J., Mastikhin, I. V., Bremner, T. W.,
Armstrong, R. L. and Grattan-Bellew, P. E. 2000. Imaging ofheterogeneous materials with a turbo spin echo single-pointimaging technique. J. Magn. Reson. 144: 255�265.Blumich, B. 2000. NMR imaging of materials. Oxford Uni-versity Press, New York, NY.Borghetti, M., Edwards, W. R. N., Grace, J., Jarvis, P. G. andRaschi, A. 1991. The refilling of embolized xylem in Pinussylvestris L. Plant Cell Environ. 14: 357�369.
Borisjuk, L., Rolletschek, H. and Neuberger, T. 2012. Surveyingthe plant’s world by magnetic resonance imaging. Plant J. 70:129�146.Brodersen, C. R., McElrone, A. J., Choat, B., Matthews, M. A.
and Shackel, A. 2010. The dynamics of embolism repair inXylem: in vivo visualizations using high-resolution computedtomography. Plant Physiol. 154: 1088�1095.Brodribb, T. J. 2009. Xylem hydraulic physiology: the func-tional backbone of terrestrial plant productivity. Plant Sci.177: 245�251.Callaghan, P. T. 1990. Susceptibility-limited resolution innuclear magnetic resonance microscopy. J. Magn. Reson. 87:304�318.Callaghan, P. T. 1991. Principles of nuclear magnetic reso-nance microscopy. Oxford University Press, New York, NY.Callaghan, P. T. 2011. Translational dynamics & magneticresonance. Principles of pulsed gradient spin echo NMR.Oxford University Press, Oxford, UK.Callaghan, P. T. and Xia, Y. 1991. Velocity and diffusionimaging in dynamic NMR microscopy. J. Magn. Reson. 91:326�352.Canny, M. J. 1998. Applications of the compensating pressuretheory of water transport. Am. J. Bot. 85: 897�909.Choat, B., Drayton, W. M., Brodersen, C., Matthews, M. A.,
Shackel, K. A., Wada, H. and McElrone, A. J. 2010.
Measurement of vulnerability to water stress-induced cavita-tion in grapevine: a comparison of four techniques applied to along-vesseled species. Plant Cell Environ. 33: 1502�1512.Cirelli, D., Jagels, R. and Tyree, M. T. 2008. Toward animproved model of maple sap exudation: the location and roleof osmotic barriers in sugar maple, butternut and white birch.Tree Physiol. 28: 1145�1155.Clearwater, M. J. and Clark, C. J. 2003. In vivo magneticresonance imaging of xylem vessel contents in woody lianas.Plant Cell Environ. 26: 1205�1214.Clearwater, M. J. and Goldstein, G. 2005. Embolism repair andlong distance water transport. Pages 375-399 in N. M.Holbrook and M. A. Zwieniecki, eds. Vascular transport inplants. Elsevier Academic Press, London, UK.De Deene, Y. and Baldock, C. 2002. Optimization of multiplespin�echo sequences for 3D polymer gel dosimetry. Phys. Med.Biol. 47: 3117�3141.Facette, M. R., McCully, M. E., Shane, M. W. and Canny
M. J. 2001. Measurements of the time to refill embolizedvessels. Plant Physiol. Biochem. 39: 59�66.Graumann, R., Oppelt, A. and Stetter, E. 1986. Multiple-spin-echo imaging with a 2D Fourier method. Magn. Reson. Med.3: 707�721.Gruwel, M. L. H., Latta, P., Sboto-Frankenstein, U. and
Gervai, P. 2013. Visualization of water transport pathways inplants using diffusion tensor imaging. Prog. Electromagn. Res.C 35: 73�82.Hacke, U. G. and Sperry, J. S. 2003. Limits to xylem refillingunder negative pressure in Laurus nobilis and Acer negundo.Plant Cell Environ. 26: 303�311.Holbrook, N. M. and Zwieniecki, M. A. 1999. Embolism repairand xylem tension: do we need a miracle? Plant Physiol. 120:7�10.Holbrook, N. M., Ahrens, E. T., Burns, M. J. and Zwieniecki,
M. A. 2001. In vivo observation of cavitation and embolismrepair using magnetic resonance imaging. Plant Physiol. 126:27�31.
WANG ET AL. * MRI OF WATER ASCENT IN GRAPEVINE STEMS 889

Homan, N. M., Windt, C. W., Vergeldt, F. J., Gerkema, E. and
Van As, H. 2007. 0.7 and 3 T MRI and sap flow in intact trees:xylem and phloem in action. Appl. Magn. Reson. 32: 157�170.Kimmich, R. 1997. NMR: Tomography, diffusometry, relaxo-metry. Springer-Verlag, Berlin, Germany.Kockenberger, W., Pope, J. M., Xia, Y., Jeffrey, K. R., Komor,
E. and Callaghan, P. T. 1997. A non-invasive measurement ofphloem and xylem water flow in castor bean seedlings bynuclear magnetic resonance microimaging. Planta 201: 53�63.Laschimke, R., Burger, M. and Vallen, H. 2006. Acousticemission analysis and experiments with physical model systemsreveal a peculiar nature of the xylem tension. J. Plant Physiol.163: 996�1007.Lee, S.-J. and Kim, Y. 2008. In vivo visualization of the water-refilling process in xylem vessels using X-ray micro-imaging.Ann. Bot. 101: 595�602.MacFall, J. S. and Johnson, G. A. 2012. Plants, seeds, roots,and soils as applications of magnetic resonance microscopy.Vol. 6, pages 3403�3409 in R. K. Harris and R. E. Wasylishen,eds. Encyclopedia of NMR. John Wiley & Sons, Chichester,UK.Markley, J. L., Horsley, W. J. and Klein, M. P. 1971. Spin-lattice relaxation measurements in slowly relaxing complexspectra. J. Chem. Phys. 55: 3604�3605.McCully, M. E., Huang, C. X. and Ling, L. E. C. 1998. Dailyembolism and refilling of xylem vessels in the roots of field-grown maize. New Phytol. 138: 327�342.McElrone, A. J., Brodersen, C. R., Alsina, M. M., Drayton,
W. M., Matthews, M. A., Shackel, K. A., Wada, H., Zufferey,
V. and Choat, B. 2012. Centrifuge technique consistentlyoverestimates vulnerability to water stress-induced cavitationin grapevines as confirmed with high-resolution computedtomography. New Phytol. 196: 661�665.Meiboom, S. and Gill, D. 1958. Modified spin-echo method formeasuring nuclear relaxation times. Rev. Sci. Instrum. 29:688�691.Melcher, P. J., Goldstein, G., Meinzer, F. C., Yount, D. E.,
Jones, T. J., Holbrook, N. M. and Huang, C. X. 2001. Waterrelations of coastal and estuarine Rhizophora mangle: xylempressure potential and dynamics of embolism formation andrepair. Oecologia 126: 182�192.Narasimhan, P. T. and Jacobs, R. E. 2005. Microscopy inmagnetic resonance imaging. Annu. Rep. NMR Spectrosc. 55:259�297.Pate, J. S. and Canny, M. J. 1999. Quantification of vesselembolisms by direct observation: a comparison of twomethods. New Phytol. 141: 33�44.Perez-Donoso, A. G., Greve, L. C., Walton, J. H., Shackel,
K. A. and Labavitch, J. M. 2007. Xylella fastidiosa infectionand ethylene exposure result in xylem and water movementdisruption in grapevine shoots. Plant Physiol. 143: 1024�1036.Pope, J. M. and Yao, S. 1993. Quantitative NMR imaging offlow. Conc. Magn. Reson. 5: 281�302.Raven, J. A. 1977. The evolution of vascular land plants inrelation to supracellular transport processes. Adv. Bot. Res. 5:153�219.Rokitta, M., Zimmermann, U. and Haase, A. 1999. Fast NMRflow measurements in plants using FLASH Imaging. J. Magn.Reson. 137: 29�32.
Roscher, A., Emsley, L. and Roby, C. 1996. The effect ofimperfect saturation in saturation-recovery T1 measurements.J. Magn. Reson. A 118: 108�112.Salleo, S., Lo Gullo, M. A., de Paoli, D. and Zippo, M. 1996.
Xylem recovery from cavitation-induced embolism in youngplants of Laurus nobilis: a possible mechanism. New Phytol.132: 47�56.Salleo, S., Trifilo, P., Esposito, S., Nardini, A. and Lo Gullo,
M. A. 2009. Starch-to-sugar conversion in wood parenchymaof field-growing Laurus nobilis plants: a component of thesignal pathway for embolism repair? Funct. Plant Biol. 36:815�825.Scheenen, T. W. J., Vergeldt, F. J., Heemskerk, A. M. and
Van As, H. 2007. Intact plant magnetic resonance imaging tostudy dynamics in long-distance sap flow and flow-conductingsurface area. Plant Physiol. 144: 1157�1165.Sun, Q., Rost, T. L. and Matthews, M. A. 2008. Wound-induced vascular occlusions in Vitis vinifera (Vitaceae):tyloses in summer and gels in winter. Am. J. Bot. 95:1498�1505.Telkki, V.-V. 2012. Wood characterization by NMR and MRIof fluids. Vol 9, pages 5413�5420 in R. K. Harris and R. E.Wasylishen, eds. Encyclopedia of NMR. John Wiley & Sons,Chichester, UK.Tyree, M. T. and Sperry, J. S. 1989. Vulnerability of xylem tocavitation and embolism. Annu. Rev. Plant Physiol. Mol. Biol.40: 19�38.Tyree, M. T. and Yang, S. 1992. Hydraulic conductivityrecovery versus water pressure in xylem of Acer saccharum.Plant Physiol. 100: 669�676.Tyree, M. T. and Zimmermann, M. H. 2002. Xylem struc-ture and the ascent of sap. 2nd ed. Springer, Heidelberg,Germany.Tyree, M. T., Salleo, S., Nardini, A., Lo Gullo, M. A. and
Mosca, R. 1999. Refilling of embolized vessels in youngstems of laurel. Do we need a new paradigm? Plant Physiol.120: 11�21.Van As, H., Scheenen, T. and Vergeldt, F. J. 2009. MRI ofintact plants. Photosynth. Res. 102: 213�222.Windt, C. W., Vergeldt, F. J., Adrie de Jager, P. and Van As,
H. 2006. MRI of long-distance water transport: a comparisonof the phloem and xylem flow characteristics and dynamics inpoplar, castor bean, tomato and tobacco. Plant Cell Environ.29: 1715�1729.Yang, L.-J., Yao, T.-J. and Tai, Y.-C. 2004. The marchingvelocity of the capillary meniscus in a microchannel. J.Micromech. Microeng. 14: 220�225.Yang, S. and Tyree, M. T. 1992. A theoretical model ofhydraulic conductivity recovery from embolism with compar-ison to experimental data on Acer saccharum. Plant CellEnviron. 15: 633�643.Zwieniecki, M. A. and Holbrook, N. M. 1998. Diurnalvariation in xylem hydraulic conductivity in white ash(Fraxinus americana L.), red maple (Acer rubrum L.) andred spruce (Picea rubens Sarg.). Plant Cell Environ. 21:1173�1180.Zwieniecki, M. A. and Holbrook, N. M. 2000. Bordered pitstructure and vessel wall surface properties. Implications forembolism repair. Plant Physiol. 123: 1015�1020.
890 CANADIAN JOURNAL OF PLANT SCIENCE
Appendix
Start from the steady-state Fick’s Law:
Jn �kD(Cb �C0) (A1)
where Jn is the steady-state flux in mol s�1 per vessel, Cb is the concentration of air dissolved in the water at thebubble surface (mol m�3), and C0 is the concentration of air dissolved in water at the stem surface. kD is a diffusionconstant that can be defined (Eq. A2) in terms of steady-state diffusion from a cylindrical surface with a single vessel inthe center:
kD �2pDLb
ln(b=a)(A2)
where Lb is the length of the bubble in the vessel, a is the radial distance from the center of the stem to the ring ofvessels, b is the radial distance from the center of the stem to the stem surface, and D is the diffusion coefficient for airin the stem. For diffusion from a ring of vessels, kD can be defined as:
kD �2pDLb
ln(b=a)N(A3)
where N is the number of vessels in the ring that can be calculated from:
N �fpa
r(A4)
where r is the vessel radius and f is the fraction of the ring circumferance (2pa) that is occupied by the sum of vesselsdiameters (f�0.5) in this paper. By introducing Henry’s Law of gas solubility, Eq. A1 can be expressed in terms ofbubble pressure:
Jn �kD
H(Pb �Po) (A5)
where H is the gas solubility coefficient, Pb is the absolute pressure of the air in the bubble, and Po is the barometricpressure.
The ideal gas law states:
PbVb �nRT (A6)
Hence
dVb
dt�
dn
dt
RT
Pb
��Jn
RT
Pb
(A7)
The minus sign results from the fact that dn/dtB0 and Jn�0. If we define Jv��dVb/dt, we have:
Jv �Jn
RT
Pb
(A8)
Combining Eqs. A5 and A8:
Jv �RT
Pb
kD
H(Pb �Po) (A9)
We assume water flows only from the water bottle to the lower end of the stem segment because the upper end isplugged (Fig. 1a). As the volume of the bubble contracts an equal volume of water must flow through the vessel to thebubble surface hence we can express Jv also in terms of the Hagen-Poiseuille Law:
Jv �kh
L(Pa �P�) (A10)
WANG ET AL. * MRI OF WATER ASCENT IN GRAPEVINE STEMS 891
where kh is the hydraulic conductivity of the vessel, P* is the absolute pressure of the fluid at the air/water interface ofthe bubble, Pa is the pressure of the fluid at the base of the stem and L is the path length from the base of the stem tothe lower bubble surface.
kh �pr4
8h(A11)
where h is the viscosity of water. The bubble pressure (Pb) is more than the adjacent fluid pressure because of the actionof the surface tension of water (t) confined to a vessel of radius�r with a contact angle between the liquid and thevessel wall of f degrees; hence
P� �Pb �2tcos(f)
r(A12)
Thus, from Eqs. A10 and A12:
Jv �kh
L(Pa �Pb �
2tcos(f)
r) (A13)
Solving for Pb:
Pb �Pa �2tcos(f)
r�Jv
L
kh
(A14)
Inserting Eq. A14 into Eq. A9 and rearranging, we obtain a quadratic equation for Jv that expresses how Jv is limitedby both kD and kh.
L
kh
J2v �
�RTkD
H
L
kh
�Pa �2tcos(f)
r
�Jv �
RTkD
H
�Pa �Po �
2tcos(f)
r
��0 (A15)
The quadratic Eq. A15 can be solved analytically to obtain Jv, which is directly correlated to the water ascentvelocity by:
Jn�pr2n (A16)
where n denotes the water ascent velocity in embolized xylem vessels.
n�Jn
pr2(A17)
The quadratic solution may be approximated by Eq. A18 because the third term in Eq. A14 is much smaller than thefirst two; JvL/Kh�the pressure drop induced by laminar flow of fluid from the base of the stem segment to the lowerbubble surface from Eq. A10. The maximum flow velocity observed in our study is 0.7 mm min�1�1.2�10�5 m s�1.The largest pressure drop would occur in the smallest vessels (25 mm) so Jv�2.29�10�14 m3 s�1 (Eq. A16) and thecomputed pressure drop is 3 Pa (Eq. A10). This is 3 orders of magnitude less than the rise in pressure from surfacetension (5760 Pa�2t/r) with cos(f)�1 in Eq. (A10). For vessels with r�50 mm, the pressure drop is almost 4 orders
of magnitude. Hence a very close approximation of the solution results by substituting Pb$Pa �2tcos(f)
rinto Eq. A9
to yield
Jv$RT
Pa �2tcos(f)
r
kD
H(Pa �
2tcos(f)
r�Po) (A18)
The water ascent velocity in the embolized xylem vessels of grapevine stems refilled at 9.8 kPa and ambient pressurewas calculated from Eq. A17, as shown in Fig. 8. Values for Jn from Eq. A18 and hence of n from Eq. A17 can only becalculated for specific values of the contact angle f, which are not know experimentally. Plots shown in Fig. 8 are thoseobtained for f�0. Values of the constants and parameters are shown in Table A1.
892 CANADIAN JOURNAL OF PLANT SCIENCE

Table A1. Definition and values of constants used for the calculation of water ascent velocityz
Constant definition Parameter
Da Air diffusivity in water (258C) 9.42�10�10 m2 s�1
R Gas constant 8.314 m3 Pa mol�1 K�1
t Surface tension of water (258C) 7.2�10�2 N m�1
H air solubility in water (258C) 1.31�105 m3 Pa mol�1
h Viscosity of water 1.002�10�3 Pa s
zFor model calculations the number of vessels in a ring (Eq. 4) was calculated using a value of f�0.5 because vessels occupy about 1/2 of thecircumference 2pa in Fig. 2a.
WANG ET AL. * MRI OF WATER ASCENT IN GRAPEVINE STEMS 893