magnetic and catalytic properties of transition metal
TRANSCRIPT

University of Texas at El PasoDigitalCommons@UTEP
Open Access Theses & Dissertations
2018-01-01
Magnetic And Catalytic Properties Of TransitionMetal Doped MOS2 NanocrystalsLuis MartinezUniversity of Texas at El Paso, [email protected]
Follow this and additional works at: https://digitalcommons.utep.edu/open_etdPart of the Materials Science and Engineering Commons, Mechanics of Materials Commons,
Nanoscience and Nanotechnology Commons, and the Physics Commons
This is brought to you for free and open access by DigitalCommons@UTEP. It has been accepted for inclusion in Open Access Theses & Dissertationsby an authorized administrator of DigitalCommons@UTEP. For more information, please contact [email protected].
Recommended CitationMartinez, Luis, "Magnetic And Catalytic Properties Of Transition Metal Doped MOS2 Nanocrystals" (2018). Open Access Theses &Dissertations. 1483.https://digitalcommons.utep.edu/open_etd/1483

MAGNETIC AND CATALYTIC PROPERTIES OF TRANSITION METAL DOPED MoS2
NANOCRYSTALS
LUIS MIGUEL MARTINEZ MILIAN
Master’s Program in Physics
APPROVED:
Srinivasa Rao Singamaneni, Ph.D., Chair
Russell Chianelli, Ph.D.
Harikrishnan Nair, Ph.D.
Charles H. Ambler, Ph.D.
Dean of the Graduate School

MAGNETIC AND CATALYTIC PROPERTIES of TRANSITION METAL DOPED MoS2
NANOCRYSTALS
by
LUIS MIGUEL MARTINEZ MILIAN, B.S.
THESIS
Presented to the faculty of the Graduate School of
The University of Texas at El Paso
in Partial Fulfillment
of the Requirements
for the Degree of
MASTER OF SCIENCE
Department of Physics
THE UNIVERSITY OF TEXAS AT EL PASO
May 2018

iii
Acknowledgements
L. M. M. acknowledges Dr. H. Nair and Dr. R. Chianelli for kindly agreeing to be a part of this
Thesis committee. L. M. M. acknowledges support from UTEP start-up grant. L. M. M. also
acknowledges the Wiemer Family for awarding Student Endowment for Excellence and also the
NSF-PREM program. L. M. M. acknowledges that part of the magnetic work performed at Ames
Laboratory by I. C. Nlebedim and K. Gandha. L. M. M. acknowledges the collaboration and TEM
work performed by D. Chinnathambi at Boise State University. L. M. M. acknowledges the
collaboration performed by D. Villagran and Y. Wu for the electrocatalytic measurements. L. M.
M. acknowledges R. R. Chianelli for helpful discussion and for laboratory access and use of
equipment. L. M. M. would like to thank S. Hennadige for help in taking EPR spectroscopy
measurements. L. M. M. would like to thank J. Delgado for help with the electrocatalytic
measurements and synthesis of materials. L. M. M. thanks A. Cosio for help in the analysis of the
magnetic measurements and synthesis of materials. L. M. M. thanks C. Saiz for help in preparation
of the FeMoS2 NCs samples. Finally, L. M. M. would like to thank Dr. S. R. Singamaneni for the
mentorship and all his help throughout my M.S. in Physics.

iv
Abstract
Magnetism and catalytic activity of nanoscale layered two-dimensional (2D) transition
metal dichalcogenides (TMDs) have gained an increasing research interest in the recent past. To
broaden the current knowledge and understanding on this subject, in this work, together with my
collaborators, I study the magnetic and electrocatalytic properties of hydrothermally grown
pristine and transition metal doped (10% of Co, Ni, Fe and Mn) 2H-MoS2 nanosheets/nanocrystals
(NCs), with the particle size of 25-30 nm. A broad range of experimental measurements such as
x-ray diffraction, transmission electron microscopy, x-ray photo absorption spectroscopy, Raman
spectroscopy, magnetic, catalytic and electron spin resonance have been employed to characterize
these materials. It has been shown that the room temperature magnetic properties of these
nanostructures strongly depend on the nature of dopant, in which, Co, Ni, and Fe doping produces
characteristic room temperature ferromagnetism, whereas, Mn doping exhibits stronger
paramagnetic features. All the materials showed features related to canted antiferromagnetism at
lower temperatures. Among all, Co doped MoS2 NCs showed stronger catalytic activity and Mn
doped MoS2 NCs showed weaker catalytic activity. These experimental findings combined with
electron spin resonance measurements infer that the increasing number of catalytically active sites
in Co doped MoS2 NCs might be responsible for its superior electrocatalytic activity. The present
results show that the magnetic order-disorder behavior and catalytic activity can be modulated by
choosing the suitable dopants in NCs of 2D materials.

v
Table of Contents
Acknowledgements……………………………………………………………………………...iii
Abstract………………………………………………………………………………………….iv
Table of Contents………………………………………………………………………………..v
List of Tables……………………………………………………………………………………vii
List of Figures…………………………………………………………………………………...viii
Chapter 1: Introduction and Motivation…...…………………………………………………….1
Chapter 2: Materials and Methods...……………………………………………………………..5
Chapter 3: Structural and Morphological Characterizations
3.1 XRD………………………………………………………………………………….8
3.2 TEM………………………………………………………………………………….9
3.3 Raman……………………………………………………………………………….11
3.4 XPS………………………………………………………………………………….12
Chapter 4: Magnetic Characterizations
4.1 MoS2 NCs…………………………………………………………………………...16
4.2 CoMoS2 NCs………………………………………………………………………..20
4.3 NiMoS2 NCs………………………………………………………………………...21
4.4 FeMoS2 NCs………………………………………………………………………...23
vi
4.5 MnMoS2 NCs……………………………………………………………………….24
Chapter 5: Electrocatalytic Characterizations..…………………………………………………26
Chapter 6: EPR Characterizations
6.1 MoS2 NCs EPR……………………………………………………………………...29
6.2 MoS2 NCs Annealed with Argon EPR spectra……………………………………...33
6.3 TM doped MoS2 NCs………………………………………………………………..35
Conclusion……………………………………………………………………………………….37
Future Directions………………………………………………………………………………...38
References……...………………………………………………………………………………..39
Curriculum Vita……...………………………………………………………………………….50

vii
List of Tables
Table I: CW model values……………………………………………………………………….16
Table II: g-values for Figure 15………………………………………………………………….32
Table III: Linewidths for Figure 15……………………………………………………………...32

viii
List of Figures
Figure 3.1: XRD pattern for MoS2 and doped counterparts……………………………………..8
Figure 3.2: TEM images of MoS2………………………………………………………………..9
Figure 3.3: TEM image of undoped MoS2 showing few layers…………………………………10
Figure 3.4: TEM images of Co and Ni doped MoS2…………………………………………….10
Figure 3.5: Raman spectrum of MoS2, Co and Ni doped MoS2………………………………....11
Figure 3.6: XPS spectra of C1s, S 2p, Mo 3d and Mo 3p………………………………………..12
Figure 3.7: XPS spectrum of O 1s………………………………………………………………..13
Figure 3.8: XPS spectra of Mo 3d, S 2p, Ni 2p and Co 3s………………………………………15
Figure 4.9: Magnetic characterization data for MoS2…………………………………………....17
Figure 4.10: M vs H of MoS2 with modified Brillouin fit……………………………………….18
Figure 4.11: Temperature variation of the coercive field of MoS2……………………………....19
Figure 4.12: Magnetic characterization data for CoMoS2………………………………………..20
Figure 4.13: Magnetic characterization data for NiMoS2………………………………………...22
Figure 4.14: Magnetic characterization data for FeMoS2………………………………………..23
Figure 4.15: Magnetic characterization data for MnMoS2……………………………………....25
Figure 5.16: Polarization curves and Tafel plots of MoS2 and doped counterparts……………..26
Figure 5.17: EIS plots for MoS2 and doped counterparts………………………………………..27

ix
Figure 5.18: Stability test for CoMoS2…………………………………………………………..28
Figure 6.19: Low temperature EPR spectrum of MoS2 NCs…………………………………....30
Figure 6.20: Temperature variation in EPR spectra of MoS2 NCs……………………………...31
Figure 6.21: Argon annealed EPR spectra of MoS2 NCs……………………………………….33
Figure 6.22: Room temperature EPR spectra of MoS2 NCs and doped counterparts…………...36

1
Chapter 1: Introduction and Motivation
In recent years, an increasing number of scientific studies have been reported for nanoscale
two-dimensional (2D) layered transition metal dichalcogenides (TMDs) [1-3]. Interestingly,
nanoscale TMDs exhibit new properties and applications upon 2D confinement and have been
widely researched for applications such as photodetectors, transistors, catalysts and spintronics [4-
9]. Out of all, layered molybdenum disulfide (MoS2), held together by the van der Waals forces is
of particular interest. One of the properties of this material is its ability to tune its direct band gap
of 1.2 eV (bulk) to an indirect band gap of 1.8 eV (monolayer), due to quantum confinement and
interlayer interaction [4, 10]. In addition, bulk crystals of MoS2 and WS2 have been rigorously
studied as catalysts for the hydrodesulfurization (HDS) process in the petroleum industry. In
particular, MoS2 is one of the most widely used industrial catalysts for HDS, and is known to be a
hydrogen evolution reaction (HER) catalyst [11]. In terms of the Gibbs free energy for hydrogen
absorption from the Sabatier principle, MoS2 can be as good a catalyst as Pt. If the appropriate
synthetic modifications are met, MoS2 could emerge as a competitive candidate for the HER [12].
The question that then begs to be asked is, where does the catalytic activity come from?
There has been an increase in attention towards realizing 2D dilute magnetic
semiconductors (DMS) for spintronic applications. Theoretical predictions show that magnetism
in TMD nanostructures can be realized through doping with various transition metals. Bulk MoS2
is a semiconductor known to be diamagnetic in nature, but the material can display ferromagnetism
when it is prepared in the form of nanostructures. The ferromagnetism found in MoS2
nanostructures may be due to magnetic moments coming from zigzag edges and sulfur vacancies
[16, 17]. Induced magnetism in MoS2 has also been shown to be achieved by structural phase
transition, via Li intercalation [18]. Theoretical calculations performed by Wang and co-authors

2
predicted the effect of TM doping on the TMDs’ magnetic properties. Their work showed how the
activity of this cheap, earth-abundant catalyst can be further improved by incorporating TMs,
modifying the activity of the S-edge [13]. Other theoretical groups have also shown [19] that
doping TMs into MoS2 can lead to enhanced magnetic properties. While realizing theoretical
predictions, few experimental observations have appeared [16, 21] in the literature reporting on
magnetic properties of hydrothermally grown TM doped MoS2 nanostructures. While there are
reports on experimental studies on the magnetic properties of TMD nanocrystals (NCs), these
studies are limited and at the nascent stage. To broaden the current knowledge and understanding
of the doping induced magnetic properties in TMD NCs, an extensive experimental study is
required, which is one of the goals of the current Thesis.
Theoretical [13] and experimental [10, 14] studies have shown that the edges and S-
vacancies in MoS2 nanolayers make significant contributions to the electrocatalytic properties,
while the basal planes remain inert. Xu et al was able to demonstrate a simple strategy to acquire
monolayer MoS2 with S vacancies, and enhanced the electrocatalytic performance [10]. The
catalytic activity can also be improved by doping transition metals into MoS2, as shown by DFT
calculations [13]. Defect engineering then has become one method of advancing MoS2’s catalytic
activity for the HER. A study performed by X. Dai et al, where doping Fe, Ni, and Co into MoS2
and coating the material with carbon, found incredible catalytic enhancements (with a current
density of 60.9 mA/cm2 at η = 200 and a Tafel slope of 50 mV/dec) [15]. This was argued to be
due to the formation of CoMoS phase (for the case of Co), which provided synergistic regulations
between the existence of abundant defects, a balance of active sites and electronic conductivity.
These are some of the reports published to further improve MoS2’s catalytic properties. The second

3
goal of this work is to study the electrocatalytic properties of MoS2 NCs and the doped (Co, Ni,
Fe and Mn) counterparts.
Various methods have been employed to synthesize 2D TMD NCs for the study of their
magnetic and catalytic properties. One of the greatest challenges is producing MoS2 with a rich
number of active sites in an efficient and commercially viable way. To achieve monolayers or few
layer TMDs, some routes have been developed, including chemical vapor deposition (CVD) [20],
chemical exfoliation [18], and micro-mechanical cleavage [21]. The CVD method requires harsh
growth conditions, such as high temperatures and high vacuum, which makes this route
commercially unviable. The micro-mechanical cleavage method is limited by the low yield of
monolayers produced and contain increasing number of unwanted foreign impurities. Lastly,
chemical exfoliation requires various lengthy steps (24 hrs. or more) and is extremely sensitive to
the environment [22]. On the other hand, a bottom-up approach such as the hydrothermal method
is convenient and a low cost route for large-scale synthesis of TMD based NCs and their
composites [14]. It is a very simple, efficient, and inexpensive technique used to produce MoS2
nanostructures. For example, Ahmed et al used the hydrothermal method to produce MoS2
nanosheets and doped the material with (2.5 and 5%) vanadium. Doing this, Ahmed and co-authors
were able to induce enhanced magnetism on the MoS2 nanosheets [4]. Similarly, Xu et al was able
to develop a simple and effective strategy, using the hydrothermal method, to acquire monolayer
MoS2 with S vacancies [14]. Xu was able to enhance the electrocatalytic activity of MoS2, enabling
the inert basal plane, by introducing localized donor states.
In this study, hydrothermally grown MoS2 NCs were synthesized and doped (10%) with
transition metal ions (Co, Ni, Fe, and Mn). This work identifies the paramagnetic point defects
present in hexagonal MoS2 NCs (2H phase) and the effect of doping on the magnetic properties

4
using the electron paramagnetic resonance (EPR) spectroscopy and magnetic measurements.
Additionally, the study of the catalytic activity of this material is performed for the HER.

5
Chapter 2: Materials and Methods
MoS2 NCs were synthesized using a common, facile, bottom-up hydrothermal method [23,
24]. All the precursors are used here as purchased from Alfa Aeser without further purification. In
a typical synthesis, 0.4 g of Na2MoO4-2H20 was dissolved in 30 mL of deionized (DI) water under
sonication for 20 min. At this step the desired metal precursor is added. Then 0.38 g of dibenzyl
disulfide was added to the solution along with 30 mL of ethanol and sonicated again for 30 min.
The solution was then transferred into a 100 mL teflon-lined stainless steel autoclave and was
maintained at 250o C for 18 hrs. The reaction system was then allowed to cool down to room
temperature naturally. The mother liquor was discarded and the collected products were
centrifuged for 1 hour and later washed with DI water. Then the stoichiometric MoS2 NCs were
filtered and left to dry in vacuum over night at room temperature. Using this approach, 10% Co,
Ni, Fe and Mn doped MoS2 NCs have been prepared.
For XRD characterizations, an automated Bruker D8 Advance X-ray diffractometer, in the
θ-2θ configuration with the Cu kα X-ray radiation was employed. The mean crystallite size was
estimated using the Scherrer equation. TEM specimens were prepared by dispersing the powders
on holey carbon grids. TEM studies were carried out using a JEOL JEM 2100 HR operated at
200kV. TEM studies were conducted in collaboration with Dr. Karthik Chinnathambi at Boise
State University. Raman measurements were performed using a SmartRaman spectrometer from
Thermo Scientific with an excitation wavelength of 532 nm. XPS measurements were collected
on a Physical Electronics Versa probe using micro-focused monochromatic A1 Kα X-Ray (1486.7
eV) source with a pass energy of 23.5 eV at a 45o take-off angle. The X-ray source spot size was
about 100 µm and the spectral resolution was 0.2 eV. Spectra from the MoS2 samples were charge
corrected by shifting the recorded scans to adventitious carbon (C1s) peak at 284.4 eV. XPS data

6
were collected by Dr. Madhu Kongara at Boise State University. The magnetization measurements
were performed using a Quantum Design PPMS (5-300 K, ±5T). During the magnetic
measurements, all the samples are carefully handled with nonmagnetic capsules and tapes to avoid
contamination. Most of the magnetic measurements were conducted in our group at UTEP. In
addition, we collaborated with Dr. Ikenna’s group at Ames Research Laboratory for conducting
part of the magnetic measurements.
Catalytic properties were studied in collaboration with Dr. Villagran’s group at UTEP
Chemistry. All catalysts were accessed heterogeneously for hydrogen production. Prior to
electrochemical studies, the catalysts were deposited on a conductive fluorinated-tin oxide (FTO)
substrate, with a conductive adhesive silver paste to better support the catalyst. FTO glass was
cleaned by sonication in acetone, isopropyl alcohol, and DI water, separately. The silver paste was
then coated on top of the active side of the FTO with an area of 0.25 cm2 (0.5 cm x 0.5 cm). 0.5
mg of the catalyst was dispersed in 1mL of ethanol and sonicated for 30 min. to form a
homogenous ink. Then, 10 µL of the catalyst ink was drop cast on the silver paste and the plate
was allowed to dry in ambience and was later used as the working electrode for the electrochemical
measurements. All electrochemical studies were performed on a CHI760D potentiostat with a
three-electrode electrochemical cell in room temperature. A platinum wire was utilized as the
counter electrode while a saturated calomel electrode (SCE) was used as the reference electrode.
All potentials displayed in this Thesis were referred to as reversible hydrogen electrode (RHE) by
adding a value of (0.245 + 0.059 pH) to the data obtained using a SCE reference electrode. An
aqueous solution of 0.5 M H2SO4 was used as both the proton source and electrolyte. The solution
was saturated with nitrogen gas to remove the dissolved oxygen prior to each measurement.

7
Electrical impedance spectroscopy (EIS) was obtained at different overpotentials from 100 KHz
to 0.1 Hz with AC voltage of 5 mV.
The nature of the occurring paramagnetic structural point defects was assessed by low
temperature (7-40 K) and room temperature (300 K) EPR spectroscopy. EPR data was recorded
on a Bruker EMX Plus X-band (~ 9.43 GHz) EPR Spectrometer, equipped with a high sensitivity
probe head. A ColdEdge™ ER 4112HV In-cavity Cryo-Free VT system connected with an Oxford
temperature controller was used for low temperature measurements at 7 K. The Complete system
was operated by Bruker Xenon software.
8
Chapter 3: Structural and Morphological Characterizations
Section 1 – XRD
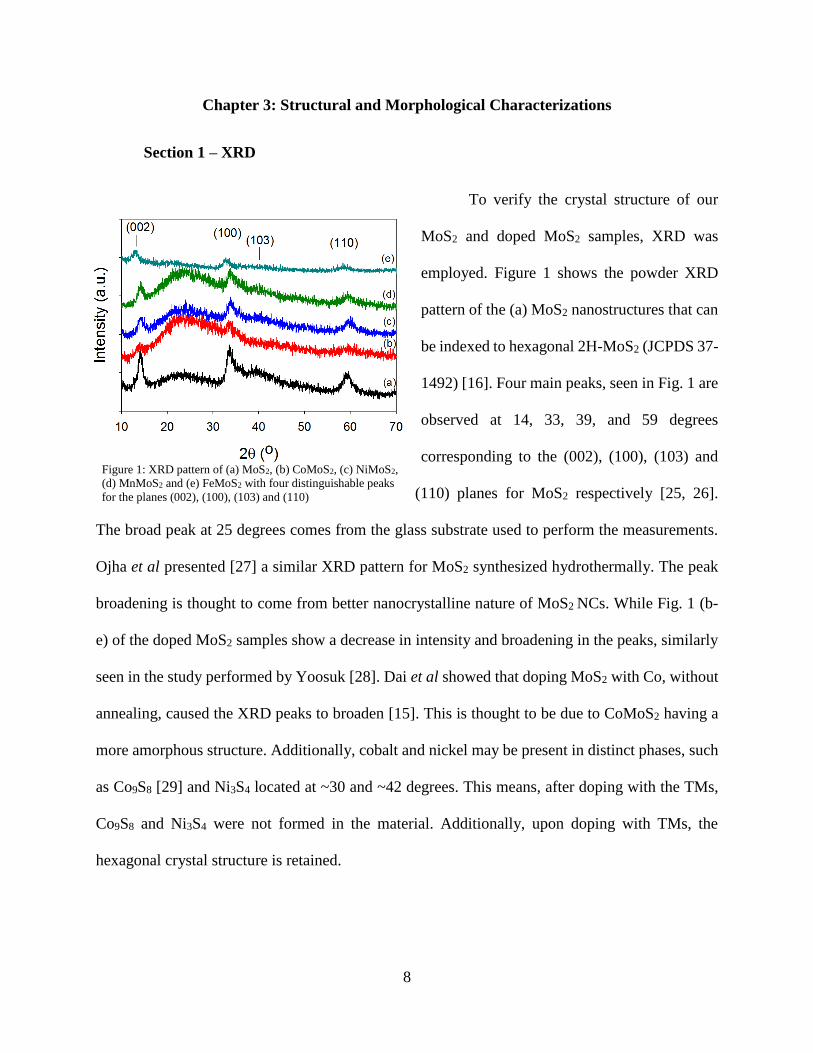
To verify the crystal structure of our
MoS2 and doped MoS2 samples, XRD was
employed. Figure 1 shows the powder XRD
pattern of the (a) MoS2 nanostructures that can
be indexed to hexagonal 2H-MoS2 (JCPDS 37-
1492) [16]. Four main peaks, seen in Fig. 1 are
observed at 14, 33, 39, and 59 degrees
corresponding to the (002), (100), (103) and
(110) planes for MoS2 respectively [25, 26].
The broad peak at 25 degrees comes from the glass substrate used to perform the measurements.
Ojha et al presented [27] a similar XRD pattern for MoS2 synthesized hydrothermally. The peak
broadening is thought to come from better nanocrystalline nature of MoS2 NCs. While Fig. 1 (b-
e) of the doped MoS2 samples show a decrease in intensity and broadening in the peaks, similarly
seen in the study performed by Yoosuk [28]. Dai et al showed that doping MoS2 with Co, without
annealing, caused the XRD peaks to broaden [15]. This is thought to be due to CoMoS2 having a
more amorphous structure. Additionally, cobalt and nickel may be present in distinct phases, such
as Co9S8 [29] and Ni3S4 located at ~30 and ~42 degrees. This means, after doping with the TMs,
Co9S8 and Ni3S4 were not formed in the material. Additionally, upon doping with TMs, the
hexagonal crystal structure is retained.
Figure 1: XRD pattern of (a) MoS2, (b) CoMoS2, (c) NiMoS2,
(d) MnMoS2 and (e) FeMoS2 with four distinguishable peaks
for the planes (002), (100), (103) and (110)

9
The Scherrer formula, 𝐷ℎ𝑘𝑙 =𝑘𝜆
𝛽ℎ𝑘𝑙𝑐𝑜𝑠𝜃 , was used used to estimate the crystalline
size of the MoS2 nanostructures. Here, k is a coefficient (k = 0.9), βhkl is the full-width-at-half
maximum of the (002) peak, and λ is the wavelength (λ = 1.5405 Å). The calculated crystalline
size from XRD line broadening is of 10 nm.
Section 2 – TEM
Morphological studies were conducted using TEM. Figure 2 (a, b) shows the low
magnification bright field and the high resolution lattice images, respectively. The selected area
diffraction pattern (SAED) is shown as inset to the bright field image. As seen in Fig. 2(b), the
MoS2 nanocrystallites (of size, 25-30 nm) show the hexagonal structures made up of a few layers
of MoS2 basal planes. The apparent difference in the sizes estimated from Scherrer equation and
TEM images might be because the Scherrer equation is an estimate of the crystallite size whereas
the TEM image is a better approximation of the grain size. The SAED pattern shown as inset to
Fig. 2(a) containing rings with uniform intensity all around confirm the nanocrystalline nature of
the material. The interlayer spacing measured from the lattice images is 6.45 Å, consistent with
the previous reports [30-35] (6.3 Å) of monolayer MoS2 grown by the CVD methods and it
Figure 2: (a) Bright field transmission electron microscopic (TEM) image of MoS2 nanocrystallites. The inset shows the SAED
patterns confirming the nanocrystalline nature of the material. (b) High resolution electron microscope (HREM) image of MoS2
nanocrystallites. The spacing between the layers along the (002) plane is about 0.645 nm.

10
corresponds to the (002) planes of MoS2. Additional measurements must be performed to estimate
the spacing between the other planes, ex; (100), (001) and the (103) planes.
Additional TEM studies have shown the indication of doping Co and Ni into MoS2 NCs.
In the case of MoS2 NCs, as shown in Fig. 3, only a few layers of MoS2 are seen, whereas the Co
and Ni doped MoS2 NCs, seen in Fig. 4(a, b), show many thicker crystals with increased number
of layers. Another observation that was noticed is that the undoped MoS2 NCs show lattice fringes
that are continuous without much break, but the doped samples show lots of breaks, bends and
buckling. A similar observation has been reported previously by Xiang et al [36]. This indicates
an increase in lattice defects/strain with doping.
Figure 3: TEM image of MoS2 NCs showing how the crystallite size is thin,
containing few layers

11
Figure 4: TEM images of (a) CoMoS2 10% NCs and (b) NiMoS2 10% NCs. Both show an increase in number of layers with bands,
breaks and buckles.
Section 3 – RAMAN
Raman spectroscopy was used to
confirm the few layered MoS2, CoMoS2 and
NiMoS2 NCs. Raman spectra measured on all
of our samples showed two distinct
characteristic peaks (as seen in Fig. 5) at 384
and 408 cm-1, which are associated with the
in-plane (E12g) and out-of-plane (A1g)
vibrational modes of Mo-S bonds in 2H-
MoS2, respectively [27]. For the CoMoS2 and
NiMoS2 Raman spectra, the frequency of the two vibrational modes decreases (376 and 403 cm-1,
respectively). The Raman peaks, for the pristine and doped samples, are in agreement with that of
MoS2 bulk crystals.
Figure 5: Raman spectra collected from MoS2 bulk, MoS2 NCs,
CoMoS2 and NiMoS2. A slight blue shift was noticed for the
MoS2 NCs and for the doped samples.

12
Section 4 – XPS
XPS survey spectra of
MoS2 NCs indicate the presence
of peaks with binding energies
(BE) consistent with
molybdenum and sulfur
elements besides a lower
intensity oxygen and carbon.
Absence of other elements
demonstrates the purity of the
sample. To further probe the
chemical composition and
surface chemistry, high-
resolution core-level XPS
spectra were collected on the
selected BE intervals. The BE positions were referenced and adjusted to adventitious carbon
because of the charging effects on the sample. Shirley method background signal was subtracted
and BE peaks were curve-fitted (deconvolution) using Gaussian/Lorentzian functions. Multiple
binding energies associated with C 1s spectra are observed at 284.4 eV, 286.3 eV and 287.9 eV,
as seen in Fig. 6, which are assigned to adventitious carbon and C-O impurities from hydrothermal
process. O 1s spectral region peak at 532.6 eV resulting from C-O bonding while the lower BE
peak 530.8 eV is ascribed to Mo-O bonding, seen in Fig. 7. The deconvoluted Mo 3d region had
multiple peaks at 228.9 (Mo 3d5/2), 229.9 (Mo 3d5/2), 232.48(Mo 3d5/2) and its corresponding spin-
Figure 6: Core-level of Mo 3d, C 1s, Mo 3p and S 2p regions from MoS2 nanocrystals.
Core-level spectra of Mo 3d region has a predominant spin-orbit doublet (Mo 3d5/2 and
Mo 3d3/2, Δ = 3.13 eV) along with corresponding S 2p region spin-orbit doublet (Δ =
1.18 eV). A secondary peak with a corresponding S 2p doublet on the higher binding
energy is associated with the MoS3 phase. A third Mo 3d peak at higher binding energy
with an associated O 1s peak (see Figure 7) corresponds to Mo (VI) O3.

13
orbit splitting doublet peaks appearing at
232.08 (Mo 3d3/2), 233.1 (Mo 3d3/2), 235.6
(Mo 3d3/2) respectively, along with S 2s peak
showing up at 226.3 eV. Spin-orbit split peak
separation is found to be around 3.16 eV,
which is consistent with the existing literature
[37 - 39]. The peaks, corresponding to the S
2p3/2 and S 2p1/2 orbital of divalent sulfide ions
(S2-), are observed at 161.8 and 162.98 eV with another set of deconvoluted peaks appearing at
163.6 eV and 164.8 eV with an estimated spin-orbit splitting of 1.18 eV. Multiple BE peaks
observed in this sample are apparently indicating different phases. The high intensity peak at 228.9
eV (Mo 3d5/2) resulting from Mo4+ oxidation state is ascribed to MoS2 phase [37]. Further, the BE
peak at 232.48 eV (Mo 3d5/2) relating to higher oxidation state of Mo6+, in conjunction with O 1s,
(530.8 eV) is attributed to a mostly stable MoO3 phase [39]. The XPS technique can also be used
to quantify the ratio of different phases within a given sample. Based on the deconvoluted Mo3d
peaks, it is estimated that there is about 65% MoS2 phase and the remaining is a combination of
MoS3 and MoO3. XPS spectra collected on MoS2 bulk crystals showed characteristic features,
without any residual phases.
To verify whether Co and Ni were doped into MoS2 NCs additional XPS measurements
were performed and studied in collaboration with Prof. Lopez’s group in UTEP Physics. The
presented results of the electronic ions structure are related to the binding energies found for
molybdenum (Mo42), sulfur (S16), nickel (Ni28) and cobalt (Co27). Figure 8(a, c and e) show the
XPS BE for (Mo) 3d-orbital from ~234 to 225 eV, respectively. The BEs were found at 230.1 and
Figure 7: Core-level of O 1s region corresponding to the high
binding energy peaks in Mo 3d in Figure 4.

14
226.9 eV for pure MoS2. The BE’s for the Mo 3d-orbital in NiMoS2 were found at 230.7 (Mo
3d3/2) and 227.5 eV (Mo 3d5/2). The Mo 3d orbital Binding energies for CoMoS2 were found at
229.9 (Mo 3d3/2) and 226.8 eV (Mo 3d5/2), where a clear horizontal shift can be seen for the
CoMoS2 Mo 3d orbital. The explanation is that Mo 3d5/2 orbital is linked to the S 2s orbital in
MoS2, which is linked to Ni in the form of Ni-(MoS2). For the cobalt case, the Mo 3d5/2 orbital is
linked to the S 2s which is also linked to cobalt (II) tetrathiomolybdate (III) in Co-Mo2S4. The Mo
3d3/2 orbital is linked to MoO3 in MoS2, which is also linked to Ni-Mo and Co-Mo, respectively
[40-48]. The absence of extra peaks within the Mo 3d spectra points to a relatively small amount
of MoO3 in all three samples. Fig. 8(b) shows the spectrum between 170 and 150 eV which
contains well-formed signals at 160.2, 160.8 and 160.2 eV. These are related to the S 2p orbital in
MoS2 (S/Mo), NiMoS2 (in the form NiS and S/Ni) and CoMoS2 (CoS), respectively [49-52, 49,
53]. Fig. 8(d) shows a well-defined peak at 852.6 eV with a FWHM of 3.3 eV corresponding to
the Ni 3p-orbital in NiMoS2 [54, 55]. The peak at this location is the best indicator of successful
nickel doping [56]. Fig. 8(f) shows the Co 3s orbital spectrum which contains two signals at 102.2
eV and 100.1 eV, and can be attributed to CoS2 and to the Co 3s orbital, respectively [57,58].

15
Figure 8: XPS signals of (a) MoS2, Mo 3d5/2 and Mo 3d3/2 regions, (b) S 2p region of MoS2, NiMoS2
and CoMoS2, (c) NiMoS2, Mo 3d5/2 and Mo 3d3/2 region, (d) Ni 2p region, (e) CoMoS2, Mo 3d5/2 and
Mo 3d3/2 region, and (f) Co 3s region.

16
Chapter 4: Magnetic Characterization
Section 1 – MoS2 NCs
To study the magnetic properties of MoS2 NCs, temperature- and magnetic field-dependent
magnetization measurements were performed [16 - 17]. In Fig. 9(a) the temperature dependent
magnetization can be observed. The magnetization was measured from 10 – 300 K, after a 0H =
1 T magnetic field cooling. As it can be noticed, the magnetization increased with cooling. A
similar observation was reported on many other materials [60 - 63] such as exfoliated WS2
nanosheets, graphene nanoribbons, Li intercalated MoS2 nanosheets, and amorphous MoS2.
To better understand the observed magnetic behavior, the 𝜒-T curve was fitted using the
modified Curie-Weiss (CW) model [61] 𝜒 = 𝜒𝐷𝑀 + 𝐶
(𝑇+ 𝜃), which involves the diamagnetic and
paramagnetic contributions. Here 𝜒𝐷𝑀 is the diamagnetic susceptibility, C = Curie constant, θ =
CW temperature, and T = measurement temperature. Here the paramagnetic component is used as
𝜒𝑃𝑀 = 𝐶
(𝑇+ 𝜃), where + θ indicates antiferromagnetism and – θ indicates ferromagnetism. The
fitting results (blue) are shown in Fig. 9 (a) along with the experimental data (black).
Table I: Values obtained from modified CW model
Sample C θ (K) χdm
Undoped MoS2 NCs 4.764e-04 3.406 -9.454e-07
Fe doped MoS2 NCs 4.257e-04 3.296 -3.732e-07
Ni doped MoS2 NCs 5.396e-04 3.173 -6.123e-07
Co doped MoS2 NCs 9.895e-04 2.935 1.883e-06
Mn doped MoS2 NCs 3.756e-03 2.841 -5.526e-06

17
Both the diamagnetic and paramagnetic components are resolved. In addition, the fitting results
are tabulated in Table I. The obtained value of θ was 3 K for the MoS2 NCs. As shown in Table I,
the value of θ is positive indicating
antiferromagnetic behavior, which,
however, is associated with
uncompensated spins that result in
finite magnetization. That is the
typical signature of canted
antiferromagnetic phase. Negative θ
values would indicate
ferromagnetism.
Now, our attention turns to the
magnetic field dependent
magnetization behavior. Isothermal
magnetization as a function of
magnetic field were measured
between 10 and 300 K. The data is plotted in Fig. 9(b-f). At 10 K, observations of a nearly
anhysteretic behavior with positive slope indicates canted antiferromagnetic phase. As temperature
increases further, a more magnetic hysteresis behavior was observed at low fields but the
anhysteretic behavior persists at higher fields. These features together with M-T variation (Fig.
9(a)) indicates that MoS2 NCs showed a canted antiferromagnetism at low temperature and
ferromagnetism at room temperature. Verifying with the modified Brillouin function [61] (see
below) could not account for the 100 K M-H behavior, as seen in Fig. 10.
Figure 9: The temperature dependent magnetic susceptibility and magnetic
field-dependent magnetic behavior of MoS2 NCs. Fig. 6(a) also includes
the applicability of modified Curie-Weiss model.

18
-3 -2 -1 0 1 2 3
-0.20
-0.15
-0.10
-0.05
0.00
0.05
0.10
0.15
0.20
MoS2 NCs
Mag
ne
tization
(e
mu/g
)
Magnetic Field (T)
M
Fit
T = 100 K
𝑀 = 𝑋𝑑𝐻 + 𝑀𝑠[2𝐽 + 1
2𝐽coth (
2𝐽 + 1
2𝐽𝑋) −
1
2𝐽coth (
𝑋
2𝐽)]
This function consists of a linearly field dependent function, which represents diamagnetism added
with the classic Brillouin function, which refers to paramagnetism. In the above equation, the
variable MS is the saturated magnetization 𝑀𝑠 = 𝑁𝑔𝜇𝐽, where N is the density of spins, μ is Bohr’s
magneton, g is the Lande g-factor, and J is the angular momentum number. The variable X is
equaled to X = 𝑔𝐽𝜇𝐻/𝑘𝑇, where k is Boltzmann’s constant, and T is temperature. By using the
modified Brillouin function, the fits were obtained for the accumulated data. However, the
numerical values of temperature in our fits did not correlate with what was seen in experimentation,
verifying that the modified function could not account for the magnetic-field dependent
magnetization data that was observed at 100 K. A strong hysteretic behavior was noticed at 300 K
rather than at 10 K. This observation is also reflected in the temperature dependent coercive field
(HC) trend plotted in Figure 11. It was noticed that the HC increased from 373 to 880 Oe as the
Figure 10: Magnetization vs Magnetic Field curve for pristine MoS2 NCs with the modified Brillouin fit.

19
temperature increased from 10 to 300 K. This infers that the ferromagnetism observed at room
temperature is of short-range.
To corroborate the
magnetic data, the temperature
dependent (50-300 K)
resistance measurements (data
not shown) were performed on
all the materials studied here,
including undoped MoS2 NCs.
The data showed
semiconducting behavior (resistance increases as the sample is cooled), consistent with the
literature reports [64], and revealed very little (<0.5%) magnetic field dependence even upon the
application of 3 T magnetic field. These observations are typical of canted antiferromagnetism. In
the sections below, the magnetic and catalytic properties of doped MoS2 NCs is discussed.
Section 2 – CoMoS2 NCs
The temperature dependent magnetic susceptibility (χ - T) data was collected after the
sample was cooled to 10 K in 0H = 1 T magnetic field (see Fig. 12(a)). The magnetization value
(0.8 emu/g) observed in the present study is higher than those (0.006 to 0.3 emu/g) reported [65,
62, 66, 67] in the literature on similar systems such as Co, Cu, and V doped (<7% doping) MoS2
nanostructures prepared through hydrothermal method.
Figure 11: The temperature variation of the coercive field of MoS2 NCs

20
As displayed in Fig. 12(a),
the modified CW model describes
well the temperature dependent
magnetic susceptibility behavior.
A positive θCW of 3 K (see Table I)
was obtained which indicates that
the material is antiferromagnetic
below the temperature of 3 K.
Isothermal magnetization
measurements were performed on
Co doped MoS2 NCs by sweeping
the magnetic field from -2 to +2 T
at various temperatures (10, 50,
100, 200 and 300 K). The data is presented in Fig. 12 (b-f). At 10 K, magnetization shows
anhysteretic behavior with the magnetic field with the positive slope, which indicates the (canted)
antiferromagnetic behavior. Interestingly, with further increase in temperature, a more hysteretic
behavior with coercive field of 400 Oe becomes pronounced, suggesting unambiguous room-
temperature ferromagnetism, as evidenced from the s-shaped hysteresis loop. In addition, the
Brillouin function could not account for the magnetic field dependent magnetization data observed
at 100 K due to a mismatch with the temperature given back by the function. The saturation
magnetization (magnetization at the maximum applied magnetic field) decreases as the
measurement temperature increases from 10 – 300 K. This trend is consistent with the temperature
Figure 12: The temperature dependent magnetic susceptibility and magnetic
field-dependent magnetic behavior of Co doped (10%) MoS2 NCs. Fig. 8(a)
shows the applicability of modified Curie-Weiss model.

21
dependent magnetic susceptibility data as shown in Fig. 12(a). Xiang and co-authors have also
reported [65] room temperature ferromagnetism from Co doped (<7%) MoS2 nanosheets.
The XRD patterns (Fig. 1) obtained on the samples studied here are identical to the ones
reported on the best samples prepared through hydrothermal method in the literature [60, 65, 62,
68] thus confirming that there is no or minimal segregation/clustering of dopants. If there is a
significant clustering effect, one would expect to observe higher ferromagnetic Curie temperature
beyond room temperature [69], which is clearly not the case here.
Section 3 – NiMoS2 NCs
Similarly, the temperature
dependent magnetic susceptibility
data, for NiMoS2 NCs, was
collected after the sample was field
cooled at 0H = 1 T magnetic field
(Fig. 13(a)). The magnetization
values (0.4 emu/g) observed in this
study are comparable to those
reported in the literature on similar
systems [65, 62, 66, 67]. The
modified CW model, as depicted in
Fig. 13(a) can describe well the
temperature dependent magnetization behavior giving a θCW = 3 K, as seen in Table I.
Figure 13: The temperature dependent magnetic susceptibility and magnetic
field-dependent magnetic behavior of Ni doped (10%) MoS2 NCs. Fig. 9(a)
shows the applicability of modified Curie-Weiss model.

22
Isothermal magnetization measurements have been performed on Ni doped MoS2 NCs by
sweeping the magnetic field from -2 to +2 T at various temperatures (10, 50, 100, 200 and 300 K),
as seen in the data presented in Fig. 13 (b-f). At 10 K, magnetization anhysteretic behavior as a
function of magnetic field was observed, which indicates (canted) antiferromagnetic behavior.
Interestingly, as the temperature starts to increase further, an s-like hysteresis associated with the
coercive field of 175 Oe, suggesting unambiguous room temperature ferromagnetism. The
saturation magnetization decreases as the measurement increased from 10-300 K. This trend is
consistent with the temperature dependent magnetic susceptibility data shown in Fig. 13(a).
Similar to the CoMoS2 NCs case, Brillouin function could not account for the magnetic field-
dependent magnetization observed at room temperature. To our knowledge, with the exception of
one report [69] on the catalytic behavior of Ni doped MoS2 nanoparticles, there have been no
previous works reported on the magnetic properties of Ni doped MoS2 NCs, to compare our data
at any doping percentage.
Section 4 – FeMoS2 NCs
Like the measurements performed on Co and Ni doped MoS2 NCs, magnetization data on
Fe doped MoS2 NCs has been collected. The temperature dependent magnetic susceptibility data
was collected after the sample was cooled in 0H = 1 T magnetic field (see Fig. 14(a)). The
magnetization value (0.3 emu/g) obtained from the χ-T curve is comparable to that (0.25 emu/g)
reported in the literature on Fe doped (1.74%) MoS2 nanostructures [68]. As displayed in Fig.
14(a), the modified CW model describes well the temperature dependent magnetic susceptibility
behavior with a θCW = 3 K (see Table I).

23
The isothermal
magnetization data is presented in
Fig. 14 (b-f). At 10 K, similar to the
previous samples, magnetization
shows anhysteretic behavior with
the magnetic field, which indicates
(canted) antiferromagnetic
behavior. However, at 300 K, the
M-H behavior of this material
shows a combination of
ferromagnetic (at low fields) and
antiferromagnetic behavior (at high
fields). This is in sharp contrast with
Co and Ni doped samples, which
show complete ferromagnetic behavior at room temperature. The saturation magnetization
decreases as the measurement temperature increased from 10-300 K. This trend is consistent with
the temperature dependent magnetic susceptibility data shown in Fig. 14(a). In addition, the
Brillouin function could not account for the magnetic field-dependent magnetization data observed
at room temperature. Xia and co-authors also reported [68] room temperature ferromagnetism in
Fe doped (<3.18%) MoS2 nanosheets prepared through the hydrothermal process. The interaction
between the sulfur vacancies and the dopants is argued to be at play. A similar situation may be
expected to happen in the present case as well.
Figure 14: The temperature dependent magnetic susceptibility and magnetic
field-dependent magnetic behavior of Fe doped (10%) MoS2 NCs. Fig. 10(a)
shows the applicability of modified Curie-Weiss model.

24
Section 5 – MnMoS2 NCs
Temperature dependent magnetic susceptibility and magnetic field dependent
magnetization measurements were performed on Mn doped MoS2 NCs. As shown in Fig. 15(a),
the magnetic susceptibility increased as the sample temperature is lowered from 300 to 10 K. More
importantly, the magnetization measured at 10 K (1 T), is about 6-times higher than that of pure
MoS2 NCs (Fig. 9(a)). This observation is the direct effect of doping with Mn. To gain additional
insights into the magnetism, the χ-T
curve was fitted using CW model
comprising of diamagnetic and
paramagnetic contributions. The highest
Curie constant of 4×10⁻³ obtained from
the χ-T curve fitting signifies the larger
magnetization in comparison to the
materials discussed above. The fitting
results are shown in Fig. 15(a) along
with the experimental data. By
following this model, the diamagnetic
and paramagnetic components and CW
constant was obtained (see Table I),
which indicates that the material is antiferromagnetic below 3 K. However, a much weaker
ferromagnetism was observed at 300 K as reflected from the hysteretic behavior at low fields, and
a predominant paramagnetic nature was observed at higher fields, shown in Fig. 15 (b-e). A similar
weak ferromagnetism was previously reported [71] for Mn doped SnSe alloys prepared via
Figure 15: The temperature dependent magnetic susceptibility and magnetic
field-dependent magnetic behavior of Mn doped (10%) MoS2 NCs. Inset of
Fig. 11(a) shows the applicability of modified Curie-Weiss model.

25
molecular beam epitaxy methods. Wang and co-workers reported [62] room temperature
ferromagnetism in Mn doped (7%) MoS2 NCs. Park and co-authors have reported [72] a similar
room temperature ferromagnetism from MoS2 NCs upon doping with MnO2 by electrochemical
method, associated with the saturation magnetization of 0.02 emu/g.
MoS2 has been shown, in the literature, to contain ferromagnetism from the zig-zag edges
or vacancies of the material [16 - 17], which could be a similar case here. Our MoS2 NCs are seen
to contain various paramagnetic defects, including sulfur vacancies (as seen in Chapter 6) which
could be responsible for the ferromagnetism observed here. This work also shows that magnetic
properties can strongly depend on the nature of the dopant as well. Additionally, the magnetic
order-disorder transition varies with dopant type such as Co and Ni doping produces stronger
ferromagnetic behavior than Fe and Mn at least at 300 K.

26
Chapter 5: Electrocatalytic Characterizations
It has been shown that the electrocatalytic performance of MoS2 NCs can be engineered
by doping the active edge sites with transition metals. To study HER performance, polarization
curves (see Fig. 16) were obtained for MoS2 NCs and the doped samples. At an overpotential (η)
of 300 mV, the current densities for MoS2, CoMoS2, NiMoS2, FeMoS2 and MnMoS2 were found
to be 2.09, 3.00, 1.5, 4.05 mA/cm-2 and 52 uA/cm-2. Listed from greatest to least for comparison,
the reaction kinetics are as follows: FeMoS2 > CoMoS2 > MoS2 > NiMoS2 > MnMoS2; this was
observed to be true for -372.8 mV ≤ η ≤ -169.6 mV. This progression is the exact same order of
activity that was previously found by calculating the hydrogen absorption free energy (ΔGH).
Wang et al and other groups have doped different transition metals to MoS2 nanostructures similar
to the metals used here and observed current densities that are comparable with our data [13, 56,
73]. The onset potential for the MoS2 NCs was 141 mV, which is comparable to the work done by
X. Ren [74]. These observations are consistent with the literature reports.
For the HER, the Tafel slope and exchange current density can provide information about
the reaction mechanism and kinetics of the process. The Tafel slopes also indicate the rate-limiting
step in the HER [75]. Essentially, the lower the Tafel slope, the faster the reaction takes place, and
Figure 16: (a) Polarization curves, (b) Tafel plots of pristine and 10% doped (Co, Ni, Fe, and Mn) MoS2 NCs.

27
the faster hydrogen is produced. Doping with different transition metals showed a slight change in
the Tafel slope, as seen in Fig. 16 (b), which is consistent with other literature reports [13, 56, 76,
77].
EIS was performed on the samples at overpotentials of 0.445, 0.5, 0.545, and 0.645 V.
Figure 17 shows the EIS measurements taken at η = 0.5 V. Smaller semicircle diameters
correspond to higher charge transfer, higher conductivity, and lower charge transfer resistance
(Rct). The samples can be ranked in order from least to greatest Rct in the following order: Fe, Co,
Pristine MoS2, Ni, and Mn.
Fe doped MoS2 NCs have the greatest conductivity and charge transfer ability, while Mn-
doped MoS2 NCs have the least. DFT calculations performed by Wang and co-authors [13] shows
that the S-edges should become more active once they are doped with TMs. Their experimental
findings have shown that the active sites double in activity when doped with Fe, Co and Cu.
Another literature report performed a similar electrocatalytic study of TM-doped MoS2 and found
the exact same progression [13], with Rct increasing from Fe to Ni in the same order. Our additional
study (Figure 17 (b)) of Mn doped MoS2 showed poor HER performance.
Figure 17: (a) EIS plots for Co, Ni, Fe doped MoS2 NCs, and pristine MoS2 NCs; η = 0.5 V. (b) EIS plot for Mn doped MoS2
NCs; η = 0.5 V.

28
The electrocatalytic performance of CoMoS2 NCs was examined using
chronoamperometry to determine the long-term stability of the NCs. The chronoamperometric
studies were operated in a custom-built two-compartment gas-tight electrochemical cell under an
argon atmosphere. One of the compartments of the cell contains the counter electrode. The solution
(0.5 M H2SO4 in water) was saturated with argon gas prior to the measurement and the solution in
the side of the cell containing the working electrode was kept stirring to remove the in-situ
generated hydrogen gas. The experiment was conducted with an initial current density of 10
mA/cm2 along with a constant over potential of at η = 850 mV. The current density was observed
to stabilize after approximately 5 hours, and after over 23 hours of operation, the CoMoS2 NC’s
can be seen to be electrocatalytically active. Thus, the stability of the nanocrystals has been
demonstrated through pragmatic means.
Figure 18: Stability test for CoMoS2 performed at η = 850 mV

29
Chapter 6: EPR Characterization
In the previous chapters, various characterization methods have been employed to study
the material’s structure, morphology, valence states, magnetic characteristics and catalytic activity.
Yet, to truly complete this study a more profound look must be taken into this material. In this
chapter, X-band (~9.4 GHz) EPR spectroscopy is used to identify atomic paramagnetic point
defects. This, in turn, will help in finding a correlation between the catalytic activity and the
paramagnetic centers.
Section 1 – MoS2 NCs EPR
Initial EPR measurements were performed at 7 K to study the paramagnetic centers in
MoS2 NCs [23]. The data is shown in Fig. 19. Similar measurements were performed on MoS2
bulk, which showed a completely distinct EPR spectra due to different extrinsic defects present
within the sample. The
spectrum exhibits a wealth of
information pertaining to
intrinsic paramagnetic spin
centers. To the knowledge of the
author, this is the first single
richest spectrum reported to
date on any MoS2
nanocrystalline, and
amorphous/less-crystalline
compounds. EPR spectral
parameters provide characteristic
Figure 19: First-derivative representative X-band (9.40 GHz) EPR spectra
measured on MoS2 nanocrystals at 7 K. One can see that there are at least seven
well-resolved EPR lines as marked from 1 to 7. The spectrum is plotted on both
the magnetic field and g-value axes.
30
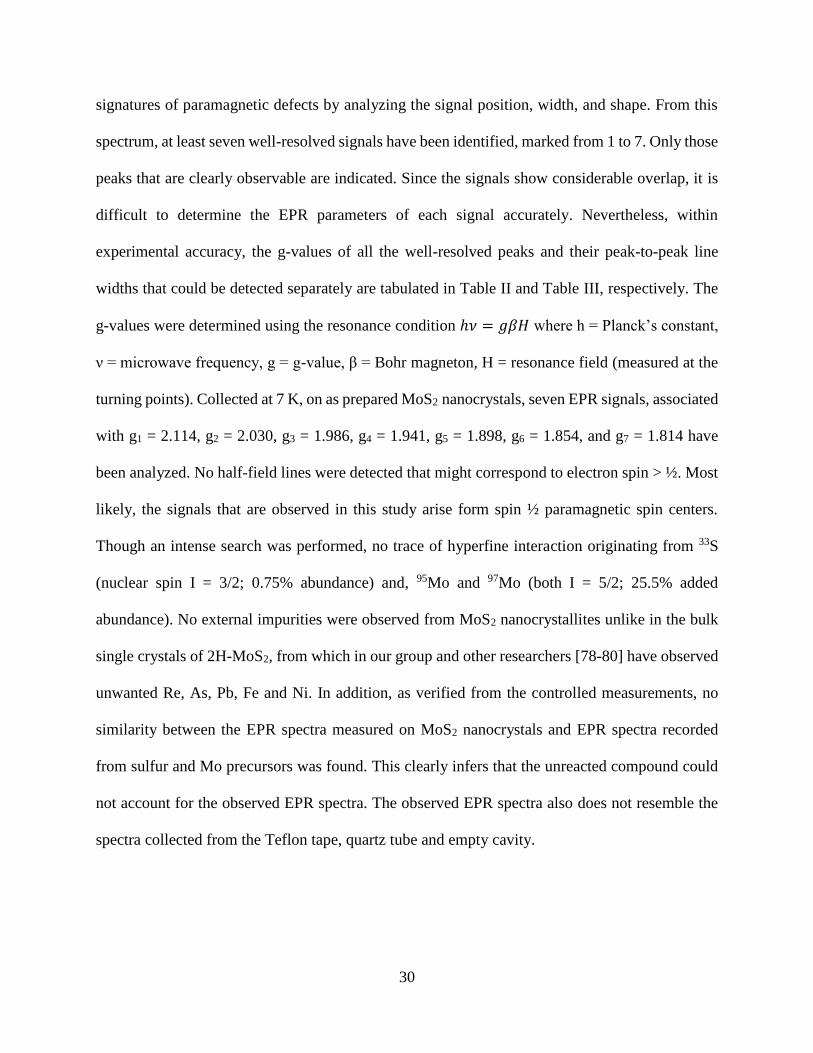
signatures of paramagnetic defects by analyzing the signal position, width, and shape. From this
spectrum, at least seven well-resolved signals have been identified, marked from 1 to 7. Only those
peaks that are clearly observable are indicated. Since the signals show considerable overlap, it is
difficult to determine the EPR parameters of each signal accurately. Nevertheless, within
experimental accuracy, the g-values of all the well-resolved peaks and their peak-to-peak line
widths that could be detected separately are tabulated in Table II and Table III, respectively. The
g-values were determined using the resonance condition ℎ𝜈 = 𝑔𝛽𝐻 where h = Planck’s constant,
ν = microwave frequency, g = g-value, β = Bohr magneton, H = resonance field (measured at the
turning points). Collected at 7 K, on as prepared MoS2 nanocrystals, seven EPR signals, associated
with g1 = 2.114, g2 = 2.030, g3 = 1.986, g4 = 1.941, g5 = 1.898, g6 = 1.854, and g7 = 1.814 have
been analyzed. No half-field lines were detected that might correspond to electron spin > ½. Most
likely, the signals that are observed in this study arise form spin ½ paramagnetic spin centers.
Though an intense search was performed, no trace of hyperfine interaction originating from 33S
(nuclear spin I = 3/2; 0.75% abundance) and, 95Mo and 97Mo (both I = 5/2; 25.5% added
abundance). No external impurities were observed from MoS2 nanocrystallites unlike in the bulk
single crystals of 2H-MoS2, from which in our group and other researchers [78-80] have observed
unwanted Re, As, Pb, Fe and Ni. In addition, as verified from the controlled measurements, no
similarity between the EPR spectra measured on MoS2 nanocrystals and EPR spectra recorded
from sulfur and Mo precursors was found. This clearly infers that the unreacted compound could
not account for the observed EPR spectra. The observed EPR spectra also does not resemble the
spectra collected from the Teflon tape, quartz tube and empty cavity.

31
To better understand the behavior of the observed spin centers, temperature dependent EPR
measurements (7 - 40 K) were performed on as prepared MoS2 nanocrystals, presented in Fig. 20.
Furthermore, as presented in Table II and Table III, the g-values and the linewidths of all the EPR
lines did not practically vary as a function of increasing temperature 7 – 40 K, consistent with the
previous observations [81, 82] in support of Mo5+ species, whose EPR spectra was shown to be
temperature independent. This leads to believe that these are isolated intrinsic paramagnetic
defects, and do not interact with each other.
Now to discuss the possible origin of these paramagnetic defect centers involved in the
observed EPR spectra. The signals in the low field region (< 3000 G) are very weak in intensity,
also not well resolved compared to the rest of the spectrum. Hence, that part of the spectrum is
excluded from the present discussion. Therefore, the efforts of analyzing the signals will be
Figure 20: Temperature dependence of MoS2 NCs at 7, 10, 20 and 40 K.
32
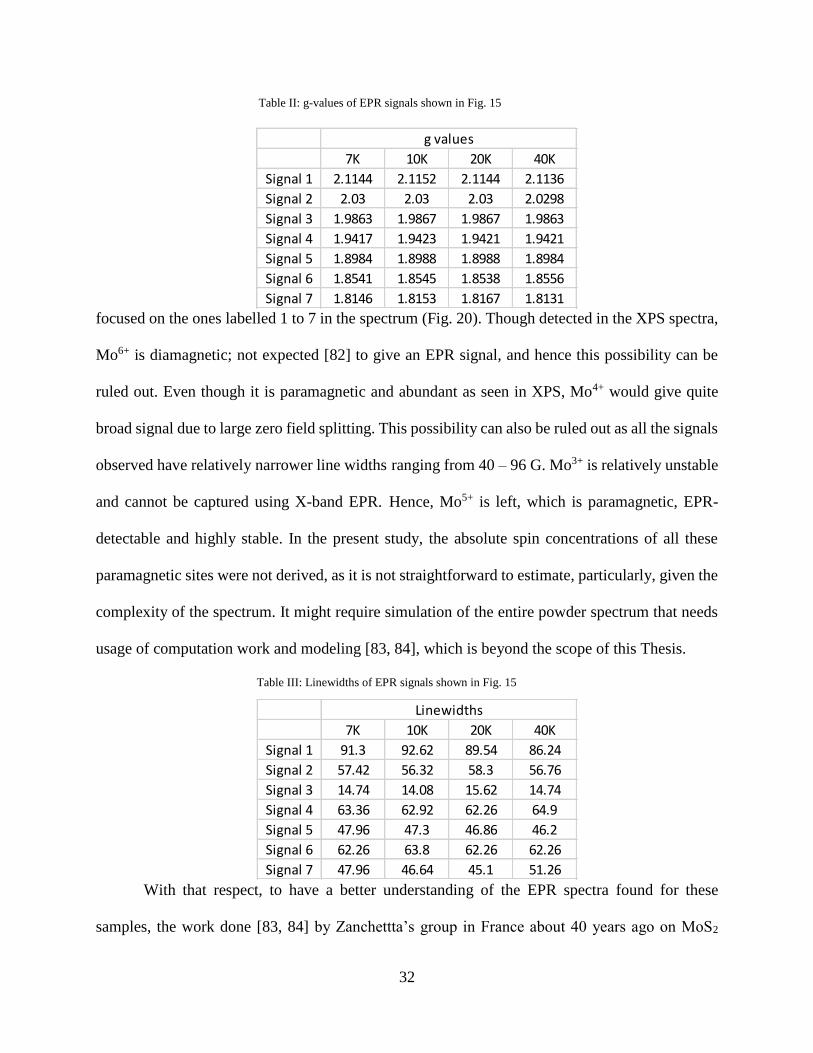
focused on the ones labelled 1 to 7 in the spectrum (Fig. 20). Though detected in the XPS spectra,
Mo6+ is diamagnetic; not expected [82] to give an EPR signal, and hence this possibility can be
ruled out. Even though it is paramagnetic and abundant as seen in XPS, Mo4+ would give quite
broad signal due to large zero field splitting. This possibility can also be ruled out as all the signals
observed have relatively narrower line widths ranging from 40 – 96 G. Mo3+ is relatively unstable
and cannot be captured using X-band EPR. Hence, Mo5+ is left, which is paramagnetic, EPR-
detectable and highly stable. In the present study, the absolute spin concentrations of all these
paramagnetic sites were not derived, as it is not straightforward to estimate, particularly, given the
complexity of the spectrum. It might require simulation of the entire powder spectrum that needs
usage of computation work and modeling [83, 84], which is beyond the scope of this Thesis.
With that respect, to have a better understanding of the EPR spectra found for these
samples, the work done [83, 84] by Zanchettta’s group in France about 40 years ago on MoS2
Table II: g-values of EPR signals shown in Fig. 15
7K 10K 20K 40K
Signal 1 2.1144 2.1152 2.1144 2.1136
Signal 2 2.03 2.03 2.03 2.0298
Signal 3 1.9863 1.9867 1.9867 1.9863
Signal 4 1.9417 1.9423 1.9421 1.9421
Signal 5 1.8984 1.8988 1.8988 1.8984
Signal 6 1.8541 1.8545 1.8538 1.8556
Signal 7 1.8146 1.8153 1.8167 1.8131
g values
Table III: Linewidths of EPR signals shown in Fig. 15
7K 10K 20K 40K
Signal 1 91.3 92.62 89.54 86.24
Signal 2 57.42 56.32 58.3 56.76
Signal 3 14.74 14.08 15.62 14.74
Signal 4 63.36 62.92 62.26 64.9
Signal 5 47.96 47.3 46.86 46.2
Signal 6 62.26 63.8 62.26 62.26
Signal 7 47.96 46.64 45.1 51.26
Linewidths
33
compounds, was recognized to guide this work further. They have prepared these compounds in
an entirely different way (thermal decomposition and precipitation methods) than the samples
prepared in this work. The work presented by Zanchetta et al identified three classes of
paramagnetic spin centers with variable intensity, of Lorentzian shape in character. Signal 1, g =
2.114, is assigned to oxygen absorbed species [85] (measurements were performed in open air),
though it was not observed in most of the previous studies [86, 87, 83, 84, 88]. Signal 2 is assigned
to sulfur chains in the structure, consistent with the observations reported [83] on irradiated
amorphous Sulphur, where the electron hole is localized on the sulfur atom. It is noted that this
signal is much narrower than that (120 – 150 G) of the similar sulfur-related signals reported in
the literature [87, 83, 84, 88]. There is a possibility that this might be due to strong exchange
narrowing effect. The EPR lines originating at g = 1.986 and g = 1.9417 (Signal 3 and 4) are
argued to come from Mo5+ (4d1 configuration) paramagnetic centers surrounded by sulfur
environment (MoS3). The EPR observations appearing at g = 1.898, 1.854 and 1.814 (Signals 5, 6
and 7) were ascribed to Mo5+ paramagnetic centers surrounded by oxygen environment (MoO3).
These observations confirm what was hinted at by the XPS measurements.
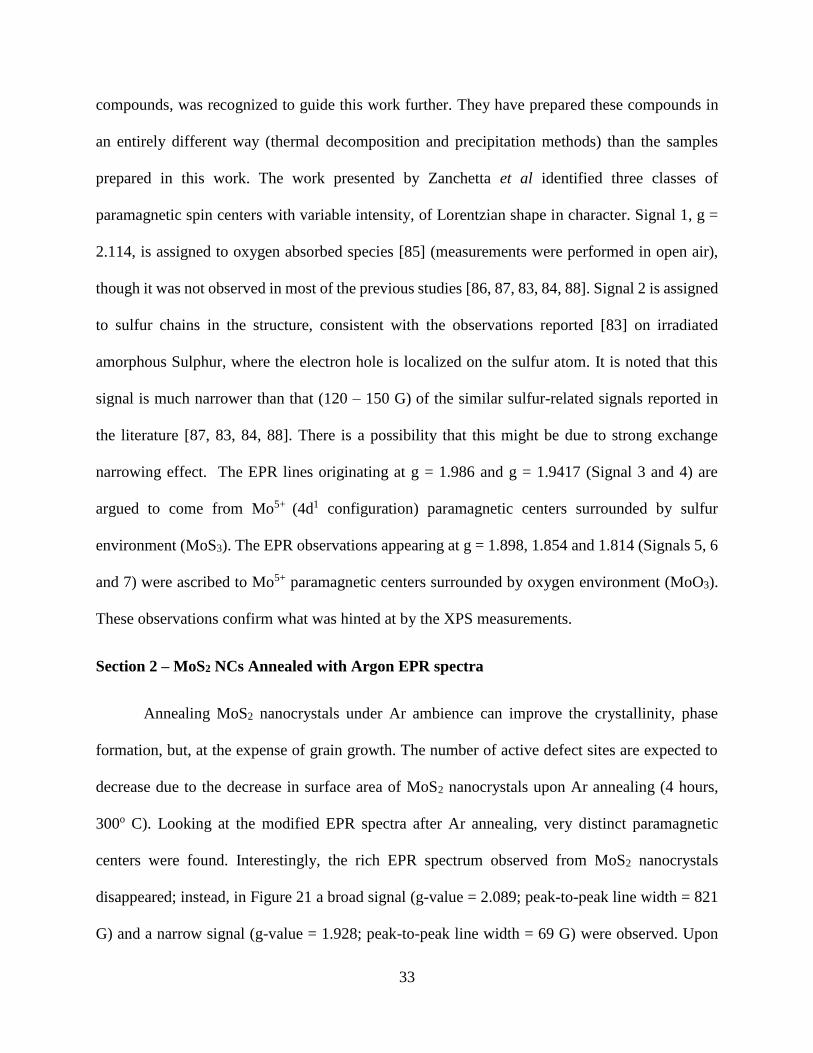
Section 2 – MoS2 NCs Annealed with Argon EPR spectra
Annealing MoS2 nanocrystals under Ar ambience can improve the crystallinity, phase
formation, but, at the expense of grain growth. The number of active defect sites are expected to
decrease due to the decrease in surface area of MoS2 nanocrystals upon Ar annealing (4 hours,
300o C). Looking at the modified EPR spectra after Ar annealing, very distinct paramagnetic
centers were found. Interestingly, the rich EPR spectrum observed from MoS2 nanocrystals
disappeared; instead, in Figure 21 a broad signal (g-value = 2.089; peak-to-peak line width = 821
G) and a narrow signal (g-value = 1.928; peak-to-peak line width = 69 G) were observed. Upon
34
closer inspection, it was noticed that there are a few more weak unresolved narrow signals
overriding on the broader signal. This implies that the paramagnetic defect sites observed from
pristine MoS2 nanocrystals still exist, however, with much reduced defect density.
To trace the origin of the
broad signal, the work done by
Arcon and co-authors will be
used for aid [89]. The authors
conducted X-band EPR study on
Li doped MoS2 nanotubes. They
observed two quite different
components. A broad (800 – 2600
G) signal associated with the g-
value of 2.15-2.52 and a narrow
(~ 4 G) signal appeared at the g-value of 2.0029 were detected. The fact that the broad signal g-
value is farther from the free electron g-value (2.0023) suggests considerable spin-orbit coupling.
The authors attributed the broad signal to (d-band) conduction electrons coupled to defects through
exchange interaction. As the g-value and line width of the broad signal observed in the present
work are in close agreement with their observations, the broad signal in Fig. 21 are assigned to
conduction electron spins. It is natural to expect a similar situation that might have occurred in our
MoS2 nanocrystals during the Ar annealing process, which results in significant surface
reorganization toward bulk-like structure. On the other hand, the narrower and weaker signal could
be assigned to oxo-Mo5+ centers, which might be present in the form of small spin clusters. It is
evident that this particular oxo-Mo5+ site still survived even after Ar annealing treatment. This
Figure 21: The EPR spectra collected on Ar annealed MoS2 nanocrystals measured
at 7 K.

35
finding implies that the observed spin centers are of surface-related, and probably are located on
the edges of the layers.
Section 3 – TM doped MoS2 NCs
Now, why the variations in the magnetic and catalytic properties of the studied materials
occur as a function of transition metal doping is discussed. The present work as well as the early-
on reports [90-93] showed that the transition metal elements show interesting magnetic properties
as well as pronounced catalytic activity. From our experimental observations, it was learned that
the Mn doped MoS2 NCs showed least catalytic performance and showed predominant
paramagnetism at room temperature. Whereas the pristine MoS2 and Co, Ni, and Fe doped MoS2
NCs showed good catalytic performance as well as stronger room temperature ferromagnetism.
To better understand the relationship between the magnetism and catalytic performance, X-band
EPR measurements on all the samples at room temperature (300 K) have been performed.
The data is plotted in Figure 22. As it can be clearly noticed, Mn doped MoS2 NCs did not
show signals coming from the catalytically active centers, except the strong signal that comes from
Mn2+ only. On the other hand, the samples doped with Co, and Ni including undoped MoS2 NCs
showed many sharp EPR signals, indicating the presence of larger number of catalytically active
centers. Hence, we believe that Co doped MoS2 NCs showed superior catalytic performance
compared to Mn doped MoS2 NCs. These active defect centers contain unpaired electron spins due
to uncoordinated and dangling bonds. The observed ferromagnetic behavior could have resulted
from the interaction between these active spin centers. This may also be due to the formation of
MnS (undetected) in the reaction yield, which changes the 2D structure of MoS2 nanolayers to 3D,
and causes the electrocatalytic properties to deteriorate [94]. The EPR spectra of MoS2 NCs has

36
been analyzed and identified the active defect centers in a previous chapter. Detailed analysis of
the EPR spectra collected from transition metal doped MoS2 NCs is being performed.
Figure 22: X-band room temperature (300 K) EPR spectra collected from MoS2, Co, Ni, Fe and Mn
doped MoS2 NCs.
37
Conclusion
To conclude, in this thesis, we have reported the magnetic and catalytic properties of
hydrothermally grown transition metal doped (10% of Co, Ni, Fe and Mn) MoS2 NCs associated
with the particle size of 25-30 nm. Interestingly, the undoped MoS2 NCs showed a mixture of
canted anti-ferromagnetic and ferromagnetic behavior. MoS2 NCs doped with Co, Ni, and Fe
exhibited profound room temperature paramagnetic nature, predominantly. For all the materials,
modified CW law described the temperature dependent magnetic behavior, and the ground state is
canted antiferromagnetic phase associated with uncompensated electron spins. In addition, we
have also studied the hydrogen evolution reaction performance. The present study compared the
current densities (j), measured at the over potentials of -372.8 mV ≤ η ≤ -169.6 mV, listed from
greatest to least, j(FeMoS2) = 4.05, j(CoMoS2) = 3.00, j(MoS2) =2.09, j(NiMoS2) = 1.5 mA/cm2,
and j(MnMoS2) = 52 μA/cm2. The order of the overall reaction activity is obtained from Tafel
slopes as CoMoS2 > MoS2 > NiMoS2 > FeMoS2 > MnMoS2. The electrochemical impedance
spectroscopic measurements indicated that Fe doped MoS2 NCs have the best conductivity and
charge transfer ability, while Mn-doped MoS2 had the lowest. More likely, it is due to the creation
of more number of catalytically active centers in Co doped MoS2 NCs compared to Mn doped
MoS2 NCs evidenced from room temperature EPR measurements. This could be due to Co
modifying the activity of the S-edge. Additional work is in progress to establish the relationship
between the magnetic and catalytic properties of these materials.

38
Future Directions
Magnetic and catalytic properties will be performed in the immediate future to understand
the effects of annealing these materials under various gas environments, and apply to possible gas
sensing applications. Low temperature EPR studies will also be performed for the transition metal
doped MoS2 NCs. Plans of simulating the entire EPR powder spectra of the TM doped MoS2 NCs
are in the future to fully grasp all the interactions within the materials. Lastly, a comparison of the
magnetic properties of MoS2 with other 2D layered materials such as; VS2 and VSe2 will be
performed.

39
References
1) Q. H. Wang, K. Kalantar-Zadeh, A. Kis, Electronics and optoelectronics of two-
dimensional transition metal dichalcogenides, Nat. Nanotech., 7, 699 (2012)
2) G. R. Bhimanapati, Z. Lin, V. Meunier, Y. Jung, J. Cha, Recent Advances in Two-
Dimensional Materials Beyond Graphene, ACS Nano 12, 11509 (2015)
3) S. Z. Butler, S. M. Hollen, L. Cao, Y. Cui, J. A. Gupta, Progress, Challenges, and
Opportunities in Two-Dimensional Materials Beyond Graphene, ACS Nano 12, 2898 (2013)
4) K. F. Mak, C. Lee, J. Hone, J. Shan, T. F. Heinz, Atomically Thin MoS2: A New Direct-
Gap semiconductor, PRL 105, 136805 (2010)
5) S. Ahmed, X. Ding, N. Bao, P. Bian, R. Zheng, Y. Wang, Inducing high coercivity in MoS2
nanosheets by transition element doping, Chem. Mater. 29, 21, 9066 (2017)
6) G. Ye, Y. Gong, J. Lin, B. Li, Y. He, Defects Engineered Monolayer MoS2 for Improved
Hydrogen Evolution Reaction, Nano Lett., 16, 1097 (2016)
7) G. Li, D. Zhang, Q. Qiao, Y. Yu, D. Peterson, All The Catalytic Active Sites of MoS2 for
Hydrogen Evolution, J. Am. Chem. Soc., 138, 16632 (2016)
8) Y. Yu, S. Y. Huang, Y. Li, S. N Steinmann, Layer-Dependent Electrocatalysis of MoS2 for
Hydrogen Evolution, Nano Lett., 14, 553 (2014)
9) T. F. Jaramillo, K. P. Jorgensen, J. Bonde, Identification of Active Edge Sites For
Electrochemical H2 Evolution from MoS2 nanocatalysts, Science, 317, 100 (2007)

40
10) Y. Xu, L. Wang, S. Zhang, C. Liu, Monolayer MoS2 with S vacancies from interlayer
spacing expanded counterparts for highly efficient electrochemical hydrogen production, J.
Mater. Chem. A, 4, 16524 (2016)
11) Y. Wu, M. Zarei-Chaleshtori, B. Torres, T. Akter, C. Diaz-Moreno, G. B. Saupe, J. A.
Lopez, R.R. Chianelli, D. Villagran, Electrocatalytic hydrogen gas generation by cobalt
molybdenum disulfide (CoMoS2) synthesized using alkyl-containing thiomolybdate
precursors, Int. J. Hydrogen Energy 42, 20669 (2017)
12) M. Chhetri, U. Gupta, L. Yadgarov, R. Rosentsveig, R. Tenne, C. N. R. Rao, Beneficial
effect of Re doping on the electrochemical HER activity of MoS2 fullerenes, Dalton Trans.,
44, 16399 (2015)
13) H. Wang, C. Tsai, D. Kong, Transtion-metal doped edge sites in vertically aligned MoS2
catalysts for enhanced hydrogen evolution, Nano Res., 8, 2, 566 (2015)
14) Y. Yin, J. Han, Contributions of Phase, Sulfur Vacancies, and Edges to the Hydrogen
Evolution Reaction Catalytic Activity of Porous Molybdenum Disulfide Nanosheets, J. Am.
Chem. Soc., 138, 7965 (2016)
15) X. Dai, Co-Doped MoS2 Nanosheets with the Dominant CoMoS Phase Coated on
Carbon as an Excellent Electrocatalyst for Hydrogen Evolution, ACS Appl. Mater.
Interfaces, 7 , 27242 (2015)
16) Z. C. Xiang, Z. Zhang, X. Xu, Q. Zhang, Q. Wang, C. Yuan, Room-temperature
ferromagnetism in Co doped MoS2 sheets, Phys. Chem. Chem. Phys., 17, 15822 (2015)
17) J. D. Fuhr, A. Saul, Scanning Tunneling Microscopy Chemical Signature of Point
Defects on the MoS2 (0001) Surface, Phys. Rev. Lett., 92, 026802, (2004)

41
18) S. Yan, W. Qiao, X. He, X. Guo, L. Xi, W. Zhong, Y. Du, Enhancement of magnetism by
structural phase transition in MoS2, Appl. Phys. Lett. 106, 012408 (2015)
19) A. A. Tedstone, D. J. Lewis, P. O’Brien, Synthesis, Properties, and Applications of
Transition Metal-Doped Layered Transition Metal Dichalcogenides, Chem. Mater. 28, 1965
(2016)
20) H. D. Xia, H. P. Li, C. Y. Lan, C. Li, X. X. Zhang, S. J. Zhang, Y. Liu, Ultrafast erbium-
doped fiber laser mode-locked by a CVD-grown molybdenum disulfide (MoS2) saturable
absorber, Opt. Express, 22, 17341 (2014)
21) A. Ayari E. Cobas, O. Ogundadegbe, M. S. Fuhrer, Realization and electrical
characterization of ultrathin crystals of layered transition-metal dichalcogenides, J. Appl.
Phys., 101, 14507 (2007)
22) X. B. Fan, P. T. Xu, D. K. Zhou, Y. F. Sun, Y. G. C. Li, M. A. T. Nguyen, M. Terrones, T.
E. Mallouk, Fast and Efficient Preparation of Exfoliated 2H MoS2 Nanosheets by
Sonication-Assisted Lithium Intercalation and Infrared Laser-Induced 1T to 2H Phase
Reversion, Nano Lett., 15, 5956 (2015)
23) L. M. Martinez, M. D. Teran, R. R. Chianelli, S. R. J. Hennadige, S. R. Singamaneni,
Magnetic Defects in Transitional Metal Di-chalcogenide semiconducting materials, MRS
Adv., 3, 6-7, 351 (2018)
24) L. M. Martinez, C. Karthik, M. Kongora, S. R. Singamaneni, Paramagnetic Defects in
Hydrothermally Grown Few-Layered MoS2 Nanocrystals, J. Mat. Res., Accepted (2018)
25) D. Gao, M. Si, J. Li, J. Zhang, Z. Zhang, Z. Yang and D. Xue, Ferromagnetism in
freestanding MoS2 nanosheets, Nanoscale Res. Lett., 8, 129 (2013).

42
26) R. Zhang, Y. Li, J. Qi and D. Gao, Ferromagnetism in ultrathin MoS2 nanosheets: from
amorphous to crystalline, Nanoscale Res. Lett., 9, 586 (2014).
27) Ojha, S. Saha, S. Banerjee, A. K. Ganguli, Efficient electrocatalytic hydrogen evolution
from MoS2-functionalized Mo2N Nanostructures, ACS Appl. Mater. Interfaces 9, 19455
(2017)
28) B. Yoosuk, J. H. Kim, C. Song, C. Ngamcharussrivichai, P. Prasassarakich, Higly active
MoS2, CoMoS2 and NiMOS2 unsupported catalysts prepared by hydrothermal synthesis
for hydrodesulfurization of 4,6-dimethyldibenzothiophene, Cat. Tod., 130, 14 (2008)
29) C. Wivel, R. Candia, B. S. Clausen, S. Morup, H. Topsoe, On the catalytic significance of a
C-Mo-S Phase in Co-MoAl2O3 Hydrodesulfurizatin Catalysts: Combined in situ
Mossbauer Emission Spectroscopy and Activity Studies, J. Catal., 68, 453 (1981)
30) J. Kibsgaard, Z. Chen, B. N. Reinecke, and T. F. Jaramillo, Engineering the surface structure
of MoS2 to preferentially expose active edge sites for electrocatalysis, Nature Mater., 11, 963
(2012).
31) T. F. Jaramillo, K. P. Jørgensen, J. Bonde, J. H. Nielsen, S. Horch, I. Chorkendorff,
Identification of Active Edge Sites for Electrochemical H2 Evolution from MoS2
Nanocatalysts, Science 317, 100 (2007).
32) Y. Yu, S-Y Huang,Y. Li, S. N. Steinmann, W. Yang, and L. Cao, Layer-Dependent
Electrocatalysis of MoS2 for Hydrogen Evolution, Nano Lett., 14, 553 (2014).
33) B. Hinnemann, P. G. Moses, J. L. Bonde, K. P. Jørgensen, J. H. Nielsen, S. Horch, I.
Chorkendorff, J. K. Nørskov, Biomimetic Hydrogen Evolution: MoS2 Nanoparticles as
Catalyst for Hydrogen Evolution, J. Am. Chem. Soc., 127, 5308, (2005).

43
34) H. Wang, C. Tsai, D. Kong, K. Chan, F. Abild-Pedersen, J. K. Nørskov, Y. Cui, Transition-
metal doped edge sites in vertically aligned MoS2 catalysts for enhanced hydrogen
evolution, Nano Res., 8, 566 (2015).
35) G. Liu, A. W. Robertson, M. Meng-Jung Li, W. C. H. Kuo, M. T. Darby, M. H. Muhieddine,
Y-C Lin, K. Suenaga, M. Stamatakis, J. H. Warner and S. C. E. Tsang, MoS2 monolayer
catalyst doped with isolated Co atoms for the hydrodeoxygenation reaction, Nature Chem.,
9, 810 (2017).
36) Z. Xiang, Z. Zhang, X. Xu, Q. Zhang, Room-temperature ferromagnetism in Co doped
MoS2 sheets, Phys. Chem. Chem. Phys., 17, 15822 (2015)
37) P.A. Spevack and N.S.Mclntyre, A Raman and XPS investigation of supported
molybdenum oxide thin films. 2. Reactions with hydrogen sulfide, J. Phys. Chem., 97, 11031
(1993).
38) W. Zhang, T. Zhou, J. Zheng, J. Hong, Y. Pan, R. Xu, Water-Soluble MoS3 Nanoparticles
for Photocatalytic H2 Evolution, ChemSusChem, 8, 1464 (2015)
39) L. M. Martinez, J. Delgado, C. Saiz, A. Cosio, Y. Wu, D. Villagran, K. Gandha, I. Nlebedim,
S. R. Singamaneni, Magnetic and Electrocatalytic Properties of Transition Metal Doped
MoS2 Nanocrystals, J. Phys. Chem. C, Under Review (2018)
40) J. M. Thomas, I. Adams, R. H. Williams, M. Barber, Valence band structures and core-
electron energy levels in the monochalcogenides of gallium. Photoelectron spectroscopic
study, J. Chem. Soc. Faraday, Trans II 68, 755 (1972).

44
41) J. E. Devries, H. C. Yao, R. J. Baird, H. S. Gandhi, Characterization of molybdenum
platinum catalysts supported on γ-alumina by X-ray photoelectron spectroscopy, J. Catal.
84, 8 (1983).
42) N. H. Turner, A. M. Single, Determination of peak positions and areas from wide-scan
XPS spectra, Surf. Interface and 15, 215 (1990).
43) L. Benoist, D. Gonbeau, G. Pfister-Guillouzo, E. Schimidt, G. Meunier, A. Levasseur, X-ray
photoelectron spectroscopy characterization of amorphous molybdenum oxysulfide thin
films, Thin Solid Films 258, 110 (1995).
44) N. S. Mc Intyre, D. D. Johnston, L. L. Coatsworth, R. D. Davidson, J. R. Brown, X-ray
photoelectron spectroscopic studies of thin film oxides of cobalt and molybdenum, Surf.
Interface Anal. 15, 265 (1990).
45) F. S. Khumalo, C. G. Olson, J. W. Anderegg, D.W. Lynch, Optical transitions, XPS,
electronic states in NiPS3, Chem. Phys. 65, 289 (1982).
46) B. Brox, I. Olefjord, ESCA studies of MoO2 and MoO3, Surf. Interface Anal. 13, 3 (1988).
47) I. Alstrup, I. Chorkendorff, R. Candia, B. S. Clausen, H. Topsoe, A combined X-ray
photoelectron and Mossbauer emission spectroscopy study of the state of cobalt in sulfide,
supported, and unsupported Co-Mo catalysts, J. Catal. 77, 397 (1982).
48) H. M. Wu, S. A. Chen, Dopant-polymer interaction: MoCl5- doped polyacetylene, Synthetic
Metals 26, 225 (1988).
49) S. J. Hilsenbenk, V. G. Young Jr., R. E. McCarley, Synthesis, structure, and
characterization of N-ligated Mo6S8L6 cluster complexes. Molecular precursors to Chevrel
phases, Inorg. Chem. 33, 1822 (1994).

45
50) J. T. Roberts, C. M. Friend, Desulfurization of ethylene sulfide on Mo(100): The roles of
ring size and strain in adsorbate reaction selectivity, Surf. Sci. 202, 405 (1988).
51) X. R. Yu, F. Liu, Z. Y. Wang, Y. Chen, Auger parameters for sulfur-containing compounds
using a mixed aluminum-silver excitation source, J. Electron Spectrosc. Relat. Phenom. 50, 159
(1990).
52) D. R. Mullins, D. R. Huntley, S. H. Overbury, The nature of the sulfur induced surface
reconstruction on Ni (111), Surf. Sci. 323, L287 (1995).
53) C. Battistoni, L. Gastaldi, A. Lapiccirella, G. Mattongo, C. Viticoli, Octahedral vs
tetrahedral coordination of the Co (II) ion in layer compounds: CoxZn1-xIn2S4 (0<x<0.46)
solid solution, J. Phys. Chem. Solids 47, 899 (1986).
54) R. B. Shalvoy, P. J. Reucroft, Characterization of a sulfur-resistant methanation catalyst
by XPS, J. Vac. Sci. Technol. 16, 567 (1979).
55) G. M. Bremmer, L.van Haandel, E. J. Hensen, J. W. M. Frenken, P. J. Kooyman, Instability
of NiMoS2 and CoMoS2 Hydrodesulfurization Catalysts at ambient conditions: a quasi in
Situ High resolution Transmission Electron microscopy and XPS study, J. Phys. Chem. C 120,
34, 19204 (2016).
56) D. Wang, X. Zhang, Y. Shen, Z. Wu, Ni-doped MoS2 nanoparticles as highly active
hydrogen evolution electrocatalysts, RSC Adv., 6, 16656 (2016).
57) H. Van der Heide, R. Hemmel, C. F. Van Bruggen, C. Haas, X-ray photoelectron spectra of
3d transition metal pyrites, J. Solid State Chem. 33, 17 (1980).
58) N. S. McIntyre, M. G. Cook, X-ray photoelectron studies on some oxides and
hydrooxides of cobalt, nickel, and copper, Anal. Chem. 47, 2208 (1975).

46
59) P.A. Spevack and N.S.Mclntyre, A Raman and XPS investigation of supported
molybdenum oxide thin films. 1. Calcination and reduction studies, J. of Phys. Chem., 97,
11020 (1993).
60) D. Gao, M. Si, J. Li, J. Zhang, Z. Zhang, Z. Yang, D, Xue, Ferromagnetism in freestanding
MoS2 nanosheets, Nanoscale Res. Lett., 8, 129 (2013).
61) S. Yan, W. Qiao, X. He, X. Guo, L. Xi, W. Zhong, Y. Du, Enhancement of magnetism by
structural phase transition in MoS2, Appl. Phys. Lett., 106, 012408 (2015)
62) J. Wang, F. Sun, S. Yang, Y. Li, C. Zhao, M. Xu, Y. Zhang, H. Zeng, Robust ferromagnetism
in Mn-doped MoS2 nanostructures, Appl. Phys. Lett., 109, 092401 (2016).
63) S. S. Rao, S. Narayana Jammalamadaka, A. Stesmans, V. V. Moshchalkov, J. van Tol, D. V.
Kosynkin, A. Higginbotham, J. M. Tour, Ferromagnetism in Graphene Nanoribbons: Split
Versus Oxidative Unzipped Ribbons, Nano Letters 12, 1210 (2012).
64) J. Zhang, J. M. Soon, K. P. Loh, J. Yin, J. Ding, M. B. Sullivian, P. Wu, Magnetic
Molybdenum Disulfide Nanosheet Films, Nano Lett. 7, 2370 (2007).
65) Z. C. Xiang, Z. Zhang, X. J. Xu, Q. Zhang, Q. B. Wang, C. Yuan, Room-temperature
ferromagnetism in Co doped MoS2 sheets, Phys. Chem. Chem. Phys.,17, 15822 (2015).
66) B. Xia, Q. Guo, D. Gao, S. Shi, K. Tao, High temperature ferromagnetism in Cu-doped
MoS2 nanosheets, J. Phys. D, Appl. Phys. 49 165003 (2016)
67) S. Ahmed, X. Ding, N. Bao, P. Bian, R. Zheng, Y. Wang, P. P. Murmu, J. V. Kennedy, R. Liu,
H. Fan, K. Suzuki, J. Ding, J. Yi, Inducing High Coercivity in MoS2 Nanosheets by Transition
Element Doping, Chem. Mater., 29, 9066 (2017).

47
68) B. Xia, Y. Yang, J. Ma, K. Tao, D. Gao, Adjustable Ferromagnetic Behavior in Iron-
Doped Two-Dimensional MoS2 Multilayer Nanosheets, Appl. Phys. Express, 10, 09332
(2017).
69) K. P. Bhatti, S. Chaudhary, D. K. Pandya, S. C. Kashyap, Intrinsic and extrinsic origin of
room temperature ferromagnetism in ZnO:Co, J. Appl. Phys. 101, 103919 (2007)
70) D. Wang, X. Zhang, Y. Shen and Z. Wu, Ni-doped MoS2 nanoparticles as highly active
hydrogen evolution electrocatalysts, RSC Adv., 6, 16656 (2016)
71) S. Dong, X. Liu, X. Li, V. Kanzyuba, T. Yoo, S. Rouvimov, S. Vishwanath, H. G. Xing, D.
Jena, M. Dobrowolska, J. K. Furdyna, Room temperature weak ferromagnetism in Sn1-
xMnxSe2 2D films grown by molecular beam epitaxy, APL MATERIALS 4, 032601 (2016)
72) C. S. Park, D. Chu, Y. Shon, J. Lee, E. K. Kim, Room temperature ferromagnetic and
ambipolar behaviors of MoS2 doped by manganese oxide using an electrochemical method,
Appl. Phys. Lett, 110, 222104 (2017)
73) J. Deng, H. Li, J. Xiao, Y. Tu, D. Deng, H. Yang, H. Tian, J. Li, P. Ren, X. Bao, Triggering
the electrocatalytic hydrogen evolution activity of the inert two-dimensional MoS2 surface
via single-atom metal doping, Energy Environ. Sci., 8, 1594 (2015).
74) X. Ren, L. Pang, Y. Zhang, Xiaodong Ren, H. Fan, One-step hydrothermal synthesis of
monolayer MoS2 quantum dots for highly efficient electrocatalytic hydrogen evolution, J.
Mater. Chem. A, 3, 10693 (2015).
75) K. Ojha, S. Saha, S. Banerjee, A. K. Ganguli, Efficient Electrocatalytic Hydrogen
Evolution from MoS2-Functionalized Mo2N Nanostructures, ACS Appl. Mater. Interfaces, 9,
19455 (2017).

48
76) X. Dai, K. Du, Z. Li, M. Liu, Y. Ma, H. Sun, X. Zhang, Co-Doped MoS2 Nanosheets with
the Dominant CoMoS Phase Coated on Carbon as an Excellent Electrocatalyst for
Hydrogen Evolution, ACS Appl. Mater. Interfaces, 7, 27242-27253 (2015).
77) Prins, R.; De Beer, V. H. J.; Somorjai, G. A., Structure and Function of the Catalyst and
the Promoter in Co – Mo Hydrodesulfurization Catalysts, Cat. Rev., 31, 1 (1989).
78) J.W.C.Spackman, Electron spin resonance of charge carriers in impure molybdenum
disulphide, Nature, 198, 1266 (1963).
79) F. D. Brand, G. M. Ribeiro, P. H. Vaz, J. C. Gonz_alez, K. Krambrock, Identification of
rhenium donors and sulfur vacancy acceptors in layered MoS2 bulk Samples, J. Appl. Phys.
119, 235701 (2016).
80) A. Stesmans, S. Iacovo, V. V. Afanas’ev, ESR study of p-type natural 2H-polytype MoS2
crystals: The As acceptor activity, Appl. Phys. Lett., 109, 172104 (2016).
81) A.J.A. Konings, A.M. van Doormen, D.C.Koningsberger, V.H.J. De Beer, A. L. Farragher,
G.C.A. Schuit, ESR Studies on Hydrodesulfurization Catalysts: Supported and unsupported
Sulfided Molybdenum and Tungsten Catalysts, J. of Catalysis 54, 1 (1978).
82) K.C.Khulbe, R.S. Mann, M. Ternan, Electron spin resonance of the surface chemistry of
molybdenum-alumina catalysts, CAN. J. CHEM 56, 1769 (1978).
83) Y. Bensimon, P. Belougne, J. C. Giuntini, J. V. Zanchetta, Electron Spin Resonance of Water
Adsorption on Amorphous Molybdenum Sulfide, J. Phys. Chem. 88, 2754 (1984)
84) B. Deroide, Y. Bensimon, P. Belougne, J. V. Zanchetta, Lineshapes of ESR signals and the
nature of paramagnetic species in amorphous molybdenum sulfides, J. Phys. Chem. Solids 52,
853, (1991)

49
85) A. Sobczynski, Zmierczak, Characterization of MoS2/SiO2 by ESR and NO absorption,
React. Kinet. Catal. Lett., 44, 511 (1991).
86) K. C. Khulber, S. Mann, and M. Ternan, Electron spin resonance studies of the surface
chemistry of molybdenum-alumina catalysts, Can. J. Chem. 56, 1769 (1978).
87) B. G. Silbernagel, T. A. Pecoraro, R. R. Chianelli, Electron Spin Resonance of Supported
and Unsupported Molybdenum Hydrotreating Catalysts, J. Catalysis 78, 380 (1982).
88) C. Louis, M. Che, EPR Investigation of the Coordination Sphere of Mo5+ Ions on
Thermally Reduced Silica-Supported Molybdenum Catalysts Prepared by the Grafting
Method, J. Phys. Chem., 91, 2875 (1987).
89) D. Arcon, A. Zorko, P. Cevc, A. Mrzel, M. Remsˇkar, R. Dominko, M. Gabersˇcˇek, and D.
Mihailovic, Electron spin resonance of doped chalcogenide nanotubes, Phys. Rev. B, 67,
125423 (2003).
90) P. W. Selwood, Magnetism and Catalysis, Chem. Rev., 38 (1), 41 (1946).
91) J. T. Richardson, Magnetism and catalysis, J. Appl. Phys., 49, 1781 (1978)
92) R. J. H. Voorhoeve, Experimental Relationships between Catalysis and Magnetism, AIP
Conference Proceedings, 18, 19 (1974).
93) E. Torun, C. Fang, M. de Wijs, R. A. de Groot, Role of Magnetism in Catalysis: RuO2
(110) Surface, J. Phys. Chem. C., 117, 6353-6357 (2013).
94) Aleksander A. Tedstone, David J. Lewis, Paul O’Brien, Synthesis, Properties, and
Applications of Transition Metal-Doped Layered Transition Metal Dichalcogenides, Chem.
Mater., 28, 1965−1974 (2016).

50
Curriculum Vita
My name is Luis M. Martinez Milian. I started my journey through science doing an
Associate’s Degree in Technology for Electronics in my Alma Mater, University of Puerto Rico
at Humacao (UPRH). During that time I found a deep appreciation for Physics thanks to the
teachings of a professor from back home. After completing my Associate’s, I moved on the do
my B.S. in Physics applied to Electronics at UPRH. There I developed myself as a fledgling
scientist doing volunteer research work with several professors. From learning to use the
Electrospinning technique to produce PVDF nanofibers, to helping develop and later race a
moonbuggy for the NASA annual moonbuggy race. After a few years in my B.S. I applied to the
PREM program in UPRH and got accepted to work alongside Dr. N. Pinto. With him, I learned
various techniques and skills which have helped throughout my Master’s degree. I was able to
present two poster presentations through the PREM program in UPRH in a conference and
symposium. I am truly grateful for the experiences I had during my time in UPRH.
Currently, I’m finishing my Master’s degree in Physics here at the University of Texas at
El Paso. While doing my Master’s, was granted the chance to become a Teaching Assistant. This
has helped me view things through an educators eyes and I can appreciate the work performed to
pass on knowledge. In UTEP I also met Dr. Rao, my current advisor, whom has taught me to
become a better researcher than who I was before. With his help, I have been able to publish five
papers. Two of which are on my main project. I have also been able to present my work in
several conferences as poster and oral presentations. For this, I thank my advisor for granting me
the tools I need to move forward.