magmatic processes revealed by anorthoclase textures and ...oriano et al... ·...
TRANSCRIPT

Journal of Volcanology and Geothermal Research 347 (2017) 44–63
Contents lists available at ScienceDirect
Journal of Volcanology and Geothermal Research
j ourna l homepage: www.e lsev ie r .com/ locate / jvo lgeores
Magmatic processes revealed by anorthoclase textures and traceelement modeling: The case of the Lajes Ignimbrite eruption(Terceira Island, Azores)
Claudia D'Oriano a,⁎, Patrizia Landi b, Adriano Pimentel c,d, Vittorio Zanon c,e
a Istituto Nazionale di Geofisica e Vulcanologia – Sezione di Palermo, Via Ugo La Malfa, 153, 90146 Palermo, Italyb Istituto Nazionale di Geofisica e Vulcanologia – Sezione di Pisa, Via della Faggiola, 32, 56126 Pisa, Italyc Instituto de Investigação em Vulcanologia e Avaliação de Riscos, Universidade dos Açores, Rua Mãe de Deus, 9501-801 Ponta Delgada, Portugald Centro de Informação e Vigilância Sismovulcânica dos Açores, Rua Mãe de Deus, 9501-801 Ponta Delgada, Portugale Institut de Physique du Globe de Paris, Université Sorbonne Paris Cité, Université Paris Diderot, CNRS UMR-7154, Paris 75005, France
⁎ Corresponding author.E-mail address: [email protected] (C. D'O
https://doi.org/10.1016/j.jvolgeores.2017.08.0120377-0273/© 2017 Elsevier B.V. All rights reserved.
a b s t r a c t
a r t i c l e i n f oArticle history:Received 31 March 2017Received in revised form 14 August 2017Accepted 26 August 2017Available online 8 September 2017
The Lajes Ignimbrite on Terceira Island (Azores) records the last major pyroclastic density current-forming erup-tion of Pico Alto Volcano that occurred ca. 21 kyrs ago. This comenditic trachyte ignimbrite contains up to 30 vol%of crystals, mostly anorthoclase. Geochemical investigation of the products collected throughout two key out-crops reveals that major element compositions are poorly variable, whereas trace elements show significant var-iability, pointing to the presence of a zoned magma reservoir. Thermometry and oxygen fugacity estimationsyielded pre-eruptive temperatures of 850–900 °C and ΔNNO from −2.4 to −1.8. Melt–alkali-feldspar hygrom-eter indicates magmatic H2O contents ranging from 5.8 wt% in the upper part of the reservoir to 3.6 wt% at thebottom, indicating that themagma reservoir (confined at ~4 kmdepth)wasmainlywater-undersaturated beforethe eruption, except for the topmost portion. Two types of anorthoclase crystals were identified. Type 1 crystalsshow reverse to oscillatory zoningwith An contents of 0.4–2.1mol% and Ba of 200–2000 ppm. They formed in themiddle/upper portion of the reservoir, where fractional crystallization processes dominated. Type 2 crystals,mainly present in the less evolved products, are characterized by patchy-zoned cores with large dissolutionpockets surrounded by thick oscillatory-zoned rims and show a wide compositional range (An of 0.5–4.7 mol%and Ba of 142–4824 ppm). Their zoning patterns, together with whole-rock and glass compositions of the juve-nile clasts, are consistent with the involvement of an anorthoclase-bearing cumulate from the bottom of the res-ervoir that underwent partial melting. Crystal dissolution was likely induced by the presence of a heat source atdepth, without any mass transfer to the eruptible magma, as suggested by the lack of petrographic and chemicalevidences of mixing between the resident comenditic trachyte and a mafic/intermediatemagma. Thermal insta-bility generated convective plumes that were responsible for the admittance of crystals from the cumulate levelinto the intermediate portions of the magma reservoir and possibly acted as trigger of the explosive eruption.
© 2017 Elsevier B.V. All rights reserved.
Keywords:AnorthoclaseZoning texturesTrace elementsCumulate re-meltingReservoir dynamics
1. Introduction
Petrological studies of volcanic products provide important insightsinto physical-chemical conditions in magmatic systems, eruption trig-gering mechanisms and eruptive styles. In modern petrology, the tex-tural and compositional analysis of crystal zonation is a powerful toolfor understanding the physical and chemical conditions of magma dur-ing its ascent and ponding at shallow crustal levels. Much research hasdealt with mineral zoning and corresponding petrogenetic processes,such as magma mixing, of varying degree and extent (e.g. Singer et al.,1995; Anderson, 2000; Eichelberger et al., 2000; Tepley et al., 2000;
riano).
Ginibre et al., 2002a, 2002b; Wallace and Bergantz, 2002; Humphreyset al., 2006; Druitt et al., 2012), recycling of crystal cumulates (e.g.Turner et al., 2003; Dungan and Davidson, 2004; Bacon andLowenstern, 2005; Wolff et al., 2015), changes in volatile pressure(PH2O, PCO2) during magma ascent (e.g. Geschwind and Rutherford,1995; Devine et al., 1998) or a combination of these.
Magma mixing is the most commonly invoked process to explainlarge textural and compositional variations in minerals. Pre-eruptivemixing in a reservoir can be favored by magma refilling or by thermaland chemical convection among layers of different compositions(Chen and Turner, 1980; Huppert and Sparks, 1980, 1984; Turner andCampbell, 1986; Bateman, 1995; Couch et al., 2001; Perugini and Poli,2012). Syn-eruptive magma mixing/mingling can also occur, both inthe reservoir and/or in the conduit during ascent towards the surface
45C. D'Oriano et al. / Journal of Volcanology and Geothermal Research 347 (2017) 44–63
(Di Vito et al., 2011; Landi et al., 2008; Tomiya et al., 2013; Pimentelet al., 2015).
Studies on mafic magmas have mainly focused on chemical varia-tions in plagioclase, an almost ubiquitous mineral phase in mafic to in-termediate magmas. Plagioclase chemical composition is highlysensitive to H2O and therefore it has great potential to record geochem-ical variations during magma rise and degassing (Anderson, 1983;Singer et al., 1995; Stewart and Fowler, 2001; Ginibre et al., 2002a,2002b; Zellmer et al., 2003; Landi et al., 2004; Viccaro et al., 2010;Shcherbakov et al., 2011). Most studies investigating pre-eruptive mag-matic processes in silicic reservoirs focused on zoning patterns in alkali-feldspars (e.g. Vernon, 1986; Wark and Stimac, 1992; Cox et al., 1996;Ginibre et al., 2004; Gaghevin et al., 2005) and on combining texturalcharacteristics with in-situ trace element data in sanidine (Ginibreet al., 2004; Bachmann et al., 2014). Although alkali-feldspar is the dom-inantmineral phase in silicic magmas, there are few experimental stud-ies on the relationship between their zoning patterns and variations inthe T-P-XH2O conditions in silicic systems (Fabbrizio and Carroll,2008), particularly in systems in which only alkali-feldspar crystallizes(Andújar et al., 2008, 2013).
In the Azores islands several trachytic pyroclastic deposits show ev-idence of complex magmatic processes but yet only a few have beenstudied in detail. Various processes have been proposed, includingprotracted fractional crystallization, magma mixing and mingling, andassimilation of crustal lithologies (e.g. Storey, 1981; Widom et al.,
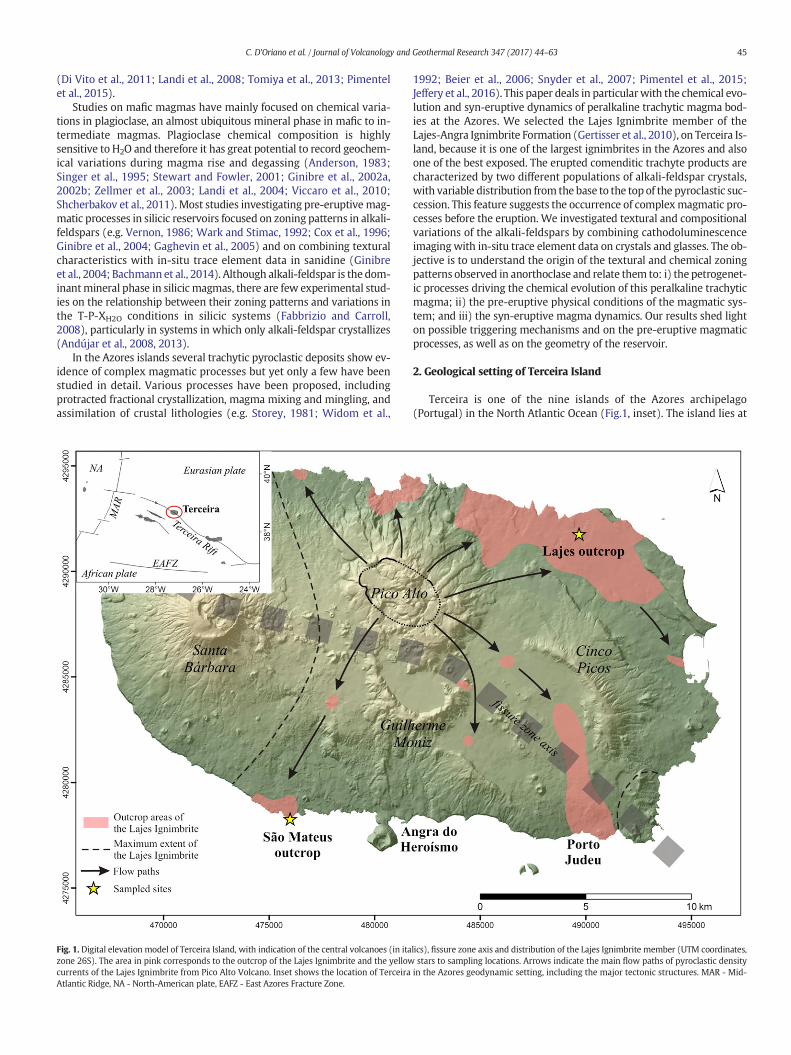
Fig. 1. Digital elevation model of Terceira Island, with indication of the central volcanoes (in itazone 26S). The area in pink corresponds to the outcrop of the Lajes Ignimbrite and the yellowcurrents of the Lajes Ignimbrite from Pico Alto Volcano. Inset shows the location of TerceiraAtlantic Ridge, NA - North-American plate, EAFZ - East Azores Fracture Zone.
1992; Beier et al., 2006; Snyder et al., 2007; Pimentel et al., 2015;Jeffery et al., 2016). This paper deals in particularwith the chemical evo-lution and syn-eruptive dynamics of peralkaline trachytic magma bod-ies at the Azores. We selected the Lajes Ignimbrite member of theLajes-Angra Ignimbrite Formation (Gertisser et al., 2010), on Terceira Is-land, because it is one of the largest ignimbrites in the Azores and alsoone of the best exposed. The erupted comenditic trachyte products arecharacterized by two different populations of alkali-feldspar crystals,with variable distribution from the base to the top of the pyroclastic suc-cession. This feature suggests the occurrence of complexmagmatic pro-cesses before the eruption. We investigated textural and compositionalvariations of the alkali-feldspars by combining cathodoluminescenceimagingwith in-situ trace element data on crystals and glasses. The ob-jective is to understand the origin of the textural and chemical zoningpatterns observed in anorthoclase and relate them to: i) the petrogenet-ic processes driving the chemical evolution of this peralkaline trachyticmagma; ii) the pre-eruptive physical conditions of the magmatic sys-tem; and iii) the syn-eruptive magma dynamics. Our results shed lighton possible triggering mechanisms and on the pre-eruptive magmaticprocesses, as well as on the geometry of the reservoir.
2. Geological setting of Terceira Island
Terceira is one of the nine islands of the Azores archipelago(Portugal) in the North Atlantic Ocean (Fig.1, inset). The island lies at
lics), fissure zone axis and distribution of the Lajes Ignimbrite member (UTM coordinates,stars to sampling locations. Arrows indicate the main flow paths of pyroclastic densityin the Azores geodynamic setting, including the major tectonic structures. MAR - Mid-

Fig. 2. Photos of Lajes Ignimbrite outcrops at (a) Lajes Village and (b) São Mateus, with the description of the different layers and the stratigraphic position (stars) of studied samples;dashed lines indicate the base of the ignimbrite. Insets (enlargement of the areas shown by the arrows) show details of the crystal-rich layer at the Lajes outcrop and the massive ashlayer at the São Mateus outcrop.
46 C. D'Oriano et al. / Journal of Volcanology and Geothermal Research 347 (2017) 44–63
the WNW-ESE trending hyper-slow spreading Terceira Rift (Vogt andJung, 2004), which corresponds to the northern limit of the diffuseboundary between the Eurasian and African lithospheric plates(Marques et al., 2015). Terceira Island consists of four central volcanoes(Cinco Picos, Guilherme Moniz, Pico Alto and Santa Bárbara) and a fis-sure zone (Fig.1) that emitted products ranging from basalts toperalkaline rhyolites. Cinco Picos and Guilherme Moniz volcanoes areconsidered extinct but they were active from N401 to ca. 280 kyrs agoand from N270 to ca. 110 kyrs ago, respectively (Féraud et al., 1980;Calvert et al., 2006; Hildenbrand et al., 2014). Cinco Picos mainly pro-duced mildly alkaline basaltic lavas, while Guilherme Moniz composi-tions range from basalt to peralkaline trachyte (Self and Gunn, 1976).The Pico Alto volcanic complex developed on the northern flank ofGuilherme Moniz N141 kyrs ago (Gertisser et al., 2010). Its activity hasbeen characterized by highly explosive events that produced extensiveperalkaline trachytic ignimbrites. However, in the last 21 kyrs the volca-nismwas dominated by the extrusion of lava domes and coulées of tra-chytic to peralkaline rhyolitic compositions (Self, 1976; Self and Gunn,1976; Mungall and Martin, 1995). Santa Bárbara, the youngest centralvolcano of the island, began to erupt ca. 65 kyrs ago (Hildenbrandet al., 2014) and has continued until 1761 CE, when a chain of lavadomes was extruded simultaneously with an eruption on the fissurezone (Pimentel et al., 2016). This volcanic complex is formed by basalticto peralkaline rhyolitic products (Self and Gunn, 1976; Mungall andMartin, 1995). The fissure zone (N43 kyrs; Calvert et al., 2006), WNW-ESE-oriented, is characterized by three segments marked by the align-ments of basaltic vents (Zanon and Pimentel, 2015). Besides the1761 CE eruption in the centre of the island, two other historical
eruptions occurred on the offshore segment of fissure zone in 1867 CEand 1998–2001 CE (Gaspar et al., 2003).
3. Overview of the Lajes-Angra Ignimbrite Formation
The stratigraphy of Terceira comprises seven major ignimbrite-bearing pyroclastic formations erupted between 86 and 21 kyrs ago(Gertisser et al., 2010), which result either from a single eruption or,more commonly, from closely-spaced in time eruptive events, inwhich case, are composed of different members. The youngest andmostwidespread is the Lajes-Angra Ignimbrite Formation, thatwas pro-duced during the last major ignimbrite-forming period of Pico Alto Vol-cano. This formation includes two distinct members. The AngraIgnimbritemember (0.06 km3DRE; Self, 1976) only crops out in a singlevalley on the southern part of the island, near Angra do Heroísmo town(Fig. 1). It is a thick (up to 14 m)monotonous ignimbrite, composed al-most totally of light gray, non-welded, massive lapilli-ash. Juvenileclasts are mainly light gray pumices, but porphyritic scoriae are alsofound. The Lajes Ignimbritemember (0.27 km3 DRE; Self, 1976) extendsto the northern and southern coasts of the island (Fig. 1), outcropping asdiscontinuous sheets of ignimbrite. The Lajes Ignimbrite floors thenamesake graben in the NE part of the island and crops out extensivelyalong the northern coastal areas. To the south, it crops out along thecoast at São Mateus and Porto Judeu villages (Fig. 1). This ignimbritehas a low aspect ratio, ranging in thickness from b1 m, up to 10 m in afew paleo-valleys. For most of its extent it is dark gray, welded andshows vertical lithofacies variations (see detailed description below).Juvenile clasts include mainly dark gray porphyritic scoriae, but also

Fig. 3. Chemical characteristics of the analyzed products: (a) Total alkali vs silica diagram (Le Bas et al., 1986) of whole-rocks (yellow stars for São Mateus samples and blue stars for Lajessamples) and glasses (other symbols); (b) Al2O3 vs FeOT (wt%) classification diagram for peralkaline rocks (Macdonald, 1974); (c) Ba (ppm) vs CaO (wt%); (d) Nb vs Zr (ppm). Error barsfor each diagram are shown as 2σ. Major elements analyses are normalized to 100 wt%, volatile-free. The prefix TERS of samples is omitted for simplification. WR = whole-rockcompositions. For comparison, whole-rocks of the Lajes-Angra Ignimbrite Formation from Gertisser et al. (2010) (black squares) and Jeffery (2016) (black circles) are shown.
47C. D'Oriano et al. / Journal of Volcanology and Geothermal Research 347 (2017) 44–63
black and dense vitrophyres (frequently formingfiamme) and, to a less-er extent, light gray pumices.
Presently available radiocarbon ages for the Angra Ignimbrite mem-ber range between 21,220 ± 120 (Gertisser et al., 2010) and 23,100 ±350 uncalibrated 14C years BP (Shotton and Williams, 1973), while forthe Lajes Ignimbrite member a wider age interval is reported between18,600 ± 650 (Shotton et al., 1974) and 23,150 ± 730 uncalibrated14C years BP (Gertisser et al., 2010), including high precision dating of21,130 ± 80 uncalibrated 14C years BP (Calvert et al., 2006).
The two ignimbrites were described by Self (1974, 1976) as theproducts of two separate eruptions of Pico Alto, based on a quarry out-crop in the centre of the island where the Lajes Ignimbrite was seenoverlaying the Angra Ignimbrite, separated by a thin soil (cf. Self,1971), and different radiocarbon ages (see above Shotton andWilliams, 1973; Shotton et al., 1974). Gertisser et al. (2010) joinedboth ignimbrites in the same formation due to the new overlapping ra-diocarbon ages and the lack of discriminatory field criteria. Consideringthe initial reports of Self (1971, 1974, 1976), the distinct characteristicsof the deposits (i.e. lithofacies), their spatial distribution and the con-straints of the available radiocarbon ages, the Lajes and Angra Ignim-brites are interpreted to record two pyroclastic density current-
forming eruptions of Pico Alto that occurred closely-spaced in time ca.21 kyrs ago (Pimentel, 2015).
We focus our study on the Lajes Ignimbrite alone, as it is themost vo-luminous, widespread and best exposed ignimbrite on the island. Ac-cording to Gertisser et al. (2010), this ignimbrite has a homogeneouscomenditic trachyte composition and is overall described as formed bytwo layers: the lower one is depleted in coarse juvenile clasts andwelded, with well-developed eutaxitic texture. The upper layer isthicker and richer in coarse juvenile clasts (up to 90 cm across) thanthe lower one. Very rare syenite cognate xenoliths are occasionallyfound.
In this study we highlight some differences between the northernand southern stratigraphic sequences of the Lajes Ignimbrite, based ontwo key outcrops (Fig. 1) where the base and the top of the ignimbriteare preserved (following the stratigraphic reconstruction of Pimentel,2015). These two outcrops are representative of the whole deposit:1) at Lajes Village (the type-locality initially described by Self, 1971),on the northern side of the island, the stratigraphic sequence startswith a ~5 cm-thick, crystal-rich, fines-depleted basal layer, overlain bya welded lapilli-ash layer, which grades upward to a coarse clast-bearing top layer (Fig. 2a); 2) at São Mateus Village (also identified in

Table 1Whole-rock major oxide and trace element composition.
Sample TERS17.I TERS17.T TERS62.I TERS62.T
Outcrop Lajes Lajes São Mateus São Mateus
Major elements (wt%), normalized to 100% volatile-free and FeOTOT
SiO2 65.95 64.90 66.27 65.20TiO2 0.64 0.62 0.63 0.70Al2O3 15.20 16.15 14.95 16.04FeO 4.64 4.42 4.66 4.16MnO 0.22 0.22 0.22 0.18MgO 0.43 0.38 0.41 0.58CaO 0.78 0.74 0.73 1.10Na2O 7.13 7.33 7.10 7.02K2O 4.92 5.15 4.93 4.87P2O5 0.10 0.09 0.09 0.14
Trace elements (ppm) from ICP-MSSc 4 3 3 4V b5 b5 b5 b5Zn 161 163 168 297Rb 99.05 105.5 101.5 68.9Sr 8.95 9.3 8 23.9Y 58 61.1 57.8 38.4Zr 673 710 690 407Nb 124 137 132.5 82.6Cs 0.775 0.84 0.83 0.54Ba 330 345 247 756La 76.05 80.7 77.4 52.5Ce 149.25 163.5 155 110Pr 16.82 17.75 16.95 12.05Nd 58.85 59 57.5 41.7Sm 12.07 12.75 11.85 8.4Eu 2.2 2.18 2.06 2.6Gd 10.75 11 11 7.91Tb 1.71 1.8 1.75 1.25Dy 10.35 10.65 11.05 7.17Ho 2.13 2.25 2.17 1.5Er 6 6.1 6.08 3.95Tm 0.82 0.9 0.9 0.56Yb 5.46 5.78 5.66 3.87Lu 0.79 0.77 0.77 0.5Hf 15.45 16.6 16.2 10.4Ta 7.8 8.5 8.2 4.9Pb 6 7 6 29Th 11 11.7 12 6.8U 3.49 3.87 3.88 2.43Eu/Eu* 0.59 0.56 0.55 0.98
48 C. D'Oriano et al. / Journal of Volcanology and Geothermal Research 347 (2017) 44–63
Self, 1974, 1976), on the southern coast, where the sequence starts witha 10–15 cm-thickmassive ash basal layer, which is overlain by a layer offine-grained, welded lapilli-ash, and by a coarser-grained layer at thetop (Fig. 2b).
4. Samples and analytical methods
Juvenile scoriae clasts (up to tens of cm across) were collected fromthe top (TERS17.T and TERS62.T) and intermediate layers (TERS17.I andTERS62.I) of both outcrops (Fig. 2). From the crystal-rich basal layer(TERS17.B) and the basal ash layer (TERS62.B) at Lajes and SãoMateus outcrops respectively, we collected pumice lapilli and loosecrystals. Due to their fine-grained nature (clasts b2–3 mm in size),pumice lapilli cannot be considered representative of the bulk com-position of the magma containing mm-sized crystals. In the absenceof samples suitable for whole-rock analyses, the chemical character-istics of both the basal layers were inferred from groundmass glassand mineral phases.
4.1. Whole-rock analyses
Whole-rock analyses of the scoriae clasts were performed at ALSlaboratory (Camas, Sevilla, Spain). The rock powders (0.2 g) wereadded to a lithium metaborate/lithium tetraborate flux (0.9 g),and fused in a furnace at 1000 °C. The resulting melts were dis-solved in 100 ml of 4% HNO3 / 2% HCl3 solution and then analyzedvia Inductively Coupled Plasma-Atomic Emission Spectrometry(ICP-AES) and Inductively Coupled Plasma-Mass Spectrometry(ICP-MS), for major and trace element composition, respectively.Accuracy is better than 2% for all major oxides, except MnO andK2O (5%), and better than 5% for all trace elements, except Nb(20%), Rb (14%), Ta (17%) and Heavy Rare Earth Elements (b10%)(Electronic Appendix 1).
4.2. Petrography and textural study
Loose crystals from both basal layers were selected for analyses. Inthe other samples, crystals were hand-picked from crushed scoriae inthe different size intervals (0.5–1, 1–2 and 2–4 mm). About 50–100feldspar crystals from each sample and scoria/pumice fragments wereembedded in epoxy resin and polished for textural and chemicalanalyses.
Textural features of crystals and groundmass glasses were investi-gated using images acquired by a Zeiss EVO MA 10 Scanning ElectronMicroscope (SEM) working in Back Scattered Electron (BSE) mode atthe Istituto Nazionale di Geofisica e Vulcanologia (INGV), Pisa (Italy)and using cathodoluminescence (CL) grayscale images (10 ms dwelltime) acquired by a JEOL JXA 8200 Superprobe Electron Microprobe atthe University of Milan (Italy).
The mineral modal abundance (vol%) and vesicle content (vol%) injuvenile clasts were determined by image analysis of thin sections col-lected under an optical microscope (~20–25 cm2 for each sample).The mafic microphenocrysts content (b500 μm in size) and themicrovesicularity were obtained by processing BSE images, covering atotal area of ~8–10 cm2.
4.3. Mineral and glass analyses
Major element composition of alkali-feldspars and matrix glasseswere analyzed using a JEOL JXA 8200 Superprobe Electron Microprobe(EMP) at the “ArditoDesio” Department of Earth Sciences, Universityof Milan, equipped with five Wavelength-Dispersive Spectrometers(WDS), and Energy Dispersive X-ray Spectroscope (EDS). A spot sizeof 5 μm with a beam current of 15 nA was used for alkali-feldspar.Groundmass glass (measured at N20 μm from crystals) and glassinfilling the corrosion pockets at the cores of large feldspars were
analyzed using a defocused beam of 10 μm with a beam current of2 nA. Counting times were 30 s for peak and 10 s for background mea-surements. Alkalis (K2O and Na2O) were measured first to minimizevolatilemigration. International standards were used to check the accu-racy of analyses, which is on average better than 1% for SiO2 and 5% forall other major elements, except alkalis (11%) (Electronic Appendix 1).Raw data were corrected applying a Phi-Rho-Z quantitative analysisprogram. The typical detection limit for each element is 0.02 wt%.
Major element composition of mafic mineral phases was performedusing a Zeiss EVO MA 10 SEM, equipped with an Oxford ISIS microana-lytical EDS system at INGV, Pisa (Italy). The analytical error is generallybetter than 2% for oxides with concentrations N10 wt%, better than 10%for oxides between 1 and 10wt% and better than 30% for concentrationsbelow 1 wt% (Electronic Appendix 1).
4.4. Laser ablation-ICP-MS analyses
Trace element compositions of alkali-feldspars and glasses were de-termined using the Laser Ablation-Inductively Coupled Plasma-MassSpectrometer (LA-ICP-MS) at INGV, Palermo (Italy). The laser is aGeoLasPro 193 nm Excimer system equipped with an Agilent 7500cequadrupole ICP-MS. The LA-ICP-MS working parameters are given inElectronic Appendix 2. Data were acquired in peak-jumping modewith one point per peak and a 10 ms dwell time. The total analysis

49C. D'Oriano et al. / Journal of Volcanology and Geothermal Research 347 (2017) 44–63
time was 2 min per spot, including 1 min for background acquisition.Plasma conditions were adjusted to oxide formation rates below 0.1%(monitored using the 248/232 mass ratio), preventing further oxidecorrections. NISTSRM 612 served as external standard and was mea-sured at the beginning and the end of each group of analyses (20–30sample measurements). 43Ca was used as internal standard for the geo-chemical reference materials (NISTSRM 612) and natural samples. Datawere collected in time-resolved graphics mode to check compositionalhomogeneity at the laser sampling scale and monitor inter-elementfractionation, and processed using the GLITTER program (VanAchterbergh et al., 2001). During each analytical session, accuracy waschecked by repeated measurements of BCR-2 basaltic reference glassfrom the USGS. Analyses were corrected for the fractionation index ob-tained by dividing the measured values (average of repeated analyses)of BCR-2 by its certified composition (Pearce et al., 2011). At 24–32μmspot size, analytical accuracy is better than 10% for all trace elements,except Li, Cs, Rb, Zn and Pb (10–20%) (Electronic Appendix 1).
5. Results
5.1. Whole-rock chemistry
Juvenile scoriae are comenditic trachyte (Fig. 3a, b) with SiO2 con-tents (normalized to 100 wt%, volatile-free) ranging from 64.9 to66.3 wt%, total alkalis (Na2O + K2O) from 11.9–12.5 wt% andPeralkaline Index [P.I. = molar (Na + K) / Al] between 1.05 and 1.14(Table 1). Scoriae from the top layer of the São Mateus outcrop(TERS62.T) show a less evolved compositional character, as suggestedby the CaO-rich and Ba-rich composition (Fig. 3c) and low Nb and Zr
Fig. 4. Spider diagrams of incompatible element concentrations in whole-rocks (WR) and g(a) Samples from the São Mateus outcrop; (b) Samples from the Lajes outcrop. The most evprefix TERS of samples is omitted for simplification. WR = whole-rock compositions; B = baliterature (Self and Gunn, 1976; Mungall and Martin, 1995; Beier et al., 2008; Gertisser et al., 2into rocks with Peralkaline Index (P.I.) N 1 (dark gray) and b1 (light gray), respectively.
contents (Fig. 3d). The sample is characterized by lower incompatibletrace element content, positive Ba and Pb anomalies, lack of negativeEu anomaly (Eu/Eu* is 0.98 in this sample, 0.55–0.59 in other samples),and shows a less fractionated trace element pattern with respect to theother samples (Fig. 4). Compositional variations of whole-rocks for allthe other samples are within the analytical error. Incompatible trace el-ements of all samples, normalized to primitive mantle values(McDonough and Sun, 1995), are enriched by a factor of 10–100; Srand Ba show a marked depletion (this latter in all samples exceptTERS62.T) (Fig. 4a, b).
The analyses cover the entire compositional range found byGertisser et al. (2010) and Jeffery (2016) (Fig. 3). Comparison betweencompositional trends in our rocks and the literature data on Terceira(Self and Gunn, 1976; Mungall and Martin, 1995; Beier et al., 2008;Gertisser et al., 2010; Madureira et al., 2011; Zanon and Pimentel,2015; Pimentel et al., 2016;) reveals that samples follow the differenti-ation path of rocks with P.I. N 1 (Fig. 4).
5.2. Petrography and alkali-feldspar textures
Scoriae and pumices (the latter only from both the basal layers) areporphyritic with a crystal content up to 30 vol% mostly consisting ofalkali-feldspar (19–30 vol%), plus a minor amount (b1 vol%) ofclinopyroxene, olivine, ilmenite, magnetite and apatite.
Lapilli-sized clasts from the basal layers of both outcrops vary fromdense vitrophyres to microlite-poor, glassy pumices (microlitesb5 vol%), with variable vesicle content. BSE images of the groundmasshighlight the occurrence of μm-sized bands of different shades of grayin a few clasts from the Lajes outcrop (sample TERS17.B), sometimes
lasses, normalized to the primitive mantle composition (McDonough and Sun, 1995).olved products found at the base of the sequence (17.Bev) are plotted separately. These; I = intermediate; T = top. Gray fields correspond to Terceira whole-rocks from the010; Madureira et al., 2011; Zanon and Pimentel, 2015; Pimentel et al., 2016) subdivided

Fig. 5. BSE - SEM images of groundmass textures. (a) Bands with different grayscales in the pumice from the crystal-rich basal layer; (b) example of eutaxitic texture in partially weldedlayers; (c) alternation of cryptocrystalline (clear gray) and glassy (dark gray) bands resulting from devitrification phenomena in partially welded (eutaxitic) samples.
50 C. D'Oriano et al. / Journal of Volcanology and Geothermal Research 347 (2017) 44–63
containing strongly deformed bubbles (Fig. 5a). Scoriae fromboth inter-mediate layers have crystal content between 19 and 30 vol%, a vesicu-larity index of 30–36 vol% and strongly stretched and folded vesicles,typical of welded deposits (Fig. 5b, c). These scoriae have texturally in-homogeneousmatrix glasses, with an overall eutaxitic texture, resultingfrom parallel bands of cryptocrystalline (devitrified) and dark glassy fil-aments, with thickness of tens and 15 μm, respectively (Fig. 5c). Thehigh degree of devitrification in the matrix of these intermediate sam-ples results in microscale (1–10 μm) inhomogeneity that precludesLA-ICP-MS trace element analysis (requiring a typical 20–25 μm spotsize). Scoriae from the topmost layers have crystal content between21 and 24 vol%, vesicularity of 50 vol% and a microlite-free, homoge-neous brown groundmass glass.
Alkali-feldspars are 0.5–2 mm across in the crystal-rich basallayer at the Lajes outcrop (TERS17.B) and up to 6–7 mm in all theother layers. Two types of anorthoclase crystals (hereafter referredto as Type 1 and Type 2) are distinguished based upon crystal morphol-ogy, zoning patterns and the presence of corrosion pockets at theircores (Figs. 6 and 7). CL interferometry highlights the occurrenceof zoning within crystals that is less marked in BSE images (Figs. 6aand 7a).
Type 1 crystals (b2 mm in size) are euhedral and elongated (Fig. 6).They are either melt inclusions-free or contain small, rounded melt in-clusions with a single shrinkage bubble. Type 1 crystals constitute theentire feldspar population at the basal layer of the Lajes outcrop andare predominant in the rest of the sequence, but are rare at the top ofthe São Mateus outcrop. These crystals show oscillatory zoning withconcentric bands of variable thickness and grayscales. Some boundariesbetween concentric bands are rounded or display wavy profiles due toresorption (Fig. 6a2, c).
Type 2 crystals can reach up to 7 mm in size and have tabular habit(Fig. 7). They often showdisequilibrium textures such as resorbed coresand embayments. The cores are characterized by the presence of large(several hundred μm-sized) and irregularly shaped corrosion pocketsinfilled by vesicular glass (Fig. 7a). Type 2 crystals represent the mostabundant alkali-feldspar population in the top layer at the São Mateus
outcrop, are present in minor amount in all other layers, and are absentat the base of the Lajes outcrop. The contact between crystals and glassin pockets commonly has a linear profile and is oftenmarked by a line ofFe-rich oxides (Fig. 7a) and dendritic overgrowths perpendicular to therims of glass pockets. Crystal cores are characterized by patchy textures:in CL images dark gray patches are rimmed by bright zoneswhich are inturn directly in contact with the infilled glass (Fig. 7b–d). The rim ofType 2 crystals (100–300 μm) shows fine-spaced oscillatory zoning(Fig. 7b, d).
5.3. Mineral chemistry
5.3.1. Alkali-feldsparsAlkali-feldspar compositions plot in the anorthoclase field (Fig. 8a, b;
Tables 2, 3). They show compositional variability (Ab64–71Or25–35An0–7)both at intra-sample scale and at the scale of the whole deposit, exceptat the base of the Lajes outcrop where the chemical data cluster aroundAb64–67Or31–35An0–2 (TERS17.B; Fig. 8a). EMP and LA-ICP-MS analysesare further used to correlate chemical heterogeneities with textural var-iations observed in CL and BSE images of the two types of crystals. Al-though there is no systematic correlation between brightness in CLimages and the chemical composition of minerals (Marshall, 1988), CLbrightness of the studied anorthoclases normally increases with in-creasing An and Ba contents (Figs. 6, 7).
Type 1 anorthoclase crystals show a positive correlation betweenAn (0.4–2.1mol%) and Ba, Sr, La and Eu contents (correlation coefficient,r2 N 0.8) (Fig. 9), whereas Rb is uncorrelated (Table 2). An-poor compo-sitions (b1mol%) are only present in crystals from the Lajes outcrop. Ba,Sr and Rb ranges are 200–2000ppm, 6–53 ppmand 12–55ppm, respec-tively (Fig. 9; Table 2). Rb/Sr is generally N1, except for the zones withAn = 0.9–2 mol% that are characterized by Rb/Sr~1. Rims of euhedralcrystals (i.e. considered in textural equilibrium with the groundmass)have a variable composition that covers the whole range of Type 1anorthoclase (Fig. 10, Table 2).
Type 2 anorthoclase crystals show larger An and Ba compositionalvariations than Type 1 (An = 0.5–4.7 mol%; Ba = 142–4824 ppm); Sr

Fig. 6. Example of zoning patterns in Type 1 anorthoclase crystals. White circles represent the LA-ICP-MS spot analyses. The numbers in brackets represent An (mol%) and Ba (ppm)contents, respectively. All images were collected with CL detector except for the image (a1) that is in BSE mode. Comparison between BSE and CL images (a1 and a2, respectively)reveals that heterogeneities in anorthoclase crystals appear strongly evident in CL images. Type 1 crystals typically show oscillatory-zoning patterns. Resorption occurs at someboundaries leaving wavy surfaces (a2) or rounded corners (c).
51C. D'Oriano et al. / Journal of Volcanology and Geothermal Research 347 (2017) 44–63
and Rb ranges are 4–110 ppm and 6.4–65 ppm, respectively (Fig. 9;Table 3). The same compositional variations are observed in cores andrims of crystals, with most of the rims having an intermediate Ancontent of 3.5 mol% (Fig. 10). Zones showing different brightness in CLimages have been associated with variations in An and Ba contents,being brighter portions generally An- and Ba-rich (An N 2.5 mol% andBa N 2000 ppm). Type 2 crystals larger than 2 mm are abundant at thetop layer of the São Mateus outcrop (TERS62.T) and show the leastevolved compositions and narrower variations (An = 2.4–4.7 mol%;Ba = 2170–4820 ppm) (Fig. 9). As a general rule, all crystals haveRb/Sr b 1, except for a few zones showing Rb/Sr N 1 (Table 3). Themost evolved Type 2 compositions overlap those of Type 1 in the sam-ples from the Lajes outcrop, whereas Type 2 crystals in samples fromthe São Mateus outcrop always have An N 1.4 mol% (Fig. 9). Rims withhigh contents of compatible element (Ba N 1800 ppm; Sr N 50 ppm)
are common in the least evolved sample (TERS62.T) and sporadic inthe other ones.
5.3.2. Mafic mineralsClinopyroxene and olivine occur both as isolated crystals (b1mm in
size), containing titanomagnetite, titanite and apatite as inclusionsor overgrowths on rims, and as glomerocrystic aggregates. Pyroxenesare euhedral and commonly show rounded, patchy coressuggesting dissolution events. They range from diopside tohedembergite (En24–37Fs19–33Wo40–43). Olivines are euhedral to anhedraland show variable compositions, from Fo28–38 in samples from the basaland intermediate layers to Fo40–47 in the sample from the top layer atthe São Mateus outcrop. Titanomagnetite and ilmenite can be found asmicrophenocrysts (100–300 μm) andmicrolites with a narrow composi-tional range (Usp61–65 and Ilm94–97, respectively; Electronic Appendix 3).

Fig. 7.Example of zoning patterns in Type 2 anorthoclase crystals.White circles represent the LA-ICP-MS spot analyses. Numbers represent An (mol%) and Ba (ppm) contents, respectively.(a) BSE image showing a crystal with large pockets infilled with vesicular glass. (b), (c) and (d) CL images showing patchy-zoned cores rimmed by a nearly homogeneous or oscillatory-zoned corona. Irregular and wavy resorption boundaries are common in the external outer rims (b300 μm).
52 C. D'Oriano et al. / Journal of Volcanology and Geothermal Research 347 (2017) 44–63
5.4. Glass composition
Groundmass glasses have comenditic trachyte composition withSiO2 ranging between 63 and 67wt% and P.I. = 1.0–1.3, and highly var-iable trace element content (Ba = 22–740 ppm; Zr = 500–2000 ppm)(Fig. 3; Tables 4 and 5). Primitive-mantle normalized incompatible ele-ment patterns (McDonough and Sun, 1995) indicate a fractionation ofHeavy Rare Earth Elements (Y→ Lu)with respect to Light Rare Earth El-ements (Sc → Gd) in all samples, with glasses from the Lajes outcrop
Fig. 8. Alkali-feldspar composition plotted in the An-Ab-Or classification d
showing the highest enrichment and pronounced Eu anomaly (Fig. 4a,b). Groundmass glasses from the crystal-rich basal layer at the Lajes out-crop have P.I. = 1.1–1.2, CaO = 0.5–0.6 wt%, Zr = 780–1330 ppm andBa=50–265 ppm (Fig. 3). This basal layer includes few highly vesicularpumices with more evolved compositions (TERS17.Bev in Fig. 4b),clustering around P.I. = 1.3, CaO = 0.4 wt%, Zr = 1900–2000 ppmand Ba = 20 ppm (Fig. 3c, d). The glassy matrices of the other samplesat the Lajes outcrop show minor variations (P.I. = 1.1–1.2 and CaO =0.5–0.7 wt%).
iagram. Samples from (a) the Lajes and (b) the São Mateus outcrops.

Table 2Major and trace element composition of selected Type 1 crystals.
Sample TERS17.B
TERS17.B
TERS17.B
TERS17.B
TERS17.B
TERS17.B
TERS17.I
TERS17.T
TERS17.T
TERS17.T
TERS17.T
TERS17.T
TERS62.B
TERS62.B
TERS62.B
TERS62.B
TERS62.I
TERS62.I
TERS62.T
TERS62.T
Feld2_2 Feld2B Feld2A Feld3_2 Feld3_1 Feld9_D Feld6B Feld1E Feld2E Feld2C Feld2A Feld7C Feld2n Feld2b Feld3n Feld3b Feld2n Feld2b Feld7C Feld4A
Core Core Rim Core Rim Core Rim Rim Core Core Rim Core Core Rim Core Rim Core Rim Core Rim
Major oxides (wt%) from EMPASiO2 66.20 65.98 66.49 66.34 66.22 66.44 67.23 66.64 66.77 67.21 66.76 66.84 66.95 67.21 66.73 66.29 68.07 66.57 66.56 65.81Al2O3 18.90 19.23 19.19 19.26 18.88 19.13 18.45 19.03 18.83 19.04 18.83 19.30 19.17 18.66 19.02 19.39 19.31 19.29 19.4 19.87Fe2O3 0.30 0.28 0.40 0.28 0.29 0.31 0.29 0.39 0.42 0.39 0.42 0.32 0.33 0.28 0.31 0.28 0.27 0.60 0.31 0.22CaO 0.31 0.33 0.27 0.30 0.26 0.15 0.26 0.20 0.10 0.17 0.20 0.42 0.18 0.22 0.40 0.36 0.29 0.24 0.36 0.32Na2O 7.80 7.83 8.14 7.68 7.60 7.67 7.22 7.67 7.52 7.37 7.66 7.66 7.61 7.53 7.49 7.69 7.62 7.23 7.88 7.86K2O 5.51 5.43 5.48 5.40 5.56 5.71 5.72 5.73 5.87 5.82 5.72 5.28 5.87 5.66 5.47 5.42 5.42 5.60 5.36 5.62
Structural formulaSi + Al + Fe3+ 3.99 3.99 3.99 4.00 3.99 3.99 4.00 3.99 3.99 4.00 3.99 4.00 4.00 4.00 4.01 4.01 4.01 4.02 3.99 4.00Ca + Na + K 1.01 1.01 1.03 0.99 1.00 1.00 0.97 1.00 0.99 0.98 1.00 0.98 1.00 0.99 0.98 1.00 0.97 0.96 1.00 1.02An 1.49 1.56 1.27 1.24 1.24 0.75 1.30 0.98 0.44 0.85 0.97 2.05 0.87 1.05 1.97 1.74 1.38 1.20 1.70 1.51Ab 67.25 67.59 68.42 66.67 66.67 66.62 64.88 66.39 65.78 65.22 66.40 67.38 65.76 66.21 66.21 67.13 65.60 65.45 67.91 66.98Or 31.26 30.84 30.31 32.01 32.09 32.63 32.82 32.63 33.78 33.93 32.62 30.56 33.37 32.74 31.82 31.13 33.02 33.35 30.39 31.51
Trace elements (ppm) from LA-ICP-MSSc 2.4 1.5 1.4 1.5 1.5 0.9 2.8 1.6 0.5 1.3 1.2 1.3 1.1 0.7 0.9 1.4 5.7 2.9 0.69 1.1Ti 319 322 265 261 250 186 212 249 125 222 265 345 208 233 371 433 310 236 262 308Cu 2.6 3.2 3.1 1.9 2.5 2.8 3.0 2.4 1.7 3.8 3.4 3.9 2.3 2.1 4.3 4.3 8.2 4.1 3.6 3.6Zn 3.8 2.1 1.7 2.4 2.3 1.3 1.5 2.7 0.7 2.2 1.2 2.2 0.8 2.2 2.2 3.0 2.9 1.6 2.3 1.7Rb 40 22 23 24 27 23 21 33 15 39 31 22 31 20 34 34 70 33 27 28Sr 35.0 44.0 27.3 25.9 25.6 9.5 20.7 16.5 6.0 13.3 15.5 53.5 9.1 29.1 27.0 33.6 12.6 16.5 36.3 26.2Y 0.04 0.05 0.04 0.03 0.03 bdl 0.09 0.05 bdl bdl 0.04 0.07 bdl 0.03 0.04 0.07 0.06 0.04 bdl 0.03Zr 0.09 0.07 0.08 0.05 0.04 0.03 0.06 0.04 bdl 0.23 0.12 0.08 bdl 0.03 bdl 0.04 bdl 0.13 bdl 0.03Nb 0.05 0.02 0.01 0.04 0.04 0.01 0.01 0.02 bdl bdl 0.04 bdl bdl bdl bdl bdl 0.03 bdl 0.07 bdlCs bdl 0.01 bdl 0.02 0.02 0.01 bdl 0.03 bdl bdl 0.02 bdl bdl bdl bdl bdl bdl bdl 0.05 bdlBa 945 1164 967 1022 949 317 777 772 203 380 583 1992 376 1393 1049 1997 408 776 1221 928La 1.11 1.49 1.21 1.22 1.06 0.57 0.71 0.92 0.30 0.53 0.85 2.01 0.49 0.73 1.19 1.11 0.56 0.81 1.70 1.35Ce 0.77 1.26 1.00 1.15 0.85 0.44 0.70 0.77 0.21 0.40 0.58 1.65 0.50 0.65 1.23 1.16 0.54 0.74 1.52 1.09Pr 0.04 0.07 0.06 0.06 0.07 0.02 0.04 0.05 bdl bdl bdl 0.09 0.02 0.03 0.05 0.07 0.03 0.03 0.08 0.07Nd 0.11 0.16 0.12 0.13 0.15 0.07 0.09 0.06 0.10 bdl bdl 0.22 bdl 0.15 bdl bdl bdl bdl 0.18 0.08Sm bdl bdl bdl bdl 0.06 bdl 0.15 bdl bdl bdl bdl bdl bdl bdl bdl bdl 0.14 bdl 0.012 bdlEu 2.45 2.41 2.00 2.1 1.94 1.10 1.54 1.88 0.62 1.04 1.62 3.05 0.94 1.28 2.07 2.41 1.18 1.50 2.49 2.14Gd bdl bdl bdl 0.05 bdl 0.02 bdl 0.06 bdl bdl bdl bdl 0.08 bdl bdl 0.13 bdl bdl bdl bdlPb 1.62 0.97 0.88 1.26 1.16 0.55 0.81 1.12 0.35 0.69 0.64 1.00 0.87 0.90 1.39 1.05 1.18 0.92 1.02 1.23Rb/Sr 1.13 0.50 0.84 0.93 1.1 2.46 0.99 1.99 2.54 2.93 2.03 0.42 3.37 0.66 1.25 1.01 5.60 2.01 0.74 1.05
bdl = below detection limit; An = molar (Ca/[Ca + Na + K]) ∗ 100; Ab = molar (Na/[Ca + Na + K]) ∗ 100; Or = molar (K/[Ca + Na + K]) ∗ 100.
53C.D
'Oriano
etal./JournalofVolcanology
andGeotherm
alResearch347
(2017)44–63
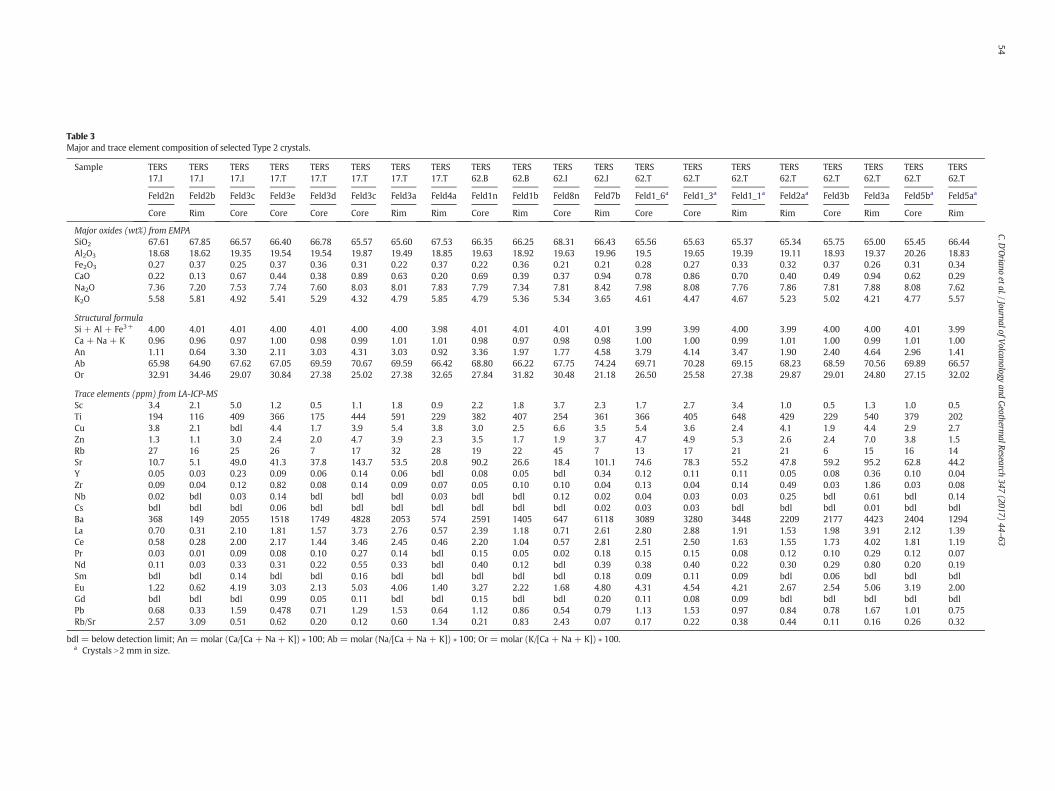
Table 3Major and trace element composition of selected Type 2 crystals.
Sample TERS17.I
TERS17.I
TERS17.I
TERS17.T
TERS17.T
TERS17.T
TERS17.T
TERS17.T
TERS62.B
TERS62.B
TERS62.I
TERS62.I
TERS62.T
TERS62.T
TERS62.T
TERS62.T
TERS62.T
TERS62.T
TERS62.T
TERS62.T
Feld2n Feld2b Feld3c Feld3e Feld3d Feld3c Feld3a Feld4a Feld1n Feld1b Feld8n Feld7b Feld1_6a Feld1_3a Feld1_1a Feld2aa Feld3b Feld3a Feld5ba Feld5aa
Core Rim Core Core Core Core Rim Rim Core Rim Core Rim Core Core Rim Rim Core Rim Core Rim
Major oxides (wt%) from EMPASiO2 67.61 67.85 66.57 66.40 66.78 65.57 65.60 67.53 66.35 66.25 68.31 66.43 65.56 65.63 65.37 65.34 65.75 65.00 65.45 66.44Al2O3 18.68 18.62 19.35 19.54 19.54 19.87 19.49 18.85 19.63 18.92 19.63 19.96 19.5 19.65 19.39 19.11 18.93 19.37 20.26 18.83Fe2O3 0.27 0.37 0.25 0.37 0.36 0.31 0.22 0.37 0.22 0.36 0.21 0.21 0.28 0.27 0.33 0.32 0.37 0.26 0.31 0.34CaO 0.22 0.13 0.67 0.44 0.38 0.89 0.63 0.20 0.69 0.39 0.37 0.94 0.78 0.86 0.70 0.40 0.49 0.94 0.62 0.29Na2O 7.36 7.20 7.53 7.74 7.60 8.03 8.01 7.83 7.79 7.34 7.81 8.42 7.98 8.08 7.76 7.86 7.81 7.88 8.08 7.62K2O 5.58 5.81 4.92 5.41 5.29 4.32 4.79 5.85 4.79 5.36 5.34 3.65 4.61 4.47 4.67 5.23 5.02 4.21 4.77 5.57
Structural formulaSi + Al + Fe3+ 4.00 4.01 4.01 4.00 4.01 4.00 4.00 3.98 4.01 4.01 4.01 4.01 3.99 3.99 4.00 3.99 4.00 4.00 4.01 3.99Ca + Na + K 0.96 0.96 0.97 1.00 0.98 0.99 1.01 1.01 0.98 0.97 0.98 0.98 1.00 1.00 0.99 1.01 1.00 0.99 1.01 1.00An 1.11 0.64 3.30 2.11 3.03 4.31 3.03 0.92 3.36 1.97 1.77 4.58 3.79 4.14 3.47 1.90 2.40 4.64 2.96 1.41Ab 65.98 64.90 67.62 67.05 69.59 70.67 69.59 66.42 68.80 66.22 67.75 74.24 69.71 70.28 69.15 68.23 68.59 70.56 69.89 66.57Or 32.91 34.46 29.07 30.84 27.38 25.02 27.38 32.65 27.84 31.82 30.48 21.18 26.50 25.58 27.38 29.87 29.01 24.80 27.15 32.02
Trace elements (ppm) from LA-ICP-MSSc 3.4 2.1 5.0 1.2 0.5 1.1 1.8 0.9 2.2 1.8 3.7 2.3 1.7 2.7 3.4 1.0 0.5 1.3 1.0 0.5Ti 194 116 409 366 175 444 591 229 382 407 254 361 366 405 648 429 229 540 379 202Cu 3.8 2.1 bdl 4.4 1.7 3.9 5.4 3.8 3.0 2.5 6.6 3.5 5.4 3.6 2.4 4.1 1.9 4.4 2.9 2.7Zn 1.3 1.1 3.0 2.4 2.0 4.7 3.9 2.3 3.5 1.7 1.9 3.7 4.7 4.9 5.3 2.6 2.4 7.0 3.8 1.5Rb 27 16 25 26 7 17 32 28 19 22 45 7 13 17 21 21 6 15 16 14Sr 10.7 5.1 49.0 41.3 37.8 143.7 53.5 20.8 90.2 26.6 18.4 101.1 74.6 78.3 55.2 47.8 59.2 95.2 62.8 44.2Y 0.05 0.03 0.23 0.09 0.06 0.14 0.06 bdl 0.08 0.05 bdl 0.34 0.12 0.11 0.11 0.05 0.08 0.36 0.10 0.04Zr 0.09 0.04 0.12 0.82 0.08 0.14 0.09 0.07 0.05 0.10 0.10 0.04 0.13 0.04 0.14 0.49 0.03 1.86 0.03 0.08Nb 0.02 bdl 0.03 0.14 bdl bdl bdl 0.03 bdl bdl 0.12 0.02 0.04 0.03 0.03 0.25 bdl 0.61 bdl 0.14Cs bdl bdl bdl 0.06 bdl bdl bdl bdl bdl bdl bdl 0.02 0.03 0.03 bdl bdl bdl 0.01 bdl bdlBa 368 149 2055 1518 1749 4828 2053 574 2591 1405 647 6118 3089 3280 3448 2209 2177 4423 2404 1294La 0.70 0.31 2.10 1.81 1.57 3.73 2.76 0.57 2.39 1.18 0.71 2.61 2.80 2.88 1.91 1.53 1.98 3.91 2.12 1.39Ce 0.58 0.28 2.00 2.17 1.44 3.46 2.45 0.46 2.20 1.04 0.57 2.81 2.51 2.50 1.63 1.55 1.73 4.02 1.81 1.19Pr 0.03 0.01 0.09 0.08 0.10 0.27 0.14 bdl 0.15 0.05 0.02 0.18 0.15 0.15 0.08 0.12 0.10 0.29 0.12 0.07Nd 0.11 0.03 0.33 0.31 0.22 0.55 0.33 bdl 0.40 0.12 bdl 0.39 0.38 0.40 0.22 0.30 0.29 0.80 0.20 0.19Sm bdl bdl 0.14 bdl bdl 0.16 bdl bdl bdl bdl bdl 0.18 0.09 0.11 0.09 bdl 0.06 bdl bdl bdlEu 1.22 0.62 4.19 3.03 2.13 5.03 4.06 1.40 3.27 2.22 1.68 4.80 4.31 4.54 4.21 2.67 2.54 5.06 3.19 2.00Gd bdl bdl bdl 0.99 0.05 0.11 bdl bdl 0.15 bdl bdl 0.20 0.11 0.08 0.09 bdl bdl bdl bdl bdlPb 0.68 0.33 1.59 0.478 0.71 1.29 1.53 0.64 1.12 0.86 0.54 0.79 1.13 1.53 0.97 0.84 0.78 1.67 1.01 0.75Rb/Sr 2.57 3.09 0.51 0.62 0.20 0.12 0.60 1.34 0.21 0.83 2.43 0.07 0.17 0.22 0.38 0.44 0.11 0.16 0.26 0.32
bdl = below detection limit; An = molar (Ca/[Ca + Na + K]) ∗ 100; Ab = molar (Na/[Ca + Na + K]) ∗ 100; Or = molar (K/[Ca + Na + K]) ∗ 100.a Crystals N2 mm in size.
54C.D
'Oriano
etal./JournalofVolcanology
andGeotherm
alResearch347
(2017)44–63

Fig. 9. Selected trace elements (Ba, Sr, La, Eu in ppm) variation vs An content (mol%) in anorthoclase from the Lajes outcrop (a, c, e, g) and the SãoMateus outcrop (b, d, f, h), respectively.Crossed box symbol represents Type 2 crystals N2mm from sample TERS62.T. The bars represent 2σ errors for high concentration of trace elements, while for low concentrations 2σ erroris smaller than the symbols.
55C. D'Oriano et al. / Journal of Volcanology and Geothermal Research 347 (2017) 44–63
Most of the analyzed glasses from the basal layer at the São Mateusoutcrop (TERS62.B) fall in the same compositional field of the glassesfrom samples of the Lajes outcrop. Conversely, glasses from scoriae atthe top of the São Mateus outcrop are less evolved, with CaO =0.8 wt%, lower Th, Ta, Zr and La (b80 ppm) and higher Ba (N360 ppm)(Figs. 3c, d and 4; Tables 4 and 5).
Fig. 10. Frequency histogramof Anvariation (mol%) in cores and rims of Type 1 and Type2crystals.
Glass in the corrosion pockets of Type 2 anorthoclase is commonlymicrolite-free, or rarely contains euhedral and zoned clinopyroxene,rare olivine, oxides and apatite microlites (up to 100 μm in size). Thechemical composition measured both in embayments and in corrosionpockets at the cores of crystals is the same as that of the externalgroundmass glass (Electronic Appendix 4). Glass pockets in the SãoMateus top layer (TERS62.T) show a lower content of Ba and Sr thenthe corresponding groundmass glass (Fig. 11), possibly due to post-entrapment crystallization on their rims.
6. Estimation of intensive parameters and water content
6.1. Thermometry and oxygen fugacity
The alkali-feldspar–melt geothermometer of Putirka (2008) wasused to estimate the magmatic temperature of our samples. For eachsample, we considered the composition of the anorthoclase rims andthe average composition of the surrounding groundmass glasses. Theequilibrium condition between mineral and melt compositions was de-termined bymeans of Or-Ab exchange between anorthoclases andmelt(Kfs-liqKdOr-Ab), (Mollo et al., 2015). Calculations reveal thatanorthoclases are mostly in equilibrium with the surrounding glasses,being the Kfs-liqKdOr-Ab within 0.1 and 0.3 (Fig.12a). Temperature esti-mates for this comenditic trachyte magma range from 850 to 900 °C(±23 °C according to Putirka, 2008), showing a systematic increasefrom the basal layers, at both outcrops, to the top of the São Mateus

Table 4Major oxide composition of selected groundmass glasses.
Sample TERS17.B TERS17.I TERS17.T TERS62.B TERS62.I TERS62.T
vt 1 vt 5 vt 12 vt 16 vt 1 vt 2 vt 3 vt 4 vt1 vt3 vt5 vt6 vt1 vt2 vt3 vt4 vt 1 vt 7 vt 9 vt 10 vt1 vt2 vt3
Original major oxides composition (wt%) from EMPASiO2 65.60 65.63 65.77 66.13 66.07 65.80 66.1 66.3 65.02 65.08 64.70 64.70 65.43 65.93 66.01 65.48 66.08 65.10 65.60 65.18 63.76 63.25 64.45TiO2 0.55 0.61 0.52 0.41 0.58 0.50 0.56 0.61 0.54 0.56 0.55 0.57 0.61 0.55 0.59 0.52 0.72 0.58 0.55 0.34 0.51 0.74 0.65Al2O3 15.56 14.35 15.48 12.86 15.02 14.67 15.05 14.83 15.34 15.29 15.61 15.36 14.82 14.97 14.94 15.01 15.28 14.84 14.96 14.78 15.57 15.59 16.08FeO 4.57 5.60 4.65 5.98 4.11 4.05 4.13 4.01 4.78 4.74 4.61 4.53 4.45 4.53 4.54 4.36 4.71 4.64 4.93 4.31 3.76 4.36 4.16MnO 0.23 0.26 0.19 0.24 0.21 0.24 0.19 0.20 0.21 0.21 0.16 0.22 0.20 0.20 0.19 0.18 0.20 0.17 0.27 0.26 0.16 0.20 0.16MgO 0.32 0.38 0.32 0.19 0.36 0.36 0.35 0.37 0.33 0.36 0.36 0.34 0.38 0.34 0.40 0.37 0.45 0.48 0.38 0.36 0.38 0.43 0.45CaO 0.59 0.64 0.53 0.42 0.71 0.59 0.69 0.60 0.60 0.60 0.60 0.54 0.56 0.54 0.58 0.58 0.70 0.56 0.70 0.69 0.64 0.79 0.78Na2O 6.94 6.95 6.94 7.28 6.52 7.07 6.79 6.57 7.59 7.49 7.51 7.47 6.19 6.17 6.64 6.34 7.28 7.26 7.31 7.22 6.66 7.05 7.28K2O 5.31 4.99 4.99 4.59 5.19 4.96 5.15 5.17 5.02 5.06 5.12 5.11 5.02 4.97 5.01 4.97 5.02 5.02 5.02 4.81 5.60 5.04 5.06P2O5 0.08 0.06 0.05 0.06 0.06 0.06 0.06 0.06 0.09 0.07 0.15 0.07 0.04 0.07 0.05 0.06 0.00 0.25 0.00 0.30 0.05 0.12 0.06Analytical total 99.75 99.45 99.41 98.15 98.83 98.32 99.06 98.72 99.51 99.47 99.36 98.91 97.69 98.28 98.95 97.87 100.44 98.90 99.72 98.25 97.08 97.54 99.11
Major oxides (wt%) normalized to 100%SiO2 65.76 65.98 65.15 67.37 66.85 66.93 66.73 67.16 65.34 65.43 65.12 65.41 66.98 67.08 66.71 66.90 65.79 65.82 65.78 66.34 65.67 64.84 65.03TiO2 0.55 0.61 0.52 0.41 0.59 0.51 0.57 0.62 0.54 0.56 0.55 0.61 0.62 0.56 0.60 0.53 0.72 0.59 0.55 0.35 0.53 0.75 0.66Al2O3 15.60 14.42 15.57 13.10 15.20 14.92 15.19 15.02 15.41 15.38 15.71 15.50 15.17 15.23 15.10 15.34 15.21 15.01 15.00 15.04 16.03 15.98 16.22FeO 4.58 5.63 4.68 6.10 4.16 4.12 4.17 4.06 4.80 4.77 4.64 4.53 4.56 4.61 4.59 4.45 4.69 4.69 4.94 4.39 3.87 4.47 4.19MnO 0.23 0.26 0.19 0.25 0.21 0.25 0.19 0.21 0.21 0.21 0.16 0.22 0.21 0.21 0.20 0.18 0.20 0.17 0.27 0.26 0.17 0.21 0.16MgO 0.33 0.38 0.32 0.19 0.36 0.37 0.35 0.38 0.33 0.36 0.37 0.33 0.38 0.35 0.40 0.38 0.45 0.49 0.38 0.37 0.40 0.44 0.46CaO 0.59 0.65 0.53 0.43 0.72 0.60 0.69 0.61 0.60 0.60 0.60 0.54 0.57 0.55 0.59 0.59 0.70 0.57 0.70 0.70 0.66 0.80 0.78Na2O 6.96 6.99 6.98 7.41 6.60 7.19 6.85 6.66 7.63 7.53 7.56 7.61 6.34 6.28 6.71 6.48 7.25 7.34 7.33 7.35 6.86 7.23 7.34K2O 5.32 5.01 5.02 4.67 5.25 5.04 5.20 5.24 5.04 5.09 5.15 5.16 5.14 5.06 5.06 5.08 5.00 5.08 5.03 4.90 5.76 5.17 5.11P2O5 0.08 0.06 0.05 0.06 0.05 0.04 0.05 0.04 0.09 0.07 0.15 0.09 0.04 0.07 0.05 0.06 0.00 0.25 0.00 0.31 0.05 0.12 0.06Total 100.00 100.00 100.00 100.00 100.00 100.00 100.00 100.00 100.00 100.00 100.00 100.00 100.00 100.00 100.00 100.00 100.00 100.00 100.00 100.00 100.00 100.00 100.00P.I. 1.10 1.17 1.09 1.32 1.09 1.16 1.11 1.11 1.17 1.16 1.15 1.16 1.05 1.04 1.09 1.05 1.14 1.17 1.17 1.16 1.09 1.09 1.09
P.I. = molar [(Na + K) / Al].
56C.D
'Oriano
etal./JournalofVolcanology
andGeotherm
alResearch347
(2017)44–63

Table 5Trace element composition of selected groundmass glasses from LA-ICP-MS analysis.
Sample TERS17.B TERS17.T TERS62.B TERS62.T
Li 22 29 21 40 22 19 18 21 19 16 22 29 10 14 15Sc 6.0 6.8 5.5 4.7 6.4 6.1 6.1 5.6 3.9 4.1 4.6 5.3 6.0 6.9 6.7V 0.72 0.59 0.54 0.23 0.53 0.58 0.77 0.49 0.45 0.44 0.42 1.42 1.05 1.39 1.13Rb 116 142 118 190 128 124 112 122 95 108 119 136 76 95 86Sr 6 2 7 6 4 5 5 4 4 11 3 9 8 10 9Y 83 115 81 157 90 86 79 80 49 47 69 80 56 65 63Zr 970 1327 963 1952 1034 995 894 935 580 566 794 881 574 673 644Nb 187 239 193 338 200 191 174 180 117 118 150 163 116 137 130Cs 0.90 1.17 0.93 1.78 1.02 0.98 0.88 0.97 0.83 0.89 1.03 1.38 0.53 0.66 0.60Ba 200 51 159 35 170 170 220 161 92 445 122 151 396 469 459La 96 133 95 182 106 103 93 95 64 59 87 100 66 73 74Ce 188 259 179 343 204 200 181 182 124 121 168 183 130 155 148Pr 20.9 28.7 20.3 38.0 22.8 22.2 20.3 20.7 13.4 12.9 18.0 21.1 15.0 17.5 16.7Nd 76 107 75 139 84 82 74 74 50 46 68 80 56 67 63Sm 15.5 19.7 15.1 26.8 16.3 15.9 15.0 14.7 9.8 9.0 14.0 14.7 11.2 13.1 12.8Eu 2.37 2.74 2.11 2.91 2.38 2.41 2.26 2.27 1.41 2.01 1.80 2.16 2.26 2.75 2.66Gd 13.90 18.70 13.32 25.08 14.84 14.68 13.63 13.40 8.89 6.94 11.77 14.38 10.50 12.21 11.34Tb 2.34 3.29 2.30 4.45 2.52 2.48 2.24 2.26 1.29 1.27 1.92 2.23 1.67 2.01 1.91Dy 14.00 20.84 14.51 26.28 15.76 15.16 13.57 14.02 8.83 8.99 13.46 14.93 10.16 11.78 11.30Ho 2.81 4.15 2.76 5.35 3.02 2.99 2.65 2.81 1.78 1.74 2.62 3.25 2.00 2.35 2.26Er 8.23 10.93 7.83 15.00 8.52 8.31 7.74 7.72 5.26 4.86 7.79 8.91 5.33 6.35 3.33Tm 1.17 1.75 1.25 2.33 1.33 1.30 1.17 1.20 0.79 0.69 1.20 1.28 0.83 1.01 0.96Yb 7.90 11.11 7.64 14.56 8.59 7.92 7.26 7.34 5.27 4.84 7.41 8.84 5.11 6.02 5.84Lu 1.15 1.70 1.08 2.19 1.25 1.24 1.11 1.13 0.69 0.79 1.12 1.25 0.78 0.88 0.86Hf 21.69 30.87 21.62 44.17 23.03 22.28 20.08 20.93 12.93 13.03 18.26 19.40 13.45 15.69 15.15Ta 10.06 13.79 10.14 1.96 10.52 10.13 9.29 9.53 6.70 7.37 9.48 10.07 6.31 7.49 6.97Pb 7.55 9.50 7.68 15.32 8.41 9.07 8.10 12.06 7.44 9.38 6.97 8.73 4.95 6.27 5.53Th 14.12 19.53 14.28 28.72 15.08 14.45 13.17 13.70 9.11 9.17 13.06 14.41 8.70 10.23 9.66U 4.69 6.24 4.59 8.79 4.81 4.58 4.23 4.38 3.31 3.17 4.10 4.30 2.66 3.15 3.03Eu/Eu* 0.49 0.44 0.45 0.34 0.47 0.48 0.48 0.49 0.46 0.78 0.43 0.45 0.64 0.66 0.67
Eu/Eu* = [(EuCN) / (SmCNGdCN)1/2].
57C. D'Oriano et al. / Journal of Volcanology and Geothermal Research 347 (2017) 44–63
outcrop, with the intermediate layers giving intermediate temperatures(Fig.12b).
Pre-eruptive temperature and oxygen fugacity values were alsoestimated using the Fe-Ti oxide geothermometer of Ghiorso andEvans (2008) and, for comparison, the QUILF (Andersen et al., 1993)and ILMAT (Lepage, 2003) geothermometers. All the analyzedtitanomagnetite-ilmenite pairs overlap the equilibrium envelope ofBacon and Hirschmann (1988). However, they show positive correla-tion of aTiO2liquid-rutile vs temperature which, according to Ghiorso andGualda (2013), indicates a possible re-equilibration or disequilibriumof the titanomagnetite-ilmenite pairs (Electronic Appendix 3). Ghiorso
Fig. 11. Bivariate diagrams of selected trace element in glasses infilling (IG) corrosion pocketcomparison. Error bars for each diagram are shown.
and Evans (2008) suggest to compare temperature estimates obtainedfrom the Fe+2-Mg exchange between the two oxideswith those obtain-ed from Fe+2Ti-(Fe+3)2-exchange. Only 5 oxide pairs satisfy this equi-librium and give a temperature range from 786 to 865 °C (and ΔNNOfrom −2.4 and −1.8) (Electronic Appendix 3 and Electronic Appendix5). Calculations obtained with the calibration of Ghiorso and Evans(2008) return temperatures that equate to those from QUILF andILMAT (although slightly hotter). These temperature estimates are upto 60 °C lower than those obtained with the alkali-feldspar–melt ther-mometry and are more variable (Electronic Appendix 3 and ElectronicAppendix 5). Considering that a temperature range of 50–100 °C is
s in Type 2 crystals. Fields enclosing the groundmass glass compositions is reported for

Fig. 12. (a) Measured vs predicted Kfs-liqKdOr-Ab between alkali-feldspars and groundmass glass compositions. (b) temperature vs H2O (wt%), estimated from alkali-feldspar–meltgeothermometer of Putirka (2008) and alkali-feldspars-melt hygrometer of Mollo et al. (2015), respectively. The uncertainty is ±23 °C for temperature and ±0.75 wt% for H2O.Symbols as in Fig. 9.
58 C. D'Oriano et al. / Journal of Volcanology and Geothermal Research 347 (2017) 44–63
within the analytical error for Fe-Ti oxides (Ghiorso and Evans, 2008),these results can be considered comparable to those obtained with thealkali-feldspar–melt thermometer of Putirka (2008).
6.2. Water content
Water content estimates were obtained using the alkali-feldspar–melt hygrometer of Mollo et al. (2015) and considering the averagecomposition of groundmass glass and the composition of anorthoclasecrystal rims (b100 μm) in each sample. The composition of highlyevolved glasses in pumices from the crystal-rich basal layer at theLajes outcrop (TERS17.Bev) was not considered for this calculation be-cause these glasses are not in equilibrium with the analyzed feldspars.The average temperature obtained with the model of Putirka (2008) isused as input value.
For the crystal-rich basal layer of the Lajes outcrop, calculationsyielded water contents ranging from 4.9 to 5.8 wt% (±0.75 wt%)(Fig. 12b), while the least evolved sample at the top of the São Mateusoutcrop yielded water contents from 3.6 to 5.1 (± 0.75 wt%) wt%. Theother samples provided intermediate water contents (Fig. 12b). Overallresults indicate a decrease in the water content from the crystal-richbasal layer at Lajes to the top layer at São Mateus outcrops.
7. Discussion
In the following sections we discuss the physical-chemical condi-tions of the magma reservoir, paying special attention to the informa-tion resulting from the textural and compositional analyses ofanorthoclase crystals. The aim is a better understanding of the magmaevolution and the pre- and syn-eruptive dynamics responsible for thedifferences observed among the samples of the two outcrops.
7.1. Chemical zoning of the magma reservoir
The overall constant major element composition of whole-rock andglasses of the samples across the two studied outcrops suggests theemission of a broadly homogeneous batch of comenditic trachytemagma during the Lajes Ignimbrite eruption. However, the trace ele-ment chemistry together with anorthoclase features show significantvariability that raises the hypothesis of the presence of a zonedmagma reservoir. The distinctive characteristics of the samples fromthe crystal-rich basal layer at the Lajes outcrop (TERS17.B) and the toplayer at the São Mateus outcrop (TERS62.T) reveal melt differentiationat different thermometric and hygrometric conditions (Fig. 12b).These samples represent two end-members (more evolved and less
evolved, respectively) of the same magma batch emitted at differentstages of the eruption. Moreover, the anomalously high CaO, Ba andPb, low Nb and Zr contents and absence of Eu anomaly in sampleTERS62.T suggest the occurrence of more complex petrogenetic pro-cesses (discussed later). All the other samples are quite homogeneousandwith intermediate composition, temperature andwater content be-tween the two end-members. The basal ash layer and thewelded inter-mediate layer of the São Mateus outcrop are compositionally correlatedwith the intermediate and top layers of the Lajes outcrop, respectively.
From a compositional point of view, the Lajes Ignimbrite records azonedmagma reservoir formed by amain body of intermediate compo-sition, confined between a less evolved bottom layer and a thin, evolvedcap with a pre-eruptive temperature gradient of at least 50 °C and awater content that increased from b4 wt% at the bottom to 4.9–5.8 wt% at the top.
A water content as high as 4.9–5.8 wt% in trachytic magma implies aminimum confining pressure of ∼1.3–1.7 kbar (calculated withalphaMELT and following Papale et al., 2006) under H2O saturation con-ditions and assumingCO2 b 50ppm. At this pressure (~ 4 kmdepth, con-sidering a country-rock density of 2500 kg/m3; Zanon and Pimentel,2015), only the magma residing at the top of the reservoir reachedwater-saturated conditions, whereas most of the comenditic trachytemagma involved in the Lajes Ignimbrite, with lower water contents,have to be considered water-undersaturated.
7.2. Origin of Type 1 and Type 2 anorthoclases
Type 1 and Type 2 anorthoclases are found in the two studied out-crops, with different abundances throughout the stratigraphic se-quence. Their textures and compositions reflect variable solidificationconditions of the respective hosting products across the zoned magmareservoir. In the first phase of eruption Type 1 is dominant and is theonly type present in the crystal-rich basal layer at the Lajes outcrop,whereas in late-erupted products Type 2 crystals are prevalent.
7.2.1. Type 1The main characteristic of Type 1 anorthoclase crystals is the occur-
rence of reverse to oscillatory zoning that, according to experimentalworks, can be caused by variations in temperature, water content and/or composition of the host melt. The effects of temperature and meltwater content on the exchange reaction between Ab, An and Or compo-nents in anorthoclase are not yet well constrained in trachytic systemswith only one feldspar, as most experimental works focus on systemswith two feldspars (Carmichael, 1963; Nekvasil, 1992, 1994; Arzilliand Carroll, 2013) or containing only plagioclase (Lange et al., 2009

Fig. 13. Trace element modeling using Rb and Ba. The prefix TERS of samples is omitted for simplification. Partition coefficients between alkali-feldspar and melts are from Mahood andStimac (1990) for peralkaline trachytes (KdBa = 5.4; KdRb = 0.18). (a) Rayleigh crystal fractionation liquid lines of descent starting from the whole-rock and glass compositions ofTERS62.T and whole-rock of TERS17.T. Symbols as in Fig. 3. Ticks mark 10% increments of crystallization starting from the initial composition. (b) Partial melting of anorthoclasecrystals with different compositions. Residual solid and accumulated melt fractions are shown for 10% melting, ranging from F = 0.9–0.1. The light gray field represents thecomposition of Type 2 crystals, while the dark gray field is the composition of Type 1 crystals. WR = whole-rock.
59C. D'Oriano et al. / Journal of Volcanology and Geothermal Research 347 (2017) 44–63
and references therein), or on phonolites containing anorthoclase(Andújar et al., 2013). Although these experimental works yield con-trasting results, they show that, in addition to the composition of themelt, both temperature and melt water content can affect the composi-tion of anorthoclase. In particular, an anorthoclase characterized by lowAn and relatively high Or contents is stable at relatively low tempera-ture, as that ascribed to the sample from the base of the Lajes outcrop.The composition of anorthoclase crystals extracted from the intermedi-ate layers at both outcrops, and representative of the middle portion ofthe magma body, moves towards An-rich and Or-poor compositions inresponse to an increase of temperature. The decrease in water contentfrom the upper (4.9–5.8 wt%) to the middle portions of the reservoir(~5 wt%) may enhance the increase in An content in anorthoclase, assuggested by Nekvasil (1992, 1994) (see also Ginibre et al., 2004).Free crystals that are able to move repeatedly from the topmost to themiddle portion of the reservoir, due to chemical convection, may ac-quire the compositional features of Type 1 crystals. Intermediate trendscan be observed, depending on whether changes in temperature andwater content or melt differentiation prevail; this may produce the os-cillatory zoning pattern of Type 1 crystals in a highly dynamic magmareservoir.
The lack of anorthoclase with An b1 mol% in samples from the SãoMateus outcrop and their abundance at the base of the Lajes outcrop
provide further evidence that such crystals formed preferentially inthe more evolved portion of the reservoir. Most likely, crystals withvery low An content (b1mol%) formed at the topmost part of the reser-voir close to the crystallization front.
7.2.2. Type 2The main characteristics of these anorthoclase crystals are repre-
sented by large patchy-zoned cores, corrosion pockets filled by glassand inclusion-free rims with oscillatory zoning, frequently crosscut byembayments. The An- and Ba-rich Type 2 anorthoclase (An N3 mol%;Ba N2000 ppm) aremostly found at the top layer of the SãoMateus out-crop. The geochemical signature of Type 2 crystals suggests that theywere derived from a level of the reservoir different from that of Type 1crystals, as the Rb/Sr of Type 2 anorthoclase is generally b1, differingdistinctly from that of Type 1 (Rb/Sr N 1). These features suggest thatType 2 anorthoclase crystals formed at the lower portion of the reser-voir, where less evolved melts ponded and likely generated a cumulatezone. The corrosion pockets present within the cores of the crystals in-dicate that important dissolution events occurred, which may also beresponsible for the development of patchy zoned textures (Vance,1965; Nakamura and Shimakita, 1998). The An- and Ba-poor patcheslikely represent remnants of the composition of the original crystals(CL-dark cores in Fig. 7), whereas the An- and Ba-rich zones (CL-bright

Fig. 14. Schematic transect of themagma reservoir beneath Pico Alto Volcano, showing (a) and (b) pre-eruptive and (c) syn-eruptive petrogenetic processes related to the eruption of theLajes Ignimbrite (see text for details).
60 C. D'Oriano et al. / Journal of Volcanology and Geothermal Research 347 (2017) 44–63
zones in Fig. 7), commonly in contact with the glass intruded in thepockets, represent the feldspar crystallized after partial resorption. Themost evolved cores of the largest crystals, characterized by a maximumAn content of 3 mol% and Ba of 2000 ppm, therefore underwent disso-lution (Fig. 7).
Crystal dissolution is awell-documented process in severalmagmat-ic systems and has been linked to decreasing PH2O (Humphreys et al.,
2006), diffusion-controlled dissolution (Nakamura and Shimakita,1998) or local changes in composition and temperature of the melt(Landi et al., 2004; Bachmann and Bergantz, 2006; Métrich et al.,2015). We can exclude that dissolution occurred in response todegassing (i.e. decreasing in PH2O) because this would imply that theless evolved portions of the crystals were subjected to dissolution dur-ingmagmaascent, in contrast to ourfindings (dissolution of the evolved

61C. D'Oriano et al. / Journal of Volcanology and Geothermal Research 347 (2017) 44–63
portion of the crystals). Likewise, dissolution controlled by diffusionprocess can be excluded as this generates sieve textures rather thanembayed cores.
In the studied samples, there are no evidence of mixing between theresident comenditic trachyte magma and a mafic/intermediate magmasuch as mafic enclaves or heterogeneous mineral assemblage, or inho-mogeneous glass compositions.We therefore conclude that the dissolu-tion of Type 2 anorthoclase crystals was likely determined by atemperature increase that originated at the bottom of the reservoirthrough reheating and partial melting of a cumulate. Thus, we hypoth-esize that the ascent of a undisclosed hotter magma from depth actedas a heat source beneath the eruptible trachytic magma body, withoutphysical or chemical mixing (Couch et al., 2001; Bachmann et al.,2014; Wolff et al., 2015). Alternatively the heat source may be ascribedto the upwardmigration of hot volatile phase (Bachmann and Bergantz,2006). Thermal rejuvenation of cumulates has been identified in manysilicic systems as a possible mechanism triggering highly explosiveeruptions (Wolff et al., 2015).
7.3. Chemical evolution of the magma reservoir
7.3.1. Evidence for crystal fractionationRayleigh fractional crystallization was computed using
PETROMODEL spreadsheet (Ersoy, 2013) and the partition coefficientsbetween alkali-feldspar and melts given in Mahood and Stimac (1990)for peralkaline trachytes (KdBa = 5.4; KdRb = 0.18). Simulationsstarting from the whole-rock composition of the less evolved sample(TERS62.T) give a liquid line of descent that does not fit the groundmassnor the whole-rock compositions of the other samples (Fig. 13a). Bycontrast, the crystal fractionation model gives good results when thecomposition of the least evolved groundmass glass in TERS62.T(Fig. 13a) is taken as the starting melt: the whole-rock composition ofthe other samples (TERS17.T, TERS17.I and TERS62.I) can be reproducedby ~10 wt% fractional crystallization of anorthoclase (Fig. 13a). The liq-uid line of descent fits the groundmass compositions, in accordancewith mineral modal abundance, and the trace element composition ofthe glassy matrices are obtained from the respective whole-rocks after20–25 wt% removal of anorthoclase. The maximum degree of crystalli-zation is shown by the most evolved glass found in TERS17.Bev (Zr~2000 ppm), which accounts for 60–70 wt% crystal fractionation. Thisevolvedmelt may have formed through extensive crystallizationwithinthe solidification front at the top of the magma reservoir.
7.3.2. Effect of cumulate re-meltingThe previous calculations indicate that crystal fractionation can ex-
plain most of the chemical variations of the magma emitted duringthe Lajes Ignimbrite eruption, except for the final extruded portion re-corded by the top layer of the São Mateus outcrop. The high contentsof CaO, Ba and Pb, the lack of Eu anomaly in TERS62.T and the textureof the anorthoclase crystals suggest that important processes of feldsparaccumulation/assimilation may have occurred at the base of thereservoir.
A process of anorthoclase-bearing cumulate partial-melting wassimulated with PETROMODEL (simulations of modal batch meltingwere performed). During this process the residual melt remains inchemical equilibriumwith the cumulate and the proportion of feldsparsthat undergo melting does not change (i.e. the bulk partition coeffi-cients of trace elements are constant during the process). The resultingliquid and the residual solids show a large compositional variability de-pending on the starting composition of the anorthoclase participating inthe melting process (Fig. 13b). Type 2 crystals with Ba N2000 ppm,which in the previous section were assumed to crystallize after resorp-tion, can be perfectly reproduced by the curves of solid residues. Cumu-late melting provides a ready solution to the peculiar geochemistry ofsample TERS62.T, because the least evolved, late-erupted magma canbe considered not as parental to the most enriched liquids, but a
cumulus melt. The groundmass glass in TERS62.T results from mixingbetween the liquids originated by cumulatemelting and residual liquidsafter crystal fractionation (Fig. 13b).
The composition of the glass infilling the corrosion pockets, formedduring resorption of Type 2 crystals, should correspond to that of themelt produced by partial dissolution of cumulus anorthoclase. Indeed,these compositions partially overlap the composition of the ground-mass glass of the sample from which crystals were collected. This sug-gests that the corrosion pockets were connected to the groundmassmelt for extended periods of time (Blundy and Cashman, 2005),allowing mixing with the surrounding melt. The resulting compositionwas also affected by crystallization of anortholcase on the rim of theglass pockets.
Trachytic magmas showing anomalous high concentrations of Ba,positive Eu anomalies and relatively low concentrations of incompatibletrace elements have been also found at Pantelleria (Italy) and wereinterpreted to be the result of up to 40% accumulation of alkali-feldspars (Civetta et al., 1998;White et al., 2009). The occurrence of tra-chytes with anomalous trace element concentration also in otherperalkaline volcanic systems suggests that accumulation of alkali-feldspars is a common petrogenetic process able to affect the evolutionof peralkaline trachytic magmas.
7.4. Magma reservoir dynamics and eruption of the Lajes Ignimbrite
The geochemical and textural features described before can be sum-marized in a conceptual model of the petrogenetic processes acting inthemagma reservoir beneath PicoAlto Volcano (Fig. 14). Compositionalzoning in Type 1 anorthoclase and the fine-spaced oscillatory zoning ofthe external rims (100–300 μm) of Type 2 anorthoclase suggest thatthey grew in an highly dynamic area of the reservoir, where tempera-ture and water content gradients were present. In a first stage, the dy-namics of the magma reservoir is dominated by chemical convectiondue to density contrast induced by fractional crystallization and crystalaccumulation (stage 1; Fig. 14a). Thermal instabilities were later in-duced by a heat source, most probably a hotter magma from depth,that triggered thermal convection in themagma body, leading to a pro-cess known as ‘self-mixing’ (Couch et al., 2001). This allowed Type 2crystals, which were in equilibrium with melts residing at the bottom ofthe magma reservoir (hotter and less evolved), to move across layers ofthe reservoir, where gradients in temperature and chemical compositionwere present. Such process would well explain the diversity of crystaltextures, mineral compositions and observed disequilibria in the alkali-feldspars. Self-mixing also contributed to re-homogenize the internalportion of the reservoir, promoting the formation of a compositionallyhomogeneous, intermediate main body. Convective self-mixing doesnot require direct contact with a hotter mafic/intermediate magma togenerate complex crystal textures. Vigorous convection was possible be-cause the crystal content in themagma did not reach the critical rheolog-ical threshold of 50 vol%, at which crystals form a continuous solid-likenetwork (Marsh, 1981) and convection ceases (Bachmann andBergantz, 2004). The generation of convective plumeswas thus responsi-ble for the admittance of Type 2 crystals from the cumulate level at thebottom into the intermediate portions of the magma reservoir (stage 2;Fig. 14b). The thermal destabilization driven by a new heat source atthe base of the reservoir may represent a possible trigger mechanismfor the Lajes Ignimbrite eruption. The onset of the eruption caused syn-eruptive mixing between magmas residing in the different portions ofthe reservoir (cf.. glass composition of TERS62.B). The eruption of theLajes Ignimbrite started with the extrusion of the more evolved crystal-rich basal layer emplaced at the base of the Lajes outcrop, that recordsthe dilute, fines-depleted, front of a pyroclastic density current (similarlyto the ground layer commonly seen at the base of ignimbrites; e.g. Sparks,1976; Scarpati et al., 2015). This first eruptedmagma results frommixingbetweenmelts residing at the top of the reservoir andminor quantities ofevolved melts coming from the crystallization front. Magma withdrawal

62 C. D'Oriano et al. / Journal of Volcanology and Geothermal Research 347 (2017) 44–63
progressively intersected all portions of the reservoir during the course ofthe eruption. The basal ash layer and the intermediatewelded layer at SãoMateus were most probably emplaced contemporaneously with the in-termediate and top layers emplaced at Lajes Village. These different layerscorrespond to different ignimbrite lithofacies that record, initially, themore dilute front of a pyroclastic density current (which deposited thebasal ash layer), followed by deposition from a widespread, sustained,quasi-steady high particle concentration current (e.g. Branney andKokelaar, 2003; Sulpizio et al., 2014). The less evolved products wereemplaced at the top of the São Mateus outcrop by a late pyroclastic den-sity current pulse during thefinal phase of the eruption (stage 3; Fig. 14c).
8. Summary and conclusions
The Lajes Ignimbrite eruption is the last major pyroclastic densitycurrent-forming event associated with Pico Alto Volcano (TerceiraIsland, Azores), which occurred ca. 21 kyrs ago. The detailed studyof samples collected at two key outcrops of the Lajes Ignimbrite indi-cates that, despite themajor element homogeneity of the comenditictrachyte magma, trace element composition of groundmass glasses,together with textures and compositions of anorthoclase crystals,show significant variability. These features were attributed to azoned magma reservoir, with thermometric and hygrometric gradi-ents, dominated by fractionation of anorthoclase and formation of acumulate layer at the bottom of the reservoir. This system wasperturbed by a heat source, likely induced by the arrival of hottermagma from depth, without mass interaction (mixing) with the res-ident zoned trachytic body. This provided heat to the cumulate layer,caused its partial melting and likely acted as the trigger of this explo-sive eruption. The resulting features of the erupted products are thesum of cycles of crystallization, cumulate formation, re-melting ofthe cumulates and mixing between magma residing at different por-tions of the reservoir.
Until now, similar processes were described for phonolitic andrhyolitic magmatic systems, but this study reveals that similar pro-cesses can commonly affect the evolution of small peralkaline tra-chytic magmas, as seen for other systems in the Azores (Jeffery,2016). These findings were possible through the systematic studyof trace element data on glasses andmineral phases which are essen-tial for interpreting pre- and syn-eruptive processes in the magmareservoir.
Supplementary data to this article can be found online at http://dx.doi.org/10.1016/j.jvolgeores.2017.08.012.
Acknowledgements
A. Risplendente and S. Poli of the “Ardito Desio” University of Milan(Italy) are gratefully acknowledged for their assistance during electronmicroprobe analyses. The authors acknowledge J.C. White and R.Gertisser for the constructive reviews that significantly improved thequality of the manuscript and J. Gardner for the editorial handling. Wealso express our gratitude to O. Bachmann, J. Andújar, G. Wörner andG. Iezzi for their useful suggestions in a preliminary version of thiswork.Funding has been provided by the Fundação para a Ciência e Tecnologia(project MARES - PTDC/GEO-FIQ/1088/2014).
References
Andersen, D.J., Lindsley, D.H., Davidson, P.M., 1993. QUILF: a Pascal program to assessequilibria among Fe–Mg–Mn–Ti oxides, pyroxenes, olivine and quartz. Comput.Geosci. 19, 1333–1350.
Anderson Jr., A.T., 1983. Oscillatory zoning of plagioclases: Nomarski interference contrastmicroscopy of etched polished sections. Am. Mineral. 68, 125–129.
Anderson, A.T., 2000. Probable relations between plagioclase zoning and magma dynam-ics, Fuego volcano, Guatemala. Am. Mineral. 69, 660–676.
Andújar, J., Costa, F., Martí, J., Wolff, J.A., Carroll, M.R., 2008. Experimental constraints onpre-eruptive conditions of phonolitic magma from the caldera-forming El Abrigoeruption, Tenerife (Canary Islands). Chem. Geol. 257, 173–191.
Andújar, J., Costa, F., Scaillet, B., 2013. Storage conditions and eruptive dynamics of centralversus flank eruptions in volcanic island: the case of Tenerife (Canary Islands, Spain).J. Volcanol. Geotherm. Res. 260, 62–79.
Arzilli, F., Carroll, M.R., 2013. Crystallization kinetics of alkali feldspars in cooling anddecompression-induced crystallization experiments in trachytic melt. Contrib. Min-eral. Petrol. 166, 1011–1027.
Bachmann, O., Bergantz, G.W., 2004. On the origin of crystal-poor rhyolites: extractedfrom batholithic crystal mushes. J. Petrol. 45, 1565–1582.
Bachmann, O., Bergantz, G.W., 2006. Gas percolation in upper-crustal silicic crystalmushes as a mechanism for upward heat advection and rejuvenation of near-solidus magma bodies. J. Volcanol. Geotherm. Res. 149, 85–102.
Bachmann, O., Deering, C.D., Lipman, P.W., Plummer, C., 2014. Building zoned ignimbritesby recycling silicic cumulates: insight from the 1,000 km3 Carpenter Ridge Tuff, CO.Contrib. Mineral. Petrol. 167, 1025.
Bacon, C.R., Hirschmann, M.M., 1988. Mg/Mn partitioning as a test for equilibrium be-tween coexisting Fe–Ti oxides. Am. Mineral. 73, 57–61.
Bacon, C.R., Lowenstern, J.B., 2005. Late Pleistocene granodiorite source for recycled zirconand phenocrysts in rhyodacite lava at Crater Lake, Oregon. Earth Planet. Sci. Lett. 233,277–293.
Bateman, R., 1995. The interplay between crystallization, replenishment and hybridiza-tion in large felsic magma chambers. Earth Sci. Rev. 39, 91–106.
Beier, C., Haase, K.M., Hansteen, T.H., 2006. Magma evolution of the Sete Cidades volcano,São Miguel, Azores. J. Petrol. 47, 1375–1411.
Beier, C., Haase, K.M., Abouchami, W., Krienitz, M.-S., Hauff, F., 2008. Magma genesis byrifting of oceanic lithosphere above anomalous mantle: Terceira Rift, Azores.Geochem. Geophys. Geosyst. 9, Q12013.
Blundy, J., Cashman, K., 2005. Rapid decompression-driven crystallization recorded bymelt inclusions from Mount St. Helens volcano. Geology 33 (10), 793–796.
Branney, M.J., Kokelaar, P., 2003. Pyroclastic density currents and the sedimentation ofignimbrites. Geol. Soc. Lond. Mem. 27, 1–143.
Calvert, A.T., Moore, R.B., McGeehin, J.P., Rodrigues da Silva, A.M., 2006. Volcanic historyand 40Ar/39Ar and 14C geochronology of Terceira Island, Azores, Portugal.J. Volcanol. Geotherm. Res. 156, 103–115.
Carmichael, I.S.E., 1963. The crystallization of feldspar in volcanic acid liquids. Q. J. Geol.Soc. Lond. 119, 95–130.
Chen, C.F., Turner, J.S., 1980. Crystallization in a double-diffusive system. J. Geophys. Res.85, 2573–2593.
Civetta, L., D'Antonio, M., Orsi, G., Tilton, G.R., 1998. The geochemistry of volcanic rocksfrom Pantelleria island, Sicily channel: petrogenesis and characteristics of the mantlesource region. J. Petrol. 39, 1453–1491.
Couch, S., Sparks, R.S.J., Carroll, M.R., 2001. Mineral disequilibrium in lavas explainedby convective self-mixing in open magma chambers. Nature 411, 1037–1039.
Cox, R.A., Dempster, T.J., Bell, B.R., Rogers, G., 1996. Crystallization of the Shap Gran-ite: evidence from zoned K-feldspar megacrysts. J. Geol. Soc. Lond. 153, 625–635.
Devine, J.D., Rutherford, M.J., Gardner, J.E., 1998. Petrologic determination of ascent ratesfor the 1995–1997 Soufriere Hills Volcano andesitic magma. Geophys. Res. Lett. 25,3673–3676.
Di Vito, M.A., Arienzo, I., Braia, G., Civetta, L., D'Antonio, M., Di Renzo, V., Orsi, G., 2011. TheAverno 2 fissure eruption: a recent small-size explosive event at the Campi FlegreiCaldera (Italy). Bull. Volcanol. 73, 295–320.
Druitt, T.H., Costa, F., Deloule, E., Dungan, M., Scaillet, B., 2012. Decadal to monthly time-scales of magma transfer and reservoir growth at a caldera volcano. Nature 482,77–80.
Dungan, M.A., Davidson, J., 2004. Partial assimilative recycling of mafic plutonic roots ofarc volcanoes: an example from the Chilean Andes. Geology 32, 773–776.
Eichelberger, J.C., Chertkoff, D.J., Dreher, S.T., Nye, C.J., 2000. Magmas in collision: rethink-ing chemical zonation in silicic magmas. Geology 28, 603–606.
Ersoy, E.Y., 2013. PETROMODELER (Petrological Modeler): a Microsoft® Excel© spread-sheet program for modelling melting, mixing, crystallization and assimilation pro-cesses in magmatic systems. Turk. J. Earth Sci. 22, 115–125.
Fabbrizio, A., Carroll, M.N., 2008. Experimental constraints on the differentiation processand pre-eruptive conditions in the magmatic system of Phlegraean Fields (Naples,Italy). J. Volcanol. Geotherm. Res. 171, 88–102.
Féraud, G., Kaneoka, I., Allègre, C.J., 1980. K/Ar ages and stress pattern in the Azores:geodynamic implications. Earth Planet. Sci. Lett. 46, 275–286.
Gaghevin, D., Daly, J.S., Poli, G., Morgan, D., 2005. Microchemical and Sr isotopic investi-gation of zoned K-feldspar megacrysts: insights into the petrogenesis of a graniticsystem and disequilibrium crystal growth. J. Petrol. 46, 1689–1724.
Gaspar, J.L., Queiroz, G., Pacheco, J.M., Ferreira, T., Wallenstein, N., Almeida, M.H.,Coutinho, R., 2003. Basaltic lava balloons produced during the 1998–2001 SerretaSubmarine Ridge eruption (Azores). In: White, J.D.L., Smellie, J.L., Clague, D.A.(Eds.), Explosive Subaqueous Volcanism. Am. Geophys. Union, Geophysical Mono-graph. 140, pp. 205–212.
Gertisser, R., Self, S., Gaspar, J.L., Kelley, S.P., Pimentel, A., Eikenberg, J., Barry, T.L., Pacheco,J.M., Queiroz, G., Vespa, M., 2010. Ignimbrite stratigraphy and chronology on TerceiraIsland, Azores. In: Groppelli, G., Viereck-Goette, L. (Eds.), Stratigraphy and Geology ofVolcanic Areas. Geol. Soc. Am., Special Papers. 464, pp. 133–154.
Geschwind, C.H., Rutherford, M.J., 1995. Crystallization of microlites during magma as-cent: the fluid mechanics of 1980–1986 eruption at Mount St. Helens. Bull. Volcanol.57, 356–370.
Ghiorso, M.S., Evans, B.W., 2008. Thermodynamics of rhombohedral oxide solid solutionsand a revision of the Fe-Ti two-oxide geothermometer and oxygen-barometer. Am.J. Sci. 308, 957–1039.

63C. D'Oriano et al. / Journal of Volcanology and Geothermal Research 347 (2017) 44–63
Ghiorso, M.S., Gualda, G.A.R., 2013. A method for estimating the activity of titania in mag-matic liquids from the compositions of coexisisting rhombohedral and cubic iron-titanium oxides. Contrib. Mineral. Petrol. 165, 73–81.
Ginibre, C., Kronz, A., Wörner, G., 2002a. High-resolution quantitative imaging of plagio-clase composition using accumulated backscattered electron images: new constraintson oscillatory zoning. Contrib. Mineral. Petrol. 142, 436–448.
Ginibre, C., Wörner, G., Kronz, A., 2002b. Minor- and trace-elements zoning in plagioclase:implications for magma chamber processes at Parinacota volcano, northern Chile.Contrib. Mineral. Petrol. 143, 300–315.
Ginibre, C., Wörner, G., Kronz, A., 2004. Structure and dynamics of the Laacher Seemagmachamber (Eifel, Germany) from major and trace element zoning in sanidine: acathodoluminescence and electron microprobe study. J. Petrol. 45, 2197–2223.
Hildenbrand, A., Weis, D., Madureira, P., Marques, F.O., 2014. Recent plate re-organizationat the Azores Triple Junction: evidence from combined geochemical andgeochronological data on Faial, S. Jorge and Terceira volcanic islands. Lithos 210-211, 27–39.
Humphreys, M.C.S., Blundy, J.D., Sparks, R.S.J., 2006. Magma evolution and open-systemprocesses at Shiveluch volcano: insights from phenocrysts zoning. J. Petrol. 47,2303–2334.
Huppert, H.E., Sparks, R.S.J., 1980. The fluid dynamics of a basaltic magma chamberreplenished by influx of hot dense ultrabasic magma. Contrib. Mineral. Petrol. 75,279–289.
Huppert, H.E., Sparks, R.S.J., 1984. Double diffusive convection due to crystallization inmagmas. Annu. Rev. Earth Planet. Sci. 12, 11–37.
Jeffery, A.J., 2016. Petrogenesis and Contrasting Eruption Styles of Peralkaline SilicicMagmas From Terceira and São Miguel, Azores. (PhD thesis). Keele University,United Kingdom.
Jeffery, A.J., Gertisser, R., O'Driscoll, B., Pacheco, J.M., Whitley, S., Pimentel, A., Self, S., 2016.Temporal evolution of a post-caldera, mildly peralkaline magmatic system: Furnasvolcano, São Miguel, Azore. Contrib. Mineral. Petrol. 171, 42.
Landi, P., Métrich, N., Bertagnini, A., Rosi, M., 2004. Dynamics of magma mixing anddegassing recorded in plagioclase at Stromboli (Aeolian Archipelago, Italy). Contrib.Mineral. Petrol. 147, 213–227.
Landi, P., Corsaro, R.A., Francalanci, L., Civetta, L., Miraglia, L., Pompilio, M., Tesoro, R.,2008. Magma dynamics during the 2007 Stromboli eruption (Aeolian Islands.Italy): mineralogical, geochemical and isotopic data. J. Volcanol. Geotherm. Res.182, 255–268.
Lange, R., Frey, H.M., Hector, J., 2009. A thermodynamic model for the plagioclase-liquidhygrometer/thermometer. Am. Mineral. 94, 494–506.
Le Bas, M.J., Le Maitre, R.W., Streckeisen, A., Zanettin, B., 1986. A chemical classification ofvolcanic rocks based on the total alkali-silica diagram. J. Petrol. 27, 745–750.
Lepage, L.D., 2003. ILMAT: an Excel worksheet for ilmenite-magnetite geothermometryand geo-barometry. Comput. Geosci. 29, 673–678.
Macdonald, R., 1974. Nomenclature and petrochemistry of the peralkaline oversaturatedextrusive rocks. Bull. Volcanol. 38, 498–516.
Madureira, P., Mata, J., Mattielli, N., Queiroz, G., Silva, P., 2011. Mantle source heterogeneity,magma generation and magmatic evolution at Terceira Island (Azores archipelago):constraints from elemental and isotopic (Sr, Nd, Hf, and Pb) data. Lithos 126, 402–418.
Mahood, G.A., Stimac, J.A., 1990. Trace-element partitioning in pantellerites and trachytes.Geochim. Cosmochim. Acta 54, 2257–2276.
Marques, F.O., Catalão, J., Hildenbrand, A., Madureira, P., 2015. Groundmotion and tecton-ics in the Terceira Island: Tectonomagmatic interactions in an oceanic rift (TerceiraRift, Azores Triple Junction). Tectonophysics 651-652, 19–34.
Marsh, B.D., 1981. On the crystallinity, probability of occurrence, and rheology of lava andmagma. Contrib. Mineral. Petrol. 78, 85–98.
Marshall, D.J., 1988. Cathodoluminescence of Geological Materials Unwin-Hyman, Boston,Mass. p. 146.
McDonough, W.F., Sun, S.-S., 1995. The composition of the Earth. Chem. Geol. 120,223–253.
Métrich, N., Bertagnini, A., Garaebiti, E., Vergniolle, S., Bani, P., Beaumais, A., Neuville, D.R.,2015. Magma transfer and degassing budget: application to the 2009–2010 eruptivecrisis of Mt Garet (Vanuatu arc). J. Volcanol. Geotherm. Res. 322, 48–62.
Mollo, S., Masotta, M., Forni, F., Bachmann, O., De Astis, G., Moore, G., Scarlato, P., 2015. AK-feldspar–liquid hygrometer specific to alkaline differentiated magmas. Chem. Geol.392, 1–8.
Mungall, J.E., Martin, R.F., 1995. Petrogenesis of basalt-comendite and basalt-pantelleritesuites, Terceira, Azores, and some implications for the origin of ocean-island rhyo-lites. Contrib. Mineral. Petrol. 119, 43–55.
Nakamura, M., Shimakita, S., 1998. Dissolution origin and syn-entrapment compositionalchange of melt inclusion in plagioclase. Earth Planet. Sci. Lett. 161, 119–133.
Nekvasil, H., 1992. Ternary feldspar crystallization in high temperature felsic magmas.Am. Mineral. 77, 592–604.
Nekvasil, H., 1994. Ternary feldspar/melt equilibria: a review. In: Parson, I. (Ed.), Feldsparsand Their Reactions. Kluwer Academic, Dordrecht, pp. 195–219.
Papale, P., Moretti, R., Barbato, D., 2006. The compositional dependence of the saturationsurface of H2O+CO2 fluids in silicate melts. Chem. Geol. 229, 78–95.
Pearce, N.J.G., Perkins, W.T., Westgate, J.A., Wade, S.C., 2011. Trace-element microanalysisby LA-ICP-MS: the quest for comprehensive chemical characterization of single, sub-10 μm volcanic glass shards. Quat. Int. 246, 57–81.
Perugini, D., Poli, G., 2012. The mixing of magmas in plutonic and volcanic environments:analogies and differences. Lithos 153, 261–277.
Pimentel, A., 2015. Pyroclastic Density Current-Forming Eruptions on Faial and TerceiraIslands, Azores. (PhD thesis). University of the Azores, Portugal.
Pimentel, A., Pacheco, J., Self, S., 2015. The ~1000-years BP explosive eruption of CaldeiraVolcano (Faial, Azores): the first stage of incremental caldera formation. Bull.Volcanol. 77, 42.
Pimentel, A., Zanon, V., de Groot, L.V., Hipólito, A., Di Chiara, A., Self, S., 2016. Stress-induced comenditic trachyte effusion triggered by trachybasalt intrusion: multidisci-plinary study of the AD 1761 eruption at Terceira Island (Azores). Bull. Volcanol. 78(3), 1–21.
Putirka, K.D., 2008. Thermometers and barometers for volcanic systems. Rev. Mineral.Geochem. 69, 61–120.
Scarpati, C., Sparice, D., Perrotta, A., 2015. The ground layer of the Campanian Ignimbrite:an example of deposition from a dilute pyroclastic density current. Bull. Volcanol. 77,97.
Self, S., 1971. The Lajes Ignimbrite, Ilha Terceira, Açores. Comunicações dos ServiçosGeológicos de Portugal. 55 pp. 165–184.
Self, S., 1974. Recent Volcanism on Terceira, Azores. (PhD thesis). Imperial CollegeLondon, United Kingdom.
Self, S., 1976. The recent volcanology of Terceira, Azores. J. Geol. Soc. Lond. 13, 645–666.Self, S., Gunn, B.M., 1976. Petrology, volume and age relations of alkaline and
saturated peralkaline volcanics from Terceira, Azores. Contrib. Mineral. Petrol. 54,293–313.
Shcherbakov, V.D., Plechov, P.Y., Izbekov, P.E., Shipman, J.S., 2011. Plagioclase zoning as anindicator of magma processes at Bezymianny Volcano, Kamchatka. Contrib. Mineral.Petrol. 162, 83–99.
Shotton, F.W., Williams, R.E.G., 1973. Birmingham University radiocarbon dates VII. Ra-diocarbon 15, 451–468.
Shotton, F.W., Williams, R.E.G., Johnson, A.S., 1974. Birmingham University radiocarbondates VIII. Radiocarbon 16, 285–303.
Singer, B.S., Dungan, M.A., Layne, G.D., 1995. Textures and Sr, Ba, Mg, Fe, K and Ti compo-sitional profiles in volcanic plagioclase: clues to the dynamics of calc-alkaline magmachambers. Am. Mineral. 80, 776–798.
Snyder, D.C., Widom, E., Pietruszka, A.J., Carlson, R.W., Schmincke, H.U., 2007. Time scalesof formation of zoned magma chambers: U-series disequilibria in the Fogo A and1563 AD trachyte deposits, Sao Miguel, Azores. Chem. Geol. 239 (1), 138–155.
Sparks, R.S.J., 1976. Grain size variations in ignimbrites and implications for the transportof pyroclastic flows. Sedimentology 23, 147–188.
Stewart, M.L., Fowler, A.D., 2001. The nature and occurrence of discrete zoning in plagio-clase from recently erupted andesitic volcanic rocks, Montserrat. J. Volcanol.Geotherm. Res. 106, 243–253.
Storey, M., 1981. Trachytic pyroclasts from Agua de Pau volcano, São Miguel, Azores: evo-lution of a magma body over 4000 years. Contrib. Mineral. Petrol. 78, 423–432.
Sulpizio, R., Dellino, P., Doronzo, D.M., Sarocchi, D., 2014. Pyroclastic density currents:state of the art and perspectives. J. Volcanol. Geotherm. Res. 283, 36–65.
Tepley III, F.J., Davidson, J.P., Tilling, R.I., Arth, J.G., 2000. Magma mixing, recharge anderuption histories recorded in plagioclase phenocrysts from El Chichón Volcano,Mexico. J. Petrol. 41, 1397–1411.
Tomiya, A., Miyagi, I., Saito, G., Geshi, N., 2013. Short time scales of magma-mixing pro-cesses prior to the 2011 eruption of Shinmoedake volcano, Kirishima volcanicgroup, Japan. Bull. Volcanol. 75 (10), 750.
Turner, J.S., Campbell, I.K., 1986. Convection and mixing in magma chambers. Earth Sci.Rev. 23, 255–352.
Turner, S., George, R., Jerram, D.A., Carpenter, N., Hawkesworth, C., 2003. Case studies ofplagioclase growth and residence times in island arc lavas from Tonga and the LesserAntilles, and a model to reconcile discordant age information. Earth Planet. Sci. Lett.214, 279–294.
Van Achterbergh, E., Ryan, C.G., Jackson, S.E., Griffin, W.L., 2001. Data reduction softwarefor LA-ICP-MS. In: Sylvester, P. (Ed.), Laser-ablation-ICPMS in the Earth Sciences:Principles and Applications. Miner. Assoc. Can., Short Course. 29, pp. 239–243.
Vance, J.A., 1965. Zoning in igneous plagioclase: patchy zoning. J. Geol. 73 (4), 636–651.Vernon, R.H., 1986. K-feldspar megacrysts in granites phenocrysts, not porphyroblasts.
Earth Sci. Rev. 23, 1–63.Viccaro, M., Giacomoni, P.P., Ferlito, C., Cristofolini, R., 2010. Dynamics ofmagma supply at
Mt. Etna volcano (Southern Italy) as revealed by textural and compositional featuresof plagioclase phenocrysts. Lithos 116, 77–91.
Vogt, P.R., Jung, W.Y., 2004. The Terceira Rift as hyper-slow, hotspot-dominated obliquespreading axis: a comparison with other slow-spreading plate boundaries. EarthPlanet. Sci. Lett. 218, 77–90.
Wallace, G.S., Bergantz, G.W., 2002. Wavelet-based correlation (WBC) of zoned crystalpopulations and magma mixing. Earth Planet. Sci. Lett. 202, 133–145.
Wark, D.A., Stimac, J.A., 1992. Origin of mantled (rapakivi) feldspars: experimental evi-dence of a dissolution- and diffusion-controlled mechanism. Contrib. Mineral. Petrol.111, 345–361.
White, J.C., Parker, D.F., Ren, M., 2009. The origin of trachyte and pantellerite from Pantel-leria, Italy: insights from major elements, trace elements, and thermodynamicmodelling. J. Volcanol. Geotherm. Res. 179, 33–55.
Widom, E., Schmincke, H.U., Gill, J.B., 1992. Processes and timescales in the evolution of achemically zoned trachyte: Fogo A, São Miguel, Azores. Contrib. Mineral. Petrol. 111,311–328.
Wolff, J.A., Ellis, B.S., Ramos, F.C., Starkel, W.A., Boroughs, S., Olin, P.H., Bachmann, O., 2015.Remelting of cumulates as a process for producing chemical zoning in silicic tuffs: acomparison of cool, wet and hot, dry rhyolitic magma systems. Lithos 236-237,275–286.
Zanon, V., Pimentel, A., 2015. Spatio-temporal constraints on magma storage and ascentconditions in a transtensional tectonic setting: the case of the Terceira Island(Azores). Am. Mineral. 100 (4), 795–805.
Zellmer, G.F., Sparks, R.S.J., Hawkesworth, C.J., Wiedenbeck, M., 2003. Magma emplace-ment and remobilization timescales beneath Montserrat: insights from Sr and Ba zo-nation in plagioclase phenocrysts. J. Petrol. 44, 1413–1431.