magma: the magellanic mopra assessment tony wong university of illinois at urbana-champaign...
TRANSCRIPT

MAGMA: The Magellanic MAGMA: The Magellanic Mopra AssessmentMopra Assessment
Tony WongTony WongUniversity of Illinois at Urbana-Champaign
Collaborators:Annie Hughes (Swinburne/ATNF), Erik Muller (Nagoya U.), Jorge Pineda (JPL), Juergen Ott (NRAO), Y. Fukui, A. Kawamura, Y. Mizuno (Nagoya U.), S. Maddison (Swinburne), J.-P. Bernard (CESR), Y. Chu, L. Looney (U. Illinois), C. Henkel (MPIfR), U. Klein (U. Bonn)

MotivationMagellanic Clouds
• Can obtain both a local (pc-scale) and global view of star formation and the ISM
• But, may not be in dynamical equilibrium
• Metallicity lower than Galaxy
Existing complete ISM surveys• CO (2.6’): NANTEN surveys (Fukui et al. 1999, 2008)
• HI (1’): ATCA + Parkes surveys (Stanimirovic et al. 1999, Kim et al. 2003)
• H: MCELS (Smith et al.)
• mid-IR: S3MC (Bolatto et al.), SAGE (Meixner et al.)

CO vs. HI in LMCNearest actively star-forming galaxy; can easily
achieve ~10 pc resolution with radio telescopes
NANTEN CO ATCA HI
Fukui et al. 2001, 2008 Kim et al. 2003

Why A New Survey?
~40 pc resolution of NANTEN CO survey leaves many molecular clouds unresolved.
SEST Key Program focused on clouds with bright H emission, and did not employ OTF.

MAGMA Components: LMC1. Molecular Ridge near 30 Doradus (MX002: 2005)• Properties of GMC’s as a function of radiation field
2. Survey of Clouds in the Inner LMC (M172: 2006-7)
• Properties of GMC’s across range of environments
• Large scale dynamics and the CO-HI relationship
3. Verifying Cloud Masses (M226; 2007)
• Compare virial and IR-based methods
4. A Complete Flux-Limited Sample (M300; 2008-9)
• Properties of the smallest bright CO clouds

MAGMA Targets

Molecular Ridge• 120 5’ x 5’ fields
• 3 sensitivity ~ 200 M per beam
NANTEN CO
Molecular Ridge

CO vs. HI in LMC
Mopra CO HI Peak Tb Eff. lwidthHI integral

CO - HI Offsets
At 1’ resolution, evidence for offsets between CO and HI peaks.
Posibly “warm atomic haloes” such as seen around Galactic GMCs (e.g. Andersson et al. 1991).

X Factor
Assuming clouds are virialized, there is little variation in the CO-to-H2
conversion factor as a function of ambient FUV field or distance from 30 Dor.

Cloud Mass Spectrum
Mass spectrum power law index of -1.8 resembles that observed in Galactic studies.
Hint of steeper slope in low-FUV environments.

By survey location By SF activity
LMC: log = (-0.7 ± 0.1) + (0.7 ± 0.1) log R (our data)
MW: log = -0.28 + 0.55 log R (Solomon ea 1987)
Real variation in amplitude of turbulence between galaxies?
M31: log = (-0.5 ± 0.3) + (0.7 ± 0.2) (Rosolowsky 2007)
Rid
ge c
loud
s no
t sh
ow
n in
thi
s pa
nel

By survey location By SF activity
Mvir Ln
MW: n = 0.8 (Solomon ea 1987)
LMC: n = 1.2 ± 0.1 (our data)
For constant X-factor: n = 1More intracloud medium in
larger GMCs, e.g. (e.g. HI or H2
without associated CO)?
Rid
ge c
loud
s no
t sh
ow
n in
thi
s pa
nel

By survey location By SF activity
Similar surface density to MW clouds if X-factor is (slightly) larger in LMC.
For X-factor = 3.2 x 1020 cm-2 (K km s-1)-1, ∑ = 170 ± 70 M pc-2
As per previous slide, large clouds not as luminous: L Rn; n < 2.
Rid
ge c
loud
s no
t sh
ow
n in
thi
s pa
nel

Verifying GMC masses in the LMC
Other methods to measure GMC mass besides virial hypothesis:
1) FIR emission from dust mixed with the molecular gas
2) Extinction of background stars by molecular gas
3) mm continuum from cold dust mixed with molecular gas…
A three-way comparison between:
• XCO mass estimates from MAGMA data
• FIR mass estimate from SAGE 60m & 100m data (method 1)
• Extinction mass estimate from 2MASS 6X & Sirius data (method 2)
With Bill Reach (SSC), Jean-Philippe Bernard (CESR, Toulouse) & Kazuhito Dobashi (Tokyo
Gakugei)
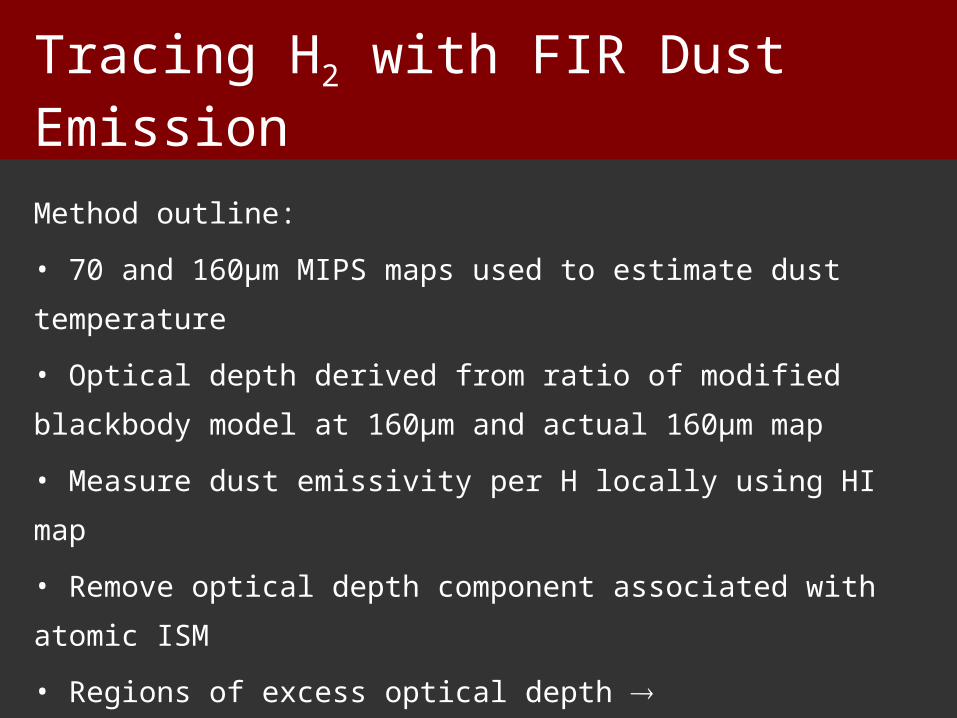
Tracing H2 with FIR Dust Emission
Method outline:
• 70 and 160μm MIPS maps used to estimate dust temperature
• Optical depth derived from ratio of modified blackbody model at
160μm and actual 160μm map
• Measure dust emissivity per H locally using HI map
• Remove optical depth component associated with atomic ISM
• Regions of excess optical depth molecular/ionized gas
NB: Need cold clouds for single dust temperature assumption
(See Reach et al 1994 for full description of method)

Some example clouds
Contours: MAGMA CO data
Greyscale: IR excess map

Tracing H2 with NIR Extinction
Method outline:
• Unlike FIR emission method, atomic and molecular ISM should
have the same NIR extinction properties
• NIR star catalogue (2MASS) used to make map of extinction in the
LMC (assume Cardelli reddening law & RV=3.1)
• Measure extinction per H locally using HI map
• Remove component associated with atomic ISM
• Regions with excess AV molecular/ionized gas
(See Dobashi et al 2008 for full description of method & comparison with NANTEN
CO data across LMC)

Example & preliminary results
From Dobashi et al 2008NB NANTEN data (not MAGMA) shown
Contours: NANTEN CO data
Greyscale: Excess AV map
cloud near 30 Dor

CO vs. HI in LMC
Inte
gra
ted
HI
(co
nto
ur)
on
In
teg
rate
d C
O

CO vs. HI in LMC
Pea
k H
I T
emp
(co
nto
ur)
on
In
teg
rate
d C
O

CO vs. HI in LMC
HI
vel
dis
per
sio
n (
con
tou
r) o
n I
nte
gra
ted
CO

CO vs. HI in LMCBright CO associated with bright HI, but not vice versa.

CO vs. Stars in LMCCO correlates weakly with both recent and past star
formation.

Molecular to Atomic Gas Ratio

CO vs. HI in LMCAre molecular clouds formed by colliding of HI flows?
No correlation of ICO with HI linewidth.

CO vs. HI in LMCHowever, CO may be tracing a relatively late stage in
molecular cloud evolution (Bergin et al. 2004).
QuickTime™ and aTIFF (LZW) decompressor
are needed to see this picture.
QuickTime™ and aTIFF (LZW) decompressor
are needed to see this picture.
For typical values of v and n, timescale for CO emission to appear is >107 yr after shock.
[CI]/CO ratio may be a much more sensitive probe of the early postshock gas.

Results: CO-HI CorrelationHI necessary but not sufficient for CO detection
• Likelihood of CO detection increases with HI integrated intensity and peak brightness.
• Correlation is weak because a lot of bright HI emission is not associated with CO emission.
CO is not associated with enhanced HI linewidth
• No indication of GMC formation from colliding HI flows, although subject to interpretation.
CO/HI ratio not correlated with stellar surface density
• Probably limits the role of hydrostatic pressure
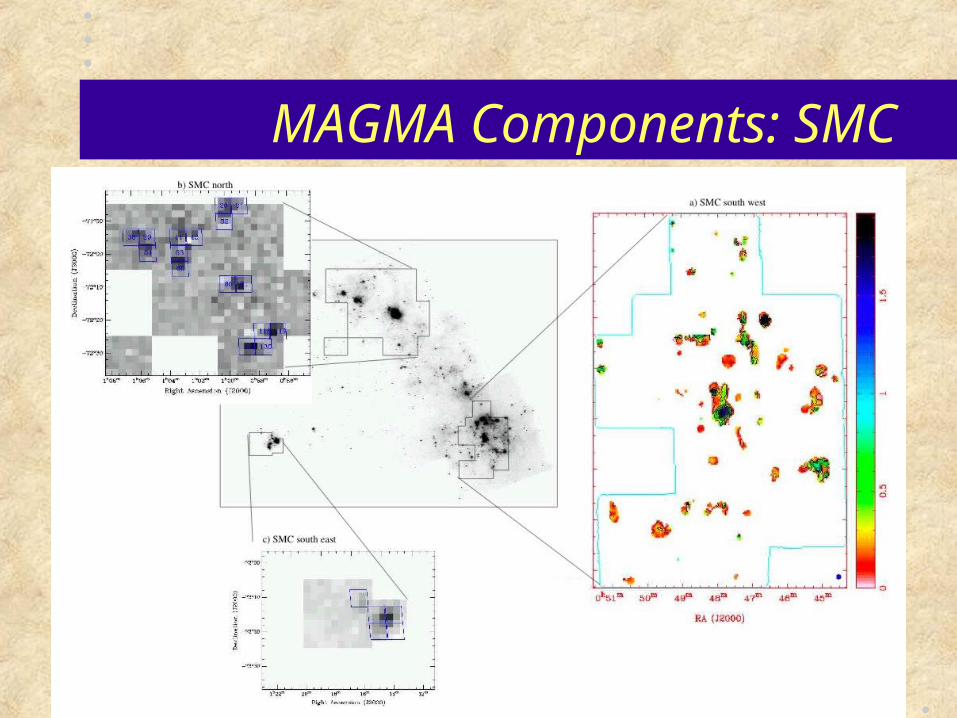
MAGMA Components: SMC
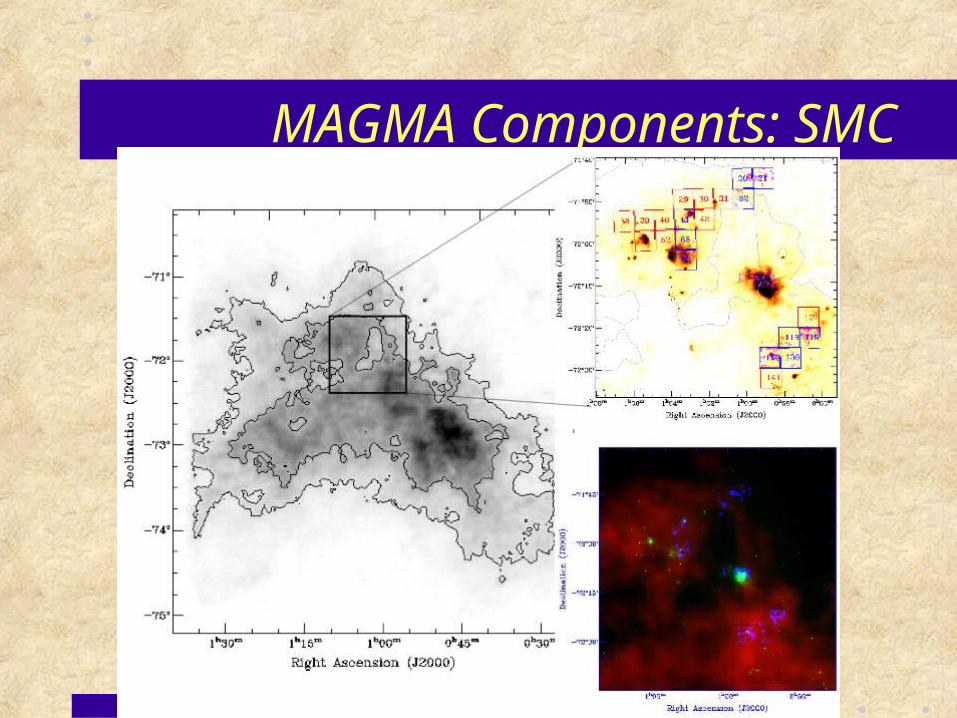
MAGMA Components: SMC

SMC Results
Size-linewidth relation for northern clouds (triangles with errorbars) offset from relation for SW clouds (diamonds and solid line).

Summary
1. MAGMA will map the brightest CO clouds in the LMC and SMC (as detected by NANTEN) at a resolution of ~45” (11 pc).
2. Maps are revealing molecular cloud properties across flux-limited samples in both galaxies.
3. They are also being used to address long-standing questions about the ability of CO to trace H2 in low-
metallicity environments.
4. The relationship between CO and HI, which we are investigating globally using the NANTEN data, can be studied on the scales of individual clouds.