magic maps user guide - evan millermagicmaps.evanmiller.org/magicmapsusermanual1.3.pdfit applies to...
TRANSCRIPT

Magic MapsUser Manual
Evan Miller
Version 1.3

Table of Contents
I. Introduction: The Magic Maps Interface 4
Top: Toolbar 6
Bottom: Status bar 6
Center: Map view 7
II. Style and Projection 9
Map Layers window 9
Map Style window 9
Map Projections window 11
Map Projection Parameters window 11
Map projection multi-touch gestures 12
III. Importing a Custom Layer 14
Importing Vector Data 14
Importing Image Data 15
Tips on Finding High-Quality KML, GeoTIFF Shapefiles 16
IV. Introduction to the Data Pane 17
Key concepts 17
Top: Selection bar 18
Upper: Variable table 18
Middle: Data table 19
Lower: Timeline view 20
Bottom left: Timeline controls 20
V. Entering, Importing, and Exporting Data 22

Adding data manually 22
Importing data 22
Exporting data 24
Adding points manually 24
Importing points as a layer 25
VI. Performing Analysis 27
Computed variables 27
Smart Layers 28
Radius Layers 29
Select tool 30
Paint tool 30
Coloring with data 31
Top 100 List 32
VII. Titles and Labels 34
Titles 34
Labels 34
Edit Text Tool 34
Magic Maps User Manual
3
I. Introduction: The Magic Maps Interface
Magic Maps can be used for multiple purposes, and it is not necessary to learn everything about all of its features in order to start using it. This section provides a basic orientation to the Magic Maps interface.
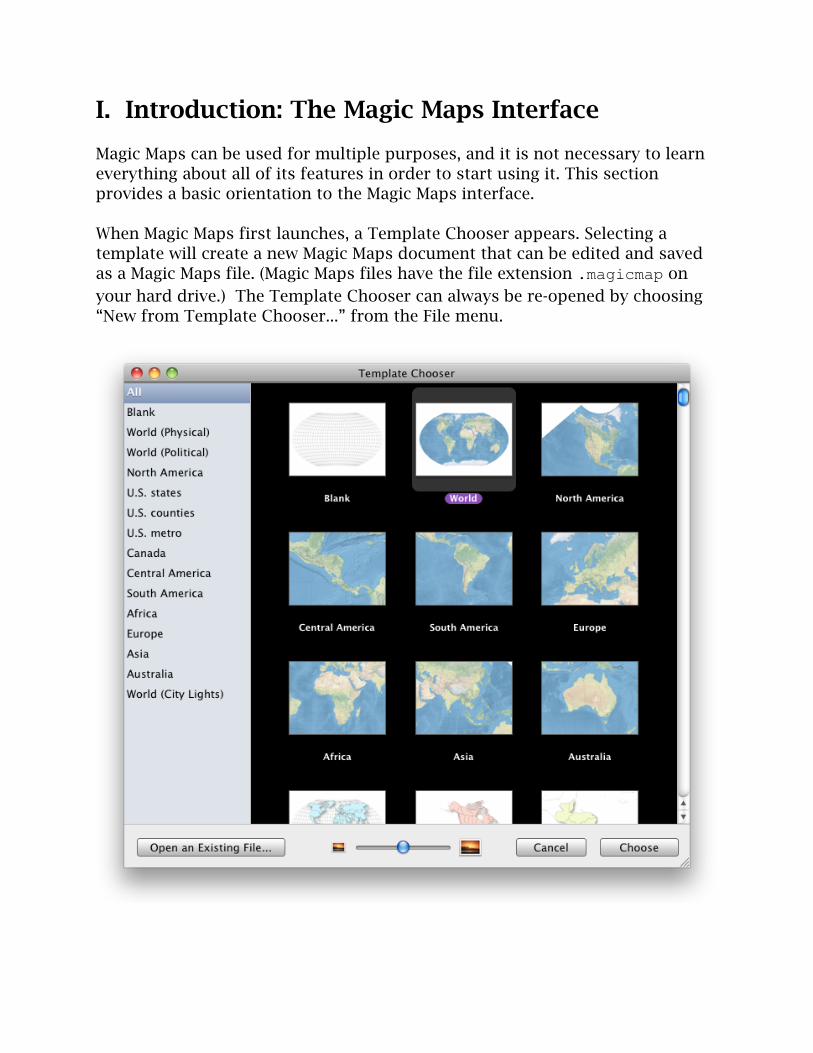
When Magic Maps first launches, a Template Chooser appears. Selecting a template will create a new Magic Maps document that can be edited and saved as a Magic Maps file. (Magic Maps files have the file extension .magicmap on your hard drive.) The Template Chooser can always be re-opened by choosing “New from Template Chooser...” from the File menu.

Similar to word processors and spreadsheet programs, Magic Maps is document-oriented, and can have one or more documents open at once. Selecting “New” from the File menu will create a new document using the most recently selected template.
Magic Maps 1.3 includes 184 templates, with emphasis on the United States and Canada. Each template includes one or more map layers. Map layers are either vector layers, which contain a set of related features, such as countries, states, or points, or image layers, which display a raster image of the earth’s surface. As discussed in Section III, additional map layers can be imported from KML, GeoTIFF, and Shapefiles. Map layers are the basic building blocks of all maps.
Similar to layers in image-editing applications, map layers can be “stacked” in any order; layers at the bottom of the stack are drawn first, and layers at the top are drawn last. Map layers can be individually styled or hidden from view. Individual features in a vector layer can be labeled and colored by hand, or by importing an outside data set.
We will get to the details of working with map layers in a minute. In the meantime, we’ll talk about navigating the Magic Maps document interface:
Magic Maps User Manual
5

The document interface has three main components: a toolbar at the top, the map view in the center, and a status bar at the bottom.
Top: Toolbar
The toolbar at the top of the document window is divided into several groups of icons: Show Data/Hide Data, Tools, Zoom, and Inspectors.
Show Data/Hide Data. The left-most icon can be clicked to reveal or conceal the data pane, which is discussed in Section IV. The data pane can also be shown or hidden using its vertical splitter bar (which appears to the left of the map view).
Tools. To the right of the Show Data/Hide Data icon are five icons, representing the five tools available for manipulating a map: Select, Move, Paint, Add Points, and Edit Text. Clicking tool’s icon will select the tool; by default, the Select tool is selected. The Move tool can be temporarily selected at any time by holding the space bar.
Zoom. In the middle are three icons for changing the zoom level. Zoom In and Zoom Out change the zoom level by a fixed amount; Zoom to Fit centers and zooms the document around the currently selected map layer. Zooming can also be achieved using multi-touch gestures, described below.
Inspectors. On the right are five icons that, when clicked, bring up an inspector window. The available inspectors are Layers, Projections, Style, Legend, and Top 100. A sixth inspector, called Parameters, is available from the “Inspectors” menu.
Bottom: Status bar
The status bar at the bottom of the window displays three pieces of information:
Magic Maps User Manual
6

- Current geographic position: The latitude and longitude associated with the current mouse position in the map view.
- Current feature: The feature associated with the current mouse position in the map view.
- Map size in pixels: The width and height of the current map view, in pixels.
In addition, the status bar has a resize handle on the far right, which can be used to resize the window.
Center: Map view
The large map view in the middle displays the map, as well as an optional year label in the bottom left. The map can be inspected and manipulated using one of the tools, or by using one of the following multi-touch gestures (multi-touch gestures require a laptop trackpad, or a standalone Magic Trackpad).
Magic Maps User Manual
7

Scroll gesture: The scroll gesture drags the map inside the current viewport. With the cursor positioned over the map view, the scroll gesture is achieved by placing two fingers on the trackpad and moving them in the same direction.
Zoom gesture: The zoom gesture zooms a map in or out; the position of the cursor over the map view defines the center of the zoom operation. To achieve a zoom gesture, place two fingers on the trackpad and pinch them together (to zoom out), or drag them apart (to zoom in).
Additional gestures for manipulating map projection parameters are described in Section II.
Magic Maps User Manual
8

II. Style and Projection
A map’s appearance can be controlled by changing the map’s layer ordering, style, and projection.
Map Layers window
The Map Layers window is open by default, and can be re-opened at any time by clicking the “Layers” button on the toolbar.
The Map Layers window includes a table of map layers. Map layers are drawn on the map in order, starting with the bottom-most layer. To prevent a layer from being drawn, uncheck its checkbox. A layer’s name can be changed by double-clicking it (unless the layer’s name is derived from another map layer, as in the case of radius layers).
Layers can be reordered by dragging and dropping.
To copy a layer from one document to another, drag its row in the Map Layers window to the document window where you would like the copy to be made.
Two controls are available for adjusting how each layer is drawn:
Opacity. Full opacity means that a layer is completely visible; no opacity means it is invisible.
Add Shadow. If checked, the currently selected map layer will have a drop shadow beneath it. The shadow is applied after the opacity adjustment.
Map Style window
To change the style of a map layer, open the Map Style window by clicking the “Style” button on the toolbar, or by choosing the “Map Style” item from the Inspectors menu.

The Map Style window contains two tabs: Map Features and Titles and Labels. The Map Features controls are described below. The Titles and Labels controls are described in Section VII.
Border color and thickness. The color well determines the color of feature borders, and the thickness stepper determines the thickness of feature borders. For point and line layers, these controls determine the color and thickness of the rim of drawn features.
Fill color. This color well determines the fill color of areas that are not otherwise colored by a Paint bucket or data category. This control applies only to area layers. If “Show Fill” is unchecked, only the feature borders are drawn.
Points color, size, and shape. The color well determines the color of points that are not
otherwise colored by a Paint bucket or data category. The size stepper determines the size of points, and the popup button determines the shape (which may be circles, triangles, squares, diamonds, or stars). These controls apply only to point layers.
Lines color, size, and pattern. The color well determines the color of lines that are not otherwise colored by a Paint bucket or data category. The size stepper determines the thickness of lines, and the popup button determines the pattern (solid or dashed). These controls apply only to line layers.
Radii color. The color well determines the color of radii in a radius layer.
Clipping layer. If this box is checked and a layer is selected from the menu, the currently selected layer will be clipped to the clipping layer (that is, only color within the clipping layer will be drawn). Clipping layers can only be applied to radius layers or image layers, and only polygon layers can be used as clipping layers.
Background color. This color well determines the background color of the map; it applies to all map layers.
Magic Maps User Manual
10
It is possible to save the current style for future use by choosing “Make Current Style Default” from the File menu.
Map Projections window
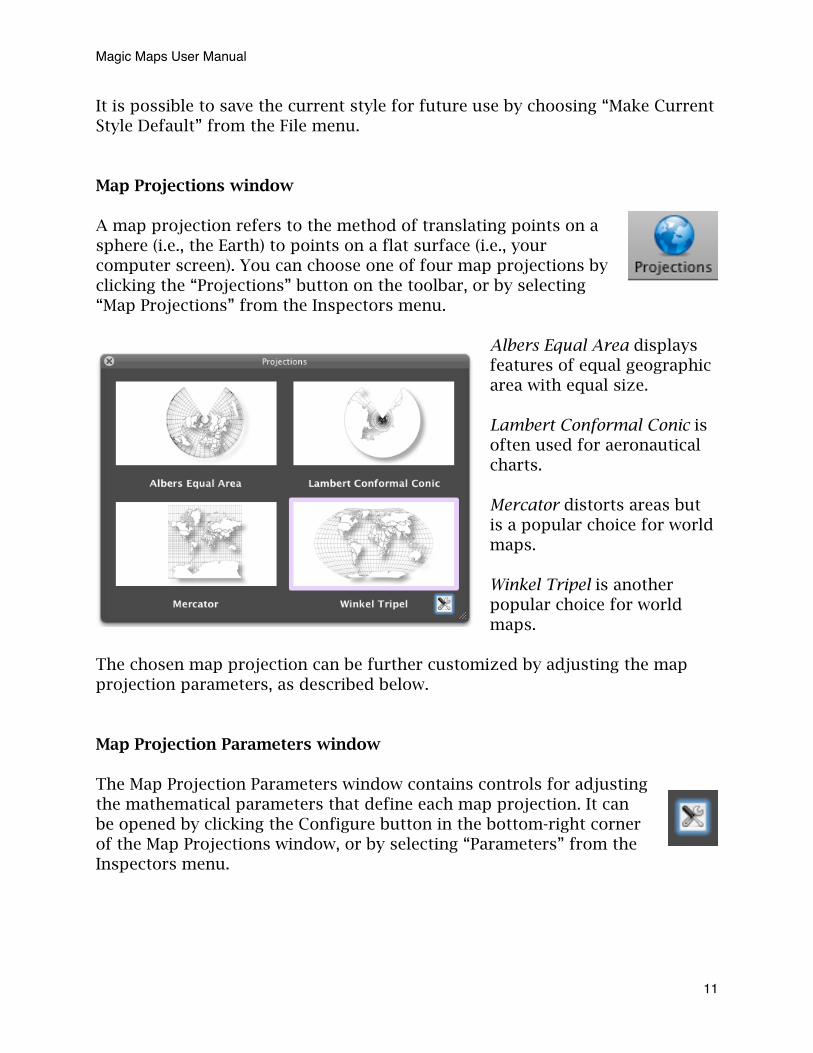
A map projection refers to the method of translating points on a sphere (i.e., the Earth) to points on a flat surface (i.e., your computer screen). You can choose one of four map projections by clicking the “Projections” button on the toolbar, or by selecting “Map Projections” from the Inspectors menu.
Albers Equal Area displays features of equal geographic area with equal size.
Lambert Conformal Conic is often used for aeronautical charts.
Mercator distorts areas but is a popular choice for world maps.
Winkel Tripel is another popular choice for world maps.
The chosen map projection can be further customized by adjusting the map projection parameters, as described below.
Map Projection Parameters window
The Map Projection Parameters window contains controls for adjusting the mathematical parameters that define each map projection. It can be opened by clicking the Configure button in the bottom-right corner of the Map Projections window, or by selecting “Parameters” from the Inspectors menu.
Magic Maps User Manual
11

Central Meridian determines the line of longitude in the middle of the map projection. Values are in degrees relative to Greenwich; negative values are degrees west, and positive values are degrees east. Valid values are between -180 and +180.
Standard Parallels refer to lines of latitude, but have different meaning based upon the map projection. In general, points close to or between the standard parallels will be projected with the least amount of distortion. Valid values are between -90 (South Pole) and +90 (North Pole).
Earth Model refers to whether the Earth should be treated as a sphere or as an ellipsoid in the projection process. The ellipsoid model is more accurate, but the sphere model is usually computed more quickly.
The following table summarizes which parameters have effect upon which projections:
Central Meridian
Standard Parallel 1
Standard Parallel 2
Earth Model
Albers Equal Area
Lambert Conformal Conic
Mercator
Winkel Tripel
For maps that use a U.S. map template with Alaska and Hawaii insets, the parameter changes will not apply to the map insets.
Map projection multi-touch gestures
A map’s projection parameters can also be manipulated with multi-touch gestures. This method offers precise control and instant visual feedback for adjusting how a map is projected. Multi-touch gestures require a trackpad.
Magic Maps User Manual
12

All gestures require three fingers: one finger remains stationary while two fingers (probably on the other hand) move. During a gesture, all labels will be hidden and the projection parameter being manipulated will appear as a thick black dashed line on the map. (During the gesture, the other adjustable parameters will appear as thick dashed lines in gray.)
To begin a projection gesture, first place the mouse cursor on the map location that you wish to remain stationary during the gesture. Then execute one of the following gestures:
Central meridian gesture: Keep one finger stationary anywhere on the trackpad. Move two fingers in concert to the left (to decrease the central meridian) or to the right (to increase the central meridian). For coarse (fast) adjustments, keep the two moving fingers on the top half of the trackpad. For finer (slow) adjustments, keep the two moving fingers on the bottom half of the trackpad.
Standard Parallel 1 gesture: Keep one finger stationary at the top of the trackpad. Move two fingers in concert up (to increase the standard parallel) or down (to decrease the standard parallel). For coarse (fast) adjustments, keep the two moving fingers away from the stationary finger. For finer (slow) adjustments, keep the two moving fingers close to the stationary finger.
Standard Parallel 2 gesture: Keep one finger stationary at the bottom of the trackpad. Move two fingers in concert up (to increase the standard parallel) or down (to decrease the standard parallel). For coarse (fast) adjustments, keep the two moving fingers away from the stationary finger. For finer (slow) adjustments, keep the two moving fingers close to the stationary finger.
Magic Maps User Manual
13

III. Importing a Custom Layer
The easiest way to start building a map is to select a map from the template chooser, described in Section I; this section discusses how to import a custom layer for users whose needs are not met by the Template Chooser.
Magic Maps can import geographically referenced vector data (lines, points, and polygons) as well as image data (grids of pixels).
Importing Vector Data
Magic Maps supports two data formats for importing vector map data: KML and Shapefile.
- KML (Keyhole Markup Language). KML is a variant of XML that is used by Google Earth. KML files have the file extension .kml or .kmz.
- Shapefile. The Shapefile format is actually a collection files in the same folder; one of these files has the extension .shp. Shapefile is used in the ESRI ArcGIS program, and is a popular format among government agencies. Shapefiles are often distributed as ZIP files, which must be unzipped before importing the Shapefile into Magic Maps.
After Magic Maps has been installed, either data format can be opened simply by double-clicking the file, which will have one of these icons:
These files can also be imported into an existing document using the “Import Shapefile” and “Import KML” commands in the File menu.
In addition to information about the shapes of features, these files usually contain data columns that describe each feature’s name and other attributes.
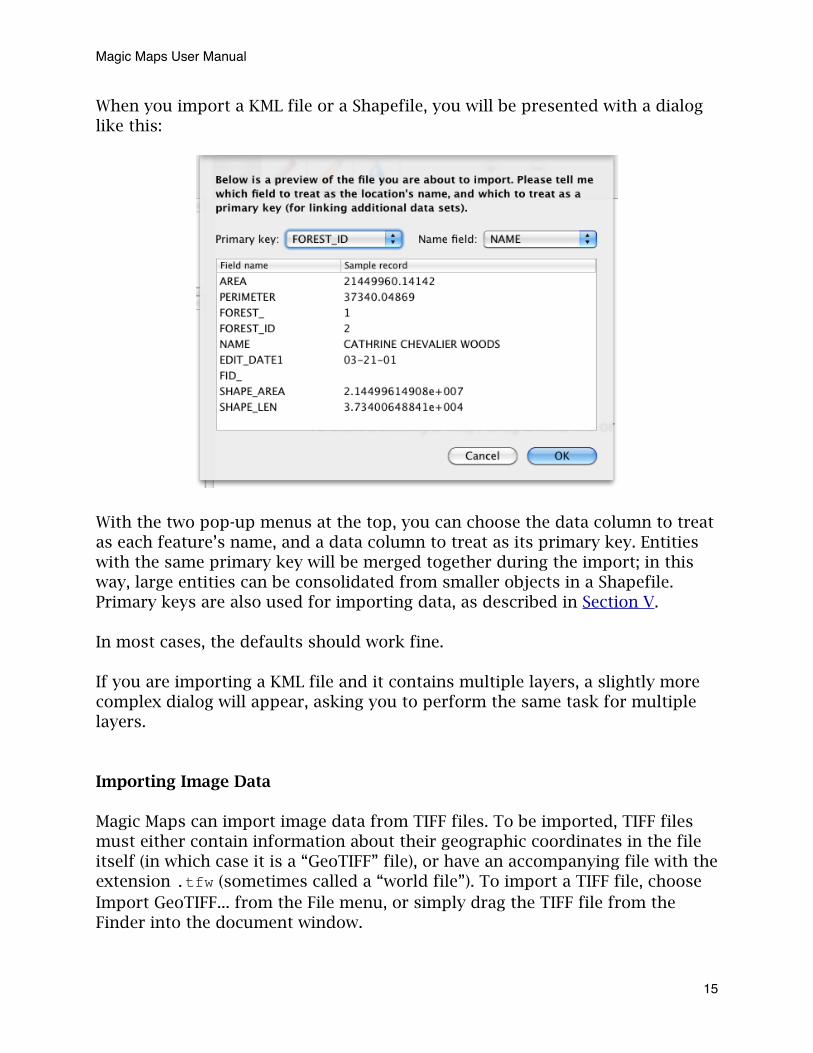
When you import a KML file or a Shapefile, you will be presented with a dialog like this:
With the two pop-up menus at the top, you can choose the data column to treat as each feature’s name, and a data column to treat as its primary key. Entities with the same primary key will be merged together during the import; in this way, large entities can be consolidated from smaller objects in a Shapefile. Primary keys are also used for importing data, as described in Section V.
In most cases, the defaults should work fine.
If you are importing a KML file and it contains multiple layers, a slightly more complex dialog will appear, asking you to perform the same task for multiple layers.
Importing Image Data
Magic Maps can import image data from TIFF files. To be imported, TIFF files must either contain information about their geographic coordinates in the file itself (in which case it is a “GeoTIFF” file), or have an accompanying file with the extension .tfw (sometimes called a “world file”). To import a TIFF file, choose Import GeoTIFF... from the File menu, or simply drag the TIFF file from the Finder into the document window.
Magic Maps User Manual
15

Tips on Finding High-Quality KML, GeoTIFF Shapefiles
High-quality KML, GeoTIFF Shapefiles for almost every imaginable map layer are available on the Internet. Government websites usually have accurate and up-to-date Shapefiles that can be freely downloaded. Three excellent sources of files are:
Global Administrative Areas: A database of country, province, and sub-province Shapefiles available under a non-commercial license. http://www.gadm.org/
Atlas of Historical County Boundaries: A collection of U.S. county Shapefiles dating back to the 17th century. http://publications.newberry.org/ahcbp/
NASA Earth Observatory: A collection of satellite-derived Earth images available as GeoTIFF. http://earthobservatory.nasa.gov/
Magic Maps User Manual
16

IV. Introduction to the Data Pane
In the following sections, we will discuss how to import, manipulate, and analyze data. First, it will be helpful to understand a number of key concepts in Magic Maps.
Key concepts
- Vector layer: A vector layer is a set of related features, such as countries, states, or points. There are four kinds of vector layers: data layers, selection layers, Smart Layers, and radius layers.
- Data layer: A data layer is a vector layer that has variables associated with each feature. For example, a county layer might have a variable for each county called “population.” Each data layer also has a primary key used for linking additional data.
- Primary key: The primary key of a data layer is a string of text used to uniquely identify each feature in the layer. For example, the primary key might be a country’s name, or a standard two-letter code.
- Selection layer: A selection layer is a map layer that contains a specific subset of features in a data layer.
- Smart Layer: A Smart Layer is a map layer that contains a dynamic subset of features in a data layer. The subset is determined based on custom rules defined by the user; for example, a Smart Layer might contain only counties with population greater than 100,000.
- Radius layer: A radius layer is a map layer that consists of geographic circles drawn around the features in another layer. For example, a radius layer might consist of 100 kilometer radii drawn around warehouse locations.
- Variable: A variable is information associated with each feature on data layer and contains either numeric or textual information. There are three kinds of variables: data variables, text variables, and computed variables.
- Data variable: A data variable is numeric information associated with each feature on a data layer (for example, population).

- Text variable: A text variable is textual information associated with each feature on a data layer (for example, the county’s name).
- Computed variable: A computed variable is numeric information that is derived from one or more data variables or other computed variables. For example, a computed variable called “population density” might be a county’s population divided by its area.
All of the data features can be accessed in the data pane, which can be opened by clicking the “Show Data” icon on the left side of the toolbar. The data pane consists of a number of components, described below.
Top: Selection bar
The selection bar displays information about the currently selected map layer (highlighted in blue in the Map Layers window). The first line of the selection bar, in bold, displays the layer’s name.
The second line displays a summary of the current selection of features in this layer (e.g., “Brazil” or “14 countries”). If no features are selected, the number of features in the selected layer is displayed (e.g., “252 countries”).
Upper: Variable table
Below the selection bar is the variable table. The variable table displays a list of variables associated with the currently selected layer. Selecting a variable in the variable table will display its information on the map and in the timeline view. Selecting multiple variables in the variable table will result in no information being displayed on the map or in the timeline view.
The first column displays a short name (or formula) that identifies each variable. The short names of data layers and
Magic Maps User Manual
18
selection layers can be directly edited; however, the short names of Smart Layers and Radius layers always reflect the underlying formulas that defines the layers, and cannot be directly edited.
The second column displays an optional title for each variable. If present, this title appears on the map when the variable is selected.
The third column displays aggregate numbers for each variable. If no features are selected, this column displays the aggregate figures across all features in the currently selected layer. If one or more features is selected, the column displays aggregate figures for the selected features.
There are two aggregation functions available: average and sum. The aggregation function can be changed using the radio buttons on the bottom right. The aggregation function will apply to all variables; it is not possible to view the sum of one variable and the average of another variable simultaneously.
As the message in gray indicates, the layer variable functions as a drag-and-drop target for CSV files containing data for the currently selected layer.
A new variable can be created by clicking the green button.
An existing variable can be deleted by selecting it and clicking the red button.
Middle: Data table
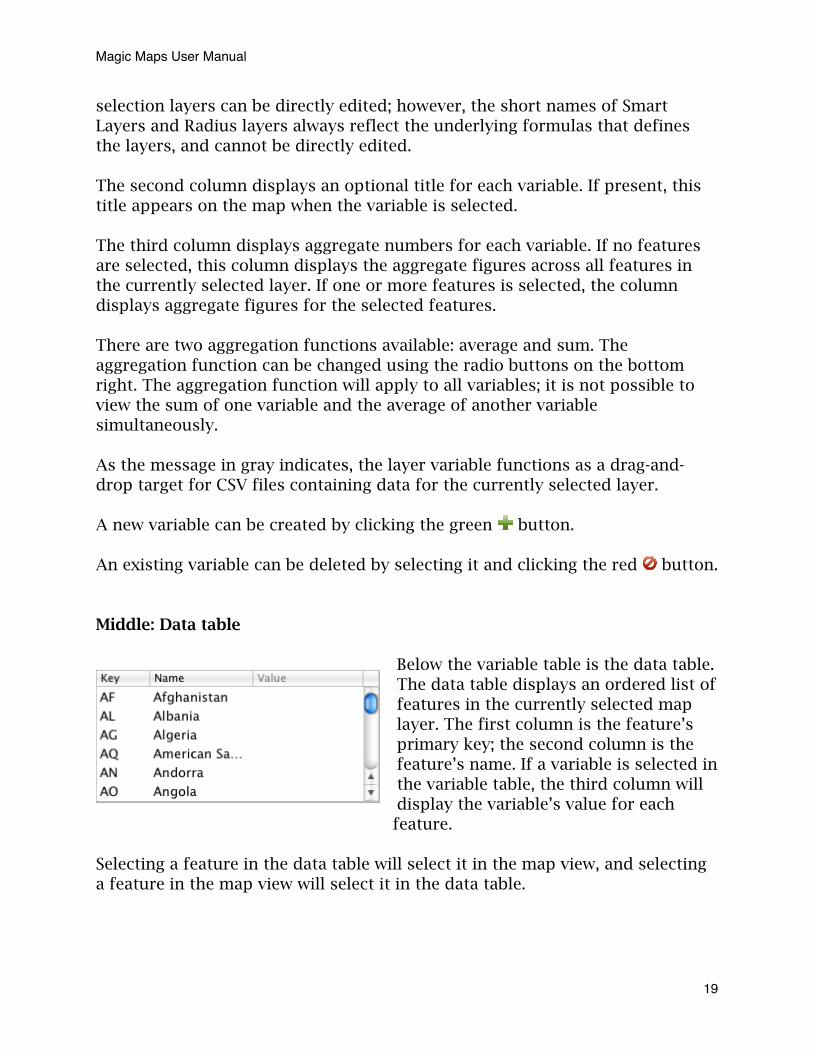
Below the variable table is the data table. The data table displays an ordered list of features in the currently selected map layer. The first column is the feature’s primary key; the second column is the feature’s name. If a variable is selected in the variable table, the third column will display the variable’s value for each feature.
Selecting a feature in the data table will select it in the map view, and selecting a feature in the map view will select it in the data table.
Magic Maps User Manual
19

It is possible change a feature’s name or the value of one of its variables by double-clicking the table. Currently, it is not possible to change a feature’s primary key.
Rows in the data table can be ordered by any of the columns by clicking the column header.
Lower: Timeline view
Below the data table is the timeline view. The timeline view displays a time series of the currently selected variable for the currently selected features. The currently selected year is indicated with a black dot on the timeline. The currently selected year can be changed by using the controls or by clicking directly on the timeline.
When clicked, the configure button in the bottom right reveals a set of options for configuring the timeline, described below. These options can be hidden by clicking the button a second time.
Bottom left: Timeline controls
Standard view:
In the standard view, the timeline controls display a slider bar for the currently selected year and a “Play” button, which, when clicked, automatically iterates through all of the years on the slider bar as if it were a movie.
Configuration view:
Magic Maps User Manual
20

The configuration view appears when the configure button is clicked. The controls can be used to change the start and end year of the timeline, as well as the number of years between ticks. The play
speed refers to the speed at which the “Play” button iterates through the years on the slider bar; the number refers to slider ticks per second (so larger numbers correspond to faster speeds).
Magic Maps User Manual
21
V. Entering, Importing, and Exporting Data
Data can be entered manually into Magic Maps, or imported from another file or application. If desired, data can also be exported from Magic Maps for use in a spreadsheet or other program.
Adding data manually
To create a new variable and add data to it manually, click the green button below the variable table and choose “New Text Variable” or “New Data Variable”. When you do, a new row will be created in the variable table, and you can type to give the new variable a name. To give each feature a value for the new variable, double-click its row in the data table and type. You can also enter data directly onto the map using the Edit Text tool.
The entered values apply to the currently selected year.
Importing data
There are three ways to import data into Magic Maps:
- From the map layer file. If you imported a map layer from a KML file or Shapefile, the data associated with the file will be automatically imported by Magic Maps. (In the case of Shapefiles, data is taken from the file with extension .dbf.)
- From a text file. To import data from a text file, either drag the file from the Finder to the variable table, or choose “Import Data into Layer” from the File menu. It is necessary to choose which map layer will receive the imported data. Supported text formats include:
- CSV (comma-separated-variables)- Tab-separated format- Right-justified fixed-width format
In all cases, the first line of the file should contain a header with variable names. If the first line contains any empty fields, it is skipped, and Magic Maps searches the rest of the file for a header line, and imports data on any remaining lines.

- Copy-paste. It is possible to copy-paste data directly from a spreadsheet, text editor, or web browser. The first line of the pasted data should contain the variable names. To paste data, first click the map to ensure it will receive the paste, then choose “Paste” from the Edit menu.
In all cases, data is linked to the target map layer using the map layer’s primary key. If a header field is present with the same name as the map layer’s primary key name (e.g., “FIPS code”), that variable is used to link data to map features. If there is no header field with the same name as the map layer’s primary key, a dialog will appear asking you to identify the column to use for linking:
Choose the column that corresponds to the target layer’s primary key and press OK.
For maps that use a U.S. template, the primary key for the states layer is “state”, which can be the state’s name, its two-letter postal abbreviation, or its two-digit FIPS code.
Magic Maps supports both time-series and non-time-series data. Data is interpreted as a time series if a “year” column is present in the imported data; in this case, each row corresponds to an annual observation for some map layer feature. Data will also be interpreted as a time series if the columns in the imported data appear to have a year at the beginning or at the end of the variable name. For example, if the imported data has columns for “Population1990” and “Population2000” (or, alternatively, “1990_Population”
Magic Maps User Manual
23

and “2000_Population”), Magic Maps will create a single variable called “Population” with separate observations for the years 1990 and 2000.
If the imported data has multiple observations for each year and primary key value, the observations will be added together. This feature makes it possible to import and aggregate data that has been sliced by (for example) demographic variables, even though Magic Maps does not have direct support for storing sliced data.
Magic Maps determines whether an imported column is a text field or a data field by attempting to parse each value in the first row of data as a number. If the parsing succeeds, the column is treated as a data field; otherwise, it is treated as a text field.
Magic Maps can parse numbers in decimal format, currency format (e.g. “$2,000”), and scientific notation (e.g. “1.0e6”). The decimal point character is determined by the computer’s locale settings.
Exporting data
The variables associated with each data layer can be exported in two formats: CSV (comma-separated-variables), or DSPL (Data Set Publishing Language). CSV is appropriate for spreadsheets or other data programs; DSPL can be used to upload data sets to the Google Public Data Explorer at www.google.com/publicdata.
To export data from a particular layer, use the “Export Data” sub-menu in the File menu. Alternatively, CSV data can be exported by dragging a set of desired variables from the variable table to the desired location in the Finder.
Geographic data from a data layer can be exported as KML for viewing in Google Earth or other programs; use the “Export KML” sub-menu in the File menu. The KML file will contain the colors visible in the current map view.
Finally, a table of distances between points can be exported as CSV. Choose “Distance Table” from the “Export CSV” sub-menu; for the columns and rows of the distance table, you can choose to use different layers, or the same layer.
Adding points manually
Magic Maps User Manual
24
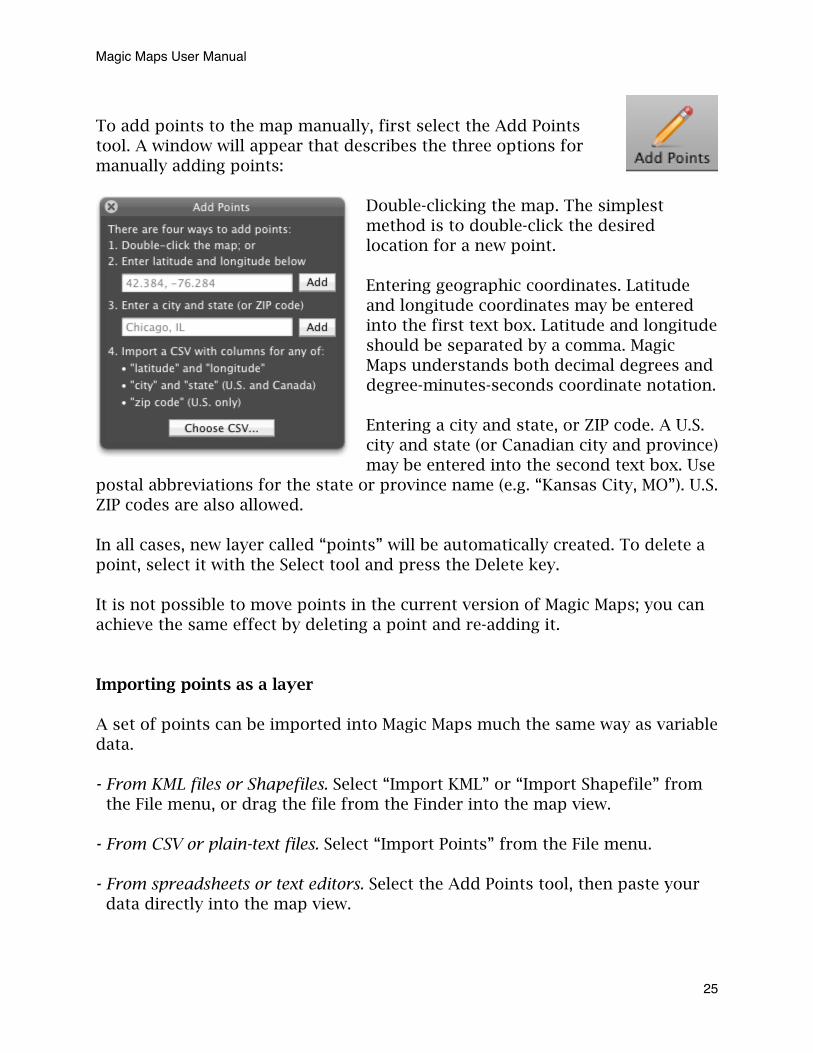
To add points to the map manually, first select the Add Points tool. A window will appear that describes the three options for manually adding points:
Double-clicking the map. The simplest method is to double-click the desired location for a new point.
Entering geographic coordinates. Latitude and longitude coordinates may be entered into the first text box. Latitude and longitude should be separated by a comma. Magic Maps understands both decimal degrees and degree-minutes-seconds coordinate notation.
Entering a city and state, or ZIP code. A U.S. city and state (or Canadian city and province) may be entered into the second text box. Use
postal abbreviations for the state or province name (e.g. “Kansas City, MO”). U.S. ZIP codes are also allowed.
In all cases, new layer called “points” will be automatically created. To delete a point, select it with the Select tool and press the Delete key.
It is not possible to move points in the current version of Magic Maps; you can achieve the same effect by deleting a point and re-adding it.
Importing points as a layer
A set of points can be imported into Magic Maps much the same way as variable data.
- From KML files or Shapefiles. Select “Import KML” or “Import Shapefile” from the File menu, or drag the file from the Finder into the map view.
- From CSV or plain-text files. Select “Import Points” from the File menu.
- From spreadsheets or text editors. Select the Add Points tool, then paste your data directly into the map view.
Magic Maps User Manual
25
When importing from a text file or pasting data directly into the map view, the header line should have columns for “latitude” and “longitude.” These coordinates may be specified as decimal degrees or in degrees-minutes-seconds notation. Other columns will be imported as data variables. As when importing area layers from a KML file or Shapefile, you will have the option to choose columns to treat as each feature’s name and its primary key.
If latitude and longitude are not available to you, it is possible to geocode U.S. and Canadian city and town names directly in Magic Maps. In this case, the header line should have columns for “city” and “state”; the “state” column should contain the state or province’s two-letter postal abbreviation. Magic Maps can also geocode U.S. ZIP codes; simply include a column labeled “zip code” instead. If a row cannot be geocoded, you will be presented with a dialog where you can manually correct the city name or ZIP code, or else enter latitude and longitude explicitly.
Magic Maps User Manual
26
VI. Performing Analysis
Magic Maps has several features for manipulating and analyzing data.
Computed variables
Most computed variables take another variable as input. These types of computed variable can be created by selecting one or more variables on the variable table and choosing a command from the Variable menu (this menu can also be accessed by right-clicking the variable table). There is no syntax for entering in formulae; however, complex computations can be built up with a series of computed variables just by repeated use of the Variable menu.
The following functions are available:
- Percent change computes the percentage increase or decrease of a variable over the specified time interval.
- Time difference computes the absolute increase or decrease of a variable over the specified time interval.
- Time lag computes the value in a previous year, as specified by the time interval.
- Rolling average computes an average for each year using data in surrounding years, as specified by the chosen time interval.
- Interpolate years infers missing data by taking an appropriately weighted average of the nearest two years that are not missing data.
- Divide will divide the selected variables by a chosen variable.
- Scale multiplies the variable by a specified power of 10.
- Sum variables adds the selected variables together.
- Aggregate is available only for point data. It computes the sum of the selected variable across all points that lie within each feature of another layer. (For example, the “Aggregate” function could be used to compute total store sales by state.)

- Apply is available only for area data. It applies the selected variable to all points in another layer contained within each area. (For example, the “Apply” function could be used to display the name of the country that each point lies within.)
In addition, the Variable menu contains a “Weighted By” sub-menu. The chosen variable is used to compute weighted averages of the selected variables when the variable table is set to display average values.
Other computed variables do not take another variable as input. These computed variables can be created by clicking the green button and navigating to the “New Computed Variable” sub-menu. The available options are:
Compute Area computes the geographic area of each feature in the currently selected layer, in square kilometers. The computation uses a spherical approximation for the Earth and is accurate within 0.6%.
Compute Length computes the geodesic length of each feature in the currently selected layer, in kilometers. The computation uses a spherical approximation for the Earth and is accurate within 0.3%.
Compute Distance To creates a new computed variable that contains the minimum distance (in kilometers) between features in the current layer and any feature in the target layer. If the layer contains areas rather than points, the features’ centroids are used for the computation. The computation uses a spherical approximation for the Earth and is accurate within 0.3%.
Count Points creates a new computed variable that contains the number of points in the target layer for each feature in the current layer. For a point-counting function that sums a variable of interest, use the “Aggregate” function in the Variable menu.
It is not possible to change the name of computed variables; their names always reflect the computations that they perform.
Smart Layers
Smart Layers apply custom rules to display a subset of map features from a given layer. To create a Smart Layer, select a map layer and choose “New Smart Layer” from the Layer menu. A dialog will appear with a rule editor that you can
Magic Maps User Manual
28

use to define custom rules; for example, the following rule will select states where the population is less than 2,000,000:
Use the + button to define more than one rule for the same Smart Layer.
The Smart Layer rules can compare attributes to a given number, or to the special string “year”; in the latter case, the rule will compare the attribute on the left to the currently selected year. This feature can be used to show openings and closings, for example:
A Smart Layer can be edited later by choosing the “Edit Smart Layer” command from the Layer menu.
Radius Layers
Draw Radius in the Layer menu creates a radius layer with circles of a specified radius drawn around each feature of a target layer. If the target layer contains areas rather than points, the radius is drawn around each area’s centroid (the centroid is like a center of gravity; it does not necessarily lie within the feature).
Magic Maps User Manual
29

Radius layers can be clipped to other layers with the “Clip” option found in the Map Style window.
Select tool
The Select tool can be used to select a subset of features on the currently selected map layer. The variable table and the timeline will display the aggregate values for the current selection.
Selected features appear highlighted in light purple.
To select a single feature, click it.
To select multiple features, click while holding the Command key.
To draw a selection box that selects every feature touching the box, click and drag.
Double-clicking a feature will zoom the map view to that feature.
For maps that use the United States template, you can select every feature within a state by holding the Shift key and clicking a feature within the state of interest.
A selection layer can be created from the current selection by choosing “New Layer from Selection” from the Layer menu.
Paint tool
The Paint tool can be used to define regions and compare two or more regions on the Timeline.
Magic Maps User Manual
30

Selecting the Paint tool will bring up the Map Legend with the current palette of colors. The current Paint color is highlighted in purple.
To color a feature with the current Paint color, click the feature. Click and drag to color multiple features at once.
To remove coloring from features, click them again with the original Paint used, or select the features and press Delete.
To change the color of the Paint bucket, click the color well next to its label. The features colored with this Paint bucket will be changed as well.
To change the name of any Paint bucket, click its label, type a new name, and press Enter.
To choose another Paint bucket for coloring, click it on the Map Legend.
To increase or decrease the number of Paint buckets, drag the handle at the bottom of the legend.
After you have colored in regions, each region’s aggregate values will appear on the timeline in the corresponding Paint colors. (The aggregate values of the current selection still appear in black.)
In this way, it is possible to compare the time series of regions or individual features on the same timeline.
Coloring with data
The Map Legend window can be used to color features on a map layer according to variables of interest. The Map Legend window can be opened by clicking the “Legend” button on the right side of the toolbar, or choosing “Map Legend” from the Inspectors menu.
Magic Maps User Manual
31

Color by text. To color features according to a text variable, first select the text variable in the variable table. Next, select the “Text” tab in the Map Legend window (see figure at left), and check the box that says “Color By Text”.
To find and color features that share a particular value for the selected text variable, select the value of interest from one of the five popup buttons.
You can customize the colors of the text categories by clicking the color well next to each popup button.
Currently, up to twenty text categories can be defined.
Color by number. To color features according to a numeric variable, first select the data variable in the variable table. Next, select the “Data” tab in the Map Legend window (see figure at left), and select a coloring option from the pop-up menu:
“Don’t Color Data” will not apply coloring based on data.
“Color By Quantile” will color each feature based on its ranked position for the selected variable. The quantiles are calculated across all years for which data is available; the quantile figures appear in gray below each category label on the right.
“Custom Ranges” allows you to adjust the numbers that define each reach using the stepper buttons that appear above and below each category label on the right.
To customize the color of a numeric range, click the color well next to the appropriate range label.
Currently, up to twenty numeric ranges can be defined. When more than five ranges are used, a gradient of intermediate colors is automatically calculated using the chosen colors.
Top 100 List
Magic Maps User Manual
32

A final feature that is useful for data analysis is the “Top 100 List” window, which displays a list of features ranked according to the currently selected variable. The Top 100 List window can be opened by clicking the “Top 100” button on the right side of the toolbar, or by choosing “Top 100 List” from the Inspectors menu.
Selecting rows in the Top 100 List will select the associated features on the map, and selecting features on the map will select the corresponding rows on the Top 100 List.
Double-clicking a row on the Top 100 List will zoom the map to the corresponding feature.
Magic Maps User Manual
33

VII. Titles and Labels
Maps can be annotated with titles and labels. Titles and labels have full support for Unicode, and can be styled with custom fonts and colors.
Titles
Titles can be associated with the overall map or with each variable in each map layer. When a variable is selected, its title takes precedence over the overall map title. The map title and the appearance of titles can be edited using the Edit Text tool described below.
Labels
In Magic Maps, each label must be associated with a feature of a map layer. By default, features are labeled with their name. Features can also be given labels that correspond to the values of text variables by selecting that variable in the data pane.
To change the position of a label, click it and drag it to a new position on the map. The label’s position will be stored as a point on the Earth’s coordinate grid (if possible), so labels retain their geographic position across changes in the map projection.
If a label is dragged outside the feature that it describes, a leading line will automatically connect the label back to its source. To change the point where the leading line is anchored inside its source feature, drag the label back inside the feature so that the leading line “catches” at a different point.
The chosen position of labels will apply to all variables in the map layer.
Edit Text Tool
To change the font and color of labels, click the “Edit Text” button on the toolbar, and use the following controls in the Title & Labels window that appears:

Labels color and font. This color well determines the color of text labels on the map. The font button brings up the Font panel, which can be used to choose the font for text labels.
Leaders. This color well determines the color of leaders (solid lines that connect labels back to their sources). The stepper determines the thickness of leaders.
Show Labels. If checked, text labels will display the value of each feature for the currently selected variable.
Hide Labels That Overlap. If checked, text labels that would overlap with other text labels are hidden in order to increase legibility. (When this feature is turned on, the labels of larger features are given priority.)
Convert. If checked, a filter is applied to text labels before they are displayed on the map. Available filters are Title Case, Uppercase, and Lowercase. These case conversions are applied to accented as well as non-Latin characters.
Title text, color, and font. The map’s title can be set using this text field. The color well underneath determines the title’s color. (This color is also applied to the year label in the bottom-left of the map, if visible.) Clicking the “Font” button brings up the Font panel for choosing the title’s font.
Year color and font. This color well determines the color of the year label that appears in the bottom-left corner of the map. The font button brings up the Font panel, which can be used to the choose the font for the year label.
Show Year. If checked, the currently selected year will appear in the bottom-left corner of the map.
Magic Maps User Manual
35