mage-a3 is highly expressed in a subset of colorectal cancer...
TRANSCRIPT

Cancer Immun 1424
Cancer Immunity (28 Copyright © 2012 by R
-9634Academy of Cancer Immunology
www.cancerimmunity.org
110804
MAGE-A3 is highly expressed in a subset of colorectal cancer patients
HMC Shantha Kumara1, Michael J. Grieco1, Otavia L. Caballero2, Tao Su3, Aqeel Ahmed3, Erika Ritter4, Sacha Gnjatic4, VesnaCekic1, Lloyd J. Old4, Andrew J. Simpson4, Carlos Cordon-Cardo3 and Richard L. Whelan1,51Division of Colon and Rectal Surgery, Department of Surgery, St. Luke’s-Roosevelt Hospital Center, New York, NY 10019, USA2Ludwig Collaborative Laboratory for Cancer Biology and Therapy, Department of Neurosurgery, Johns Hopkins University School of Medicine, Baltimore, MD 21231, USA3Herbert Irving Comprehensive Cancer Center, Columbia University, New York, NY 10032, USA4Ludwig Institute for Cancer Research, New York Branch of Human Cancer Immunology at Memorial Sloan-Kettering Cancer Center, New York, NY 10065, USA5Section of Colon and Rectal Surgery, Department of Surgery, New York-Presbyterian Hospital, Columbia University, New York, NY 10032, USA
December 2012) Vol. 12, p. 16ichard L. Whelan
The expression of Cancer/Testis (CT) antigens in some tumors and restricted expression in normal tissue make CT antigens attractive vaccine targets. We evaluated the expression of MAGE-A3, PLAC1, GAGE, and CTAG2 in a series of colorectal cancers (CRC). CT mRNA expression was determined via quantitative PCR on paired tumors and normal tissue samples from 82 CRC patients. In addition, plasma antibody titers specific to MAGE-A3, PLAC1, GAGE, and CTAG2 were determined via ELISA. Tissue expression of MAGE-A3 was assessed via a standard IHC protocol. The Student’s t-test was used for statistical analysis (significance p < 0.05). Tumor expression of MAGE-A3, CTAG2, and GAGE was compared to the levels of expression in testis. The percentage of samples that had a tumor vs. testis expression ratio above 0.1% was: MAGE-A3 (28%) and CTAG2 (17%) but no tumor presented GAGE expression levels above 0.1%. The expression levels of PLAC1 in tumors were compared to the levels in placenta, and in 12.8% of the samples analyzed, these levels were above 0.1%. Sero-reactivity specific for MAGE-A genes and PLAC1 was noted in 2.4% and 2.6% of patients, respectively. MAGE-A3 and PLAC1 may hold promise as vaccine targets for CRC. Further study is warranted.
Keywords: MAGE-A3, tumor expression, colorectal cancer, Cancer/Testis antigens
IntroductionThe mortality associated with colorectal cancer remains high
despite advances made in adjuvant and neoadjuvant therapy. The search for new and effective anti-cancer treatments continues. One attractive, although controversial, avenue of research is immunotherapy. Evidence that the immune system can impact colorectal tumor growth can be found in Galon et al.’s study which demonstrated that a strong immune reaction within a tumor as evidenced by tumor-infiltrating lymphocytes (TILs) correlated with a favorable prognosis regardless of the local extent of the tumor or the invasion of regional lymph nodes (Stages I, II, III) (1). Immunotherapy includes both non-specific immunomodulation, as well as tumor vaccines and related treatment strategies that have as their goal the development of antigen-specific CD8 T cell responses.
A variety of vaccines, including whole cell and protein vaccines, have been assessed clinically and have met with limited success, thus far (2). Over the last decade, the importance of T-regulatory cells and other mechanisms that limit the immune response to tumor-associated antigens (TAA) and peptides has become clear. New strategies are being developed to overcome these obstacles to effective vaccination. In addition, the search goes on for new TAA vaccine targets that are expressed in a reasonable percentage of tumors of a particular type, yet are expressed only in a limited way or not at all by normal tissues.
A subset of TAAs which are promising vaccine targets are the Cancer/Testis (CT) category of antigens. These antigens are normally expressed only in the testis, which is an immune privileged location. Because these are essentially “foreign” antigens to the immune system, it is believed that when tumors express one of these proteins, there is a greater chance that a specific CD8 response may result. CT antigen expression in human tumors has been assessed via mRNA and immunohistochemical analysis; for most tumors, including colorectal cancer, the expression rate for each particular CT antigen ranges between 5% and 40% (3). Of note, one study has demonstrated that expression of CT antigens in a subset of CRC patients was associated with a detectable T cell response (3).
A vaccine specific to MAGE-A3 is being used in clinical trials worldwide (4). MAGRIT (MAGE-A3 as Adjuvant Non-Small Cell Lung Cancer Immunotherapy Trial), the largest ever phase III lung cancer trial, is investigating the efficacy of the MAGE-A3 antigen-specific cancer immunotherapeutic (ASCI) agent in preventing non-small cell lung cancer (NSCLC) recurrence. In this case, the ASCI agent is a MAGE-A3 recombinant protein: a His-tag MAGE-A3 protein with protein D at the N-terminus, produced by GlaxoSmithKline. In the MAGRIT trial, after tumor resection, MAGE-A3 ASCI agent is administered to patients with Stages IB, II, and IIIA NSCLC whose tumors are MAGE-A3-positive (4). The phase II study of MAGE-A3 of 182 patients with NSCLCs (122 Stage IB, 60 Stage II) showed that MAGE-A3 treatment in NSCLC was associated with a relative improvement of disease-free interval and disease-free survival of 27% (5). There is another large trial under way named DERMA (aDjuvant immunothERapy with MAGE-A3 in melanoma) investigating the effect of administering MAGE-A3
1 of 9
Cancer Immunity (28 December 2012) Vol. 12, p. 16
ASCI agent to patients with Stage IIIB or IIIC melanoma that has spread to the lymph nodes. The main purpose of this study is to determine the frequency of expression of selected CT antigens in a set of colorectal cancers.
ResultsDemographics and clinical data
As mentioned, a total of 82 patients with adenocarcinoma of the large intestine that underwent surgical resection were included in this study. The mean age of the patients was 66.4 +/- 17.3 years (45% male, 55% female). The tumor locations were as follows: right, 41 (50%); sigmoid/rectosigmoid, 18 (22%); rectal, 10 (12%); and left or transverse, 13 (16%). The final stage distribution for the 82 patients who were included in the MAGE-A3 analysis was: Stage II, 44 pts (54%); Stage III, 35 pts (43%); and Stage IV, 3 pts (3%). The stage breakdown data for the 78 patients included in the PLAC1 and GAGE analyses was: Stage II, 41 pts (52%); Stage III, 34 pts (44%); and Stage IV, 3 pts (4%). The stage breakdown data for the 35 patients included in
the CTAG2 analyses was: Stage II, 18 pts (51%); Stage III, 16 pts (46%); and Stage IV, 1 pt (3%). One rectal cancer patient (1%) received neoadjuvant pelvic external beam radiation and chemotherapy. None of the other patients received preoperative chemotherapy.
Selection of CT antigens to be analyzedTo select CT antigens for this study, we have initially carried
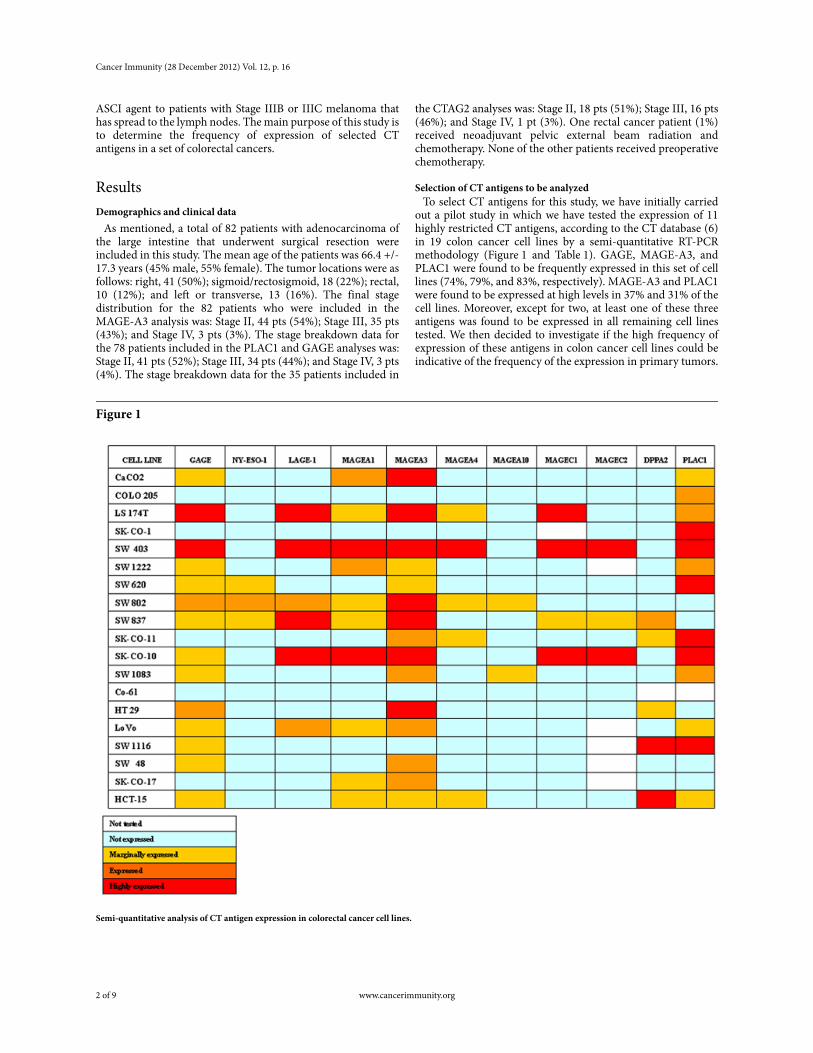
out a pilot study in which we have tested the expression of 11 highly restricted CT antigens, according to the CT database (6) in 19 colon cancer cell lines by a semi-quantitative RT-PCR methodology (Figure 1 and Table 1). GAGE, MAGE-A3, and PLAC1 were found to be frequently expressed in this set of cell lines (74%, 79%, and 83%, respectively). MAGE-A3 and PLAC1 were found to be expressed at high levels in 37% and 31% of the cell lines. Moreover, except for two, at least one of these three antigens was found to be expressed in all remaining cell lines tested. We then decided to investigate if the high frequency of expression of these antigens in colon cancer cell lines could be indicative of the frequency of the expression in primary tumors.
Figure 1
Semi-quantitative analysis of CT antigen expression in colorectal cancer cell lines.
2 of 9 www.cancerimmunity.org
Shantha Kumara et al.
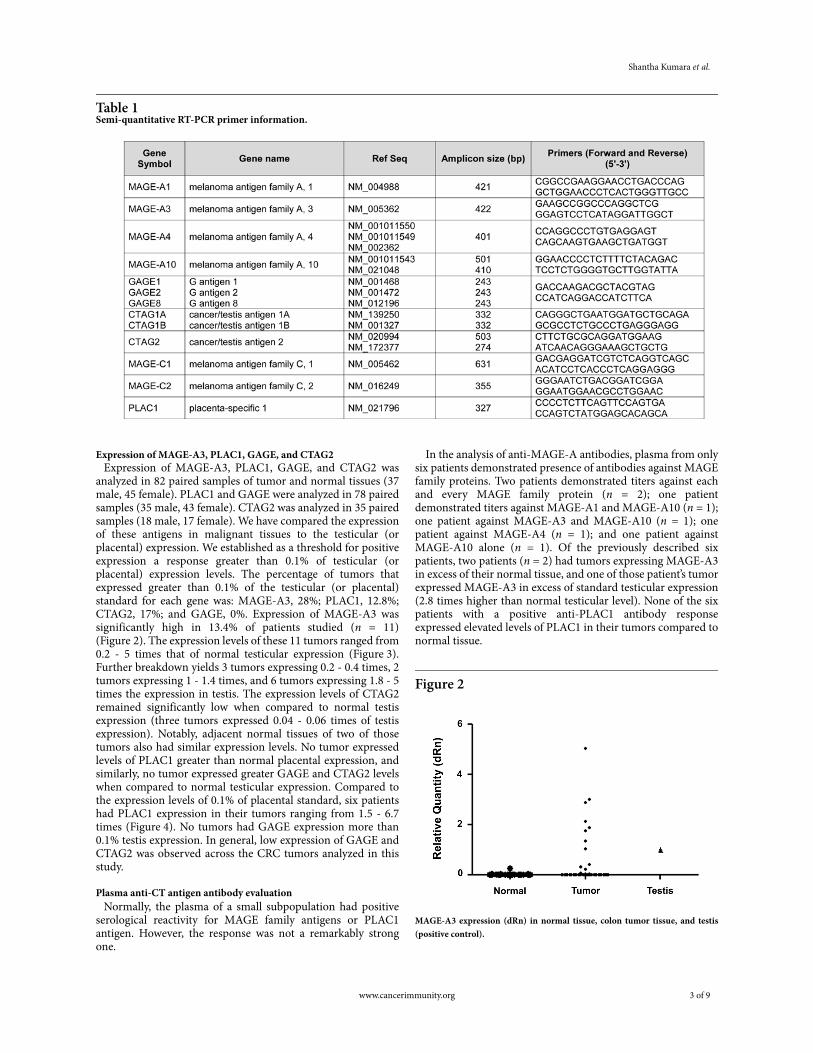
Table 1Semi-quantitative RT-PCR primer information.
Expression of MAGE-A3, PLAC1, GAGE, and CTAG2Expression of MAGE-A3, PLAC1, GAGE, and CTAG2 was
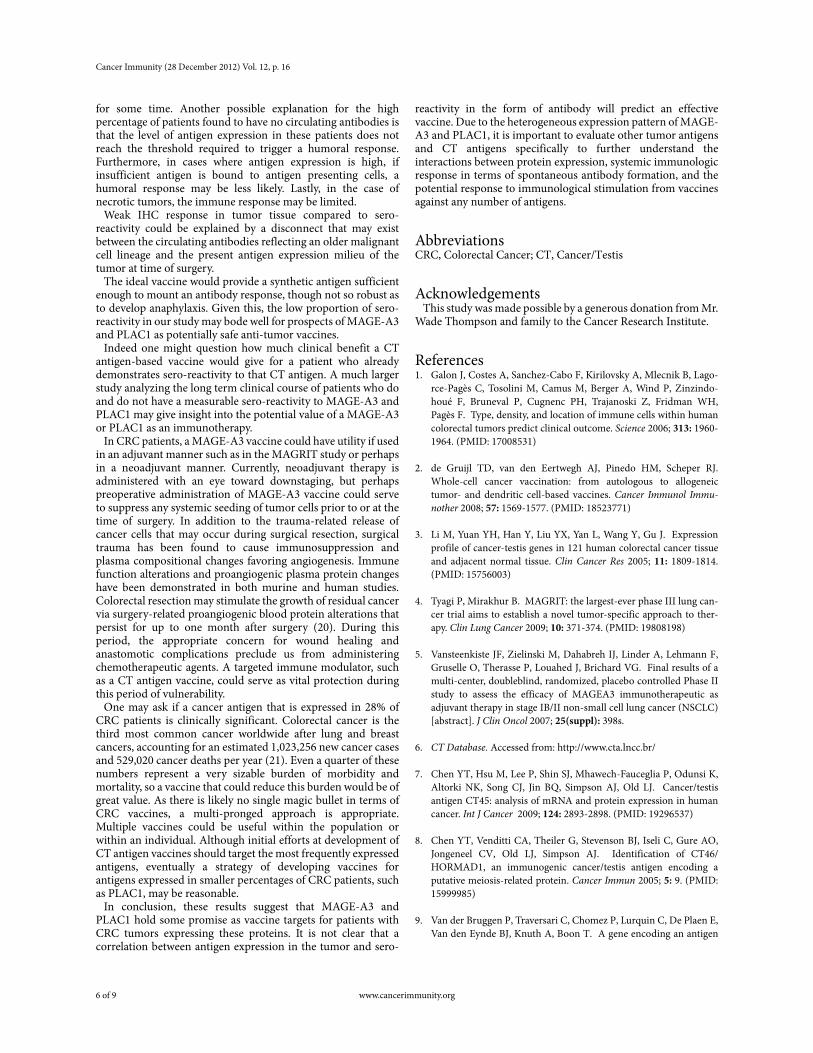
analyzed in 82 paired samples of tumor and normal tissues (37 male, 45 female). PLAC1 and GAGE were analyzed in 78 paired samples (35 male, 43 female). CTAG2 was analyzed in 35 paired samples (18 male, 17 female). We have compared the expression of these antigens in malignant tissues to the testicular (or placental) expression. We established as a threshold for positive expression a response greater than 0.1% of testicular (or placental) expression levels. The percentage of tumors that expressed greater than 0.1% of the testicular (or placental) standard for each gene was: MAGE-A3, 28%; PLAC1, 12.8%; CTAG2, 17%; and GAGE, 0%. Expression of MAGE-A3 was significantly high in 13.4% of patients studied (n = 11) (Figure 2). The expression levels of these 11 tumors ranged from 0.2 - 5 times that of normal testicular expression (Figure 3). Further breakdown yields 3 tumors expressing 0.2 - 0.4 times, 2 tumors expressing 1 - 1.4 times, and 6 tumors expressing 1.8 - 5 times the expression in testis. The expression levels of CTAG2 remained significantly low when compared to normal testis expression (three tumors expressed 0.04 - 0.06 times of testis expression). Notably, adjacent normal tissues of two of those tumors also had similar expression levels. No tumor expressed levels of PLAC1 greater than normal placental expression, and similarly, no tumor expressed greater GAGE and CTAG2 levels when compared to normal testicular expression. Compared to the expression levels of 0.1% of placental standard, six patients had PLAC1 expression in their tumors ranging from 1.5 - 6.7 times (Figure 4). No tumors had GAGE expression more than 0.1% testis expression. In general, low expression of GAGE and CTAG2 was observed across the CRC tumors analyzed in this study.
Plasma anti-CT antigen antibody evaluationNormally, the plasma of a small subpopulation had positive
serological reactivity for MAGE family antigens or PLAC1 antigen. However, the response was not a remarkably strong one.
In the analysis of anti-MAGE-A antibodies, plasma from only six patients demonstrated presence of antibodies against MAGE family proteins. Two patients demonstrated titers against each and every MAGE family protein (n = 2); one patient demonstrated titers against MAGE-A1 and MAGE-A10 (n = 1); one patient against MAGE-A3 and MAGE-A10 (n = 1); one patient against MAGE-A4 (n = 1); and one patient against MAGE-A10 alone (n = 1). Of the previously described six patients, two patients (n = 2) had tumors expressing MAGE-A3 in excess of their normal tissue, and one of those patient’s tumor expressed MAGE-A3 in excess of standard testicular expression (2.8 times higher than normal testicular level). None of the six patients with a positive anti-PLAC1 antibody response expressed elevated levels of PLAC1 in their tumors compared to normal tissue.
Figure 2
MAGE-A3 expression (dRn) in normal tissue, colon tumor tissue, and testis (positive control).
www.cancerimmunity.org 3 of 9
Cancer Immunity (28 December 2012) Vol. 12, p. 16
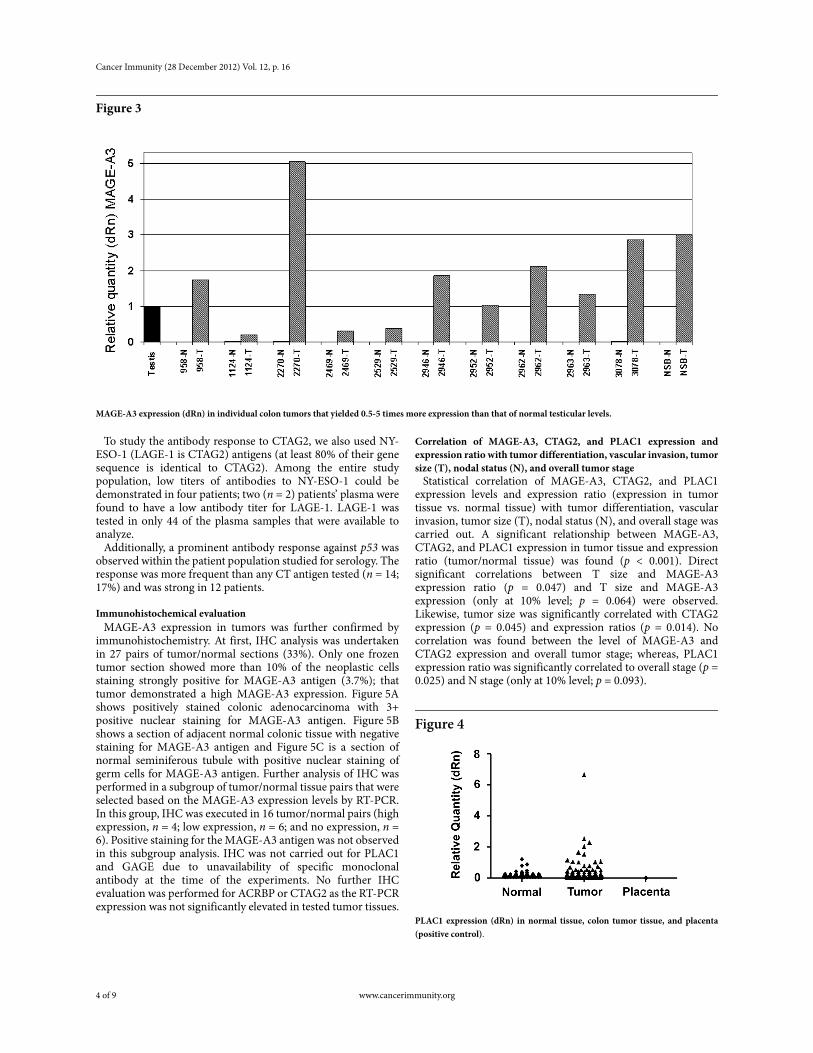
Figure 3
MAGE-A3 expression (dRn) in individual colon tumors that yielded 0.5-5 times more expression than that of normal testicular levels.
To study the antibody response to CTAG2, we also used NY-ESO-1 (LAGE-1 is CTAG2) antigens (at least 80% of their gene sequence is identical to CTAG2). Among the entire study population, low titers of antibodies to NY-ESO-1 could be demonstrated in four patients; two (n = 2) patients’ plasma were found to have a low antibody titer for LAGE-1. LAGE-1 was tested in only 44 of the plasma samples that were available to analyze.
Additionally, a prominent antibody response against p53 was observed within the patient population studied for serology. The response was more frequent than any CT antigen tested (n = 14; 17%) and was strong in 12 patients.
Immunohistochemical evaluationMAGE-A3 expression in tumors was further confirmed by
immunohistochemistry. At first, IHC analysis was undertaken in 27 pairs of tumor/normal sections (33%). Only one frozen tumor section showed more than 10% of the neoplastic cells staining strongly positive for MAGE-A3 antigen (3.7%); that tumor demonstrated a high MAGE-A3 expression. Figure 5A shows positively stained colonic adenocarcinoma with 3+ positive nuclear staining for MAGE-A3 antigen. Figure 5B shows a section of adjacent normal colonic tissue with negative staining for MAGE-A3 antigen and Figure 5C is a section of normal seminiferous tubule with positive nuclear staining of germ cells for MAGE-A3 antigen. Further analysis of IHC was performed in a subgroup of tumor/normal tissue pairs that were selected based on the MAGE-A3 expression levels by RT-PCR. In this group, IHC was executed in 16 tumor/normal pairs (high expression, n = 4; low expression, n = 6; and no expression, n = 6). Positive staining for the MAGE-A3 antigen was not observed in this subgroup analysis. IHC was not carried out for PLAC1 and GAGE due to unavailability of specific monoclonal antibody at the time of the experiments. No further IHC evaluation was performed for ACRBP or CTAG2 as the RT-PCR expression was not significantly elevated in tested tumor tissues.
Correlation of MAGE-A3, CTAG2, and PLAC1 expression and expression ratio with tumor differentiation, vascular invasion, tumor size (T), nodal status (N), and overall tumor stage
Statistical correlation of MAGE-A3, CTAG2, and PLAC1 expression levels and expression ratio (expression in tumor tissue vs. normal tissue) with tumor differentiation, vascular invasion, tumor size (T), nodal status (N), and overall stage was carried out. A significant relationship between MAGE-A3, CTAG2, and PLAC1 expression in tumor tissue and expression ratio (tumor/normal tissue) was found (p < 0.001). Direct significant correlations between T size and MAGE-A3 expression ratio (p = 0.047) and T size and MAGE-A3 expression (only at 10% level; p = 0.064) were observed. Likewise, tumor size was significantly correlated with CTAG2 expression (p = 0.045) and expression ratios (p = 0.014). No correlation was found between the level of MAGE-A3 and CTAG2 expression and overall tumor stage; whereas, PLAC1 expression ratio was significantly correlated to overall stage (p = 0.025) and N stage (only at 10% level; p = 0.093).
Figure 4
PLAC1 expression (dRn) in normal tissue, colon tumor tissue, and placenta (positive control).
4 of 9 www.cancerimmunity.org

Shantha Kumara et al.
Figure 5
Immunohistochemical evaluation of monoclonal mouse antibodies for human MAGE-A3 expression in tumor sections. (A) Colonic adenocarcinoma shows 3+ positive staining; (B) Normal colonic mucosa (negative control); (C) Testis with positive nuclear staining of germ cells.
DiscussionThe selection of target antigens with potent immunogenicity is
vital to immunotherapy design. Aside from minimal or no expression in normal tissue, a major factor in the selection of target antigen is the level of expression of the antigen in the cancer tissue of interest. Previous studies have evaluated expressions using 0.1% of testis (or placenta) expression as the cutoff, which is roughly correlated with weak to moderate expression as defined by conventional RT-PCR (7, 8). In one of these studies (7), when comparing quantitative RT-PCR to qualitative RT-PCR and IHC for detection of CT45 expression, the authors found that in comparison to testicular CT45 mRNA level, positive qualitative RT-PCR corresponded to cases with > 0.1 – 1% testicular expression. In that study, only cases with CT45 mRNA levels > 1% of testicular expression (1.2 – 49.5% range) showed positive CT45 expression by IHC. In comparison, only three of the cases that demonstrated no or low CT45 mRNA expression (< 1% testicular expression) showed positive CT45 staining, all in focal staining pattern, including one case with calculated CT45 mRNA level of 0.0005% testicular level that was found to have a small population of CT45-positive cells. We opted to set the cutoff (0.1% of the testicular levels) for positivity in this study based on the correlation that it shows with positivity in qualitative RT-PCR, which is a widely used method for CT antigen detection, but it is not clear that low levels of CT antigens would be meaningful or enough for eliciting immune response. As per the criteria outlined above, weak to moderate expression of MAGE-A3 was found in 28% of the tumors assessed. In only a minority of patients whose tumors demonstrated high MAGE-A expression did immunohistochemical testing confirm the presence of MAGE-A3 protein. In future studies, the utilization of the more sensitive fluorescent immunohistochemical methods might provide better protein data.
MAGE-A3 is a frequently expressed CT antigen. In terms of frequency of expression in different tumor types, at least 50% of solid tumors are known to express MAGE-A3 (9-15). The low frequency of positive IHC staining results could possibly be due to the presence of poorly differentiated proteins (antigen) and/or due to an absence of intact antigen as a result of degradation during the course of tissue preparation for the analysis. Use of Formalin preservation for tissue would have been ideal for IHC as it reduces the probability of having false-negative IHC
staining. PLAC1 was found in 12.8% of the tumors to have an expression level above the weak to moderate cutoff. GAGE expression was low and fell below the established cutoff (0.1%). CT antigens in CRC patients have been previously found to have a relatively low level of expression in general (3). Other studies have used a PLAC1 vaccine in concert with vaccines from other less highly expressed CT antigens (16). This strategy may very well be applicable in colorectal cancer where we might combine antigens to achieve a greater tumor response.
A CT antigen does not need to be expressed in a great majority of tumors in order to be considered for use in immunotherapy. The MAGRIT trial is built upon MAGE-A3 expression of 35-55% of NSCLC tumors (4). Our study demonstrates expression of MAGE-A3 in 28% of CRC tumors and concurs with an investigation of 121 samples of CRC tumor and normal tissue by Li et al., which reported 27.3% expression (3). The study by Li et al. analyzed 121 patients with colorectal cancer for presence of various CT genes including MAGE-3 by RT-PCR; MAGE-3 was found to be the most frequently expressed. The study by Li et al. also lacked confirmation of MAGE-3 by immunohistochemistry, serum antibody levels against MAGE-3, and ratio of expression of CT antigen tumor expression to testis expression and so these cannot be compared with our results. Similar to our study, Li et al. also did not detect significant correlation between CT gene expression and other factors such as age, gender, tumor location, size, gross type, differentiation, or invasion depth. This Li et al. study also demonstrated that for another prominent CT antigen, NY-ESO-1, mRNA was expressed in 9.9% of the samples, and correlated significantly with stages (p = 0.041) and local lymph node metastasis (p = 0.002). NY-ESO-1 has been the subject of phase 1 trials for melanoma, NSCLC, ovarian, sarcoma, prostate, and bladder cancer (16).
The significance of the low percentage of patients who demonstrated sero-reactivity against MAGE-A3 and PLAC1 is seen in several studies (17-19). Some patients who demonstrated an antibody response in preoperative blood had low or no RT-PCR expression in their tumor tissues. One theory is that lymphocytes that are able to invade a tumor could disrupt malignant cells, thus producing antigens localized within the tumor (including CT antigens). This takes place throughout the development of the tumor, and the antibodies produced against the tumor-specific antigen could remain in the patient’s blood
www.cancerimmunity.org 5 of 9
Cancer Immunity (28 December 2012) Vol. 12, p. 16
for some time. Another possible explanation for the high percentage of patients found to have no circulating antibodies is that the level of antigen expression in these patients does not reach the threshold required to trigger a humoral response. Furthermore, in cases where antigen expression is high, if insufficient antigen is bound to antigen presenting cells, a humoral response may be less likely. Lastly, in the case of necrotic tumors, the immune response may be limited.
Weak IHC response in tumor tissue compared to sero-reactivity could be explained by a disconnect that may exist between the circulating antibodies reflecting an older malignant cell lineage and the present antigen expression milieu of the tumor at time of surgery.
The ideal vaccine would provide a synthetic antigen sufficient enough to mount an antibody response, though not so robust as to develop anaphylaxis. Given this, the low proportion of sero-reactivity in our study may bode well for prospects of MAGE-A3 and PLAC1 as potentially safe anti-tumor vaccines.
Indeed one might question how much clinical benefit a CT antigen-based vaccine would give for a patient who already demonstrates sero-reactivity to that CT antigen. A much larger study analyzing the long term clinical course of patients who do and do not have a measurable sero-reactivity to MAGE-A3 and PLAC1 may give insight into the potential value of a MAGE-A3 or PLAC1 as an immunotherapy.
In CRC patients, a MAGE-A3 vaccine could have utility if used in an adjuvant manner such as in the MAGRIT study or perhaps in a neoadjuvant manner. Currently, neoadjuvant therapy is administered with an eye toward downstaging, but perhaps preoperative administration of MAGE-A3 vaccine could serve to suppress any systemic seeding of tumor cells prior to or at the time of surgery. In addition to the trauma-related release of cancer cells that may occur during surgical resection, surgical trauma has been found to cause immunosuppression and plasma compositional changes favoring angiogenesis. Immune function alterations and proangiogenic plasma protein changes have been demonstrated in both murine and human studies. Colorectal resection may stimulate the growth of residual cancer via surgery-related proangiogenic blood protein alterations that persist for up to one month after surgery (20). During this period, the appropriate concern for wound healing and anastomotic complications preclude us from administering chemotherapeutic agents. A targeted immune modulator, such as a CT antigen vaccine, could serve as vital protection during this period of vulnerability.
One may ask if a cancer antigen that is expressed in 28% of CRC patients is clinically significant. Colorectal cancer is the third most common cancer worldwide after lung and breast cancers, accounting for an estimated 1,023,256 new cancer cases and 529,020 cancer deaths per year (21). Even a quarter of these numbers represent a very sizable burden of morbidity and mortality, so a vaccine that could reduce this burden would be of great value. As there is likely no single magic bullet in terms of CRC vaccines, a multi-pronged approach is appropriate. Multiple vaccines could be useful within the population or within an individual. Although initial efforts at development of CT antigen vaccines should target the most frequently expressed antigens, eventually a strategy of developing vaccines for antigens expressed in smaller percentages of CRC patients, such as PLAC1, may be reasonable.
In conclusion, these results suggest that MAGE-A3 and PLAC1 hold some promise as vaccine targets for patients with CRC tumors expressing these proteins. It is not clear that a correlation between antigen expression in the tumor and sero-
reactivity in the form of antibody will predict an effective vaccine. Due to the heterogeneous expression pattern of MAGE-A3 and PLAC1, it is important to evaluate other tumor antigens and CT antigens specifically to further understand the interactions between protein expression, systemic immunologic response in terms of spontaneous antibody formation, and the potential response to immunological stimulation from vaccines against any number of antigens.
AbbreviationsCRC, Colorectal Cancer; CT, Cancer/Testis
AcknowledgementsThis study was made possible by a generous donation from Mr.
Wade Thompson and family to the Cancer Research Institute.
References1. Galon J, Costes A, Sanchez-Cabo F, Kirilovsky A, Mlecnik B, Lago-
rce-Pagès C, Tosolini M, Camus M, Berger A, Wind P, Zinzindo-houé F, Bruneval P, Cugnenc PH, Trajanoski Z, Fridman WH, Pagès F. Type, density, and location of immune cells within human colorectal tumors predict clinical outcome. Science 2006; 313: 1960-1964. (PMID: 17008531)
2. de Gruijl TD, van den Eertwegh AJ, Pinedo HM, Scheper RJ. Whole-cell cancer vaccination: from autologous to allogeneic tumor- and dendritic cell-based vaccines. Cancer Immunol Immu-nother 2008; 57: 1569-1577. (PMID: 18523771)
3. Li M, Yuan YH, Han Y, Liu YX, Yan L, Wang Y, Gu J. Expression profile of cancer-testis genes in 121 human colorectal cancer tissue and adjacent normal tissue. Clin Cancer Res 2005; 11: 1809-1814. (PMID: 15756003)
4. Tyagi P, Mirakhur B. MAGRIT: the largest-ever phase III lung can-cer trial aims to establish a novel tumor-specific approach to ther-apy. Clin Lung Cancer 2009; 10: 371-374. (PMID: 19808198)
5. Vansteenkiste JF, Zielinski M, Dahabreh IJ, Linder A, Lehmann F, Gruselle O, Therasse P, Louahed J, Brichard VG. Final results of a multi-center, doubleblind, randomized, placebo controlled Phase II study to assess the efficacy of MAGEA3 immunotherapeutic as adjuvant therapy in stage IB/II non-small cell lung cancer (NSCLC) [abstract]. J Clin Oncol 2007; 25(suppl): 398s.
6. CT Database. Accessed from: http://www.cta.lncc.br/
7. Chen YT, Hsu M, Lee P, Shin SJ, Mhawech-Fauceglia P, Odunsi K, Altorki NK, Song CJ, Jin BQ, Simpson AJ, Old LJ. Cancer/testis antigen CT45: analysis of mRNA and protein expression in human cancer. Int J Cancer 2009; 124: 2893-2898. (PMID: 19296537)
8. Chen YT, Venditti CA, Theiler G, Stevenson BJ, Iseli C, Gure AO, Jongeneel CV, Old LJ, Simpson AJ. Identification of CT46/HORMAD1, an immunogenic cancer/testis antigen encoding a putative meiosis-related protein. Cancer Immun 2005; 5: 9. (PMID: 15999985)
9. Van der Bruggen P, Traversari C, Chomez P, Lurquin C, De Plaen E, Van den Eynde BJ, Knuth A, Boon T. A gene encoding an antigen
6 of 9 www.cancerimmunity.org
Shantha Kumara et al.
recognized by cytolytic T lymphocytes on a human melanoma. J Immunol 2007; 178: 2617-2621. (PMID: 17312099)
10. Corrias MV, Scaruffi P, Occhino M, De Bernardi B, Tonini GP, Pis-toia V. Expression of MAGE-1, MAGE-3 and MART-1 genes in neuroblastoma. Int J Cancer 1996; 69: 403-407. (PMID: 8900375)
11. Suzuki K, Tsujitani S, Konishi I, Yamaguchi Y, Hirooka Y, KaibaraN. Expression of MAGE genes and survival in patients with hepato-cellular carcinoma. Int J Oncol 1999; 15: 1227-1232. (PMID: 10568832)
12. Inoue H, Mori M, Honda M, Li J, Shibuta K, Mimori K, Ueo H, Aki-yosh T. The expression of tumor-rejection antigen “MAGE” genes in human gastric carcinoma. Gastroenterology 1995; 109: 1522-1525. (PMID: 7557134)
13. Fujie T, Mori M, Ueo H, Sugimachi K, Akiyoshi T. Expression of MAGE and BAGE genes in Japanese breast cancers. Ann Oncol 1997; 8: 369-372. (PMID: 9209667)
14. Russo V, Traversari C, Verrecchia A, Mottolese M, Natali PG, Bor-dignon C. Expression of the MAGE gene family in primary and metastatic human breast cancer. Int J Cancer 1995; 64: 216-221. (PMID: 7622312)
15. Sienel W, Varwerk C, Linder A, Kaiser D, Teschner M, Delire M, Stamatis G, Passlick B. Melanoma associated antigen (MAGE)-A3 expression in Stages I and II non-small cell lung cancer: results of a multi-center study. Eur J Cardiothorac Surg 2004; 25: 131-134. (PMID: 14690745)
16. Old LJ. Cancer vaccines: an overview. Cancer Immun 2008; 8 Suppl. 1: 1. (PMID: 18333603)
17. Chen YT, Chadburn A, Lee P, Hsu M, Ritter E, Chiu A, Gnjatic S, Pfreundschuh M, Knowles DM, Old LJ. Expression of cancer testis antigen CT45 in classical Hodgkin lymphoma and other B-cell lym-phomas. Proc Natl Acad Sci USA 2010; 107: 3093-3098. (PMID: 20133697)
18. Lendvai N, Gnjatic S, Ritter E, Mangone M, Austin W, Reyner K, Jayabalan D, Niesvizky R, Jagannath S, Bhardwaj N, Chen-Kiang S, Old LJ, Cho HJ. Cellular immune responses against CT7 (MAGE-C1) and humoral responses against other cancer-testis antigens in multiple myeloma patients. Cancer Immun 2010; 10: 4. (PMID: 20108890)
19. Fujita S, Wada H, Jungbluth AA, Sato S, Nakata T, Noguchi Y, DokiY, Yasui M, Sugita Y, Yasuda T, Yano M, Ono T, Chen YT, Higashi-yama M, Gnjatic S, Old LJ, Nakayama E, Monden M. NY-ESO-1 expression and immunogenicity in esophageal cancer. Clin Cancer Res 2004; 10: 6551-6558. (PMID: 15475443)
20. Shantha Kumara HMC, Feingold D, Kalady M, Dujovny N, Sen-agore A, Hyman N, Cekic V, Whelan RL. Colorectal resection is associated with persistent proangiogenic plasma protein changes: postoperative plasma stimulates in vitro endothelial cell growth, migration, and invasion. Ann Surg 2009; 249: 973-977. (PMID: 19474682)
21. Kamangar F, Dores GM, Anderson WF. Patterns of cancer inci-dence, mortality, and prevalence across five continents: defining priorities to reduce cancer disparities in different geographic
regions of the world. J Clin Oncol 2006; 24: 2137-2150. (PMID: 16682732)
22. Gnjatic S, Old LJ, Chen YT. Autoantibodies against cancer anti-gens. Methods Mol Biol 2009; 520: 11-19. (PMID: 19381944)
Materials and methodsStudy population
A total of 82 patients with colorectal cancer (Stages II (n = 41), III (n = 34), and IV (n = 3) disease) who underwent large bowel resection and who voluntarily enrolled in an IRB approved prospective tissue and data bank, for whom an adequate volume of frozen tumor and normal colonic tissue were available, were included in this study. This banking protocol, which included pre- and postoperative plasma samples in addition to tumor samples, was organized by the Colon and Rectal Surgery Section of the New York-Presbyterian Hospital, Columbia University Health Science Campus in New York. Tumor and normal colon samples were obtained from operative specimens and flash frozen in a timely fashion after gross evaluation by a pathologist and maintained at -80°C until the time of analysis. Blood samples were collected preoperatively, processed in a timely fashion, and the plasma component stored in 500 μl aliquots that were rapidly frozen and stored at -80°C until use. Preoperative plasma samples from each patient were assessed for MAGE-A3, PLAC1, and CTAG2 antibodies.
Demographic data, as well as information regarding the indication for surgery, the location of the cancer, and the final staging results, were prospectively gathered for all patients. Recently transfused patients and immunocompromised patients were excluded.
Tissue harvest and preparationTumor and colon samples were obtained from operative
specimens after gross evaluation by a pathologist. Tumor and colon samples were placed in a standard Cryomold (Tissue Tek, Sakura Finetek, Torrance, CA) which were then filled with OCT (optimal cutting temperature) compound (Tissue Tek, Sakura Finetek, Torrance, CA) and placed in liquid nitrogen. Once preserved, frozen tissue samples were stored in a -80°C freezer until the time of analysis. Tissue samples from fresh frozen blocks were cut in the macromolecular laboratory at the Irving Comprehensive Cancer Center, an affiliate of New York-Presbyterian Hospital, Columbia University Health Science Campus, New York. Sections from the identified frozen tumor and normal colonic tissue blocks were taken at -20°C and assessed histologically to confirm the presence of tumor and the quality of each sample. 30 sections of 10 μm thickness were collected in PCR tube for RNA extraction, whereas 10 sections of 5 μm thickness were harvested and utilized for IHC.
RNA extractionTotal RNA was isolated from the tissue samples using Qiazol
(Qiagen, CA) and purified with miRNeasy Kit (Qiagen, CA). Briefly, sections of frozen tissue block embedded in OCT (optimum cutting temperature) compound were cut and placed into a 2 ml Eppendorf tube, and then homogenized by TissueLyser II (Qiagen, CA) with 1 ml Qiazol added. After the aqueous phase was recovered from chloroform-derived phase separation, another step of acid phenol-chloroform extraction was performed with a phase lock gel tube (Qiagen, CA). RNA precipitation, column binding, on-column DNase digestion,
www.cancerimmunity.org 7 of 9
Cancer Immunity (28 December 2012) Vol. 12, p. 16
washing, and elution were performed according to kit instructions. RNA integrity was confirmed by agarose gel electrophoresis and the concentration determined by measuring OD260nm in BioPhotometer (Eppendorf, NY).
Reverse transcriptionThe cDNA first strand reverse transcription was performed
with the ABI High Capacity RNA-to-cDNA Kit (Applied Biosystems, CA). Briefly, 1 μg of total RNA, 10 μl of 2X reverse transcription buffer, and 1 μl of 20X enzyme mix were incubated together in a total volume of 20 μl at 37°C for 60 minutes, followed by 95°C for 5 minutes, and held at 4°C. The synthesized cDNA was stored at -20°C until further use.
Semi-quantitative RT-PCRCell lines were obtained from the Cell Bank of the LICR, New
York Branch and were maintained in RPMI 10% FBS plus Non-essential amino acids. Total RNA from cell lines was prepared with RNeasy (Qiagen, Hilden, Germany). First strand cDNA was synthesized with 1 μg of total RNA using oligo (dT)12-18 primers or random hexamers (Invitrogen, Carlsbad, CA) and Omniscript Reverse Transcription (Qiagen, CA) in a total volume of 20 μl, and 1/5 of the volume of the cDNA was used in the semi-quantitative polymerase chain reaction (PCR) with primers listed in Table 1. After preheating at 94°C for 5 minutes, the PCR cycles (30 repeats) were as follows: 1 minute at 94°C, annealing at 60°C for 2 minutes, and extension at 72°C for 2 minutes, followed by a final extension for 7 minutes at 72°C. PCR products were evaluated by agarose gel (1.5%) electrophoresis. -Actin was amplified as control.
Quantitative PCRComparative quantitative PCR was performed in the
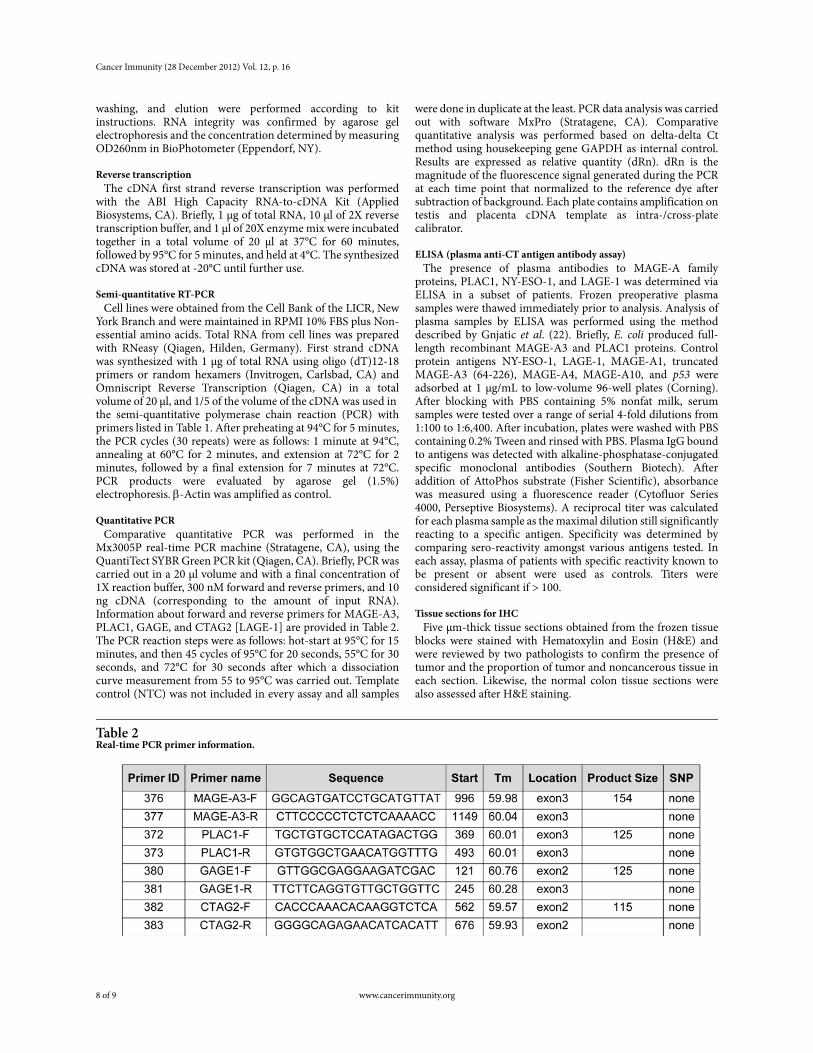
Mx3005P real-time PCR machine (Stratagene, CA), using the QuantiTect SYBR Green PCR kit (Qiagen, CA). Briefly, PCR was carried out in a 20 μl volume and with a final concentration of 1X reaction buffer, 300 nM forward and reverse primers, and 10 ng cDNA (corresponding to the amount of input RNA). Information about forward and reverse primers for MAGE-A3, PLAC1, GAGE, and CTAG2 [LAGE-1] are provided in Table 2. The PCR reaction steps were as follows: hot-start at 95°C for 15 minutes, and then 45 cycles of 95°C for 20 seconds, 55°C for 30 seconds, and 72°C for 30 seconds after which a dissociation curve measurement from 55 to 95°C was carried out. Template control (NTC) was not included in every assay and all samples
were done in duplicate at the least. PCR data analysis was carried out with software MxPro (Stratagene, CA). Comparative quantitative analysis was performed based on delta-delta Ct method using housekeeping gene GAPDH as internal control. Results are expressed as relative quantity (dRn). dRn is the magnitude of the fluorescence signal generated during the PCR at each time point that normalized to the reference dye after subtraction of background. Each plate contains amplification on testis and placenta cDNA template as intra-/cross-plate calibrator.
ELISA (plasma anti-CT antigen antibody assay)The presence of plasma antibodies to MAGE-A family
proteins, PLAC1, NY-ESO-1, and LAGE-1 was determined via ELISA in a subset of patients. Frozen preoperative plasma samples were thawed immediately prior to analysis. Analysis of plasma samples by ELISA was performed using the method described by Gnjatic et al. (22). Briefly, E. coli produced full-length recombinant MAGE-A3 and PLAC1 proteins. Control protein antigens NY-ESO-1, LAGE-1, MAGE-A1, truncated MAGE-A3 (64-226), MAGE-A4, MAGE-A10, and p53 were adsorbed at 1 μg/mL to low-volume 96-well plates (Corning). After blocking with PBS containing 5% nonfat milk, serum samples were tested over a range of serial 4-fold dilutions from 1:100 to 1:6,400. After incubation, plates were washed with PBS containing 0.2% Tween and rinsed with PBS. Plasma IgG bound to antigens was detected with alkaline-phosphatase-conjugated specific monoclonal antibodies (Southern Biotech). After addition of AttoPhos substrate (Fisher Scientific), absorbance was measured using a fluorescence reader (Cytofluor Series 4000, Perseptive Biosystems). A reciprocal titer was calculated for each plasma sample as the maximal dilution still significantly reacting to a specific antigen. Specificity was determined by comparing sero-reactivity amongst various antigens tested. In each assay, plasma of patients with specific reactivity known to be present or absent were used as controls. Titers were considered significant if > 100.
Tissue sections for IHCFive μm-thick tissue sections obtained from the frozen tissue
blocks were stained with Hematoxylin and Eosin (H&E) and were reviewed by two pathologists to confirm the presence of tumor and the proportion of tumor and noncancerous tissue in each section. Likewise, the normal colon tissue sections were also assessed after H&E staining.
Table 2Real-time PCR primer information.
8 of 9 www.cancerimmunity.org
Shantha Kumara et al.
IHC analysisImmunohistochemistry was performed on 54 fresh frozen
slides (27 tumor/normal pairs) using standard IHC protocol. The IHC evaluation had to be limited to MAGE due to unavailability of standardized antibodies for GAGE and PLAC1 analysis. IHC was not carried out for CTAG2 due to their poor expression levels noted in colon tumors. Fresh frozen samples of normal testis and placenta were selected as positive control. IHC staining was performed on 5 μm-thick sections of fresh frozen samples with monoclonal mouse antibody to MAGE-A (6C1) (sc-20034, Santa Cruz Biotechnology, Inc.). The slides were incubated in H2O2 solution for 10 minutes at room temperature to block the endogenous peroxidase activity. Antigen retrieval was performed by steamer heating in 10 mmol/L citrate buffer (pH 6.0). After epitope recovery, slides were incubated with primary antibody MAGE-A (6C1) 1:250 dilution overnight at 4°C. Slides were washed and incubated with secondary biotinylated anti-mouse IgG (H+L, Vector Laboratories, Inc.) at 1:500 dilution and tertiary streptavidin-peroxidase conjugate (ABC complex, Vector Laboratories, Inc.). Slides were treated with chromogen “diaminobenzidine” for antigen detection. Counterstaining was performed with hematoxylin, dehydrated, cleared in xylene, and mounted on coated slides. No IHC was performed for the other antigens.
Evaluation of immunohistochemical stainingImmunoreactivity was evaluated independently by two
pathologists and the percentage of tumor cells expressing MAGE-A3 determined. IHC staining was considered “positive” when at least 10% or more of the neoplastic cells stained positive. In addition, the intensity of staining was scored on a scale of 1 to 3 (1+ weak, 2+ moderate, and 3+ strong). IHC staining of 1+ intensity in < 10% of neoplastic cells was considered negative, whereas IHC staining of 2-3+ intensity in < 10% of cells was considered indeterminate.
Statistical analysisThe demographic and clinical data are expressed as the mean
and standard deviation of continuous variables, whereas frequencies and percentages were determined for categorical variables. The t-test was utilized for comparison of continuous variables. To gain insight into the relationship between multiple ordinal variables with non-normal distribution, a nonparametric Spearman’s Rho test which tests for correlation between two rank-ordered variables was used. A p value between 0.01 and 0.1 was considered statistically significant.
ContactAddress correspondence to:
Richard L. Whelan, M.D.Section of Colon and Rectal Surgery, Department of SurgeryNew York-Presbyterian Hospital, Columbia University177 Fort Washington AvenueNew York, New York 10032USATel.: + 1 212 523 8172Fax: + 1 212 523 8857E-mail: [email protected]
www.cancerimmunity.org 9 of 9