magchiel van meeteren overcoming a restrictive headstart
TRANSCRIPT

Magchiel van Meeteren
Overcoming a restrictive headstart

Goal and topics
– Mixed mode has not changed much since introduction. How do we face the challenges of today’s traditional modes and get prepared for the future?
– Statistics Netherlands: characteristics– Strategy of Data Collection– Challenges of modes used– Goals of current reorganization and actions taken
2Heerlen
Den Haag
2
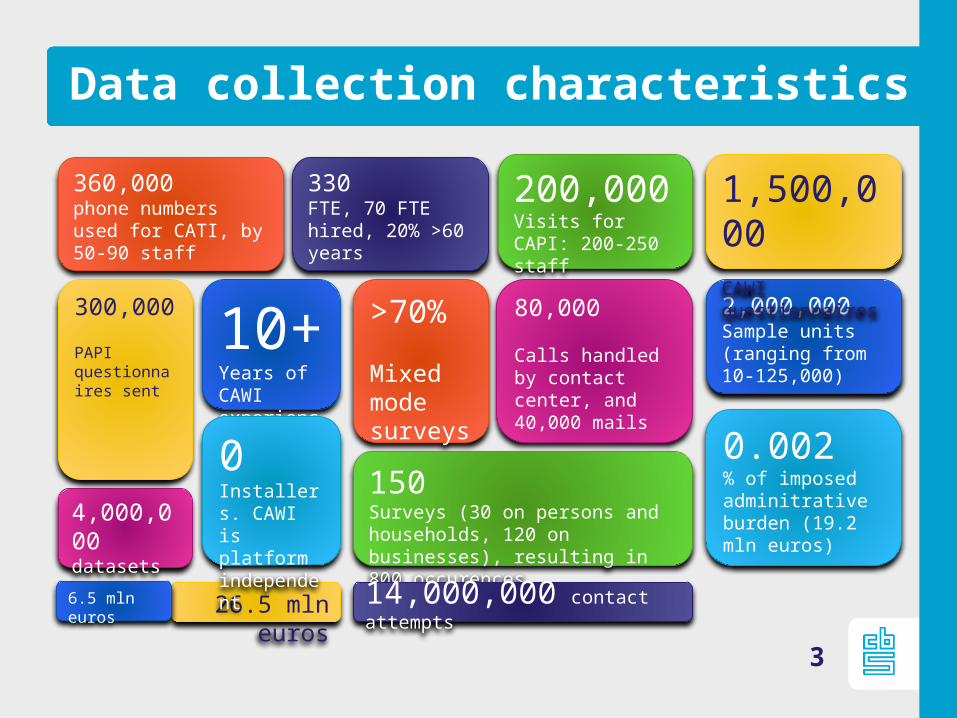
Data collection characteristics
10+Years of CAWI experience
>70%
Mixed modesurveys
150Surveys (30 on persons and households, 120 on businesses), resulting in 800 occurences
200,000Visits for CAPI: 200-250 staff
26.5 mln euros
6.5 mln euros
2,000,000 Sample units (ranging from 10-125,000)
1,500,000 CAWI questionnaires
14,000,000 contact attempts
4,000,000 datasets
360,000phone numbers used for CATI, by 50-90 staff
80,000
Calls handled by contact center, and 40,000 mails
300,000
PAPI questionnaires sent
330 FTE, 70 FTE hired, 20% >60 years
0.002% of imposed adminitrative burden (19.2 mln euros)
0Installers. CAWI is platform independent
3
Strategy
– Maximum use of administrative records and other databases
– Use of digital company records containing financial and economical data via Standard Business Reporting
– Remaining data collection is performed mixed mode inducing a minimum of actual and perceived administrative burden
4

Challenges CAWI
– Drawbacks‐ Predictability: fluctuation in response (15-40%)• 10% up by use of unconditional incentives
‐ Accessability: OS independent, not browser independent• Based on IE: <24% all versions, <5% IE9• Questionnaires not guaranteed usable on all mobile
devices (<10% use of mobile devices, 15-20% in personal/households surveys)
‐ Perception: Layout has not changed since 20085

Challenges CATI
6
Jan-
13
Mar-1
3
May-1
3
Jul-1
3
Sep-
13
Nov-1
3
Jan-
14
Mar-1
4
May-1
4
Jul-1
4
Sep-
14
Nov-1
430.00%
35.00%
40.00%
45.00%
50.00%
55.00%
60.00%
65.00%
LFS
Interverwerrespons % Overhaal %Strenge respons Linear (Strenge respons)Target (strenge respons)

Challenges CAPI
- Unique selling point: nation-wide coverage. but who is willing to pay?
- External contracts are prerequisite- Flexibility in scaling is low (hiring and training)- Call for use of tablets instead of laptops
7

Goals of reorganisation
– Increased satisfaction of both customers and respondents– Renewal of all major processes and IT – taking CAWI to
the next level – Strengthened chain management, introducing LEAN– Investing on further use of administrative sources,
databases, streams and Big Data
8
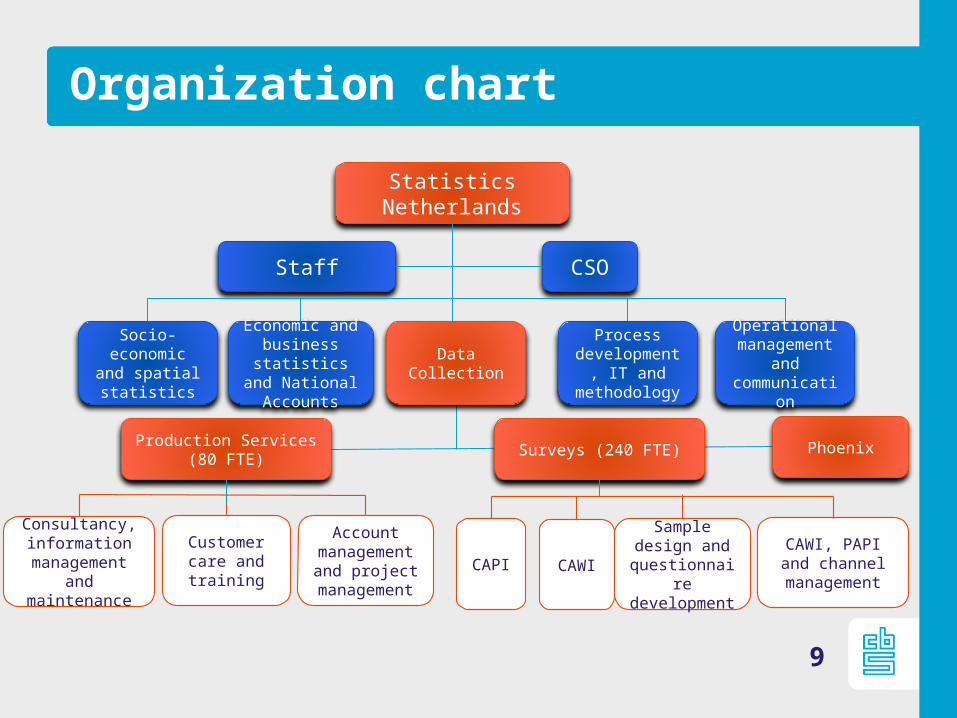
Organization chart
Statistics Netherlands
Socio-economic and
spatial statistics
Economic and business
statistics and National Accounts
Staff CSO
Process development,
IT and methodology
Data Collection
Operational management
and communicati
on
Production Services (80 FTE)
Surveys (240 FTE)
Consultancy, information
management and
maintenance
Customer care and training
Account management and project
management
CAPI CAWI
Sample design and
questionnaire
development
CAWI, PAPI and channel
management
Phoenix
9
Increased satisfaction
– Objective measurement of performance by KPI’s – Pro-active relation management (extended monitoring of
process performance and IT)– Decreasing time to market in questionnaire development– Expanding service windows for IT services (7x16) and
customer care (5x10)– Continuous assessment of communication expressions– Monitoring of customer care on quality and quantity
10

11
Renewal of processes and IT
– Design Principles ‐ Standardization where possible ‐ Modern technology, collection methods and channels‐ Blaise 5 core‐ Modular (Flexible and scalable) and unimode
datamodel‐ Pressure cooker sessions to integrate with business
strategy: strong focus on CAWI‐ Transit time 3-4 years

12
Summary
‐ It is time to take data collection to the next level due to society characteristics, new technologies and available budgets
‐ Requires new skills, professionalization in operations, new processes and new IT
‐ Heading for data collection in 2025 fully based on (administrative) sources and CAWI

Annex
– Information about the SBR/ RGS programme at SN, sheets made available by Marko Roos [email protected]
13

Getting data from digital company records
14
– Getting data from digital company records is about messages containing financial data
– Standardization is essential:‐ Content of messages‐ Structure of messages‐ Processes of message-exchange‐ Message infrastructure We can not deal with each financial administration individually
– Conditional for succes is set of agreements between companies, software vendors, accountants and goverment
– Availability of digital standards facilitates acceptance

Structural Business Reporting in the Netherlands
– Standardization of ‐ Infrastructure for sending and receiving messages‐ Processes‐ Message structure (XBRL)
– XBRL: ‐ Formal standard message structure‐ XBRL Taxonomy formally describes content of message‐ XBRL Taxonomy is the heart of SBR: harmonization of
concepts of participating organisations
15

Structural Business Reporting in the Netherlands
– Start of Structural Business Reporting Program in 2007.– Set of agreements on exchanging financial company data:
‐ Three government agencies:• Tax authority• Statistics Netherlands• Chamber of Commerce (annual reports)
‐ Banks (big three, for standard credit reports)‐ Software vendors‐ Accountants (big five)
– all aligned for Structural Business Reporting (or… maybe they were not?)
16

Critical succes factors of SBR/ XBRL
– SBR/ XBRL may reduce time needed/ costs of creating digital reports for accountants and software providers but:‐ Requires investments ‐ Accountants charge time based fees, reduction in time needed for
creating reports, means less turnover– So: acceptance/ take-up rate has been very slow.– Since 2013, new policy: obligation for Tax and annual reports to
report in SBR/XBRL – Since 2015: system to system data for short term statistic and
investment statistic in SBR/XBRL only (s-to-s in 2014 only marginal)– For Tax and annual reports now > 50 percent SBR filing
17
Obstacles (and how to remedy them) in statistical SBR reporting
– Obstacles:‐ Limited businesscase: only small (unpredictable) sample of
companies need to provide data‐ Not all required data are present in company records‐ Statistical consolidation of company data may differ from
consolidation for annual report– How to tackle (2015):• Discuss with software providers and accountants how to provide
data for their clients• Build a portal based on XBRL technology• For top 1900 companies, SBR reporting not yet allowed
18

Long term vision on statistical SBR reporting
– Standardisation of content with standard ledger system is underway
– Statistical financial reporting based on standard ledger
– If standard ledger information is widespread:‐ more financial information ‐ from more companies
– wil be more easy accessible in bookkeeping systems from companies or accountants . Data collection strategy may change from sample based to high volume data collection
19