"mafsi commercial foodservice market forecast report" · welcome to mafsi, and our 2017...
TRANSCRIPT
MAFSI.ORG
MAFSI COMMERCIAL FOODSERVICE MARKET FORECAST REPORT
2017
2017 COMMERCIAL FOODSERVICE MARKET FORECAST REPORT2
WELCOME TO MAFSI, AND OUR 2017 COMMERCIAL FOODSERVICE MARKET FORECAST.
MAFSI is a 67 year-old non-profit trade association comprised of 275
independent manufacturers’ representative sales companies and 260
manufacturing companies in North America selling, marketing, and
producing commercial foodservice equipment, supplies, tabletop,
and furnishings.
And as members, they reinvent it. They make it different, and they make
it better.
Representing over 2,400 sales and marketing professionals and
manufacturing executives across North America; MAFSI provides
market forecasting, networking and partnership opportunities, industry
stewardship, education and resources, and member advocacy for the
$12 billion commercial non-foods industry.
MAFSI REP firms are independent professional providers of field-level
sales and marketing services to manufacturers and/or suppliers. They
typically handle a portfolio of related but noncompetitive product
lines, working under a contractual arrangement within a defined
geographic region, and on an exclusive basis within their assigned field
of responsibility.
On behalf of their manufacturers, MAFSI REPS exclusively represent
approximately 12-18 foodservice manufacturers in their defined
geographic region. There are typically 10-20 MAFSI REP agencies in
each marketing region.
MAFSI REP firms come in all shapes and sizes, but on average generate
10 - 18 million dollars in gross sales, and typically employ three to four
field representatives, with an additional two to three inside customer
service personnel. A strong majority of firms have showrooms and test
kitchens to assist customers in project planning.
The value that MAFSI REPS bring—both to those they sell to, and those
they sell for—emerges in large part from the synergy created through
the representation of multiple manufacturers. Their product portfolios
allow MAFSI REPS to present broad-based solutions to customer
problems, rather than the price-and-delivery model typical of single-
product selling. Their consultative approach not only opens the door for
the other manufacturers they represent, but also adds value and fosters
a partnership with the buyer as the purchase progresses through an
entire project.
MAFSI 2017 MARKET FORECAST
2017 OFFICERS
PresidentJeff CouchPreferred Marketing GroupChatsworth, CA
Vice PresidentChris Jeens, CPMRW. D. Colledge Co., Ltd.Mississauga, ON, Canada
TreasurerKevin Eaton, CFSPEaton Marketing Associates, Inc.Clearwater, FL
Past PresidentJoe Ferri, CFSP, CPMRPecinka Ferri Associates
Fairfield, NJ
2017 BOARD OF DIRECTORS
Steve Amos, CFSP, CPMRHRI, Inc.St. Clair Shores, MI
Melissa GreenwaldZink Foodservice GroupWesterville, OH
Sandra HamiltonAgences Hamilton AgenciesLachine, QC, Canada
Tom Hanna, CFSPHanna Young & AssociatesHartland, WI
Neil Inverso, CFSPONE SOURCERichboro, PA
Wayne JonesThe Hansen GroupDuluth, GA
Mitch MarcotteGMV Sales AssociatesWestborough, MA
James Mathis, CFSPEquipment Preference, Inc. (E.P.I.)Southlake, TX
Rob McKeown, ServSafeLehr McKeown Marketing, Inc.Merrick, NY
Tom MitchellTLC Marketing Inc.Calgary, AB, Canada
Matt O’DonnellMidwest Professional Reps, Inc.Stilwell, KS
Jordan VeitchVeitch GroupFt. Lauderdale, FL
Jason WangeDesert Peak MarketingDenver, CO

2017 COMMERCIAL FOODSERVICE MARKET FORECAST REPORT 3
Our manufacturers’ representative members are also the window to the
foodservice marketplace. From mom and pop restaurants, to colleges,
hospitals, and major chains—our members are there. With the people, the
products, and the relationships that move an entire industry further than
ever before.
MAFSI is home to 71% of all manufacturers’ representative firms in the U.S.
and Canada; with 54% of our representative firm members participating in
our annual Commercial Foodservice Market Forecast—a prime reflection
of our members’ commitment to this industry. Moreover, since MAFSI
REPS call on almost all facets of commercial foodservice, there is no one
better equipped to report the market dynamics that affect our industry.
And this report isn’t only relied on by our industry, but by incredibly
influential trade and mainstream media outlets including the Wall Street
Journal, Yahoo! Finance, and many, many more.
We thank our representative members not only for their contributions
to this report, but for the hard work and pride they bring to this industry
each and every day.
For more information about MAFSI and our members, please visit www.mafsi.org, or call 404/214-9474.
MAFSI 2017 MARKET FORECAST
MAFSI STAFF
Alison CodyExecutive Director
Tom JedlowskiAssociate Executive Director
Ramsey Ruether Membership and Association Services Coordinator

2017 COMMERCIAL FOODSERVICE MARKET FORECAST REPORT4
According to the MAFSI Business Barometer, now in its 14th year, sales
growth has been locked into a +4% to +5% range for the past 6 years.
The good news is that MAFSI Reps are again forecasting sales growth
of +4.4% for all of 2017. This is consistent with the 2016 forecast of 4.5%.
Since the recovery from the great recession began in 2010, foodservice
equipment and supply sales have grown at more than twice the rate of
the overall U.S. economy.
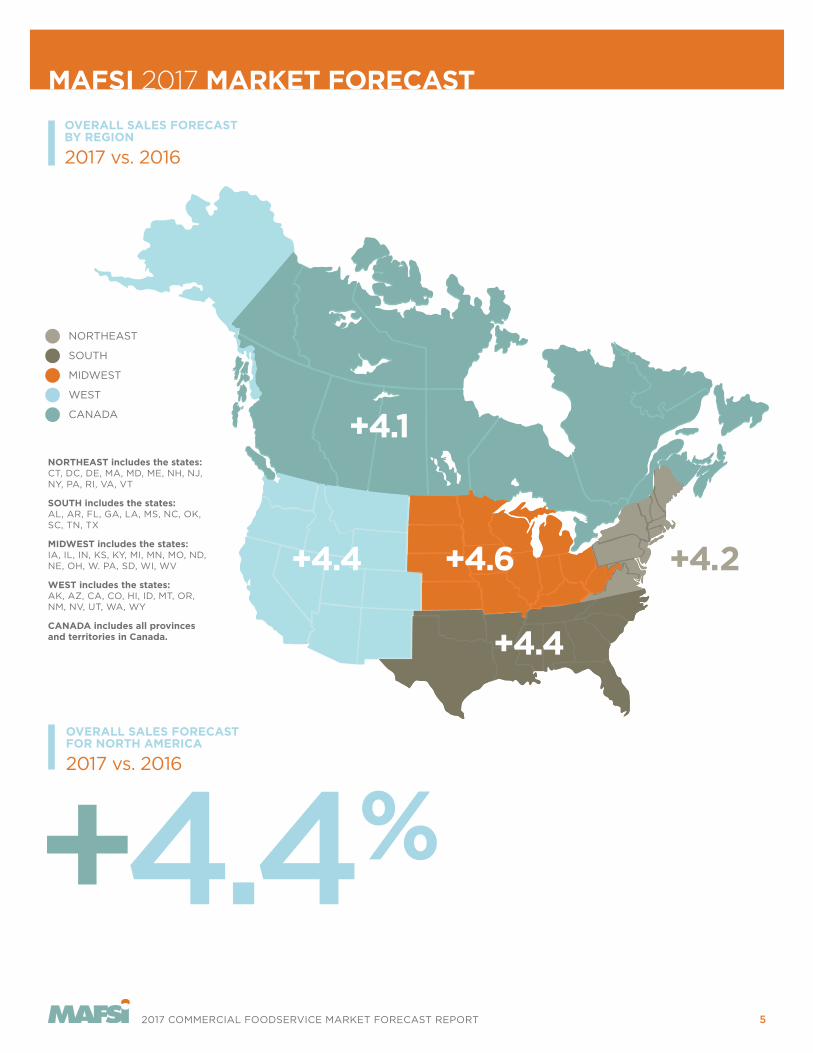
This forecast is remarkably consistent from region to region with reports
of +4.6% in the Midwest to +4.4% in the South and West, +4.2% in the
Northeast and +4.1% in Canada.
This consistency is also observed by product category with Tabletop at
+5.0%, Furnishings at +4.6%, Equipment at +4.4% and Supplies at +4.1%.
MAFSI 2017 MARKET FORECAST
Since the recovery
from the great
recession began in
2010, foodservice
equipment and
supply sales have
grown at more
than twice the
rate of the overall
U.S. economy.
MAFSI BUSINESS BAROMETER HISTORY
Overall Sales Per Quarter for 2002-2016
10%
5%
0%
-5%
-10%
-15%
FORECAST ACTUAL
Q2/0
2Q
3/0
2Q
4/0
2Q
1/0
3Q
2/0
3Q
3/0
3Q
4/0
3Q
1/0
4Q
2/0
4Q
3/0
4Q
4/0
4Q
1/0
5Q
2/0
5Q
3/0
5Q
4/0
5Q
1/0
6Q
2/0
6Q
3/0
6Q
4/0
6Q
1/0
7Q
2/0
7Q
3/0
7Q
4/0
7Q
1/0
8Q
2/0
8Q
3/0
8Q
4/0
8Q
1/0
9Q
2/0
9Q
3/0
9Q
4/0
9Q
1/10
Q2/1
0Q
3/1
0Q
4/1
0Q
1/11
Q2/1
1Q
3/1
1Q
4/1
1Q
1/12
Q2/1
2Q
3/1
2Q
4/1
2Q
1/13
Q2/1
3Q
3/1
3Q
4/1
3Q
1/14
Q2/1
4Q
3/1
4Q
4/1
4Q
1/15
Q2/1
5Q
3/1
5Q
4/1
5
Q1/
16Q
2/1
6Q
3/1
6
NOTE: Y axis is the percentage of change from comparable quarter of prior year.
2017 COMMERCIAL FOODSERVICE MARKET FORECAST REPORT 5
MAFSI 2017 MARKET FORECAST
OVERALL SALES FORECASTFOR NORTH AMERICA
2017 vs. 2016
+4.4%
SOUTH
MIDWEST
NORTHEAST
WEST
CANADA
+4.4
+4.6 +4.2+4.4
+4.1
OVERALL SALES FORECASTBY REGION
2017 vs. 2016
NORTHEAST includes the states:CT, DC, DE, MA, MD, ME, NH, NJ, NY, PA, RI, VA, VT
SOUTH includes the states:AL, AR, FL, GA, LA, MS, NC, OK, SC, TN, TX
MIDWEST includes the states:IA, IL, IN, KS, KY, MI, MN, MO, ND, NE, OH, W. PA, SD, WI, WV
WEST includes the states:AK, AZ, CA, CO, HI, ID, MT, OR, NM, NV, UT, WA, WY
CANADA includes all provinces and territories in Canada.
ACTUAL

2017 COMMERCIAL FOODSERVICE MARKET FORECAST REPORT6
A further measurement of sales growth confidence is observed in both
Quoting Activity and Consultant Activity. Quoting Activity for 2017 is
forecasted to have 52% More Activity than 2016, 37% forecast No Change
and 10% forecast Less Activity.
Consultant Activity for 2017 is forecasted to have 48% More Activity than
2016, 43% forecast No Change and 9% forecast Less Activity.
The fastest growing end user segments were identified from the top as
Chain Accounts, Healthcare, Schools (K-12), Business and Industry, and
Colleges and Universities.
MAFSI Reps added one in staff in 2016 and plan to add more in 2017.
They also intend to expand their linecards by one as well.
MAFSI 2017 MARKET FORECAST
Consultant Activity
for 2017 is forecasted
to have 48% More
Activity than 2016,
43% forecast
No Change and 9%
forecast Less Activity.
MAFSI BAROMETER
Quotation and Consultant Activity
60
50
40
30
20
10
0
Q2/14 Q3/14 Q4/14 Q1/15 Q2/15 Q3/15 Q4/15 Q1/16
QUOTE ACTIVITY CONSULTANT ACTIVITY
NOTE: This graph shows the difference between those reporting more activity vs. those reporting less activity. SOURCE: Foodservice Equipment Reports
Q2/16
QUOTING ACTIVITY FORECAST
2017
52%
37%
10%48%
43%
9%
MORE ACTIVITY
NO CHANGE
LESS ACTIVITY
CONSULTANT ACTIVITY FORECAST
2017
MORE ACTIVITY
NO CHANGE
LESS ACTIVITY

2017 COMMERCIAL FOODSERVICE MARKET FORECAST REPORT 7
WEST +4.5 +4.0 +3.9 +4.4 +4.4 +3.9 +2.3
SOUTH +4.4 +4.3 +3.9 +4.2 +4.2 +4.0 +4.6
NORTHEAST +4.6 +4.9 +3.5 +3.4 +4.2 +3.3 +2.8
MIDWEST +5.0 +5.0 +4.3 +4.6 +4.6 +4.0 +3.6
CANADA +3.3 +3.4 +5.8 +4.6 +4.0 +3.8 +4.3
OVERALL +4.5 +4.5 +4.1 +4.2 +4.3 +3.9 +3.3
equipment
+4.4%
tabletop
+5.0%
supplies
+4.1%
furnishings
+4.6%
overall
+4.4%
PRODUCT CATEGORIESSALES FORECAST—OVERALL
2017 vs. 2016
MAFSI 2017 MARKET FORECAST
EQUIPMENT SUB-CATEGORIES SALES FORECAST BY REGION
2017 vs. 2016
* The equipment sub-category sales growth is calculated using a weighted average based on the percentage of the equipment sub-category sales volume represented by the various sales categories: Primary Cooking (26%), Refrigeration/Ice Machines (32%), Storage/Handling (9%), Serving (16%), Food Prep (7%), Warewashing (10%) from the (NAFEM) biennial “Size & Shape of the Industry” study. Ventilation not weighted.
PRODUCT CATEGORIES SALES FORECAST BY REGION
2017 vs. 2016
* The overall industry sales growth is calculated using a weighted average based on the percentage of the total sales volume for the overall industry represented by the various sales categories: Equipment (77%), Supplies (6%), Tabletop (11%), and Furnishings (6%). Market numbers are based on the North American Association of Food Equipment Manufacturers (NAFEM) biennial “Size & Shape of the Industry” study.
equipment supplies tabletop furnishings overall
WEST +4.2 +3.8 +5.6 +4.8 +4.4
SOUTH +4.2 +4.2 +5.2 +5.7 +4.4
NORTHEAST +4.2 +4.5 +4.8 +3.0 +4.2
MIDWEST +4.7 +4.0 +4.3 +3.8 +4.6
CANADA +3.9 +3.6 +5.6 +5.0 + 4.1
Primary Cooking
Refridgeration & Ice Machines
Storage &Handling
Serving FoodPreparation
Warewashing &Sanitation
Ventilation

2017 COMMERCIAL FOODSERVICE MARKET FORECAST REPORT8
Although the overall forecast is one of “FULL STEAM AHEAD,” there are
many questions and issues of concern on the horizon including:
• How is quick service being impacted by supermarket prepared foods?
• What will be the impact of $15.00/hour wage initiatives across
many states?
• With many regions nearing “full employment” who will fill new jobs?
• How is the growth in the Business and Industry sector affecting
Restaurant employment as they compete for skilled labor
including chefs?
• What is the impact of the Presidential race outcome?
• Can the election bring about economic disruption?
All in all, we have the momentum, fueled by a strong pipeline to weather
most storms.
Stay the course, invest in your business and appreciate the contribution
of your manufacturer representatives.
Special thanks to Michael Posternak, PBAC, Eastchester, NY for his 2017
forecast commentary. We also extend sincere thanks to our industry
partners at Foodservice Equipment Reports, Foodservice Equipment &
Supplies, Foodservice and Hospitality, Technomic, and AutoQuotes for
sharing their data and expertise in our forecast report.
Visit MAFSI.org to learn more.
MAFSI 2017 MARKET FORECAST
NEW LINES ADDED BY MAFSI REPS IN THE
Last 12 MonthsOverall increase in number of lines: +1.0
SOUTH
MIDWEST
NORTHEAST
WEST
CANADA
NORTHEAST includes the states:CT, DC, DE, MA, MD, ME, NH, NJ, NY, PA, RI, VA, VT
SOUTH includes the states:AL, AR, FL, GA, LA, MS, NC, OK, SC, TN, TX
MIDWEST includes the states:IA, IL, IN, KS, KY, MI, MN, MO, ND, NE, OH, W. PA, SD, WI, WV
WEST includes the states:AK, AZ, CA, CO, HI, ID, MT, OR, NM, NV, UT, WA, WY
CANADA includes all provinces and territories in Canada.
All in all, we have
the momentum,
fueled by a strong
pipeline to weather
most storms.
+1.0
+1.4 +1.7+0.3
+0.2

2017 COMMERCIAL FOODSERVICE MARKET FORECAST REPORT 9
MAFSI 2017 MARKET FORECAST
2017 FASTEST GROWINGSEGMENTS
by Percentage of Respondents
Chain Accounts
Healthcare
Schools (K-12)
Business and Industry
Colleges and Universities
Convenience Stores
Hotel/Motel
Independent Operators
Casinos/Gaming
Supermarkets
Country Clubs
Fine Dining
Commissaries/Food Process
Contract Feeders
Bakeries
Sports Venues
Theme Parks
Corrections
Cruise Ships
International/Export
Military
21.1%
15.0%
10.9%
9.5%
8.8%
6.8%
6.8%
6.1%
4.8 %
4.1%
2.0%
1.4%
1.4%
0.7%
0.7%
0.0%
0.0%
0.0%
0.0%
0.0%
0.0%
OVERALL
NORTHEAST
SOUTH
MIDWEST
WEST
CANADA
0.0 0.5 1.0 1.5 2.0 2.5
0.3
0.3
0.6
0.9
0.8
1.0
0.7
0.7
0.6
0.8
0.3
0.8
INCREASE IN REP FIRM STAFF BY REGION
2017 vs. 2016 2016 2017
3.0

2017 COMMERCIAL FOODSERVICE MARKET FORECAST REPORT10
MAFSI 2017 MARKET FORECAST
Capital Investments
1. Implementation of SpecPath®, 11-40-00 specification tracking software to ensure proper credit, and provide manufacturers with crucial marketing intelligence.
2. Increased number of staff through creation of strategic account teams.
3. Marked increases in cloud and mobile technology, increasing service ability on the go.
4. Expanding of almost all overhead including offices, culinary innovation centers, test kitchens, showrooms, and more.
HOW MAFSI REPS WILL MOVE
with the Market in 2017
MAFSI Reps were asked to identify significant actions taken and/or planned for 2016-17.The leading responses were:
Marketing Investments
1. Increased travel budgets to attend more trade shows, sales meetings, and operator calls.
2. Upgrades to websites, and social media platforms.
3. Hired outside marketing agencies to help further firms’ goals.
4. Leveraged online marketing leads to increase operator calls, and drive sales.
Operations Investments
1. Continued investment in dealer training and motivation.
2. Expanding calls to include service companies as a means to increase leads.
3. Created position to handle all service issues to ensure they are handled correctly.
4. Continue to leverage end users calls as means to create spec and improve customer experience.
Strategic Product Realignment
1. Diversification of product offering to help facilitate multi-line offerings, and increase meetings.
2. Increased operator meetings by all means possible including online marketing, e-blasts, lunch and learns, and test kitchen events.
3. Strengthened position with online dealers and retailers.
4. Continue to push sales and information through market segment channels to maximize relevance.

2017 COMMERCIAL FOODSERVICE MARKET FORECAST REPORT 11
MAFSI 2017 MARKET FORECAST
WHERE DO YOUR SALES COME FROM?
MAFSI recently conducted two member surveys, asking our rep members
a very simple question: “Where do your sales come from?” We conducted
a categorical survey in October of 2015, and again in April of this year.
Separating our data into the classic four pillars, (equipment, supply,
tabletop, and furniture) we gave our members seven of the most common
ways sales are propagated across the industry.
Once again, in all cases, reps take the leading role in selling products,
developing leads, assisting DSR’s, facilitating demo’s and service, and
stimulating demand for new products.
It’s clear the results vary tremendously when dealing with highly engineered/
custom solutions where the rep and consultant are more apt to be the
prime “driver,” as opposed to the lower tech “off the shelf,” basic product.
The following graphs represent the percent of sales most attributed to
each industry participant. Obviously, many sales are the result of joint
collaboration of industry partners and result in smoother sales, happier
customers, and a better industry overall.
Once again, in all
cases, reps take
the leading role
in selling products,
developing leads,
assisting DSR’s,
facilitating demo’s
and service, and
stimulating demand
for new products.
PERCENTAGE OF WHERE SALES COME FROM
by Industry Participant
Sp
ecifi
ed
by R
ep
Sp
ecifi
ed
by C
on
sult
an
t
Req
uest
ed
by E
nd
-Use
r
Dir
ect
Rep
lacem
en
t
Sp
ecifi
ed
by D
eale
r/D
SR
So
ld f
rom
Deale
r S
tock
E-C
om
merc
e S
ale
s
Sp
ecifi
ed
by R
ep
Req
uest
ed
by E
nd
-Use
r
Dir
ect
Rep
lacem
en
t
Sp
ecifi
ed
by D
eale
r/D
SR
So
ld f
rom
Deale
r S
tock
E-C
om
merc
e S
ale
s
Sp
ecifi
ed
by R
ep
Req
uest
ed
by E
nd
-Use
r
Dir
ect
Rep
lacem
en
t
Sp
ecifi
ed
by D
eale
r/D
SR
So
ld f
rom
Deale
r S
tock
E-C
om
merc
e S
ale
s
Sp
ecifi
ed
by R
ep
Sp
ecifi
ed
by C
on
sult
an
t
Req
uest
ed
by E
nd
-Use
r
Dir
ect
Rep
lacem
en
t
Sp
ecifi
ed
by D
eale
r/D
SR
So
ld f
rom
Deale
r S
tock
E-C
om
merc
e S
ale
s
27.
5%
21.
0%
13.5
%
9.8
%
15.7
%
6.7
%
5.9
%
7.2%
24
.4%
14.9
%
13.6
%
15.9
%
24
.0%
33.4
%
15.7
%
14.0
%
16.7
%
13.9
%
6.4
%
40
.5%
17.1
%
11.1
%
7.7%
13.9
%
4.4
%
5.3
%
EQUIPMENT SALES SUPPLY SALES TABLETOP SALES FURNITURE SALES

2017 COMMERCIAL FOODSERVICE MARKET FORECAST REPORT12
2017 FOODSERVICE E&S MARKET FORECAST
By Robin Ashton, Publisher Foodservice Equipment Reports
While the rate of growth of the foodservice equipment and supplies market
in the U.S. and Canada is beginning to slow, Foodservice Equipment
Reports expects the market to continue to expand for years to come.
We estimate the market peaked in 2015 with nominal growth at the
manufacturers’ level of 4.8% and real growth, after factoring out E&S
price increases, of 2.5%. While 2016 still has a quarter to go, we forecast
market growth of 4.6% in current dollars with real growth of 2.1% this year.
For 2017, we forecast nominal growth will slow to 4.1% with real growth
of 1.8%. A factor underlying the slowing real growth numbers are higher
than expected manufacturer list-price increases. Still, next year will be the
eighth consecutive year of positive real growth for the E&S industry.
There are certainly some downside risks facing the market next year.
Larger chains have seen same-store sales and traffic slide throughout
2016, especially among full-service concepts. Such trends are typically
the leading indicator for the foodservice and E&S markets. The National
Restaurant Association’s Restaurant Performance Index slid into
contraction territory in August, the second time the index has dipped
below the 100 level tipping point in the last nine months. Current same-store
sales and customer traffic were especially weak. Both indicators have
been in contraction territory for four consecutive months. Before
December last year, the overall index had been in expansion territory
for 34 consecutive months.
While 2016 still has
a quarter to go,
we forecast market
growth of 4.6%
in current dollars
with real growth
of 2.1% this year.
EQUIPMENT, SUPPLIES, TABLETOP, FURNISHINGS AND EQUIPMENT SUB-CATEGORIES
2017 FER Forecast REAL GROWTHPRICESNOMINAL GROWTHSALES $ FORECAST% OF MARKET
77%
6%
11%
6%
100%
27%
32%
9%
15%
6%
11%
100%
$9,068.200
$ 742.361
$ 1,282.401
$ 752.875
$11,845.837
$ 2,439.310
$ 2,905.546
$ 821.893
$ 1,379.626
$ 560.942
$ 960.883
$9,068.200
4.1%
4.6%
4.4%
4.1%
4.1%
4.2%
4.1%
3.9%
3.9%
3.8%
4.3%
4.1%
2.4%
2.4%
2.4%
2.3%
2.4%
2.4%
2.3%
2.3%
2.5%
2.4%
2.5%
2.4%
1 .7%
2.2%
2.0%
1.8%
1.8%
1.8%
1.8%
1.6%
1.4%
1.4%
1.8%
1.7%
Equipment
Smallwares
Tabletop
Furnishings & Custom Fabrication
TOTAL INDUSTRY
Primary Cooking Equipment
Refridgeration & Ice Machine
Storage & Handling Equipment
Serving Equipment
Food Preparation Equipment
Warewashing & Sanitation Equipment
TOTAL EQUIPMENT
Market numbers are based on the North American Association of Food Equipment Manufacturers biennial “Size & Shape of the Industry” study. Copyright 2014. Sales are $Millions. Thus Storage & Handling Equipment sales in 2017 are $821,893,000. Sales include export sales and are a reflection of North American sales and market size. Base year is 2013. Growth estimates and forecast copyright 2016 Foodservice Equipment Reports.

2017 COMMERCIAL FOODSERVICE MARKET FORECAST REPORT 13
2017 FOODSERVICE E&S MARKET FORECAST
But most other factors that drive the operator and E&S markets remain
very positive. Jobs growth trends, disposable income forecasts, and
consumer confidence levels all portend continuing growth of foodservice
sales. Gasoline prices remain at very low levels and are forecasted
to remain low through 2017. Wholesale food prices continue to fall,
boosting operator margins and consumer household income.
According to the MAFSI Barometer, quotation and consultant activity
remain at very high levels. And the overall MAFSI Barometer continues
to grow at a rate of nearly 5% a quarter. The four-quarter moving average
through second quarter 2016 is 4.9%.
And some of the reported slowdown in restaurant sales and traffic may
be overstated. The NPD Group, whose CREST consumer studies are the
broadest measure of foodservice activity, reported restaurant traffic was
flat, not negative, in the first two quarters of 2016. Some of the recent
restaurant sales and traffic slowdown may also be a factor of uneasiness
about the presidential election. Most importantly, the capital spending
indicators in NRA’s Performance Index remain very positive, despite the
sales and traffic slowdown, though the trend has slowed somewhat from
last year’s record levels.
-8-7-6-5-4-3-2-101234567
2016F2015F201420132012201120102009200820072006200520042003
THE E&S MARKET
2003-2017 NOMINAL SALES REAL SALES
7
6
5
4
3
2
1
0
-1
-2
-3
-4
-5
-6
-7
-8
SOURCE: Technomic Operator Sales Changes
2003 2004 2005 2006 2007 2008 2009 2010 2011 2012 2013 2014 2015 2016F 2017F
Jobs growth trends,
disposable income
forecasts, and
consumer confidence
levels all portend
continuing growth
of foodservice sales.
2017 COMMERCIAL FOODSERVICE MARKET FORECAST REPORT14
2017 FOODSERVICE E&S MARKET FORECAST
TECHNOMIC OPERATOR SALES FORECASTS BULLISH
Last May, in its 2016 operator sales forecast revision and preliminary 2017
forecast, Technomic Inc. remained very bullish about operator prospects in
2017. They forecast the total foodservice market will grow 5% this year, and
4.9% in 2017. Real growth was pegged at 2.3% this year and 2.4% next.
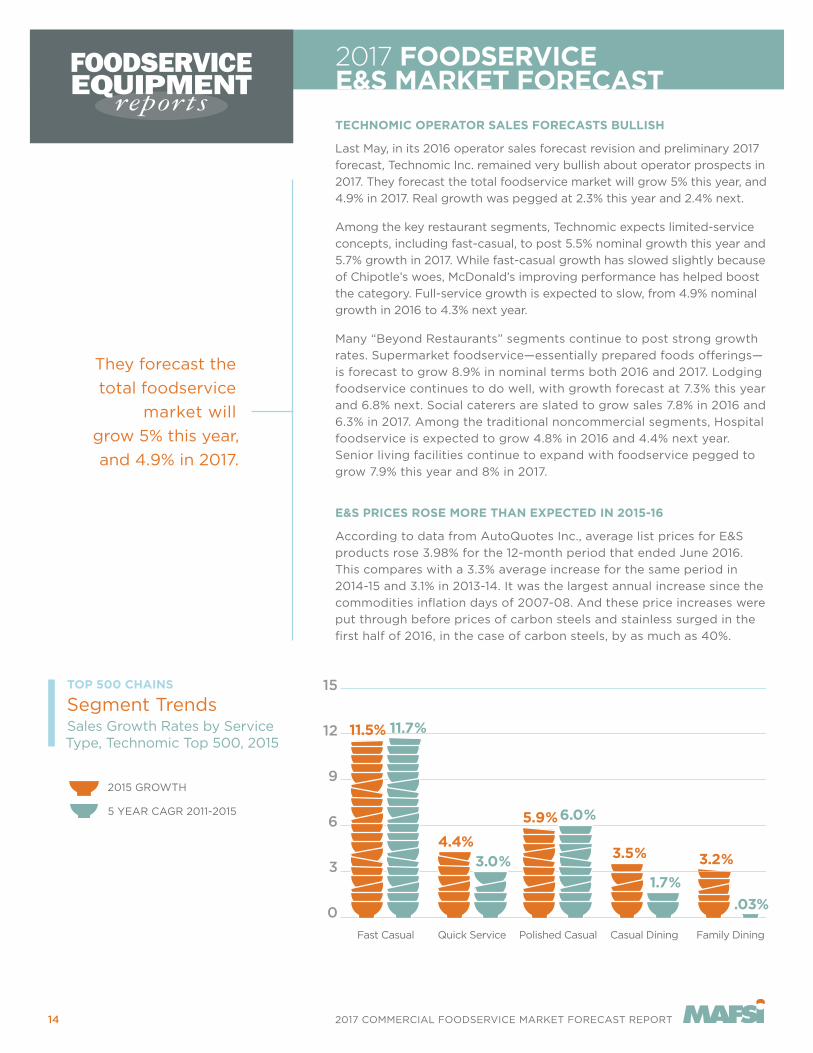
Among the key restaurant segments, Technomic expects limited-service
concepts, including fast-casual, to post 5.5% nominal growth this year and
5.7% growth in 2017. While fast-casual growth has slowed slightly because
of Chipotle’s woes, McDonald’s improving performance has helped boost
the category. Full-service growth is expected to slow, from 4.9% nominal
growth in 2016 to 4.3% next year.
Many “Beyond Restaurants” segments continue to post strong growth
rates. Supermarket foodservice—essentially prepared foods offerings—
is forecast to grow 8.9% in nominal terms both 2016 and 2017. Lodging
foodservice continues to do well, with growth forecast at 7.3% this year
and 6.8% next. Social caterers are slated to grow sales 7.8% in 2016 and
6.3% in 2017. Among the traditional noncommercial segments, Hospital
foodservice is expected to grow 4.8% in 2016 and 4.4% next year.
Senior living facilities continue to expand with foodservice pegged to
grow 7.9% this year and 8% in 2017.
E&S PRICES ROSE MORE THAN EXPECTED IN 2015-16
According to data from AutoQuotes Inc., average list prices for E&S
products rose 3.98% for the 12-month period that ended June 2016.
This compares with a 3.3% average increase for the same period in
2014-15 and 3.1% in 2013-14. It was the largest annual increase since the
commodities inflation days of 2007-08. And these price increases were
put through before prices of carbon steels and stainless surged in the
first half of 2016, in the case of carbon steels, by as much as 40%.
0
3
6
9
12
15
Family DiningCasual DiningQuick ServiceFast Casual Polished Casual0
3
6
9
12
15
Family DiningCasual DiningQuick ServiceFast Casual Polished Casual
2015 GROWTH
5 YEAR CAGR 2011-2015
0
3
6
9
12
15
Family DiningCasual DiningQuick ServiceFast Casual Polished Casual
11.7% 11.5%
15
12
9
6
3
0
Fast Casual Quick Service Polished Casual Casual Dining Family Dining
4.4% 3.0%
5.9% 6.0%
3.5%
1.7%
3.2%
.03%
TOP 500 CHAINS
Segment TrendsSales Growth Rates by Service Type, Technomic Top 500, 2015
They forecast the
total foodservice
market will
grow 5% this year,
and 4.9% in 2017.

2017 COMMERCIAL FOODSERVICE MARKET FORECAST REPORT 15
0
1
2
3
4
5
2019201820172016201520142013
6
4.5% 4.4%4.8%
4.6%4.1%
3.8%3.4%
2.4% 2.3% 2.5%2.1%
1.8% 1.6% 1.5%
2013 2014 2015 2016 2017 2018 2019 2020
6
5
4
3
2
1
0
1.4%
3.2%
2017 FOODSERVICE E&S MARKET FORECAST
The unexpectedly large increases led FER to boost its estimates of price
increases in both 2016 and 2017, which in turn led to a reduction in real
growth rates for both years.
BOTTOM LINE: SLIGHTLY SLOWER GROWTH, A BIT MORE RISK
We do expect the growth rate of the E&S market to slow next year and out
through 2020. And with restaurant same-store sales and traffic slowing,
there is a bit more risk next year than we’ve seen recently. But the general
economy remains strong with all the factors that drive foodservice positive.
Operators continue to spend for equipment and facilities improvements.
And the outlook for the spec market remains positive for at least another
two years. In other words, we think 2017 will be another good year for the
E&S market.
For information on FER’s annual President’s Preview Forecast Seminar,held late July or early August each year, or to inquire about purchasingour research and forecast products, call 800/986-9616, or e-mailRobin Ashton at [email protected].
FER E&S MARKET FORECASTS
2013-2020 NOMINAL CHANGE REAL CHANGE
But the general
economy remains
strong with all the
factors that drive
foodservice positive.

2017 COMMERCIAL FOODSERVICE MARKET FORECAST REPORT16
By Joe Carbonara, EditorFoodservice Equipment & Supplies
OPERATOR OUTLOOK
For 2017, 68 percent of foodservice operators project their sales to
increase, and 29 percent anticipate their revenue levels will be on-par
with 2016’s levels. Among those operators projecting a sales increase,
the average rate is 2.68 percent, down slightly from last year’s 2.83
percent. Not only do operators foresee sales growth but also a continued
increase in their profitability despite a number of challenges, such as
controlling rising food costs. Notably, labor issues continue to weigh
heavily on operators’ minds. In fact, 59 percent of operators cited labor
costs as a key concern for 2017, up 14 percent over the previous year.
In terms of their foodservice equipment and supplies budgets, 40 percent
of operators anticipate spending more in this area during 2017, which
is down 22 percent from last year’s projections. Also, 42 percent of
operators anticipate their expenditures will remain consistent with 2016’s
levels. Only 18 percent of operators project spending less on foodservice
equipment and supplies in 2017. Among those planning to spend more on
foodservice equipment and supplies, the average increase is 2.01 percent,
up from last year’s projection of 1.51 percent.
2017 DEALER/OPERATOR OUTLOOK
OPERATOR ACTIVITIES
E&S Purchases by Distribution Channel
NOTE: Commercial operations (specifically chains) are more likely than non-commercial segments to make E&S purchases direct from the manufacturer.
Direct from Manufacturer
Online Catalog House
Specialty Distributor
Club Store
Buying Group
Traditional E&S Dealers
Broadline Distributors 13%13%
2%
13%
1%
12%
41%
5%Cash & Carry
OPERATOR BUDGET
by Product Category
Primary Cooking Equipment
Refrigeration/Ice Machines
Warewashing & Safety Equipment
Food Preparation Equipment
Serving Equipment
Storage & Handling Equipment
Smallwares
Tabletop Items
Furnishings
Paper Goods/Disposables
Janitorial/Sanitation Supplies
20.0%
10.7%
5.9%
11.0%
6.7%
3.6%
10.2%
3.8%
6.0%
14.9%
7.1%
11.3%
5.2%
8.1%
8.7%
4.6%
11.0%
3.6%
4.3%
15.3%
9.9%
18.1%
2017 PROJECTED 2016

2017 COMMERCIAL FOODSERVICE MARKET FORECAST REPORT 17
2017 DEALER/OPERATOR OUTLOOK
DEALER OUTLOOK
Seventy seven percent of dealers project their sales will increase in 2017,
which is consistent with last year. Only 3 percent of dealers expect their
sales to decline in 2017. Among those dealers projecting higher sales,
the average increase is 7.17 percent, which is consistent with last year’s
projections. In addition, 71 percent of dealers report having more business
booked for the coming year than they did at this time in 2015. Only 10
percent of dealers report having less business booked for the coming year.
The operator segments representing the greatest opportunities for dealers
are casual dining, college and university foodservice, traditional QSRs,
grocers and delis and correctional foodservice.
For more information on the FE&S’ 2017 Forecast studies call
800/630-4168, or e-mail Joe Carbonara at [email protected].
Among those dealers
projecting higher
sales, the average
increase is 7.17
percent, which is
consistent with last
year’s projections.
Repairing more equipment rather than replacing
Smaller order size
Purchasing more used equipment
Canceled/put projects on hold
No change
35%
32%
29%
24%
24%
OPERATORS ACTIVITIES
Top Four Changes in Operator Purchasing Patterns Noted by Dealers
NOTE: 14% said purchasing from or comparing items on the internet
DEALER OUTLOOK
2017 Dealer Sales Projections
Less 3%
Same 20%
More 77%

2017 COMMERCIAL FOODSERVICE MARKET FORECAST REPORT18
2017 CANADIAN COMMERCIAL FOODSERVICE FORECAST
By Amy Bostock, Managing EditorFoodservice and Hospitality
In 2016, the Canadian foodservice industry was categorized as “tumultuous”
with growth remaining flat, QSRs continuing to steal share from other
segments and millennials still the driving force behind restaurant innovation.
“Because we had soft customer traffic, which remained flat, we did see
continued pressure around price and menu inflation continued to creep
up,” says Robert Carter, Executive Director, Foodservice Canada at the
NPD Group in Toronto.
And while Chris Elliott, Senior Economist for Restaurants Canada, says
2016 was supposed to be the year of big improvements in terms of overall
economic growth, he agrees not much has changed on that front. He says
the impact of weak business investment and modest export growth are
to blame. “We’re not seeing job growth or increases in disposable income.
But surprisingly, foodservice sales continue to be quite strong amidst a lot
of those challenges.”
To understand these economic trends, Elliott says you have to look to the
past. “It’s very much economic-driven in terms of what’s happening right
now. If you go back 10 years, all the growth was driven by the Prairie
Provinces and we didn’t see as much growth in Ontario or B.C.,” he explains.
“Now, with this whole change in the economy—where pressed commodity
prices have an impact in Alberta and Saskatchewan—we see the growth
moving to B.C. and Ontario.”
*SOURCE: Foodservice and Hospitality’s Top 100 Report, June 2016
Top 5 Burger Chains(MILLIONS)
5
4
3
2
1
0
A&W Food Services of Canada Ltd.
$1,093.4
Wendy’s Restaurants
of Canada Inc.
$623.7*
Burger King Canada; Redberry Franchising Corp.
$370.0*
Harvey’s Cara Operations
Ltd.
$296.0
McDonald’s Restaurants
of Canada Ltd.
$3,800.0*
“We’re not seeing job
growth or increases in
disposable income.
But surprisingly,
foodservice sales
continue to be quite
strong amidst a lot of
those challenges.”

2017 COMMERCIAL FOODSERVICE MARKET FORECAST REPORT 19
2017 CANADIAN COMMERCIAL FOODSERVICE FORECAST
The shift, he says, is thanks in large part to the two provinces’ robust
housing markets, strong consumer confidence and high retail spending.
“A lot of that spending is also ending up in restaurants,” says Elliott. In
fact, according to Restaurants Canada’s Foodservice Facts 2016 report,
restaurants represent 27 per cent of Canadian households’ food-and-
beverage budget—a share that has changed little since 2010.
So what’s on the horizon? Over the next five years, growth is projected
at less than one per cent annually, which means operators will continue
to steal share through diversification. Already this year, Starbucks threw
down the gauntlet when it introduced alcohol in three of its Canadian cafes.
“We’re constantly looking for ways for customers to say: “Isn’t that cool
that Starbucks did something new?” said Rossann Williams, President of
Starbucks Canada in a recent story in the Toronto Star.
According to Elliott, the country is expecting a bit of moderation in
foodservice growth for 2017. “This is really because we’ve seen such strong
growth of more than five per cent over the previous four out of five years.”
He says he expects growth to follow Conference Board of Canada forecasts
for the retail sector: a moderation in consumer spending. “It just cannot
continue to grow at such an unsustainable pace,” he stresses. “But once you
back out inflation of 2.4 per cent, we’re really only growing at about the
same rate as the population.”
Over the next five
years, growth is
projected at less
than one per cent
annually, which
means operators
will continue to
steal share through
diversification.
8%
7%
6%
5%
4%
3%
2%
1%
0%
2000 2001 2002 2003 2004 2005 2006 2007 2008 2009 2010 2011 2012 2013 2014 2015 2016 2017
SOURCE: Statistics Canada and Restaurants Canada
CANADIAN COMMERCIAL FOODSERVICE SALES
Year-Over-Year Nominal ChangePRELIMINARY FORECAST
5.3%
4.0%

2017 COMMERCIAL FOODSERVICE MARKET FORECAST REPORT20
2017 COMMERCIAL FOODSERVICE FORECAST
QUICK-SERVICE RESTAURANTS ARE DRIVING INDUSTRY GROWTH
QSRs are leading all segments of the foodservice industry with forecast
growth of 6.3 per cent ($28,563 million) in 2016. The Fast-food Restaurants
in Canada report, released by U.S.-based IBISWorld in August, shows that
during the past five years, the segment has expanded despite changing
consumer tastes. “Since 2011, higher consumer spending and product
innovation by fast-food restaurants has renewed consumer interest in fast-
food,” says Andrew Alvarez, Industry Research Analyst at IBISWorld and
author of the report. “Products with higher profit margins, such as coffee,
smoothies and salads, have become more prominent at traditional fast-food
restaurants, leading to an increase in the average industry profit margin.”
Customization and high-quality ingredients have become increasingly
important with Canadian consumers, leading major QSR players to
reconsider overall strategy and menu offerings. “The QSR segment
continues to be the leader from an industry standpoint and that’s being
led by the innovation coming out of Tim Hortons and McDonald’s as they
expand beyond their core offerings,” says Carter. “Starbucks has also put
an increased focus on its food and even Wendy’s is getting into the game
with some interesting new menu innovations (such as the Pretzel Burger,
Grilled Chicken Sandwich and Tacolicious Salad).”
According to Alvarez, the QSR segment’s consistent growth is expected
to continue over the next five years—at a slower pace—due mainly to
faltering consumer confidence amid volatile commodity markets and
uncertain economic conditions.
The Fast-food
Restaurants in Canada
report, released by
U.S.-based IBISWorld
in August, shows that
during the past five
years, the segment
has expanded
despite changing
consumer tastes.
*SOURCE: Foodservice and Hospitality’s Top 100 Report, June 2016
Top 5 Casual-dining Chains (MILLIONS)
2.0
1.5
1.0
0.5
0.0
Montana’s Cara Operations Ltd.
$239.0
Boston Pizza International Inc.
$1,006.0
Keg Restaurants Ltd.
‡ $579.0
Moxie’s Grill & Bar Northland Properties
$208.9*
White SpotRestaurants;
White Spot Limited
$176.0

2017 COMMERCIAL FOODSERVICE MARKET FORECAST REPORT 21
2017 CANADIAN COMMERCIAL FOODSERVICE FORECAST
FOOTPRINT, STAFFING CHALLENGES AND COSTS ARE DRIVING EQUIPMENT PURCHASING DECISIONS
According to the “Equipment Trends Report”, which appeared in the
September issue of Foodservice and Hospitality magazine, industry experts
say the overwhelming considerations when purchasing restaurant equipment
are footprint, staffing challenges and costs. Operators are seeking
innovations in shrunk-down versions of workhorse appliances, multi-tasking
and intelligent appliances, and/or products to help maximize human
resources or stretch menu offerings. Joel Sisson, President and Founder
of Crush Strategy Inc. in Mississauga, Ont. says in working with operators,
the focus in recent months has been on appliances that deliver consistent
results and are easy to use. “Even though operators want to be energy
efficient, that’s a distant third, because it’s harder to realize the savings.
Multi-function, smart appliances are among the most sought-after
pieces of equipment these days, says Doug Feltmate, foodservice and
hospitality consultant with Ottawa-based Planned Foodservice Solutions.
“The biggest multi-tasking piece is still the combi oven—Electrolux,
Rational, Alto-Shaam and Combitherm have all come up with a version
of a self-cooking centre that does a lot of the work for you. They’re
becoming mainstays in commercial kitchens. If you add automated
cooking features, your oven becomes another cook on the line.”
Feltmate says the availability of ventless combi-oven units is a huge game
changer. “Pretty well every manufacturer has a self-ventilating unit that
meets all local codes. With them, you can make changes to an existing
restaurant without affecting ventilation and the major capital costs that
go with it.”
On the cold front, large-scale refrigeration units haven’t seen an abundance
of changes but Feltmate reports a growing interest in rapid/blast chillers,
particularly on the smaller operations side. “They were once for institutional
applications. Now, smaller operators are interested from a food-safety
aspect so are willing to invest $8,000 or $10,000 for a smaller unit.”
For more information contact Amy Bostock, Managing Editor, Foodservice and Hospitality magazine by calling 416/447-0888, or e-mail [email protected].
Operators are seeking
innovations in shrunk-
down versions of
workhorse appliances,
multi-tasking and
intelligent appliances,
and/or products to
help maximize human
resources or stretch
menu offerings.
2017 COMMERCIAL FOODSERVICE MARKET FORECAST REPORT22
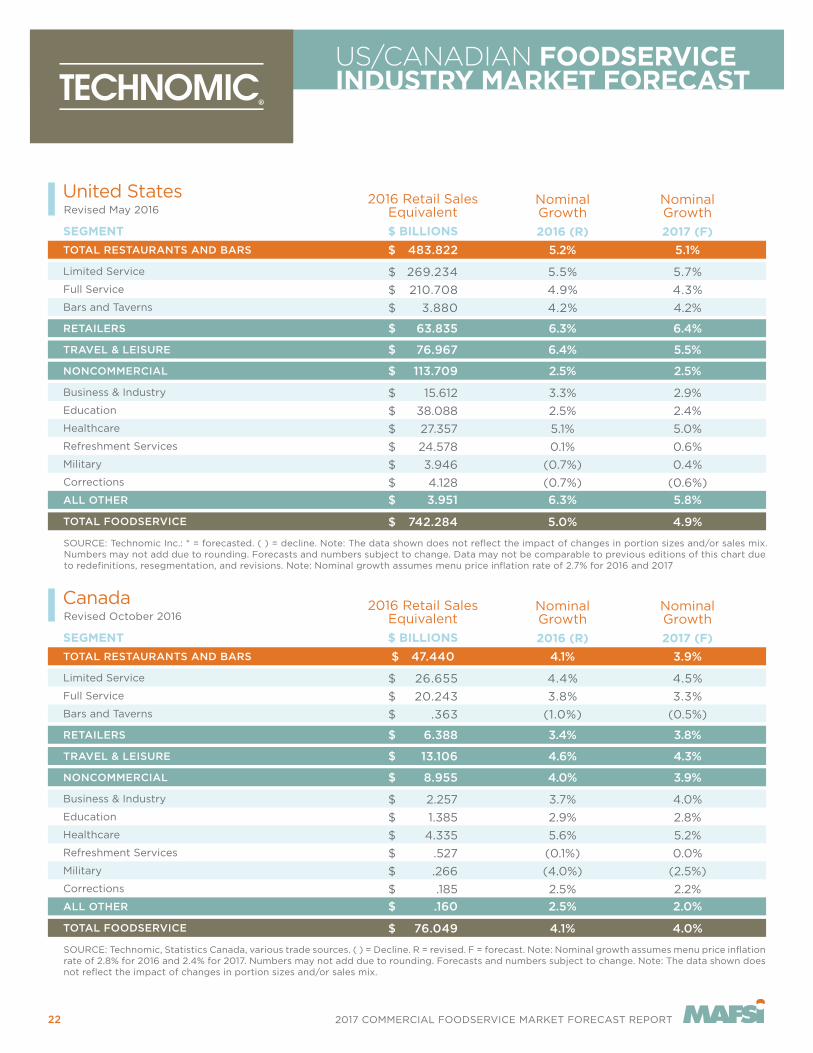
US/CANADIAN FOODSERVICEINDUSTRY MARKET FORECAST
2016 Retail SalesEquivalent
$ BILLIONS
United States Revised May 2016
269.234
210.708
3.880
63.835
15.612
38.088
27.357
24.578
3.946
4.128
Limited Service
Full Service
Bars and Taverns
RETAILERS
Business & Industry
Education
Healthcare
Refreshment Services
Military
Corrections
$ 483.822
Nominal Growth
2016 (R)
5.5%
4.9%
4.2%
6.3%
3.3%
2.5%
5.1%
0.1%
(0.7%)
(0.7%)
5.2%
Nominal Growth
2017 (F)
5.7%
4.3%
4.2%
6.4%
2.9%
2.4%
5.0%
0.6%
0.4%
(0.6%)
5.1%TOTAL RESTAURANTS AND BARS
SEGMENT
$
$
$
$
$
$
$
$
$
$
742.284TOTAL FOODSERVICE
SOURCE: Technomic Inc.: * = forecasted. ( ) = decline. Note: The data shown does not reflect the impact of changes in portion sizes and/or sales mix. Numbers may not add due to rounding. Forecasts and numbers subject to change. Data may not be comparable to previous editions of this chart due to redefinitions, resegmentation, and revisions. Note: Nominal growth assumes menu price inflation rate of 2.7% for 2016 and 2017
5.0% 4.9%$
76.967TRAVEL & LEISURE 6.4% 5.5%$
113.709NONCOMMERCIAL 2.5% 2.5%$
3.951ALL OTHER 6.3% 5.8%$
2016 Retail SalesEquivalent
$ BILLIONS
Canada Revised October 2016
26.655
20.243
.363
6.388
2.257
1.385
4.335
.527
.266
.185
Limited Service
Full Service
Bars and Taverns
RETAILERS
Business & Industry
Education
Healthcare
Refreshment Services
Military
Corrections
$ 47.440
Nominal Growth
2016 (R)
4.4%
3.8%
(1.0%)
3.4%
3.7%
2.9%
5.6%
(0.1%)
(4.0%)
2.5%
4.1%
Nominal Growth
2017 (F)
4.5%
3.3%
(0.5%)
3.8%
4.0%
2.8%
5.2%
0.0%
(2.5%)
2.2%
3.9%TOTAL RESTAURANTS AND BARS
SEGMENT
$
$
$
$
$
$
$
$
$
$
76.049TOTAL FOODSERVICE
SOURCE: Technomic, Statistics Canada, various trade sources. ( ) = Decline. R = revised. F = forecast. Note: Nominal growth assumes menu price inflation rate of 2.8% for 2016 and 2.4% for 2017. Numbers may not add due to rounding. Forecasts and numbers subject to change. Note: The data shown does not reflect the impact of changes in portion sizes and/or sales mix.
4.1% 4.0%$
13.106TRAVEL & LEISURE 4.6% 4.3%$
8.955NONCOMMERCIAL 4.0% 3.9%$
.160ALL OTHER 2.5% 2.0%$

2017 COMMERCIAL FOODSERVICE MARKET FORECAST REPORT 23
US/CANADIAN FOODSERVICEINDUSTRY MARKET FORECAST
U.S. Food Industry Universe July 2016
Traditional Grocery
Traditional Supermarkets
Supermarkets
2016
1.7%
1.9%
2.0%
3.0%
2017
1.6%
1.8%
2.0%
3.0%TOTAL RETAIL
SEGMENT
Mass Merchandisers
Other Grocery
(3.5%)
4.8%
(4.0%)
5.1%
Specialists
Club Stores
3.5%
1.9%
4.3%
2.5%
Convenience Stores
Online
4.2%
20.5%
4.0%
19.8%
Limited Assortment
Fresh Format
6.8%
8.7%
6.5%
9.1%
Drug Stores
Small Grocery
6.4%
2.2%
5.0%
1.6%
Dollar Stores
All Other
4.4%
(4.8%)
4.6%
(5.9%)
TOTAL FOODSERVICE 4.8% 4.8%
Restaurants & Bars
Top 500 Chains
Independents/Small Chains
Supermarket Fresh Prepared Foods
Other Foodservice
5.0%
4.4%
5.6%
8.9%
4.0%
5.0%
4.4%
5.6%
8.9%
3.9%
SOURCE: Technomic Inc. with input from IRI; US Department of Commerce; US Bureau of Labor Statistics; Willard Bishop. Grocery “All other” includes food sales in the following sectors: Furniture & Home Furnishings; Building Material/Garden Equipment; Sporting Goods, Hobby, Book & Music; General merchandise, other than mass merchants and dollar stores; miscellaneous store retailers; mail order; all other nonstore retailers. “Other foodservice” includes: Retail Hosts (other than supermarkets); Hotels, Transportation and Recreation; Business & Industry; Education; Healthcare; Refreshment Services; Catering; Military; Corrections; and Other Segments. Nonfoods do not apply in foodservice sales
TOTAL FOOD INDUSTRY 3.9% 3.9%
FOOD
475.5
339.9
121.6
714.8
$
$
14.0
239.3
$
$
23.8
54.5
$
$
60.1
11.8
$
$
27.8
16.9
$
$
12.0
9.8
$
$
4.7
17.9
$
$
742.3
$
483.8
288.2
195.6
30.7
227.7
$
$
$
$
$
1,457.0$
ALCOHOL
26.0
19.3
6.3
123.1
$
$
0.4
97.1
$
$
47.4
2.8
$
$
16.5
17.6
$
$
1.6
1.0
$
$
3.3
0.6
$
$
0.1
6.4
$
$
110.8
$
89.3
11 .1
78.2
0.1
21.5
$
$
$
$
$
233.9$
NONFOODS
24.2
10.7
8.4
50.0
$
$
5.1
25.8
$
$
0.1
4.1
$
$
0.9
8.8
$
$
0.9
0.5
$
$
1.3
0.3
$
$
1.7
7.1
$
$
N/A
$
N/A
N/A
N/A
N/A
N/A
$
$
$
$
$
50.0$
TOTAL
525.6
369.9
136.3
887.8
$
$
19.4
362.2
$
$
71.2
61.4
$
$
77.5
38.2
$
$
30.2
18.4
$
$
16.7
10.7
$
$
6.6
31.3
$
$
853.1
$
573.1
299.3
273.8
30.8
249.2
$
$
$
$
$
1,741.0$
Nominal Growth2016 Retail Sales Estimates $B
$ $ $ $
$ $ $ $

2017 COMMERCIAL FOODSERVICE MARKET FORECAST REPORT24
MEDIAN AVERAGE
YEARLY PRICE INCREASE
2005-2016
10
8
6
4
2
0
9.6
%
6.9
%
4.4
%
4.5
% 6.1
%
5.3
%
3.4
%
3.8
%
1.3
%2.8
%
2.7
%
0.3
% 2.2
%
3%
2.1
%
2.4
%
3.1
%
2.9
%
3.3
%
2%
3.9
8%
2.5
5%
2005-06 2006-07 2007-08 2008-09 2009-10 2010-11 2011-12 2012-13 2013-14 2014-15 2015-16
YEARLY PRICE CHANGES BY CATEGORY
2009-2016
7
6
5
4
3
2
1
0
-1
-2
-3
2009-10 2010-11 2011-12 2012-13 2013-14 2014-15 2015-16
2009-10
2010-11
-3
01
23
4
5
6
RefrigPrepShelvingCookingWarewashHolding/Heated
ServingCounters
TabletopBeverageCo�eeCookwareVentilationIce
-2-1
7
2011-12
2012-13
2013-14
2014-15
Ice Ventilation Cookware Coffee Beverage Tabletop ServingCounters
Holding/Heated
Warewash Cooking Shelving Prep Refrig
1.9
3.0
2.6
2.8
3.6
3.3
1.2
1.3
2.9
2.2
1.0
1.8
1.9
2.5
3.1
2.3
2.2
4.5
-2.2
1.6
3.7
2.2
1.2
1.1
0.9
2.1
0.4
1.3
2.4
2.7
-1.9
3.0
2.9
3.5
4.5
4
1
2.8
3
2
2.2
1.8
0.8
2.9
1.4
1.5
2.6
6
0.2
3.9
2.4
2.3
1.7
1.6
-1.8
2.3
3.7
2.5
1.4
4.7
0.8
0.8
2.9
1.2
0.9
1
3.9
4.1
1.5
1.6
2.9
2.8
0.8
3.1
0.9
1.9
2.0
3.6
4.4 4.1 3.8 2.5 4.1 3.1 4.0 3.7 3.4 5.7 3.3 3.9 3.3
2017 PRICING TRENDS

2017 COMMERCIAL FOODSERVICE MARKET FORECAST REPORT
THANK YOUMAFSI Reps have their fingertips on the pulse of the markets they serve,
giving them an inside look at regional and national sales trends. Our Commercial Foodservice
Market Forecast would not be possible without you; the dedicated members of MAFSI.
Many thanks to the 148 firms below for making our 2017 forecast possible.
4 Star Representatives Inc.
Adams Marketing & Sales
Advanced Culinary Systems
Advantage Marketing Group
Agences Hamilton Agencies
Apex Commercial Kitchen Co.
Apex Marketing
ARB Sales and Marketing
Bauer Marketing Group, Inc.
Beacon Sales Group, LLC
Bob Waite & Associates
Bowerman Marketing Group
Brittan Associates
C. R. Peterson Associates, Inc.
Carman-Girard Associates
Charles L. Burton Associates
Chernoff Sales, Inc.
Chesher Equipment, Ltd.
Clark, Malone & Associates, Inc.
Clemens Profit Group
Clements-Stella-Gallagher
Marketing
CLV Marketing
Collis Group, Inc.
Commercial Kitchen Reps, Inc.
Copperfield Agencies Limited
Courtney Marketing, Inc.
Cowan Associates
D.L.T. Sales, Inc.
Dady & McCoy Sales
Dave Swain Associates, Inc.
Davis & Associates, Inc.
Desert Peak Marketing
Downing Management
DRC Marketing Group
E. Ruff & Associates, Inc.
EasyBar of Minnesota, Inc.
Eaton Marketing Associates, Inc.
Eisner Rose Associates, Inc.
Elite Foodservice Solutions
Equipment Preference, Inc.
(E.P.I.)
E-Source, Inc.
Ettinger-Rosini & Associates, Inc.
Florida Agents, Inc.
Florida REPS, Inc.
Food Equipment Sales &
Marketing Agents, Inc. (FESMA)
Food Service Systems
Foodservice Equipment
Agents, LLC
Forbes, Hever & Wallace, Inc.
Gabriel Group, Inc.
George Davis & Associates
Gibbs & Associates, Inc.
GMV Sales
Griffin Marketing Group, Inc.
Hanna-Young & Assoc., Inc.
Hatch Jennings, Inc.
High Sabatino Associates
Hollander Company
Hospitality Reps Inc.
HRI, Inc.
Integra Marketing, Inc.
JMT Reps
Johnson Commercial Agents
Johnson Pike & Associates, Inc.
Kain-McArthur Inc.
Kaufmann & Associates
KBC Specialty Products, Inc.
Kelly-Mincks
Ken W. Thomson Associates Ltd.
KLH Marketing, Inc.
Koehler-Borden & Associates, Inc.
Lake Effect Sales & Marketing
Lane Marketing
Lehr McKeown Marketing, Inc.
Link2 Hospitality Solutions
Lobo Reps. International, LLC
Lund-Iorio, Inc.
MAC Sales & Marketing LTD.
Main Street Marketing
Marjon & Associates, Inc.
Marketing Agents South, Inc.
Master Marketing
McGirr, Inc.
Midwest Professional Reps, Inc.
Miller & Associates
Mirkovich & Associates, Inc.
Mirkovich & Associates, Inc.
Nick Mavro & Associates, LLC
North Star Agency, LLC
ONE SOURCE
Paglio & Associates, Inc.
PB & J Commercial Agents
Pecinka Ferri Associates
Performance Food Equipment
Group, Inc.
Performance Reps Northwest, Inc.
Permul Ltd.
Posternak Bauer Aitkenhead
Cantamessa
Preferred Marketing Agents, Inc.
Preferred Marketing Group
Premier Marketing Group, Inc.
Pro Foodservice Reps Limited
Pro/Line Marketing, Inc.
Professional Manufacturers
Representatives, Inc. (PMR)
Pro-Pacific Agents, Inc.
Pro-Quip Foodservice
Equipment & Supplies
R. Henry & Associates
R.Z. Marketing Group
Rabco Foodservice Limited
Raleigh W. Johnson & Company
Redco Foodservice
Equipment, LLC
Remagen Inc.
Rep Concepts, LLC
Schmid-Dewland Associates
Shamrock Foodservice
Equipment Reps. Inc
Sharkey & Associates
South Eastern Manufacturers’
Agents, Inc. (SEMA)
Southwest Foodservice
Equipment Marketing
Specialized Marketing
of Wisconsin
Specialty Equipment Sales
Company (SESCO)
stage KOLSTAD associates, Inc.
Stiefel Associates, Inc.
TD Marketing Company, Inc.
The 2Market Group, Inc.
The Fischer Group
The Hansen Group
The Pacific Group
The Pantano and Pinilla
Agency, Inc.
The Redstone Group
The YES Group
Thormann Associates
TLC Marketing Inc.
Tom Redditt Sales Agency
Total Source Equipment &
Supply
Total Tabletop Plus
Tri-State Marketing Associates
Vader & Landgraf, Inc.
Veitch Group
Velkey & Associates
Viola Group
Voeller & Associates, Inc.
W. D. Colledge Co., Ltd.
Walter Zebrowski Associates
WB Marketing, LLC
West Coast Food Service
Marketing
Woolsey & Associates, Inc.
Wyllie Marketing
YBR Marketing, Inc.
Young Equipment Solutions, Inc.
Zink Foodservice
1199 EUCLID AVENUE | ATLANTA, GEORGIA 30307 | 404-214-9474 | @MAFSIASSOC | MAFSI.ORG