maersk line -a company analysis khwaja arafat abdullah … · -a company analysis . khwaja arafat...
TRANSCRIPT

Maersk Line
-A Company Analysis
Khwaja Arafat Abdullah and Muhammad Shabbir
Graduate School
Master of Science in Accounting Master Degree Project No. 2009:35
Supervisor: Thomas Polesie

ii
Table of Contents List of Abbreviation ......................................................................................................................... vii
Abstract............................................................................................................................................... viii
Acknowledgements .......................................................................................................................... ix
1. Introduction ................................................................................................................................... 1
1.1 Research Problem ..................................................................................................................................................1
1.2 Research Purpose ...................................................................................................................................................2
1.3 Scope of Research ..................................................................................................................................................3
1.4 The General Outline of Thesis ................................................................................................................................3
2. Methodology ................................................................................................................................. 4
2.1 Research Approach ................................................................................................................................................4
2.2 Research method ...................................................................................................................................................4
2.3 Data Collection .......................................................................................................................................................5
2.4 Criticism of the sources ..........................................................................................................................................5
2.5 Reliability and Validity ............................................................................................................................................6
3. Literature Review ......................................................................................................................... 7
3.1 The Square Model ...........................................................................................................................................7
3.2 The Assumptions of the Square Model .....................................................................................................8
3.2.1 Type of Model ..............................................................................................................................................8
3.2.2 Simplicity ......................................................................................................................................................9
3.2.3 A Going Concern...........................................................................................................................................9
3.2.4 The Elements................................................................................................................................................9
3.2.5 The Time Aspect ...........................................................................................................................................9
3.2.6 The Enumerates ...........................................................................................................................................9
3.2.7 The Information .........................................................................................................................................10
3.3 Information asymmetry...............................................................................................................................10
3.3.1 Information Problem ..................................................................................................................................10
3.3.2 Agency problem .........................................................................................................................................10
3.4 Financial Statement Analysis .....................................................................................................................11
3.4.1(A) Four primary business activities ............................................................................................................11
3.4.2 (B) Different users of financial statements ................................................................................................12

iii
3.4.3 (C) Balance Sheet .......................................................................................................................................12
3.4.4 (D) Income Statement ................................................................................................................................13
3.4.5 (E) Statement of Cash Flows ......................................................................................................................14
3.4.6 (F) Links between Financial Statements .....................................................................................................14
3.5. Preview of Financial Statement Analysis...............................................................................................15
3.6 Common-Size Financial Statement Analysis..........................................................................................16
3.7 Ratio Analysis of Financial Statements ...................................................................................................17
3.7.1 Factors Affecting Ratios .............................................................................................................................17
3.7.2 Ratio Interpretation ...................................................................................................................................18
3.7.3 Illustration of Ratio Analysis.......................................................................................................................18
4. Preliminary Financial Analysis ...............................................................................................22
4.1 Introduction of A.P Moller – Maersk .......................................................................................................23
4.2 Analysis of the Accounting Policies of APMM ......................................................................................23
4.2.1 Recognition of Revenue .............................................................................................................................24
4.2.2 Stocks and inventories measurements ......................................................................................................24
4.2.3 Tangible and intangible fixed Assets ..........................................................................................................24
4.2.4 Depreciation, Amortization and Impairment of Fixed Assets ....................................................................25
4.2.5 Recognition of provisions for expected future losses on contracts ...........................................................25
4.2.6 Presentation of Financial statement and lack of disclosures .....................................................................25
4.2.7 Change in accounting policies ....................................................................................................................26
4.3 Company Square Model ..............................................................................................................................26
4.3.1 Comprehensive overview of Square Models ............................................................................................30
4.4 Segment Analysis ...........................................................................................................................................32
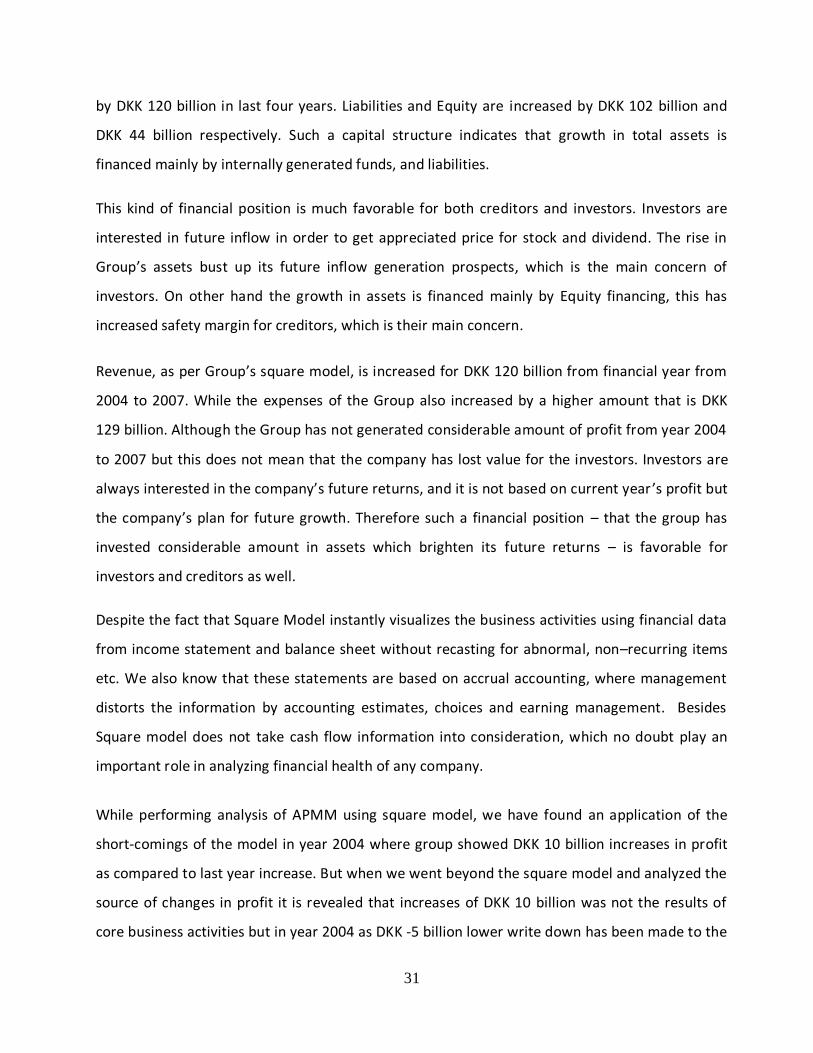
4.4.1 Four years (2004-07) cumulative segment analysis ...................................................................................33
4.4.2 Year to year – Individual Segment Analysis ...............................................................................................35
5. Performance Analysis ...............................................................................................................38
5.1 Earning Quality of APMM ...........................................................................................................................39
5.1.1 Relationship between Revenue, and Trade Receivables ...........................................................................41
5.1.2 Relationship between Revenue, and Inventories ......................................................................................41
5.1.3 Depreciation, amortization and Impairment losses ...................................................................................42
5.1.4 External Cost (fees to auditors and legal consultants for merger/acquisitions etc) and Staff cost ...........43
5.1.5 Tax Expenses .............................................................................................................................................43

iv
5.1.6 Financial Expenses.....................................................................................................................................43
5.2 Trend Analysis of Income Statement over four years ........................................................................44
5.3 Conclusion from the perspective of Investor ........................................................................................45
6. Balance Sheet Analysis .............................................................................................................47
6.1 Comprehensive overview of Equity, Liabilities, profit & Dividend .................................................48
6.2 Group Short-term liquidity .........................................................................................................................50
6.3 Asset Utilization Analysis ............................................................................................................................55
6.4 Capital structure and solvency ratios ......................................................................................... 56
6.5 Return on Investment ..................................................................................................................................58
6.6 Trend Analysis of Balance Sheet over four years .................................................................................62
7. Cash Flow Analysis .....................................................................................................................64
7.1 Analysis of Cash from operating, investing & financing activities ..................................................65
7.2 Major Sources & Uses of Cash (2004-2007) .............................................................................. 67
7.3 Relationship between net income and operating cash flow ............................................................68
8. Final Conclusion ........................................................................................................................................... 71
8.1 Suggestions for Future Researcher ..........................................................................................................73
References------------------------------------------------------------------------------------------------ 74

v
List of Appendix
Appendix 1: Income statement and balance sheet for square model---------------------------------------------------------76
Appendix 2: Calculation of short term liquidity ratios------------------------------------------------------------------------------77
Appendix 3: Calculation of capital structure and solvency ratios----------------------------------------------------------------79
Appendix 4: Calculation of return on investment capital--------------------------------------------------------------------------80
Appendix 5: Calculation of return on total assets------------------------------------------------------------------------------------82
Appendix 6: Trend analysis of balance sheet------------------------------------------------------------------------------------------83
Appendix 7: Trend analysis of cash flow-----------------------------------------------------------------------------------------------85
Appendix 8: Major uses and sources of cash------------------------------------------------------------------------------------------86
Appendix 9: Trend analysis of income statement------------------------------------------------------------------------------------87
List of Figure and Graphs
Figure 1: The General outline of thesis----------------------------------------------------------------------------------------------------3
Figure 2: The Square Model------------------------------------------------------------------------------------------------------------------7
Figure 3: Link between financial statements-------------------------------------------------------------------------------------------14
Figure 4: Comprehensive overview of square models-------------------------------------------------------------------------------30
Figure 5: Chart of segment analysis------------------------------------------------------------------------------------------------------34
Figure 6: Effect of acquisition--------------------------------------------------------------------------------------------------------------37
Figure 7: Graph of revenue Vs profit-----------------------------------------------------------------------------------------------------40
Figure 8: Graph of revenue Vs Trade receivable--------------------------------------------------------------------------------------41
Figure 9: Graph of revenue Vs inventory------------------------------------------------------------------------------------------------42
Figure 10: Graph of depreciation, amortization and impairment-----------------------------------------------------------------43
Figure 11: Comprehensive overview of equity, liabilities, dividend & profit---------------------------------------------------59
Figure 12: Graphical presentation of short term liquidity analysis---------------------------------------------------------------52
Figure 13: Graphical presentation of capital structure and solvency ratio-----------------------------------------------------57
Figure 14: Return on invested capital----------------------------------------------------------------------------------------------------59
Figure 15: Major sources and uses of cash---------------------------------------------------------------------------------------------67
Figure 16: Graph of net income Vs cash flow from operating---------------------------------------------------------------------69

vi
List of Tables
Table 1: Segment Analysis ------------------------------------------------------------------------------------------------------------------35
Table 2 : Year to year segment analysis-------------------------------------------------------------------------------------------------37
Table 3: Short term liquidity analysis-----------------------------------------------------------------------------------------------------51
Table 4: Assets utilization analysis--------------------------------------------------------------------------------------------------------55
Table 5: Capital structure and solvency ratio-------------------------------------------------------------------------------------------56
Table 6: Return on total assets-------------------------------------------------------------------------------------------------------------60

vii
List of Abbreviation
A.P.M.M: A.P Moller-Maersk
F.S.A: Financial Statement Analysis
FIFO: First in first out
CGS: Cost of Goods Sold
IFRS: International Financial Reporting Standard
PP & E: Property, Plant and Equipment
IASB: International Accounting Standard Board
WACC: Weighted Average Cost of Capital
ROIC: Return on Invested Capital
viii
Abstract
A.P. Moller Maersk Group - A Company Analysis
By Khwaja Arafat Abdullah and Muhammad Shabbir
A company analysis of A.P. Moller Maersk gives the fundamental worth of the firm. It is a study
done to understand how to analyze a giant company from the perspective of investors and
creditors. The main purpose is to reveal the real picture and to find out whether the numbers in
the financial reports really mean what they show. The models and theories used in this regard is
the square model, agency theory along with the key performance indicators such as ratios, cash
flow and other analysis that reveals the information asymmetry in the principal and agent
relation. In our research mainly secondary data were used. The results obtained indicate that
although there has been a continuous growth in the shipping industry but there have been some
peculiarities in the financial statements of Maersk and we identify them as red flags in our
analysis. To conclude we would like to add that there might me various techniques to analyze
financial statements of a company but those techniques will only be effective if we can adjust the
reported figures to minimize distortions.

ix
Acknowledgements
During the period of performing our research, many colleagues, Professors and students
appreciated and encouraged us for this research work. First of all, we would like to thank and
appreciate the effort of our supervisor, Professor Thomas Polesie who provided outstanding and
kind support throughout our thesis research in making this thesis useful for further research.
We also express our gratitude to our friend Mr. Shah Syed Abdul Haleem who supported in our
research about how empirical finding can be analyzed. Appreciation is also due to Ms. Ann
McKinnon, who supported us from the first day in Sweden as foreign students throughout two
years.
Finally, we would like to express appreciation our parents for their patience and inspiration to a
successful research.
Gothenburg, 29th of May, 2009
Muhammad Shabbir Khwaja Arafat Abdullah

x

1
1. Introduction
This chapter starts with the introduction of the chosen research topic. Furthermore, we will
provide the theme of the thesis by discussing the research problem, the purpose and the scope of
the study.
The world economy is currently plagued with financial crisis. In this situation, most multinationals
companies use different tools to demonstrate their financial performance. In accountancy and
finance, the different theory and numbers are used to describe the business. Due to competition,
the management of the organizations always try to portray financial position in such a way that
will attract the investors and different users of financial statement analysis. In order to compete
in the market, most of the organizations show rosy picture in their annual reports.
To portray financial position in the best possible way, organizations use different tools for
distortion for financial reporting. In this project, we analyzed the financial statements (Balance
Sheet, Income Statement and Cash flow Statements) in order to develop the understanding of
different users and to find out the real picture of the organizations behind the numbers. We
examine that how the numbers in the financial statement have been affected by management
using the “accepted” rather than “appropriate” accounting principles, management estimates,
accounting choices and various accounting methods like conservative, liberal and neutral
accounting methods by the means of company square model, accounting, performance, cash
flow, trend and common size analysis. A.P Moller – Maersk group has been chosen for
conducting accounting analysis because it is an asset based company.
1.1 Research Problem
All organizations want to reveal themselves in the best possible way by demonstrating public self
reporting on the sustainability reporting to help and facilitate the achievement of the company’s
CHAPTER NO.1

2
own objectives.1 Financial statements are often highly complex for those users who do not have
the expertise of understanding it; therefore fair and simple presentation is important both for
management and the investor for decision making purpose. When accountant use different tools
for distortion of financial reporting, there is a need for the general user, who become influenced
with the biased numbers in the financial statements to get the real thing behind the numbers.
Our motive is to analyze the numbers in the financial statements and to find out do the number
really represents what they show. We also want to trace the distortions in the company reports
and reveal the true scenario of the company for the convenience of general users.
In this research, we are trying to find out the red flags, the impact of numbers and the
accounting policies used by A.P Moller – Maersk. We will work on the basis of following research
question that will helps us to provide a better guideline for collecting information and analyzing
financial statements.
Research Question
How the management misrepresent the financial numbers reported in the financial
statements?
What are the red flags in the financial statements from the perspective of investors and
creditors?
1.2 Research Purpose
The purpose of our study is to explore that how management and accountant use different levels
of manipulations for their own long standing interest by analyzing Balance Sheets, Income
Statements and Cash Flow Statements. The purpose is not to investigate about other activities of
A.P Moller-Maersk but to find out about the overall view of the company and point the red flags
used in financial reporting so that the concerned users can take decisions on the future actions,
based on the true picture of the financial position of the organization.
1 Master thesis 2005:27(Corporate accounting & resources dependence theory by Consolata Jepkemei Kandie and
Aloysius Nnaji.

3
1.3 Scope of Research
Our research is limited to the entities presented in Annual Report from 2004-2007 by APMM
which is listed at Danish Stock Exchange in 1912. Our purpose is not to investigate how the
management of the A.P Moller – Maersk arranges finance and other activities and disclosure.
Our thesis focus is only from the user’s perspective, especially primary users who want to know
the financial analysis and red flags according to the IASB about the organization for decision
making purpose. However, there are many others things that should be analyzed, which are
important for our research work but we are doing our research on the basis of annual reports of
four years.
1.4 The General Outline of Thesis
Figure.1: The General outline of thesis
Part 2
4.
Preliminary Financial Analysis
5.
Performance or Profitability
Analysis
6.
Balance Sheet Analysis
7.
Cash Flow Analysis

4
[
2. Methodology This section is about the procedures and the manner in which our research was conducted. It
includes all the approaches used and the methods deployed. This section also includes the sources
from where the data were obtained.
The intention of our research was not to take a responsible position in an organization as an
expert in analyzing the numbers. Our research was analyzed the different periods of
development of APMM (well reputable company) in shipping industries based upon the skills,
information and knowledge of our previous education.
2.1 Research Approach
Our thesis consists of two major parts and they are theoretical and empirical. Descriptive
approach will be used in the theoretical part as we will give descriptions of the various important
concepts such as financial statement analysis, ratio analysis, and square model. Description of
these important concepts will serve as the basis for the elaborate empirical study. In addition to
the descriptive approach we will use explanatory approach, which will in turn help us to give an
overview of the cause and effect relationship between different peculiarities of the financial
statements and their consequences. Over here we will try to explain the reason behind the
peculiarities of the financial statements, which is defined as red flags.
2.2 Research method
There happens to be different research methods available for conducting research but the two
most common are the qualitative and quantitative methods. Compared to qualitative method,
quantitative method is more formal and structured. In using quantitative method information
and data is collected from many sources in order to gain a general perspective of the research
problem.
In our research we mainly focused on quantitative method, however all the theoretical data that
were used are solely qualitative. Again the empirical data obtained from the annual reports are
CHAPTER NO.2

5
mostly quantitative. The reason behind using this particular method is because the research
intends to analyze financial statements from the shareholders creditors and different user’s
perspectives. In addition to quantitative method, qualitative method is complementary and is
characterized by mutual dependence.2
2.3 Data Collection
Data collection is crucial to all research. Through this process, researcher accumulates empirical
material on which to base their research.3There are two main types of data collection methods
and they are primary and secondary. The primary data collection method is about creating new
data by doing surveys and carrying out interviews. The secondary data collection method is
about collecting and analyzing existing data.
It depend upon your characteristics of the research whether “the researcher adopts a
quantitative or qualitative approach for their data collection method.”4In conducting our
research mainly secondary data collection method will be used. The secondary data source
comprises of available academic books, annual reports and various websites from the internet.
Secondary data will form the basis for both the theoretical and empirical part of our study. It is
true that “secondary data is data that was developed for some purpose other than helping to
solve the problem in hand.”5Due to time constrains primary data from surveys and interviews
could not be obtained so our research was based on external resources rather than of internal
resource. In addition to time constrains practical limitations of not having a standard interview
process also hindered the primary data collection process.
2.4 Criticism of the sources
No doubt, primary data has its own importance for creating new data and secondary data can be
manipulated and affected by its value instead of primary data. But according to our research
question, secondary data are more important because every user have no access inside the
2 Yin. Robert K. (2004). The Case Study Anthology. Sage publications, cop. Thousand Oaks, CA
3 Ibert, Baumard, Donada and Xuereb, 2001, p.172.
4 Ibert, Baumard, Donada and Xuereb, 2001, p.172.
5 Fay, 1997, p.215.

6
organization. Toward critical perspective about the information used in annual reports by
management for its importance, authors will value the different numbers and information in
annual reports from the perspective of different users to maintain the reliability and validity for
minimizing the possibility of wrong answer of research questions.
2.5 Reliability and Validity
The data of chosen company mainly collected from annual reports of APMM between the
periods from 2004 to 2007.and its official website. Summarizing the data of annual reports,
website, internet and books, we used different analytical technique such as bank square model,
segment analysis, and ratio analysis and earning quality analysis. Due to using secondary data,
we increased our level of reliability by nature. According to Saunders et al. data from large and
well known organizations (e.g. Company’s annual report which are also audited before the
released) are likely to be reliable and trustworthy, in general.6 The research data which was
given in annual reports is reliable and according to IFRS. However annual reports are prepared
individually and its extensiveness has it own importance so possibility of missing some
information by the researcher is still considerable. To make sure its reliability, the two members
in a group give advantage to double check about the collection and analyzing the data of annual
reports. No doubt, our thesis based on secondary data but we believe, after that, other
researcher will appreciate our research. Validity can be perceived as the extent to which research
finding are really about what they profess to be about. It depends upon the researcher ability
that how he/she interpret the different terminology. To keep the validity level, we conducted
trend analysis of income statement, balance sheet and cash flow as well in order to know the
background and consistency in development. Since the thesis is about the overview analysis of
APMM group so reader should have some business knowledge. For this, different concept of
literature has been given in next chapter to understand our research question.
6 Saunders et al. (2003), p 206

7
3. Literature Review
This basic purpose of this chapter is to explain the theoretical framework which is used as a tool
to analyze our research (Analysis of financial statements) for empirical finding. Prospective users
of financial statements have little knowledge about it, therefore theoretical framework helps the
readers to understand the purpose of financial statement analysis and helps in answering the
research questions.
Shares of different organizations and businesses are traded every day in various stock markets of
the world. The users or investors who are engage in this trade have different questions. Such as
“Am I investing in the right organizations? How can we know the real worth of shares? Is the
business profitable? If so, which segments are most profitable? Is the business growing? Does
the business generate cash?”7 The answers of the above mentioned questions are possible only
by analyzing the financial statements from user’s point of view. But for understanding our
research, users should understand different concepts of financial statement analysis. Following
are some theories for understanding our research analysis.
3.1 The Square Model8
Figure 2: The Square Model
7 Financial statement analysis: A valuation approach by Leonard C. Soffer & Robin J.Soffer.
8 Polesie(1991) & Haipei Huang & Thuan Vu Thi, Master Thesis no 2002:63: The Determinants of Capital Structure
in Shipping Companies, pp. 1-2 & Hiba Larsson & Christian Falkemark, Master Thesis: BMW, a company analysis,
pp. 11-13.
CHAPTER NO.3

8
The square model a concept developed by Professor Thomas Polesie gives a simple overview of a
company’s financial situation at a given point in time. The square model is a closed model which
builds on accounting terms. The square boundaries consist of assets, liabilities and equity,
revenues, costs and profits/losses. In other words, the borders of the square illustrate the
relations between the financial measures from the balance sheet and income statement. The
model only considers numbers taken directly from the financial reports which are published by
the company. As mentioned earlier, the square model provides an overview of a company’s
financial situation at a given point in time, but it can also be applied when analyzing the
development of a company within a certain period. Thus, we can consider the square model as
both a static and a dynamic model. Furthermore, the model can be used to compare various
companies. The construction of the square models allows them to proportionally change in size,
relative to any changes in the financial measures. The changes in the size of the squares thereby
provide an immediate visual impression of a company’s financial situation. The left-hand side of
the square lists the assets of the company, while the right-hand side represents the company’s
capital structure, composed by liabilities and shareholder’s equity. The relationship between the
left and right-hand side of the model is especially useful to analyze how the firm finances its
assets, and to what extend the company utilizes shareholders funding or financial leverage. The
profitability of the company is measured by the horizontal lines of the model. The diagonal line,
dividing the model in an upper and lower triangle, separates the company’s financing from its
operations, where the upper triangle represents the former and lower triangle the latter.
3.2 The Assumptions of the Square Model
3.2.1 Type of Model
The square model is a closed model. This is caused by its well defined boundaries. The
boundaries consist of the distinction of the information used, into the different elements used in the
model.9
9 ibid

9
3.2.2 Simplicity
There are many models used, giving the user abundant information. Thus a selection of the
relevant information has to be made. The aim of the square model is to optimize the financial
information and simplify an overview of a company’s financial statement. Consequently the
information given by the model is simple and available for various users to take part of. 10
3.2.3 A Going Concern
One of the fundamentals of the accounting regulation is the going concern principle. The
principle is also applicable in the square model. The going concern principle implies that a
company will continue to operate indefinitely without the intention or threat of liquidation.11
3.2.4 The Elements
The square model is a synthesis of the balance sheet and income statement. In the model the
elements used are; assets, liability, costs, income and profits or losses.12
3.2.5 The Time Aspect
In order to allow a comparison between different periods, the same time period has to be used.
Generally a 12 months period is applied. Given that normally the time stated and used in the
financial reports is 12 months. Indeed, quarterly reports, for instance, could also be applied in
comparison to the first quarter. As seen from without the time aspect and as already mentioned
above, the square model is both static and dynamic. Static in terms of describing a company’s
state in a certain moment of time and dynamic when describing the development of the
company over time.13
3.2.6 The Enumerates
The enumerates used in the square model have to be consistent. All the numbers used are
established by monetary measurements. These assumptions are attributable to enable a
10
ibid
11
ibid 12
Polesie,T. (1995), Drift & Finans – aspekter på ett företags ekonomi and Polesie, T (1989), Att beskrivaföretags
ekonomi 13
ibid

10
comparison for a certain company over time or between a company and another. Hence if the
figures stated were to be in different currencies, the shape of the square would be misleading.14
3.2.7 The Information
The only information used in the model is the financial reports published by the company.
Neither human resources, information of other potential important factors nor details of what
occurs within the company are taken into consideration. Hence an outside perspective is held.
The financial reports used are not adjusted. This elevates the importance of the belief that the
numbers stated in the reports are accurate and that they reflect the company’s state. Otherwise
the analysis of the square model becomes futile. Furthermore, the assumption that the company
does not present any problem with the generation of cash flow is made. Thus the square model
does not take the cash flow into consideration.15
3.3 Information asymmetry
Information asymmetry problem is one of the main phenomenon in an organization, this
phenomenon arise when management distributed unequally the information about the financial
position of business within the organization and market. Due to information asymmetry problem,
reliability and validity of the numbers needed to evaluate in a proper way. This theory suit the
purpose of our research.
3.3.1 Information Problem
Sometime one party can get more information due to contractual relationship while counter
party do not have. So naturally an information problem arises due to unequal distribution of
information. Such type of information between two parties is called information asymmetry. A
lot of problem, this phenomenon was discussed through agency problem.
3.3.2 Agency problem
Agency theory developed in the 1960s within the field of micro economics as an attempt to
model the relationship existing when one party, “the agent” must act on behalf of another party,
14
ibid
15
ibid

11
“the principal”(Eunmi & Susan, 1999). The theory’s focus on the relationship between two
parties makes it useful for investigating any type of situation where the returns to one individual
depends, to some degree, on the actions of another(Pratt & Zeckhauser, 1991). This theory suit
our research because the principal (Employee) obey to act according to the interest of agent
(management). Due to this, manipulation chances in financial numbers increased.
3.4 Financial Statement Analysis
Financial statements provide the information to the analysts predicting fundamental value of the
organization. The users must understand what the numbers of statements are saying and which
numbers are showing red flags. Our research focus is not on the details of accounting rules but
on the important principles behind the numbers, which can’t be ignored. Financial statements
are just like lens of the organization / business because these statements portray the picture of
the business for different purposes. Here it is important that the analysts must understand the
different techniques and principles used in financial statements.
FSA is a process by which analytical tools and techniques are applied to financial statements and
related data to derive estimates and hints, which are necessary to make important business
decisions. It is both a screening and a forecasting tool crucial for selecting investment or merger
candidates and forecasting future conditions and consequences. It is also a diagnostic and
evaluation mechanism in assessing financing, investing, and operating activities for managerial
and other business decisions. FSA diminishes our uncertainty in decision making and establishes
an effective and systematic basis for making business decisions.
3.4.1(A) Four primary business activities
Past financial performance and current financial position of a company are reported in its
financial statements. Financial statements are designed to provide information on four primary
business activities and they are planning, financing, investing, and operating activities. Analyzing
financial statements helps us sort through and evaluate information, focusing attention on
reliable information most relevant to our business decisions. A company requires considerable
resources to finance its operations and its balance sheet reveals contributions from shareholders
and creditors, therefore FSA helps us in answering the crucial question like whether to contribute

12
to the financing of the company through an investment in stock or through a loan. If we opt to
invest in stock the concerned analysis help us to determine at what price to buy the company’s
shares at.
3.4.2 (B) Different users of financial statements
There are different users of financial statements. Shareholders and creditors use it to assess
future company prospects for investing and lending decisions. Boards of directors, as
shareholders’ representatives, use financial statement information in monitoring management’s
decisions. Employees and unions use it in labor negotiations. Suppliers use it in establishing
credit terms. Customers use it in deciding whether to establish supplier relationships. Public
utilities set customer rates by referring to financial statements. Information intermediaries use it
to make buy-sell recommendations and setting credit ratings. Auditors use it in assessing the
“fair presentation” of their clients’ financial statement numbers. While financial statement
analysis does not provide all the answers of all its users but every decision is aided by such
analysis.
The different users of financial statements are classified into two groups and they are internal
and external users. Internal users are the managers and employees of a company who does have
an access to internally generated financial reports specially tailored to the unique information
needs of an internal decision maker. On the other hand external users are individuals who are
not directly involved in the company’s operations. These users must rely on information provided
by management as a part of the financial reporting. Our project stresses on the analysis needs of
external users of general-purpose financial statements.
3.4.3 (C) Balance Sheet
Assets = Liabilities + Shareholders’ equity
The above equation is the basis of the financial reporting system. The left-hand side of the
equation relates to the economic resources controlled by a company, or assets. These resources
are valuable in representing potential sources of future revenues through operating activities. To
engage in operating activities, a company obtains funding to invest in assets. The right-hand side
of this equation identifies funding sources. Liabilities are funding from creditors and represent

13
obligations of a company or, alternatively, claim of creditors on assets. Shareholders’ equity is a
total of (1) funding invested or contributed by shareholders and (2) accumulated earnings since
inception in excess of distribution to shareholders (retained earnings). From the shareholders’
point of view, these amounts represent their claim on company assets.16
A balance sheet summarizes the financial position of a company at a given point in time. Most
companies are required under accepted accounting practices to present a classified balance
sheet. In a classified balance sheet, assets and liabilities are separated into current and non-
current accounts. Current assets are expected to be converted to cash or used in operations
within one year or the operating cycle, whichever is longer. Current liabilities are obligations that
the company must settle in the same period. The different between current assets and current
liabilities is working capital.17
It is revealing to rewrite the accounting equation in terms of underlying business activities:
Investing activities = Financing activities
Recognizing the two financing sources, this rewritten as:
Investments = Creditor financing + Shareholder financing
3.4.4 (D) Income Statement
An income statement measures a company’s financial performance between balance sheet dates
and, hence, reflects a period of time. It lists revenues, expenses, gains, and losses of a company
over a time period. The bottom line, or net income, shows the increase (or decrease) in net
worth of a company (assets less liabilities), before considering distributions to and contributions
from shareholders. In practice, net income is determined using the accrual basis of accounting.
Under this method, revenues are recognized when a company sells goods or renders services,
independent of receiving cash. Expenses, in turn, are recognized when related revenue is
recorded, independent of paying cash.18
16
Financial Statement Analysis and Reporting, Bernstein, pg 18 17
Financial Statement Analysis and Reporting, Bernstein, pg 18 18
Financial Statement Analysis and Reporting, Bernstein, pg 19

14
3.4.5 (E) Statement of Cash Flows
Under accrual accounting, net income does not typically equal net cash flow except over the life
of a company. Since accrual accounting yields numbers different cash flow accounting, and cash
flows are important, there is a need for periodic reporting of cash inflows and outflows. For
example, analyses involving reconstruction and interpretation of business transactions often
require the statement of cash flow. The statement of cash flows details cash inflows and
outflows related to a company’s operating, investing, and financing activities over a period of a
time.19
3.4.6 (F) Links between Financial Statements
Financial statements are linked at points in time and across time. For novice users of financial
statements, the figure given above helps to get a deeper understanding of the financial
statements and their link with each other.
Figure 3: Link between Financial Statements
19
Financial Statement Analysis and Reporting, Bernstein, pg 21
15
APMM Group’s balance sheet is a listing of its investing and financing activities at a point in time.
The two statements of (1) cash flows and (2) income explain changes typically from operating
activities over a period of time in Maersk’s investing and financing activities. Every transaction
captured in these two latter statements impacts the balance sheet. Examples are revenues and
expenses affecting net income and subsequently carried to retained earnings, or cash
transactions in the statement of cash flows and summarized by the cash balance on the balance
sheet, or all revenue and expense accounts affecting one or more balance sheet accounts.
Consequently, financial statements are inherently linked: point-in-time balance sheets are
explained by the period-of-time income statement and statement of cash flow.20
3.5. Preview of Financial Statement Analysis
In analyzing financial statements there are various options available from where users can select
those suited to their specific needs. Certain tools of analysis are comparative financial statement
analysis, common-size statement analysis, and ratio analysis. Our financial analysis, motivated by
various objectives, falls within any or all of the six areas of inquiry below- in any sequence and
with the degree of relative emphasis required under the circumstances. These six areas of inquiry
and investigation are the building blocks of FSA.
Short-term liquidity. A company’s ability to meet short-term obligations.
Funds flow. Future availability and disposition of cash.
Capital structure and long-term solvency. A company’s ability to generate future revenues
and meet long-term obligations.
Return on investment. A company’s ability to provide financial rewards sufficient to attract
and retain suppliers of financing.
Asset utilization. Asset intensity in generating revenues to reach a sufficient level of
profitability.
Operating performance. A company’s success at maximizing revenues and minimizing
expenses from long-run operating activities.
20
Financial Statement Analysis and Reporting, Bernstein, pg 22-25

16
3.5.1 Comparative Financial Statement Analysis
Comparative financial statement analysis is conducted by setting consecutive balance sheets,
income statements or statement of cash flow side by side, and reviewing changes in individual
categories on a year-to-year basis. Trend is the important aspect revealed by doing this kind of
analysis. A comparison of statements over several years reveals direction, speed and extent of a
trend. Comparative financial statement analysis is also referred as horizontal analysis because of
the left–right movement of the eyes while reviewing comparative statements. One of the
techniques of comparative analysis that we have used in our project is the year-to-year change
analysis. Analysis of year-to-year changes in line items is done by comparing financial statements
over relatively short time periods of two to three years. It is manageable and understandable and
has the advantage of presenting changes in absolute currency units as well as in percentage.
Both the cumulative total for the period under investigation and the average for the period are
reported by comparative financial statement analysis. Comparing yearly amounts with an
average computed over a number of years highlights unusual happenings for a particular period,
as average values smooth out erratic or unusual fluctuations.21
3.6 Common-Size Financial Statement Analysis
The knowledge of proportion of a total group or subgroup an item represents is beneficial for
financial statement analysis. While doing the analysis of balance sheet it is a common practice to
express total assets, liabilities, and capital each as 100 percent, and individual items within these
categories as a percent of their respective total. On the other hand while analyzing income
statement, net revenue is commonly set as 100 percent with other income statement items
expressed as a percent of net revenues. The analysis technique is said to yield common-size
financial statements because the sum of the individual items in it sums up to be 100 percent. It is
also referred to as vertical analysis because of the up-down movement of our eyes while
reviewing the statements. It is a study to reveal the internal structure of financial statements. For
example, in analyzing a balance sheet, a structural analysis focuses on sources of financing
21
Financial Statement Analysis and Reporting, Bernstein, pg 32

17
(including the distribution of financing among current liabilities, non-current liabilities, and
equity capital) and composition of investments (including current and non-current assets).22
3.7 Ratio Analysis of Financial Statements
The most commonly used tools of financial statement analysis are ratios. But even though they
are widely popular they are often misunderstood and as a result their importance is often
overrated. It expresses a mathematical relation between two quantities i.e. a ratio of 200 to 100
is expressed as 2:1, or simply 2. Even though the calculation of a ratio is simple arithmetic
operation its analysis is far more complex. A ratio must refer to an economically important
relation to be meaningful. For example, the ratio of cost of goods sold to sales is an important
one because there is a direct and crucial relation between an item’s sales price and its cost. Clues
and symptoms of underlying condition are provided by ratios. It identifies areas requiring further
investigation. It reveals important relations and bases of comparison in uncovering conditions
and trends difficult to detect by inspecting individual components comprising the ratio. Factors
affecting a ratio for their probable future trend and magnitude must be adjusted because similar
to other analysis tools ratios are also future oriented. The usefulness of ratios depends on the
skillful interpretation of the factors potentially influencing future ratios.
3.7.1 Factors Affecting Ratios
The effects of economic events, industry factors, management policies, and accounting methods
must be taken into consideration beyond the internal operating conditions affecting a company’s
ratios. The effectiveness of ratios gets affected by weaknesses in accounting measurements. For
instance, historical cost values are sometimes less relevant to a decision than current market
values. We must confirm that the numbers used while computing ratios are valid and consistent
prior to computing ratios, or similar measures like trend indices or percent relations. For
instance, when inventories are measured using LIFO and prices are increasing; the current ratio is
understated because LIFO inventories are understated. In the same way certain pension liabilities
are often unrecorded and disclosed in notes only but we normally want to recognize these
liabilities when computing ratios like debt to equity. In order to be consistent adjustments made
in one ratio requires also to be made in others. For example, the omission of pension liability
22
Financial Statement Analysis and Reporting, Bernstein, pg 37

18
implies understated pension expenses and hence net income numbers often requires
adjustments in ratio computation. The quality of numbers used in the computation of ratios
determines their usefulness. The ratios, resulting from a company whose internal accounting
controls or other governance and monitoring mechanisms are unreliable in producing credible
figures, are equally unreliable.
3.7.2 Ratio Interpretation
Ratios must be interpreted with care since factors affecting the numerator can correlate with
those affecting the denominator.23 For example, companies can improve the ratio of operating
expenses to sales by reducing costs that stimulate sales such as research and development, but
this cost reduction ultimately leads long-term declines in sales or market share. A seemingly
short-term improvement in profitability can largely damage a company’s future prospects and
hence it needs to be interpreted with great care. Many ratios have important variables in
common with other ratios therefore it is not necessary to compute all possible ratios. Similar to
most tools used in financial analysis ratios are not significant by themselves and are interpretable
only while comparing with prior ratios, predetermined standards and ratios of competitors. The
variability of a ratio over time is often as important as its trend.
3.7.3 Illustration of Ratio Analysis
Numerous ratios are often computed using a company’s financial statement. While some ratios
are unique to specific circumstances or industries others have general application in financial
analysis. In the chart below list of selected ratios having general applicability for most business
have been given and are grouped in accordance with their major financial analysis objectives. In
order to assess short-term liquidity there are many ratios that can be used. One of the most
common is the current ratio indicating the current assets available to meet up current liabilities.
The acid test ratio is the more rigorous test of short-term liquidity. It uses only the most liquid
current assets such as cash, short-term investments and accounts receivable. Short-term liquidity
can also be assessed by estimating magnitude of time needed for conversion of receivable and
inventories to cash. In order to assess a company’s financing its capital structure and long-term
23
Financial Statement Analysis and Reporting, Bernstein, pg 41

19
solvency is examined. These ratios are especially reassuring for a credit analysis.24 For assessing
different aspect of return on investment there are two popular ratios and they are as follows.
Return on total assets refers to amount of earning generated before after-tax interest on a
particular amount of investment. Again shareholders are interested in management’s
performance using equity capital and to serve this particular purpose the ratio of return on
equity capital is particularly significant. Operating performance ratios often link income
statement line items to sales, and are not unlike results from common-size income statement
analysis.25 One of the important determinants of return on investment is the asset utilization
ratios, which relates sales to different asset categories. Although ratio analysis yields valuable
insights but it must be remembered that these calculation are based on numbers reported on a
company’s financial statements. Therefore in order to draw useful insights and make valid
intercompany comparisons it is very important to have skills in adjusting reported numbers
before including it in the ratio analysis.
Financial Statement Ratio Computation
Short-Term Liquidity Ratios
Current ratio = Current assets Current liabilities
Cash+ cash equivalents+
Acid test ratio = Market securities+ Accounts receivable Current liabilities
Collection period = Average accounts receivable Credit sales / 360
Days to sell inventory = Average inventory Cost of revenue /360 Capital Structure and Solvency Ratios
Total debt to total capital = Current liabilities + Long-term liabilities Equity capital – Total liabilities
Long-term debt to equity = Long-term liabilities
Equity capital
24
Financial Statement Analysis and Reporting, Bernstein, pg 42 25
Financial Statement Analysis and Reporting, Bernstein, pg 42

20
Return on Investment Ratios
Return on total assets = Net income + Interest expense (1 – Tax rate) Average total assets
Return on common equity = Net income Average equity capital Operating Performance Ratios
Gross profit ratio = Gross profit Net revenues
Operating profit to sales = Income from operations Net revenues
Pretax profit to sales = Income before income taxes Net revenues
Net income to sales = Net income Net revenues Asset Utilization Ratios
Sales to cash = Net revenues Average cash Sales to accounts receivable = Net revenues Average accounts receivable
Sales to inventories = Net revenues Average inventories
Sales to working capital = Net revenues Average working capital
Sales to fixed assets = Net revenues Average fixed assets
Sales to total assets = Net revenues Average assets

21

22
4. Preliminary Financial Analysis
In this chapter initially a brief introduction will be given of A.P Moller – Maersk Group and its
accounting policies presented in financial statements. It is necessary to understand these policies
because accounting numbers are the output of the accounting policies, choices and estimates
used by the company’s management in the development of financial statements. APMM Group’s
square models for four years are drawn, which shows business expansions, resources and profit.
Discussion of each year’s square model is summarized from creditors and investors point of view
regarding their decision making (buying, selling, and holding of shares) process.
Due to diversified company, year to year and cumulative segment analysis are carried out in
order to know the profitability, growth and risk of each segment on the whole business activities
because creditors and investors are much interested about the major sources and uses of cash
etc.
Chapter overview
Introduction of the APMM Group
Analysis of Maersk through square model from 2004-2007
Year to year analysis
Comprehensive overview of square model
Revenue and profitability analysis of the segments given below (Four year Cumulative
& year to year from 2004-2007)
Container shipping and related activities
Tankers, offshore and other shipping activities
Oil and gas activities
Retail activities
Shipyards, other industrial companies
Accounting Policies analysis of APMM Group
CHAPTER NO.4

23
4.1 Introduction of A.P Moller – Maersk
The A.P. Moller - Maersk Group is a worldwide shipping organization with about 120,000
employees and offices in around 130 countries – with global headquarters in Copenhagen,
Denmark. It owns one of the world’s largest shipping companies and in addition to that it is also
involved in a wide range of activities within the energy, shipbuilding, retail and manufacturing
industries. As it is a Danish company it is listed on the Danish Stock Exchange. Started in 1904,
the APMM Group went on to be a global company, employing about 120,000 people in around
130 countries. It is the result of a merger in 2003 between D/S 1912 and D/S Svedberg. It is a
global Group involved in a diverse range of business industries such as transportation, oil
production and shipbuilding. Following are the four main business areas of the group: Container
and related activities, Energy, Shipping and Offshore, Retail and other businesses. In our thesis
the company is further represented by the word Group and all the figures related to the Group is
in billion DKK (Danish Kroner).26
4.2 Analysis of the Accounting Policies of APMM
While analyzing the financial statements of any organization, it is necessary to understand the
accounting policies of that organization because analysis of estimates, accounting policies and
choices are have gained much more importance due to globalization. The management used
these accounting policies in financial statements for justifying business reality. Sometimes, they
used it as a tool for manipulation. So users should understand these accounting policies for
making the appropriate decision. The annual report 2003 of APMM Group has been prepared in
accordance with the provision of the Danish Financial Statements Act implicated to listed
companies and the Copenhagen Stock Exchange financial reporting requirement for listed
companies27. From financial year 2005, A.P Moller – Maersk adopted IFRS. Comparative figure of
year 2004 has been restated for better understanding of accounting policies.
In the sections below the accounting policies and choices of the group has been analyzed and
their strengths and weakness are discussed from the perspective of creditors and 26
http://about.maersk.com/en/Pages/AboutHomeNew.aspx
27
Annual Report A.P Moller - Maersk Group 2003, Page 33

24
current/potential equity investors. Our previous accounting project on APMM is the basis of
further studies in our thesis.
4.2.1 Recognition of Revenue
Revenue should be recognized according to IAS (International Accounting Standard) 18. Revenue
comprises of invoiced sales28. It means that the revenue is recognized as soon as transaction
taken place regardless of the fact whether the voyages are completed or not (or whether the risk
and reward related to the transaction has been transferred to the owner or not) . This treatment
of recognition of revenue is very liberal which overstates the earning and eventually increases
net assets when the earning is transferred to equity, although it affects earning quality adversely.
Such accounting policies portray good image on stock exchange and positively affect stock price
of the company. On the other hand long term creditors favor a conservative accounting
treatment that is late recognition of revenue and accelerate the recognition of liabilities.
4.2.2 Stocks and inventories measurements
The IAS 2 applies for stock and inventories measurement. Inventories are measured at cost
according to the FIFO method29.FIFO method assigns older cost to the cost of good sold which
understate the CGS and overstate the earning. On other hand the freshest inventories remain on
balance sheet which overstates the assets. This kind of accounting practices are favorable for
investors as increased earning push up the stock/share price in the stock exchange.
4.2.3 Tangible and intangible fixed Assets
Intangible assets should be recognized according to the IAS 38. Tangible and Intangible assets
except goodwill are recognized at cost and annually depreciated/amortized using estimated
useful life determined by the individual assessment of the assets. Goodwill acquired in business
acquisition is recognized at fair value and amortized annually. This is not in accordance with IFRS.
28
Annual Report A.O Moller – Maersk Group 2007, page 54 29
Annual Report A.P Moller – Maersk 2007, Page 55

25
4.2.4 Depreciation, Amortization and Impairment of Fixed Assets
The depreciation should be calculated according to the IAS 16 (property, plant and equipment)
and impairment according to IAS 36 (Impairment of assets). There is minimum disclosure
regarding accounting policies of the Group for depreciation, amortization and impairment even
depreciation method is not mentioned in Annual Reports. To amortized intangible assets
especially goodwill has led to high amount of depreciation, amortization expenses which
understand the income till 2003, in year 2004 the Group become IFRS compliant which led to
impairment of goodwill rather than annual amortization.
Depreciable life of the Vessels and Containers in year 2006 was increased to 20 years and 12
years, before it was between 15 – 20 years and 8 – 12 years respectively. This policy is quite
liberal as this practice will decrease the future depreciation expenses, overstate assets and
eventually increase income. Income increases the value of Equity investors, so this policy might
attract and retain Group’s equity investors.
4.2.5 Recognition of provisions for expected future losses on contracts
According to the IAS 37, a provision is recognized only when a past event has created a legal or
constructive obligation, an outflow of resources is probable and the amount of the obligation can
be estimated reliably30.Group’s contractors activities inherent a moderate degree of risk that’s
why group estimates the anticipated losses and creates provision for it and expense it in the
current year. This accelerates the liabilities; usually the Group uses such practices to expense the
future expenditure in current year.
4.2.6 Presentation of Financial statement and lack of disclosures
APMM financial statement presentation is not in accordance with the IFRS 1 while minimum
disclosure policy is adopted in their financial reporting. This made not only our analysis process
difficult but also some of the analysis could not perform due to lack of information. For example,
the Group has not mentioned the depreciation/amortization method used for depreciation of
30
http://www.iasplus.com/dttpubs/pocket2008.pdf

26
fixed assets, there is no information given regarding repair and maintenance cost that whether it
is treated as an expense or capitalized as a part of asset.
These information regarding depreciation method, repair and maintenance of PP&E are quite
important from analytical point of view, as it shows the notion of accounting methods (whether
conservatism, neutral or liberal accounting method) are used. Due to poor disclosure the
financial statements lack the characteristics of understandability, reliability and relevance.
4.2.7 Change in accounting policies
The IAS 39 (Financial instruments: Recognition and Measurement) clearly defined the way if
changes in accounting policies are needed. According to IFRS a company can only change its
accounting policies with proper justification that the change will present more true view of the
business or the company when it switches from one accounting standards to another.
In year 2006 the company has revised its estimated useful life for vessels, container and rigs from
15 to 20 years and 8 – 12 years to 20 and 12 years without giving any explanation for the change.
4.3 Company Square Model
Year 2004: As compare to year 2003, the financial position of the A.P Moller Maersk is little bit
better. The group’s square model for the year
2004 shows expansion of total assets. In year
2003, the total assets were DKK 173 billion. The
total assets in year 2004 increased by DKK 9
billion (4.9%). The slight expansion in square
model is due to increase in non-current assets
by DKK 11 billion (18.13%) while fixed assets
decrease by DKK 2 billion. As compare to
previous year, the increase in revenue was not
satisfactory (1.5%). This is mainly due to
negative exchange rate of USD dollar, which
declined by 16.5% in year 2004. One red flag is here that profit increase by 28 billion (64.7%) as
27
compare to previous year which is not an average growth. We found that this was due to write
down of tangible assets that were -60.7% compare to year 2003. The Group also decreased
depreciation expenses a lot, which caused the bust up of profit artificially. The other red flag is
that APMM gained two billion DKK profit by discontinued operation. Although the liability
decreased by only DKK 2 billion but the increase of DKK 10 billion in equity shows that APMM is
trying to reduce its debts, which is encouraging for the shareholders.(Appendix No.1)
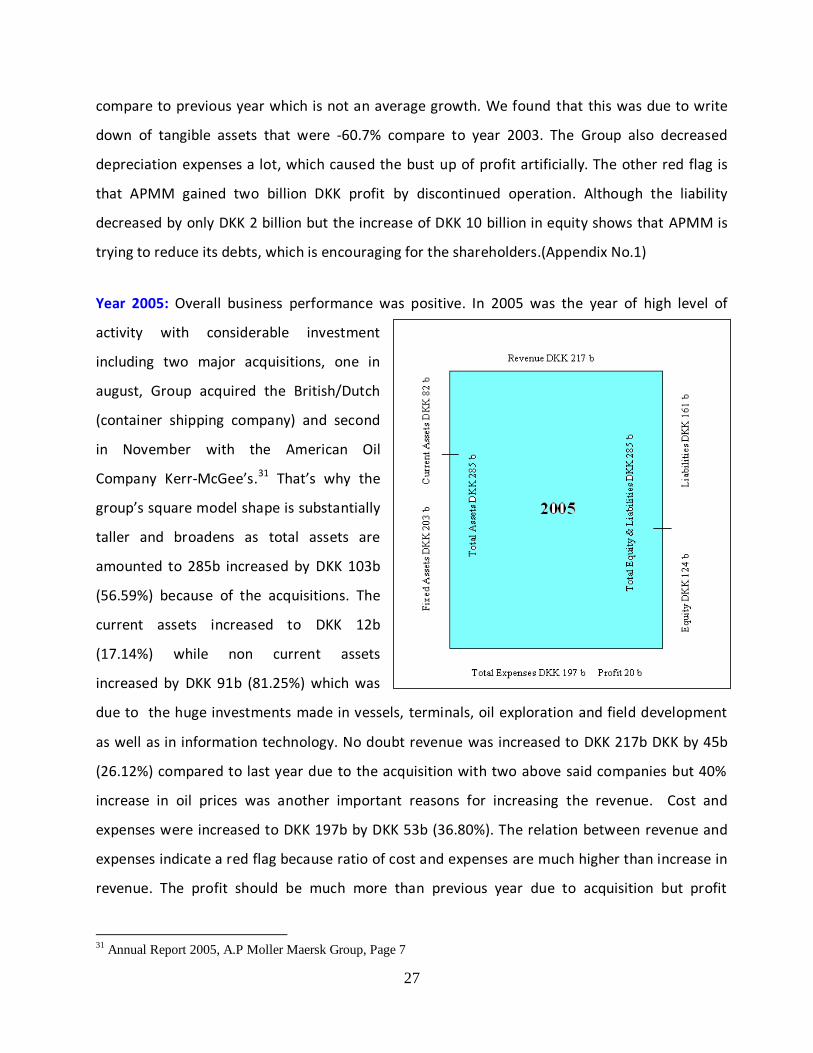
Year 2005: Overall business performance was positive. In 2005 was the year of high level of
activity with considerable investment
including two major acquisitions, one in
august, Group acquired the British/Dutch
(container shipping company) and second
in November with the American Oil
Company Kerr-McGee’s.31 That’s why the
group’s square model shape is substantially
taller and broadens as total assets are
amounted to 285b increased by DKK 103b
(56.59%) because of the acquisitions. The
current assets increased to DKK 12b
(17.14%) while non current assets
increased by DKK 91b (81.25%) which was
due to the huge investments made in vessels, terminals, oil exploration and field development
as well as in information technology. No doubt revenue was increased to DKK 217b DKK by 45b
(26.12%) compared to last year due to the acquisition with two above said companies but 40%
increase in oil prices was another important reasons for increasing the revenue. Cost and
expenses were increased to DKK 197b by DKK 53b (36.80%). The relation between revenue and
expenses indicate a red flag because ratio of cost and expenses are much higher than increase in
revenue. The profit should be much more than previous year due to acquisition but profit
31
Annual Report 2005, A.P Moller Maersk Group, Page 7

28
increased only by DKK 20b which was decreased by DKK 8b (-28%) because costs and expenses
were increased. Equity increased by DKK 21b (20.39%) that shows assets were purely financed
through debts which bust up liabilities by DKK 82b (103.79%) as compared to year 2004.
Depreciation, amortization and write-down expenses rose to DKK 5b (39%) to its normal level
because last year these were declined by (-28.18%)32. In 2005, APMM maintained the market
position in different segments (Appendix No.1)
Year 2006: In 2006, different segments of the
APMM Group developed positively which caused
the height of the square model to increase. Square
model for year 2006 still shows growth in assets as
its height is increased by DKK 29b to DKK 314b
(10.18%). The contribution of the current assets
was DKK 11b (13.41%) and non-current asset was
DKK 18b (8.86%). According to the directors’
reports the volume of sales did not reach the
expectations and Maersk line lost market share due
to difficulties for implementation of comprehensive
IT system33. Revenue was maintained on its last year level, revenue rose to DKK 272b by DKK 55b
(25.35%) because the high investment level from 2005 continued in 2006, while expenses & costs
continually increased to DKK 256b (29.95%) as compared to previous year. Although the profit
was DKK 16b in 2006 but as compare to previous year, this was decreased to DKK 16b by -20%.
This was mainly due to abnormal increase in cost and expenses and integration cost which was
58% more for the two newly acquired companies. Gain on sale of vessels and changes of the
depreciation period were the main cause for increased profit. APMM Group did not explain in its
disclosure the reasons of change in depreciation period. Liabilities increased to DKK 177b (9.93%)
and equity increased to DKK 137b (10.48%) that shows the APMM financing was primarily
through equity. Acquisition was one of the causes of increase in liability (Appendix No.1)
32
Annual Report 2005, A. P Moller Maersk, Page 5 33
Annual Report 2006, Maersk Group, Page 7
29
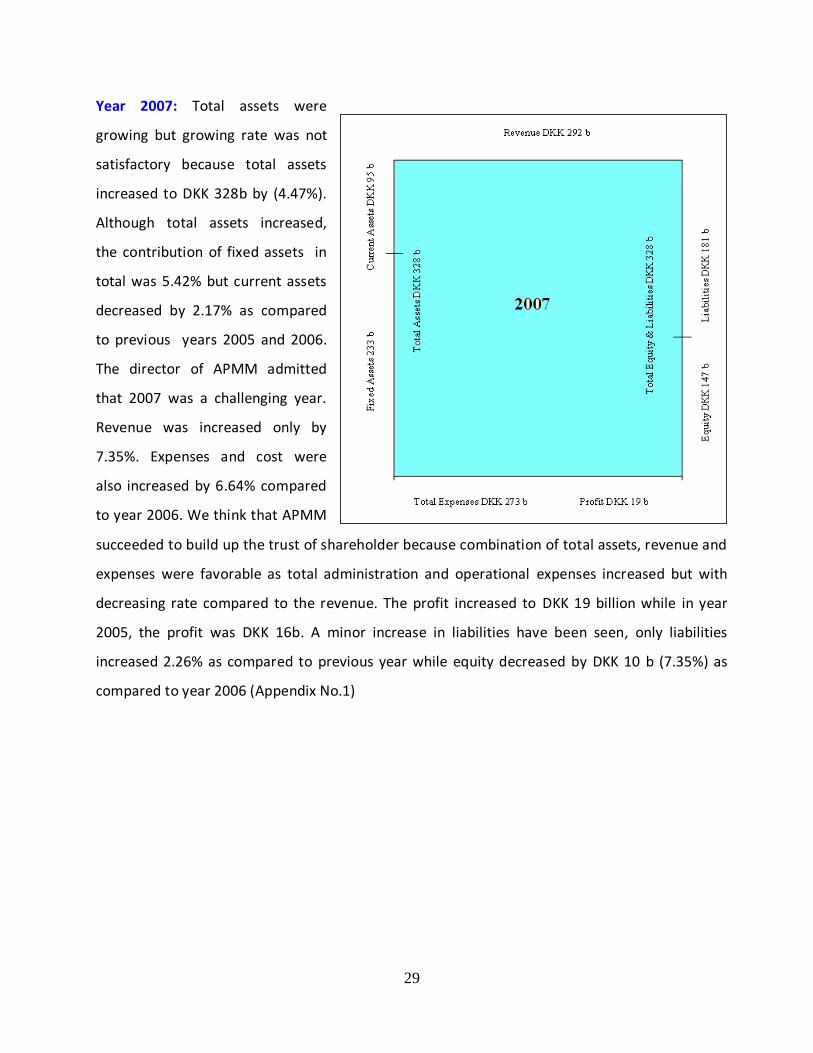
Year 2007: Total assets were
growing but growing rate was not
satisfactory because total assets
increased to DKK 328b by (4.47%).
Although total assets increased,
the contribution of fixed assets in
total was 5.42% but current assets
decreased by 2.17% as compared
to previous years 2005 and 2006.
The director of APMM admitted
that 2007 was a challenging year.
Revenue was increased only by
7.35%. Expenses and cost were
also increased by 6.64% compared
to year 2006. We think that APMM
succeeded to build up the trust of shareholder because combination of total assets, revenue and
expenses were favorable as total administration and operational expenses increased but with
decreasing rate compared to the revenue. The profit increased to DKK 19 billion while in year
2005, the profit was DKK 16b. A minor increase in liabilities have been seen, only liabilities
increased 2.26% as compared to previous year while equity decreased by DKK 10 b (7.35%) as
compared to year 2006 (Appendix No.1)

30
4.3.1 Comprehensive overview of Square Models
The square model (Thomas Polesie) enables us to analyze the closing position and overview of
Figure 4: Comprehensive overview of Square Models
the performance of an organization. The last four years performances can be easily overviewed
for APMM by using square model. We drew four years analysis of the square model for analyzing
the activities of the Group.
An instant view of the Group’s square model reveals that company is growing as the square is
getting taller and broader consistently from year 2004 to 2007. The Group’s assets are increased
31
by DKK 120 billion in last four years. Liabilities and Equity are increased by DKK 102 billion and
DKK 44 billion respectively. Such a capital structure indicates that growth in total assets is
financed mainly by internally generated funds, and liabilities.
This kind of financial position is much favorable for both creditors and investors. Investors are
interested in future inflow in order to get appreciated price for stock and dividend. The rise in
Group’s assets bust up its future inflow generation prospects, which is the main concern of
investors. On other hand the growth in assets is financed mainly by Equity financing, this has
increased safety margin for creditors, which is their main concern.
Revenue, as per Group’s square model, is increased for DKK 120 billion from financial year from
2004 to 2007. While the expenses of the Group also increased by a higher amount that is DKK
129 billion. Although the Group has not generated considerable amount of profit from year 2004
to 2007 but this does not mean that the company has lost value for the investors. Investors are
always interested in the company’s future returns, and it is not based on current year’s profit but
the company’s plan for future growth. Therefore such a financial position – that the group has
invested considerable amount in assets which brighten its future returns – is favorable for
investors and creditors as well.
Despite the fact that Square Model instantly visualizes the business activities using financial data
from income statement and balance sheet without recasting for abnormal, non–recurring items
etc. We also know that these statements are based on accrual accounting, where management
distorts the information by accounting estimates, choices and earning management. Besides
Square model does not take cash flow information into consideration, which no doubt play an
important role in analyzing financial health of any company.
While performing analysis of APMM using square model, we have found an application of the
short-comings of the model in year 2004 where group showed DKK 10 billion increases in profit
as compared to last year increase. But when we went beyond the square model and analyzed the
source of changes in profit it is revealed that increases of DKK 10 billion was not the results of
core business activities but in year 2004 as DKK -5 billion lower write down has been made to the

32
fixed assets compared to last year while DKK 2 billion gain was realized on discontinuing
operations. Due to these two unusual factors the profit, as showed in square model is busted.
4.4 Segment Analysis
Many companies are engaged just in one business, but due to globalization and competitive
market, most of the companies often have more than one business. Each segment contributes a
vital role and influences the overall business of the organization. That’s why while valuing
financial position of any business; analysts suggest that one should conduct segment analysis in
order to know that which segment is contributing how much in the total revenue and profit.
Segment analysis is more important while doing the analysis of diversified companies. A. P
Moller Maersk is a well diversified company having five business segments.
Container shipping and related activities
Tankers, offshore and other shipping activities
Oil and gas activities
Retail activities
Shipyards, other industrial companies
Each business division or segment of APMM has its own growth pattern, profitability and future
potential. The first thing to look for is how the company’s various businesses contribute to its
total revenue, the company may have a big sideline business that reduces the influence of
mainline operation34. Profitability is the main key so it is important to know a company’s
business is divided, it is also good to consider those business profits35. The segment analysis of
APMM Group has been conducted into two sections. In first section brief analysis of each
segment’s Revenue and Profit for four years (2004 to 07) are conducted while in second section,
we analyzed each segment from year to year in order to know the trend.
34
http://news.morningstar.com/classroom2/course.asp?docId=3072&page=2&CN=COM
35
http://news.morningstar.com/classroom2/course.asp?docId=3072&page=3&CN=COM
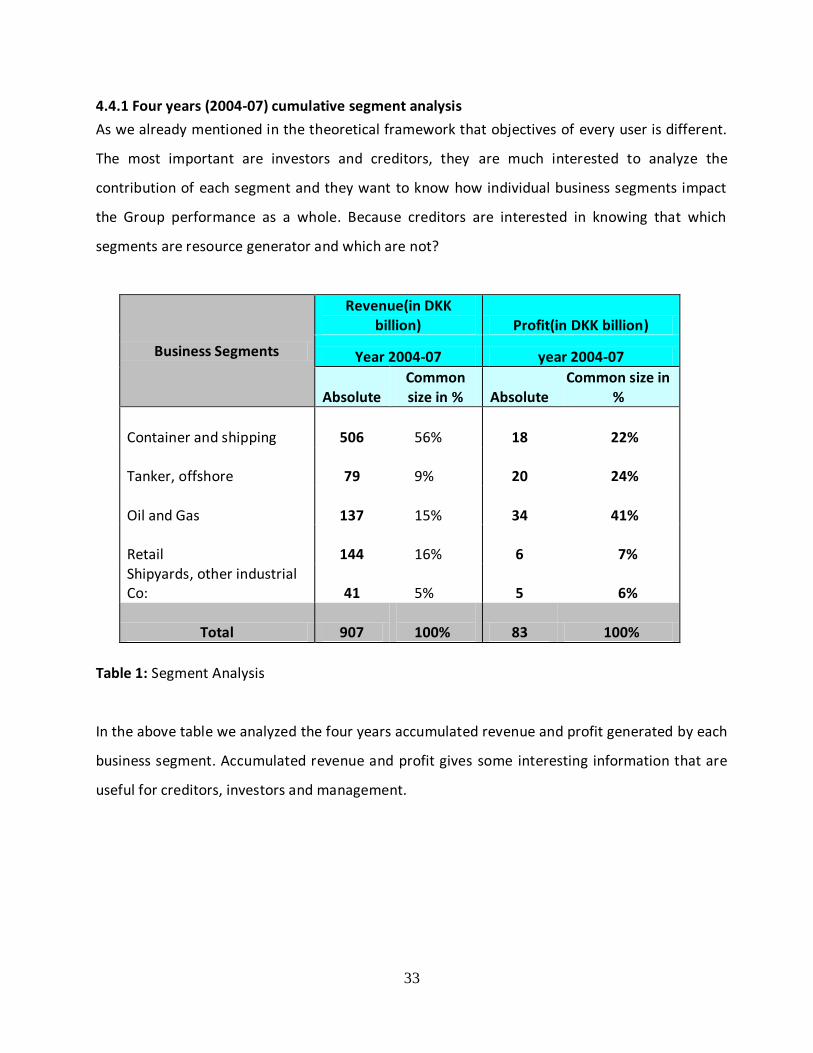
33
4.4.1 Four years (2004-07) cumulative segment analysis
As we already mentioned in the theoretical framework that objectives of every user is different.
The most important are investors and creditors, they are much interested to analyze the
contribution of each segment and they want to know how individual business segments impact
the Group performance as a whole. Because creditors are interested in knowing that which
segments are resource generator and which are not?
Business Segments
Revenue(in DKK billion) Profit(in DKK billion)
Year 2004-07 year 2004-07
Absolute Common size in % Absolute
Common size in %
Container and shipping 506 56% 18 22%
Tanker, offshore 79 9% 20 24%
Oil and Gas 137 15% 34 41%
Retail 144 16% 6 7%
Shipyards, other industrial Co: 41
5% 5 6%
Total 907
100% 83 100%
Table 1: Segment Analysis
In the above table we analyzed the four years accumulated revenue and profit generated by each
business segment. Accumulated revenue and profit gives some interesting information that are
useful for creditors, investors and management.
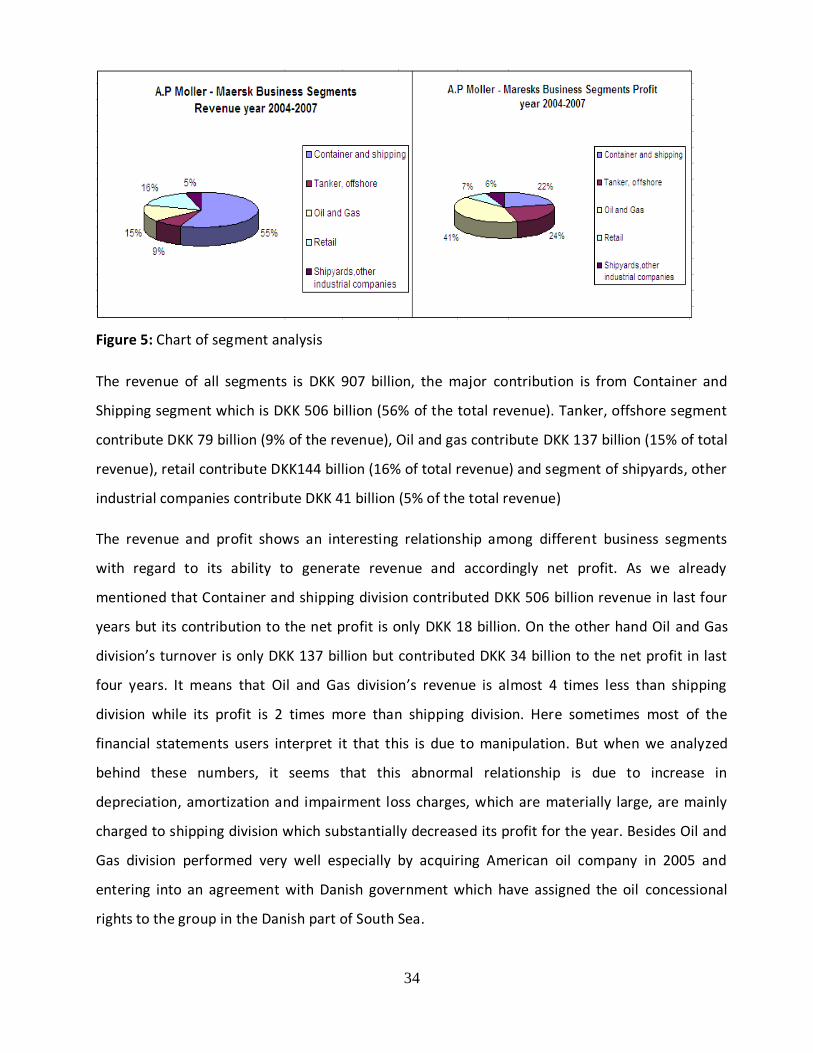
34
Figure 5: Chart of segment analysis
The revenue of all segments is DKK 907 billion, the major contribution is from Container and
Shipping segment which is DKK 506 billion (56% of the total revenue). Tanker, offshore segment
contribute DKK 79 billion (9% of the revenue), Oil and gas contribute DKK 137 billion (15% of total
revenue), retail contribute DKK144 billion (16% of total revenue) and segment of shipyards, other
industrial companies contribute DKK 41 billion (5% of the total revenue)
The revenue and profit shows an interesting relationship among different business segments
with regard to its ability to generate revenue and accordingly net profit. As we already
mentioned that Container and shipping division contributed DKK 506 billion revenue in last four
years but its contribution to the net profit is only DKK 18 billion. On the other hand Oil and Gas
division’s turnover is only DKK 137 billion but contributed DKK 34 billion to the net profit in last
four years. It means that Oil and Gas division’s revenue is almost 4 times less than shipping
division while its profit is 2 times more than shipping division. Here sometimes most of the
financial statements users interpret it that this is due to manipulation. But when we analyzed
behind these numbers, it seems that this abnormal relationship is due to increase in
depreciation, amortization and impairment loss charges, which are materially large, are mainly
charged to shipping division which substantially decreased its profit for the year. Besides Oil and
Gas division performed very well especially by acquiring American oil company in 2005 and
entering into an agreement with Danish government which have assigned the oil concessional
rights to the group in the Danish part of South Sea.
35
4.4.2 Year to year – Individual Segment Analysis
The year to year analysis of APMM was conducted from year 2004 to 2007. We developed the
following table for better understanding of comparison between different segments, especially in
the context of revenue and profit.
Year to Year – Individual Segment Analysis
Table 2: Year to year segment analysis of revenue and profit
In the year 2004, revenue for the year of container and shipping segment increased by only
5,45% as compared to previous year but profit positively increased by 135,19%. Because in year

36
2004, the overall growth market rate is 5% which in shipping industry is considered a good rate
of growth. The other reason of unbelievable increase in profit was due to decrease in expenses
by 12% by lower write down on fixed assets in this year. Increase in gain on sales of ships also
increased by 134% which alternatively busted up the profit. Although in 2004, there had been
seen minor increase in revenue but in year 2005, revenue dramatically increased by DKK 33
billion while profit decrease by 1 billion. The revenue increased due to acquisition, the APMM
group acquired British shipping container company P & O Nedlloyed and profit decreased due to
high integration and depreciation & impairment losses of newly acquired firm.
In year 2006, most of the core group of APMM Group developed positively. The revenue of
container and shipping segment increased by DKK 21 billion and there had been more than DKK 3
billion net losses due to decline in rate of container services and increase in high fuel price. The
expectation of acquisition did not reach the desired target. Container and shipping segment
contribute 56% of total share so APMM lost market share this year. The container vessel capacity
increased more than the volume transported, the weakening of the balance between supply and
demand resulted in a decline in rates36. Due to global crises, the year 2007 was a challenging
year. The revenue reduced by 5 billion in year 2007 but due to effective management and new
CEO controlled the integration and other cost, reduce taxes so positive development had been
seen. The profit of associated companies increased but not satisfactorily because the USD
exchange rate 8% declined throughout the year as compared to year 2006.
In year 2005, The revenue of oil and gas also increased by DKK 7 billion (36%) but profit increased
by only 2,78%. The situation had been seen different in year 2006, revenue consistently
increased by DKK 13 billion (49,91%) and profit also increased by DKK 3 billion (44,81%). The
overall result for the year 2006 for Danish and international oil and gas activities were USD 1702
million which was considerably above 200537. The result effected positively by higher oil prices
whereas increase in depreciation and impairment lost and taxes effect negatively.
36
Annual Report A.P Moller – Maersk Group 2006, page 5 37
Annual Report A.P Moller – Maersk Group 2006, page 22

37
Most of the companies acquire other companies for survival and to compete in the market. The
APMM is a well diversified company, we had seen while conducting the analysis of APMM Group
practice of acquiring companies. In year 2005, APMM Group acquired two British Companies for
container and shipping segment (Dutch Container Company & Royal P&O Nedlloyed) for Dkk16
billion. An American Oil company also acquired Kerr – McGee) for oil and gas segment. That’s
why the dramatically negative effect had been seen in year 2005 due to acquisition because of
increase DKK 1.8 billion integration cost. Due to acquisition, depreciation and impairment loss in
container and shipping segment was increased by DKK 2 billion (36%) as compare to the previous
year. Due to acquisition of container and shipping and oil and gas segment, the profits for the
year 2005 and 2006 were negatively affected.
Figure 6: Effects of Acquisition
The profit of Oil and Gas segment was in a much better position because of 40%38 and 20%39
increases in Oil prices in years 2005 and 2006 respectively. Graphically, one can see that
Container and Shipping segment’s profit are much negatively affected than Oil and Gas segment
in year 2005 and 2006. But in year 2007, there had been positive effect in container and shipping
segment. Wise & risk taker investors always favor such a situation where a company suffers
losses because of acquiring new companies, because they expect that the new companies can
generate a positive return in future.
38
Annual Report A.P Moller – Maersk 2005, page 5 39
Annual Report A.P Moller – Maersk 2006, page
38
5. Performance Analysis
APMM’s performance analysis over four years is conducted using income statement analysis for
Earning Quality, Revenue Vs Profit analysis and how does it affect equity investors’ decision
making, since equity investors are interested in income which increase its value of investment in
the Group. The basis of performance analysis in this section is the accounting project that we
previously deed on Maersk.
Group’s accounting measures for the revenue are quite liberal since earning quality are derived
using conservative accounting measures. Depreciation is one of major expenses of the Group,
and it is used as a tool to boost up earning in year 2004.
Chapter overview
By using Income Statement Analysis
Earning Quality of A.P Moller-Maersk Group
Relationship between
a) Revenue and trade receivable
b) Revenue and inventories
Analysis of key performance indicators
Depreciation, amortization and impairment loss
External cost and staff cost
Tax expenses
Financial expenses
Trend analysis of income statement (Four years)
Strengths and weaknesses for investor and creditors
CHAPTER NO.5

39
Group’s revenue is recognized when invoice sales occurred, which overstates the revenue. But
on the other hand provision for the estimated loss on the future contracts are recognized in
balance sheet which off-set against overstatement of revenue.
Trend analysis of the income statement for the group over four years is conducted and
concluded from the perspective of equity investor and creditors. All financial statements have
logical relevance to the profitability analysis but principally income statement is the most
important statement for the analysis of performance or profitability analysis. Income statement
reports company operating results which are the core operation of business and plays main role
in company’s value, solvency and liquidity.
APMM’s profitability from year 2004 to 2007 has critically been analyzed to determine whether
the accounting measures reported are true income? Equity investors concentrate on income
because it is the unique factor which adds value to their investment (equity). For creditors,
income and net cash flow from operation are the source of principle and interest payment.
Therefore in the section below, APMM’s income quality is evaluated by analyzing the Group’s
accounting estimates and methods related to revenue measurements and expenses.
5.1 Earning Quality of APMM
A company’s income has earning quality if it is derived using conservative accounting methods,
free of management distortion, and exclusion of non recurring items. During the analysis Group’s
earning quality an important relationship between revenue and profit for the year is observed,
which really helped us to determine earning quality of group. According to the observed
relationship “Revenue is the main source of profit; therefore change in revenue should be
accompanied by a proportionate increase/decrease in profit only and only if there is no
management distortion and extra – ordinary or non – recurring gain/losses”. If the above relation
is true company’s income is persistent and has Quality and vice versa.
In the below diagram the discovered relationship is applied to Group’s revenue and profit in
order to conclude that whether accounting profit is a true measure of income or not.

40
Figure 7: Graph of revenue Vs profit
The diagram indicates Group’s revenue in year 2004 is increased by 2% (DKK 2 billion) compared
to year 2003 but profit for the year is increased by 62% (DKK 11 billion). This reveals that an
increase in profit is not proportional to the increases in revenue or in other words the Group’s
earning has poor quality. It indicates that accounting conventions or non – recurring items
contributed to the profit. Therefore we have conducted in-depth analysis and discovered that
62% increases in profit resulted because of 60% lower – write down in fixed assets is made
compared to last year, which reduced the depreciation and impairment expenses by 38% in
comparison to last year. If we normalize these effects the profit for the year remains at 3%
increase compared to last year.
In year 2005 and 06 also indicates that Group has poor quality of earning because the revenue is
increased by 31% and 25% respectively but the profit is decreased by -28% and -20% respectively
because the depreciation expenses are carried up on its normal level which was reduced in last
year. One time integration cost of DKK 2b is also incurred in year 2005 which negatively affected
the profit. The curve of revenue and profit is moving in opposite direction, which is due to
shifting of profit or losses from one financial year to other using accounting conventions
(Appendix No.9).
Revenue Vs Profit
0
50
100
150
200
250
300
1 2 3 4 5
DKK in Billion
Revenue Profit for the year
2003 2004 2006 2007 2005

41
5.1.1 Relationship between Revenue, and Trade Receivables
The relationship between revenue and receivable is far more important from the dimension of
measuring earning quality. If the account receivable is increasing faster than increase in revenue,
it might be generous extension in credit line, increased incentives or poor collection policies.
Figure 8: Revenue Vs Trade Receivable
The above diagram reveals the relationship between Group’s revenue and account receivables
from year 2004 to 2007. It indicates that account receivable grow at a rate exceeding revenue
from year 2004 to 2005, because of extensive credit lines and loss credit policies as well future
recognition of the revenue. But in year 2006 receivables increased at a decreasing rate compared
to the revenue. While in 2007 revenue increased but receivables decreased by 10% which shows
that recovery policies of the Group has been affectively implemented which indicates earning
quality in coming years.
5.1.2 Relationship between Revenue, and Inventories
Revenue Vs Trade Receivable
-20%
-10%
0%
10%
20%
30%
40%
50%
1 2 3 4
revenue A/R
2003-04 2004-05 2005-06
2006-07

42
The diagram indicates that except in year 2003, inventories are kept at very high level as
compared to the revenue. This indicates cash is invested in excess amount of inventories which
may have affected group’s working capital and current ratio especially in the year2005. Just–in–
time system has far more benefits.
Figure 9: Revenue Vs Inventory
5.1.3 Depreciation, amortization and Impairment losses
Impairment losses, amortization and depreciation expenses are significant in amount for the
APMM Group. The reason for such a high depreciation charges is that service companies usually
have substantial amount of depreciation, besides the Group operates in highly intensive
investment industries where companies maintain a large amount of assets and ultimately result
in high depreciation charges.
Change in Group’s assets and depreciation expenses from year 2003 to 2004 shown in the
diagram below, are decreased but depreciation expenses are decreased at exceeding rate than
assets compared to previous year. The reason for abnormal decreases in depreciation expenses
was only due to write down of the fixed assets which artificially busted up the profit for the year
by 62%. This indicates that depreciation is used as a tool for earning by the management.
In year 2005 & 2006 the depreciation expenses are increased to the normal level, although in
year 2005 and 2006 substantial amount of investment has been made in fixed assets, which
resulted in 35% increase of depreciation expenses in year 2007 compared to 2006(Appendix
No.9)
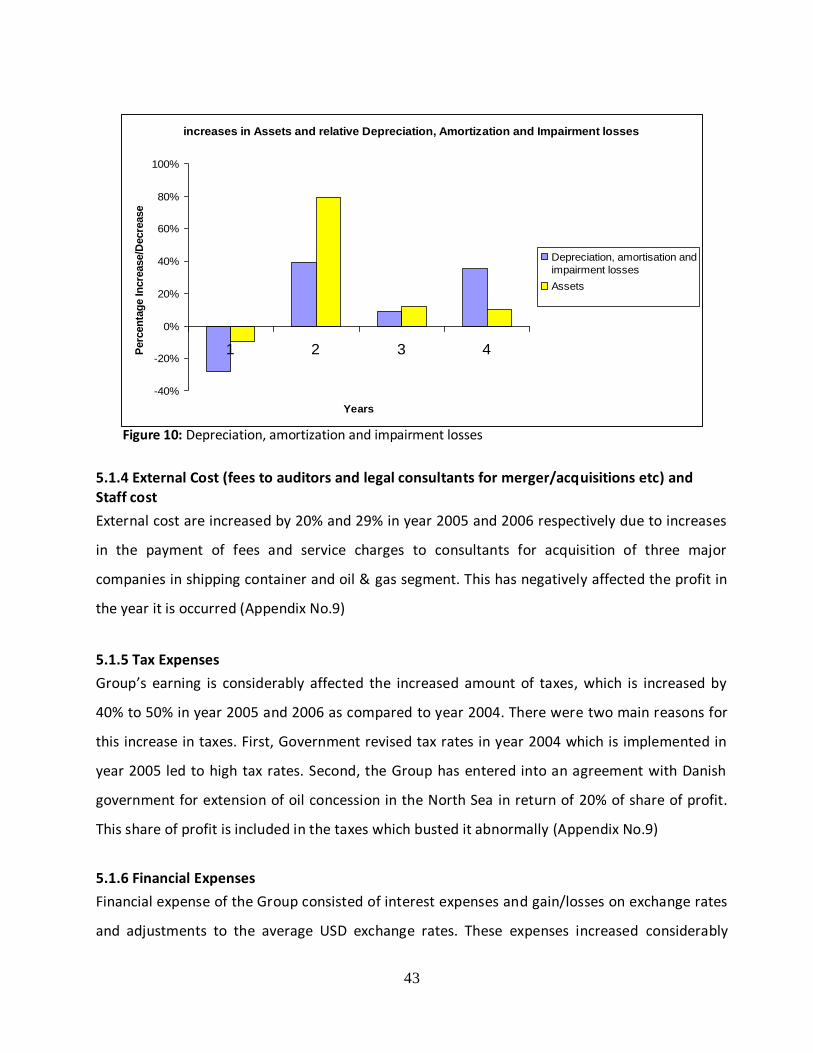
43
increases in Assets and relative Depreciation, Amortization and Impairment losses
-40%
-20%
0%
20%
40%
60%
80%
100%
1 2 3 4
Years
Perc
en
tag
e In
cre
ase/D
ecre
ase
Depreciation, amortisation and
impairment losses
Assets
Figure 10: Depreciation, amortization and impairment losses
5.1.4 External Cost (fees to auditors and legal consultants for merger/acquisitions etc) and Staff cost
External cost are increased by 20% and 29% in year 2005 and 2006 respectively due to increases
in the payment of fees and service charges to consultants for acquisition of three major
companies in shipping container and oil & gas segment. This has negatively affected the profit in
the year it is occurred (Appendix No.9)
5.1.5 Tax Expenses
Group’s earning is considerably affected the increased amount of taxes, which is increased by
40% to 50% in year 2005 and 2006 as compared to year 2004. There were two main reasons for
this increase in taxes. First, Government revised tax rates in year 2004 which is implemented in
year 2005 led to high tax rates. Second, the Group has entered into an agreement with Danish
government for extension of oil concession in the North Sea in return of 20% of share of profit.
This share of profit is included in the taxes which busted it abnormally (Appendix No.9)
5.1.6 Financial Expenses
Financial expense of the Group consisted of interest expenses and gain/losses on exchange rates
and adjustments to the average USD exchange rates. These expenses increased considerably

44
because in year 2005 and 2006 due to increased debts in 2005 which has increased the interest
expenses. On the other side, fall in USD exchange rates has pushed the figure for financial
expense.(Appendix No.9)
5.2 Trend Analysis of Income Statement over four years
For the purpose of trend analysis, five year data from 2004-07 has been analyzed. We focus on
the evaluation of revenue with comparison to profit and the cost related to it. If we analyze the
data of APMM, we observe a low growth rate in revenue in year 2004 and 2007. In year 2004
revenue increased to DKK 160 by 3 billion (2%) while in year 2007, revenue increased to DKK 279
billion by DKK 19 billion (7%). After 2004, turnover increased abnormally in year 2005 and 2006.
In year 2005, the situation was opposite as compared to year 2004. Revenue increased to DKK
209 billion by 49 billion (31%) in the year 2006, it increased to DKK 260 billion by DKK 51 billion
(25%). The reason for lower growth rate in year 2004 and 2007 was due to new major
investment in concerning industry. In year 2005 and 2006, the revenue increased due to merger
and acquisition with three companies and their effects will be discussed in next paragraph while
analyzing profit trend. (Appendix No.9)
The profit for the year of the Group was positively increased to DKK 28 billion by DKK 11 billion
(62%) in year 2004 but had negative influence in year 2005 and 2006, by exceptional expenses
relating to acquisition of companies, that was decreased by 28% and 20% respectively. In year
2006, again Group improved its controllability and the graph increased by 15% as compared to
year 2005. Abnormal profit (62%) increased due to depreciation, amortization and impairment
expenses reduced to DKK 13 billion by DKK 5 billion (-28%). The result of year 2004 affected
positively as compare to previous years which could be explained due to increasing demand for
container demand and higher tanker rate, oil prices increased by 27% and low write-down on
intangible fixed assets, due to increasing tax on oil activities and USD exchange rate which is 9%
lower in relation to DKK (Appendix No.9)
The negative profit in next two year was due to acquiring other companies. So depreciation
expenses increased by 39% and 9%, External cost increased by 36% and 32%, financial expenses

45
were 84% and 34% respectively. Increase rate of Integration cost and tax rate were also the
other reasons of declining profit. .Although the Group financial position seems negative but the
situation is favorable for potential investor because after merger and acquisition affect of
utilization of assets will give benefit in later years. The risk factor is also minimized in this
situation for the creditors, but the alarming point is that after merger and acquisition, intangible
assets increased to DKK 28 billion by DKK 27 billion (2438.72%) which involve uncertainty. As we
already said, that in year 2007, graph profit increased (Appendix No.9)
The reason behind this was that the Group continued to increase positively its investment
receiving a total of 33 container vessels, 15 tankers and one drilling rig with Australian tugboat
company Adsteam Marine Limited but profit was negatively affected by the increase of oil price
which was 64% as compared to previous year. The total investments amounted to DKK 34 billion
in DKK caused the increase in depreciation which was increased to DKK 26 billion by DKK 7 billion
(35%). The Group’s profit was increased to DKK 19 billion by DKK 3 billion (15%) as compared to
last year. Comparatively very good profit in last two year was due to the Group’s arrangement of
finance for more investment through the gain on sales which increased to DKK 6 billion by DKK 2
billion(43%) by sale of 24 vessels and three rigs and also by returning unproductive vessels taken
under finance leased (Appendix No.9)
5.3 Conclusion from the perspective of investors
Performance analysis of the Group for the four years reveals that group revenue is increased
substantially because of increased price of Oil, freight rates, acquisition of British/Dutch shipping
company, Royal P&O and American Oil Company Kerr – McGee. Although Net profit in these four
years does not show substantial increase due to the fact that Average USD exchange rates are
declined, higher integration cost on acquisition, increased depreciation and impairment losses
and increased Staff cost because of increase of employee from 76,000 to 120,000.
In year 2005 Group reported 62% of increase in net profit for the year but this increase was not
due to operating efficiency but of earning management. The group has bright and persistent long
46
term prospects as major cost on acquisition, integration cost, and write down on fixed assets are
done in previous year, which will result in lower expenses and high earnings in later years.
Equity investors use earning as an indicator for buying/selling/holding company’s stock. As
already discussed, in year 2005 and 06 profit was decreased by -28% and -4% compared to last
year, which might reduce share price of the Group. A wise investor always look for such a
situation where company’s profit decreases not because of poor performance but due to
acquisition and depreciation cost. These costs are one time, and do not recur in later periods
besides acquisitions may decrease profit for the year in which it is occurred but it will be
profitable in the long run, which will affect the stock price positively.
47
6. Balance Sheet Analysis
Chapter overview
Analysis of Group’s short term liquidity through
Current & acid-test ratio
Cash assets & cash liabilities ratio
Day’s sales in receivable and inventory (Days)
Account receivable and inventory turnover(Time)
Cash provided by operation to average current liabilities
Working capital
Analysis of Group’s assets utilization through
Sales to cash and equivalent
Sales to receivable and inventory
Sales to working capital
Sales to fixed assets and total assets
Sales to short-term liabilities
Analysis of Return on investment
Return on investment capital (ROIC)
Return on total assets (RTA)
Return on equity (ROE)
Analysis of Capital structure & solvency
Total debt to equity & total debt + equity ratio
Long term liabilities to equity & total equity to total debts
Fixed assets to equity and current assets to total liabilities
Trend analysis of four years of Balance Sheet
Comprehensive overview of
Equity
Liabilities
Profit
Dividend
CHAPTER NO.6

48
In previous chapter, we discuss the different aspects of income statement, no doubt, no doubt,
after analyzing the income statement; it is easy to draw a picture of profitability through its
operations. But here’s one of the best kept secrets in the world of financial statements: a change
in one statement nearly always has an impact on the other statements so when income
statement in to be managed, it also have an effect on the balance sheet.40 Because balance sheet
in the only source where one can get information about the resources of the company and how
these sources of funds are used for different operations of the business.
To make judgments about a firm’s performance the analyst needs benchmarks41.There are
different types of benchmarks such as cross-sectional analysis (Comparison to other firms), time-
series analysis (Comparison to a firm’s own history). Here we analyze the balance sheet by time-
series analysis or trend analysis. We analyze the balance sheet of APMM Group for four years in
order to know the financial position, its assets ingredients, market strength and sources and their
uses. For this we used following analytical tool
Comprehensive overview of APMM Group (Accumulative of four years)
Group’s short term liquidity
Group’s assets utilization
Return on investment
Capital structure
Trend analysis of balance sheet.
6.1 Comprehensive overview of Equity, Liabilities, profit & Dividend
In income statement and preliminary financial analysis, we discuss revenue and profit briefly
accumulatively and segmental. But dividend and equity is also important and relate to revenue
and profit so analysts insist that while analyzing financial position, one have to know about the
growth rate because it is important for financial measure.
40
Financial Intelligence (A manager’ guide to knowing what the numbers really mean) written by Karen Berman and
Joe Knight. Page 102 41
Financial Statement Analysis and security valuation, 2nd
Edition, by Stephen H. Penman.

49
A.P Moller – Maersk Group Analysis of Four year
2004-07
Source: Annual Report A.P Moller Maersk Group 2007, Page 2
Figure 11: Comprehensive overview of Equity, Liabilities, Dividend and Profit As shown above in the graph, APMM Group, we had seen remarkable improvement during the
last four years. In year 2003, total equity was DKK 83,657 million42. The equity in 2004 increased
by DKK 19 million (18.54%). In year 2005, the same trend had been seen, equity increased by
19.18% as compared to previous year. But in year 2006 and 2007, the equity increased by only
7.04% and 6.81% respectively. We already explained the liabilities and equity relationship in
square model; one can analyze the relationship of equity and liabilities. This relationship shows
that how a firm financed its operations. There are two ways of financing, weather the finance for
the company generated through shareholders or funds are generated through external resources
such as bank. Equity was growing every year which shows that overall positive performance with
high level of activities.
42
Annual Report A.P Moller – Maersk 2007, Page 2

50
The comparison of year 2004 and 2005 shows that APMM financed assets purely through debts
which bust up the liabilities 105% as compared to year 2004. After 2004, the liabilities decreased
and equity increased with positive ratio that shows that APMM is trying to reduce its debts. We
think that APMM Group is trying to portray a rosy picture of profit because a lot of depreciation
expenses decreased by increasing its useful life without giving any logical comments, according
to IFRS, there should be given proper disclosure but we had not been seen any detail in the notes
of its annual reports. In year 2004, APMM Group gained DKK 2 billion profit from discontinued
operations, which shows that they are trying to create a positive because after that a slight
decrease in trend had been seen in profit. Regarding the dividend analysis, in year 2004, the
dividend increased by DKK 150 million (33.33%) but after that in year 2005, 2006 and 2007
dividend increase only by 18.18%, 0.00% and 15.38% respectively. After the acquisition there was
no major rise had been seen in dividend while in year 2006, same amount of dividend paid that
was year 2005, it was due to acquisition because APMM Group invests the part of dividend
amount for more investment. The relationship among expenses, revenue, cost, assets and equity
and their consequences are also described in the square model as above.
6.2 Group Short-term liquidity
Short term liquidity position of APMM Group was analyzed through following liquidity ratios.
Short term liquidity gained much importance for creditors and investors because “liquidity is a
matter of degree, a lack of liquidity may mean that the enterprise in unable to avail itself of
favorable discounts and is unable to take advantages of profitable business opportunities as they
arise”43.
43
Financial Statement Analysis by Leopold A. Bernstein, 5th Edition, page 537

51
Source: Annual Report of A.P Moller – Maersk Group Table: 03: Short term liquidity analysis
Short term liquidity is of great importance while conducting analysis due to the fact that until a
firm is able to pay its short term debts, it has the prospects of continuing as a going concern. The
result of the above table presents some important clues of analyzing short term liquidity over the
previous four years of APMM Group. The Group’s current ratio in year 2004 was 1.54 but after
that current ratio decreased slightly every year except in year 2006. The current ratio of APMM
Group in all years had been low but in year 2001 it is at its lowest level in four years. According to
the rule of thumb, it seems relatively low in all four years. The rule of thumb of current ratio is
2:1 (or 200 percent), it is sound and anything below that norm is bad while the higher above that
figure the current ratio is, the better44. We think that low ratio were due to increase rate of
growth in current liabilities from year 2004 to 2007 continually, where we find 34.72% in year
2005 as compare to previous year. We also find that this was due to cash and cash equivalent
from year 2004 to 2007 represent a greater proportion of current assets (Appendix No
44
Financial Statement Analysis by Leopold A. Bernstein, 5th Edition, page 562

52
Graphical Presentation of short-term liquidity analysis
Figure 12: Graphical presentation of short term liquidity analysis
0,70
0,63
0,39
0,60
-
0,10
0,20
0,30
0,40
0,50
0,60
0,70
0,80
2004--07
In percentage
Years
Cash provided by operations to average current liabilities
24,46
20,94
30,35
22,58
-
5,00
10,00
15,00
20,00
25,00
30,00
35,00
2004--07
Amount in Dkk Billion
Years
Working Capital
37,49
12,36
40,62
13,85
36,27
14,11
30,57
16,21
-5,00
10,00
15,00 20,00
25,00 30,00
35,00
40,00 45,00
Day.s sales in receivable(days)
Day.s sales in inventory(days)
2004--07 2004--07
Days
Years
Day's Sales in Receivable and Inventory
6,47
29,84
6,96
31,10
7,13
29,26
7,35
24,00
-
5,00
10,00
15,00
20,00
25,00
30,00
35,00
Accounts Receivable turnover(Times)
Inventory turnover(Times)
2004--07 2004--07
Times
Years
Accounts Receibable turnover & Inventory turnover
1,54 1,45
1,35 1,28
1,49 1,35 1,32
1,18
-
0,20
0,40
0,60
0,80
1,00
1,20
1,40
1,60
1,80
Current Ratio Acid test ratio
2004--07 2004--07
Ratios
Years
Current and Acid-test ratios
0,24
0,87
0,25
0 ,58
0 ,25
0,70
0,13
0,50
-0,10 0,20 0,30 0,40 0,50 0,60 0,70 0,80 0,90 1,00
Cash assets ratio cash liabilities ratio
2004--07 2004--07
Ratios
Years
Current Assets Ratio & Current Liabilities
Ratios

53
APMM Group acid-test ratio from 2005 to 2007 (1.28, 1.35 and 1.18 respectively) had been seen
slightly decreasing position. According to trend analysis of APMM Group, we find that inventories
represent lower proportion of current assets and total assets but if we see the accounts
receivable turnover and the inventories turnover than it seems that the level of liquidity of
company is good because its revenue is increasing smoothly (74% growth) and no doubt,
revenue is the best source for paying short term debts. Accounts receivable turnover represents
good position in last two years which improves the finance for APMM Group (Appendix No.2)
The Group’s day’s sales in receivables was getting worse as it declined in year 2003 to 2005 and
that might be the reasons of increasing bad debts. The reason for this ratio to decline was due to
the acquisition of three big companies by APMM Group for future realization of the revenue
credit policies. We find that after the acquisition the ratio of day’s sales in receivable improved in
last year.
“Day’s sales in inventory are increasing year by year which indicates the failure of revenue to
keep up with the operations. Days that sales are in inventory is increased from 9 to 16 in four
years, because growth in inventory is 26% while sales/revenue’s growth is only 16%, in last five
years. But the reason for keeping such a high inventory was management’s expectation of
increased turnover which didn’t turn out to be the case.
The cash asset ratio is similar to the current ratio, except that the current ratio includes current
assets such as inventories in the numerator. Some analysts believe that including current assets
makes it difficult to convert it into usable funds for debt obligations. The cash asset ratio is a
much more accurate measure of a firm's liquidity45. The ratio is smaller than 1 which shows that
APMM Group is not in a position to pay its short term debts. But we find that the situation
behind the number is different. One thing should be kept in mind that this ratio varies according
to the size of the company, industry and by other factors. This was because the company is
allocating its resources for the growth of the business so they acquired three big companies.
45
http://www.investopedia.com/terms/c/cash-asset-ratio.asp

54
Cash liability ratio used for the measurement of cash available to pay the short term debts. This
cash to current liabilities shows the quality of liquidity of current liabilities. The higher cash
liabilities ratio shows high liquidity of current obligations. We had seen a slight decrease after
2004 (0.87 to 0.50 in last four years) in the APMM Group’s financial statements which was
because of more investment for better expectation in future instead of decreasing its debts
(Appendix No.2)
The working capital decreased by 4 billion in 2005 but increased by 10 billion in 2006 than in
2007 working capital decreased by 8 billion. Although there is no consistency in working capital
but still this is in favorable and positive position. “The basic concept of working capital is
relatively simple. It is the excess of current assets over current liabilities”46. The creditors and
investors can overview the financial position of the company by ratio. Working capital also gives
investors an idea of the company's underlying operational efficiency47. Cash provided by
operation to average current liabilities is purely a cash flow related measure “This over come the
weakness of the static current ratio in that its numerator represents a flow over time” 48. The
ratio 0.70, 0.63, 0.39 and 0.60 from year 2004 to year 2007 was not bad. According to the
empirical study49 the ratio of operating cash flows from operations to average current liabilities
should be 0.40. This ratio (0.40) shows that company is going in a healthy position. Once in year
2006, the ratio of A.P Moller – Maersk had been seen 0.39 while in other years, it seems at very
good level. (Appendix No.2)
46
Financial Statement Analysis by Leopold A. Bernstein, 5th Edition, page 538
47
http://www.investopedia.com/terms/w/workingcapital.asp
48
Financial Statement Analysis by Leopold A. Bernstein, 5th Edition, page 566
49
C.Casey and N. Bartzcak, ―Cash Flow—It’s Not the Bottom Line, ―Harvard Business Review, July-August 1984,
pp. 61-66.

55
Assets Utilization Ratios
- 5,00
10,00 15,00 20,00 25,00 30,00 35,00 40,00 45,00
Sa
les to
ca
sh
an
d
eq
uiv
ale
nts
Sa
les to
rece
iva
ble
Sa
les to
inve
nto
rie
s
Sa
les to
wo
rkin
g
ca
pita
l
Sa
les to
fixe
d
asse
ts
sa
les to
tota
l a
sse
ts
Sa
les to
sh
ort
te
rm
lia
bilitie
s
2004--07
Years
In p
erc
en
tag
e6.3 Asset Utilization Analysis
Source: Annual Reports of A.P Moller – Maersk Group
Table 04: Assets Utilization Analysis
As shown in above table, APMM Group assets utilization had been seen in stable position over
the last four years. Sales to cash and equivalent ratio improved from year 2004 to year 2007. In
year 2004, it was 9.57 while in year 2007; it increased to 12.16 which show that the sales of
A.PMM Group Sales can generate more cash according to the circumstances. Sales to receivable
ratio also increased because of DKK 2 billion decreases in accounts receivable of APMM Group by
implementing the effective credit policies. In year 2004, this ratio was 9.60 while aggressive
increased had been seen in year 2007 which increased to 11.78. Sales to fixed assets and sales to
total assets indicate lower
performance in year 2007 as
compared to last three years.
Sales to fixed assets and
sales to total assets in year
2004 was 1.42 and 0.88
respectively while in year
2007, this ratio had been
1.19 and 0.85 respectively.
This is because of acquisition of three big companies that was an intensive investment in year

56
2005 in fixed asset but it has not been still utilized fully. APMM Group expects that these not
fully utilized assets will contribute in future for increasing the group activities. A sale to short
term liabilities was at good level in year 2006 because of increasing equity through shareholders
and not debts by APMM Group.
6.4 Capital structure and solvency ratios
The process of the evaluation of capital structure and solvency of any enterprises is not an easy
task. Without analysis of number of key elements, it is difficult for analyzing capital structure and
solvency of enterprises. APMM Group is a well diversified company and engages in different
segments. The analysis of capital structure is concerned with the types of capital funds used to
finance the enterprise50.
Table 05: Capital structure and solvency ratio
The debt to equity ratios have increased in the last three years for the four years selected
periods. The interesting thing we found that total debt to equity ratio was higher than the
industry average in last three years but total debt to total debt + equity was almost according to
industry average. The long term liabilities to equity ratio indicate that long term components of
APMM Group grew because of aggressive credit policies. It seems that company moving away
from conservative capital structure approach. Even in fixed assets, we used only total property,
plant and equipment assets but still remain above the industry average. In last year, the result of
50
Financial Statement Analysis by Leopold A. Bernstein, 5th Edition, page 597

57
current liabilities to total liabilities have been seen below the industry average, it means that
APMM Group emphasizes more on long term liabilities. Overall, APMM capital structure and
solvency ratios are outstanding which show the financial strength of the group. If we compare
these ratios to its industry and other standards, APMM Group has developed effectively in last
three years. Although company acquire three major companies in year 2005, but still strong
ratios of capital structure and solvency do not lose the significant protection of company’s
creditors. “Further, the company is still having ample debt capacity”51 and increased credit
rating. The capital structure and solvency ratio can be viewed through following graphical
presentation (Appendix No.3)
Graphical presentation of capital structure and solvency ratio:
Figure 13: Graphical presentation of capital structure and solvency ratio
51
Financial Statement Analysis by Leopold A. Bernstein, 5th Edition, page 829
Total debt to equity & total debt to toal debt+equity
ratios
-
0,20
0,40
0,60
0,80
1,00
1,20
1,40
1 2 3 4
Years
Rati
os
2004--07 Total debt
to equity
2004--07 Total debt
to total debt+equity
Long term liabilities to equtiy & total equity to total
debts
-
0,20
0,40
0,60
0,80
1,00
1,20
1,40
1 2 3 4
Years
Ra
tio
s
2004--07 Long Term
liabilities to equity
2004--07 Total
Equity to total debt
-
0,50
1,00
1,50
1 2 3 4
Ratios
Years
Fixed Assets to equity & current assets to total liabilities
2004--07
Fixed Assets to Equity
2004--07
Current Liabilities to
Total
Liabilities

58
6.5 Return on Investment
Mostly decision makers used return on investment approach. Return on investment is one of the
several approaches to evaluate the investment by comparing the magnitude and timing of
expected gain to the investment cost52.
By using this approach, the management of the organization can analyze how to improve return
on investment (ROI), such as by reducing cost, increasing gain or accelerating gains.
Source: http://www.solutionmatrix.com/return-on-investment.html
According to our research questions, for investor and creditors point of view, we conducted the
data of APMM Group in order to determine whether the group return generated by invested
capital is sufficient or not for future decision making.
a) Return on invested capital (ROIC)
b) Return on total assets (RTA)
c) Return on equity(ROE)
d) Weighted average capital(WACC)
(a) Return on invested capital (ROIC)
52
http://www.solutionmatrix.com/return-on-investment.html.

59
Four years data of Group’s from year 2004 to 2007 has been conducted in order to know how
management has allocated the capital into its different operations. The result of return on
investment capital (ROIC) is not effectively understandable without comparing it to weighted
average cost of capital (WACC). That’s why, we conducted both measure to evaluate whether
invested capital was used effectively or not and find out the true picture of the Group. We
analyze APMM Group by using following formula.
2004 2005 2006 2007
Return on Invested Capital (ROIC) 14.46% 6.23% 4.39% 4.82%
Source: Annual Report of A.P Moller – Maersk Group (Appendix No.4)
Figure 14: Return on invested capital
ROIC indicates that 14.46%, 6.23%, 4.39% and 4.82% of the return was generated from operation
using assets in year 2004, 2005, 2006 and 2007 respectively which was acquired using equity and
debt financing. As we already explained above that until we don’t calculate the weighted average
cost of capital (WACC) which shows the required rate of return we are not in position to
elaborate that whether the above percentage are unfavorable or favorable for decision making
purpose of different users including the management.
ROIC

60
(b) Return on total assets (RTA)
Return on total assets ratio is also calculated to measure the productivity of assets; we observe
that the return on total assets from year 2004 to 2007 of APMM Group was declining after year
2004 and in later years. The return on total assets reached to a minimum level of 6.82% in year
2006 as it was 16.81% in 2004. The reason was the huge amount of investment in fixed assets.
That’s why it reduced the return on total assets in short run but it might be positive for investors
in the long run whereby full utilization of assets might generate an effective and reasonable
return.
2004 2005 2006 2007
*Return on total assets (RTA) 16.81% 9.62% 6.82% 7.48%
**Return on Equity (ROE) 30.3% 17.8% 12.4% 13.2%
*Source: Annual Report of A.P Moller – Maersk Group (Appendix No.5) **Source: Annual Report of A.P Moller – Maersk Group 2007, page 2
Table 6: Return on total assets
(c) Return on Equity (ROE)
Return on equity is calculated as the profit for the year divided by the average equity53.Return on
equity (ROE) is important for analyzing profitability. The four years data of APMM Group has
been collected in order to know how much profit the group has earned in comparison to equity.
Return on equity at 30.3% exceeded in year 2004 which was above 10.5% of the industry average
(19.80%54) but in the later year 2004, the return on equity went below the industry average. In
year 2007, it was only 13.2% due to 33.96% reduction in net income from DKK 28,256 million
(2004) to DKK 18,658 million (2007)]. Low trend in equity in last three years shows that APMM
Group was not capable to generate cash internally. The lower return on equity discourages the
investors as well as different stakeholders.
53
Annual Report of A.P Moller – Maersk Group 2007, page 57
54
Financial Statement Analysis by Leopold A. Bernstein, 5th Edition, page 819

61
(d) Weighted average cost of capital (WACC)
Finance is just like blood which is necessary to operate its different operations. There are two
ways of financing, one is by debts and other is by equity. So assets of any businesses are financed
by both debts and equity. By using WACC, each category is proportionally weighted according to
cost. WACC is the average of the total costs of these sources of financing.55. WACC is expressed
as a percentage56. WACC indicates the overall required rate of return demanded by the equity
investors and creditors.
As ROIC tells us about the return that has been generated by taking funds from equity investors
and creditors, on the other hand WACC tells that what is the average required rate of return
demanded by equity investors and creditors. The Group’s ROIC is 4.82% greater than WACC
4.57%, which indicates that the Group’s operations are self – sustainable, as it has generated the
required rate of return for creditors and equity investors. Although the return of 4.82% is not a
good return but the future prospects of the company is prosperous.
55
http://www.investopedia.com/terms/w/wacc.asp
56
http://www.valuebasedmanagement.net/methods_wacc.html

62
6.6 Trend Analysis of Balance Sheet over four years
Trend analysis of balance sheet of four years from 2004 to 2007 of APMM Group has been
conducted in order to know the growth and compare it with previous performance. Our focus
was to analyze the trend of major items of the consolidated balance sheet of APMM Group such
as assets, liabilities, equities, accounts receivable, revenue and inventories. It had been seen in
assets that there has been increase in upward trend in total assets instead of both current and
fixed assets. In year 2006 and 2007, total assets increased only 10.13% and 4.41% respectively
while most significant increase had been seen in year 2005 when total assets increased by DKK
103,173 million (56.79%) to DKK 284,846 million as compare to year 2004. It was very interesting
for us when we analyze the components where current assets increased by DKK 12,095 million
(17.42%) to DKK 81,518 million while fixed assets increased by DKK 91,078 million (81.14%) to
DKK 221,032 as compare to year 2004. Further analysis shows that out of DKK 91,078 million,
DKK 27,799 million (2438.72%) was due to increase in intangible assets which was due to the
acquisition of two major shipping and one oil and gas company. Intangible assets increased due
to oil and concession rights but uncertainty feature exist because of the risk factor in future
earning regarding intangible assets. So according to our research questions it seems that this
happened due to management distortion which was not a positive sign for investors and
creditors for future decision making.(Appendix No.6)
The total liabilities of APMM Group in 2005 also increased by DKK 81,796 million, which was
103.58% to DKK 160,763 million while in the same period equity increased (21.65%) to DKK
20,750 million. In year 2006 and 2007, liabilities increase at normal rate which was 10.2% and
2.16% respectively (Appendix No.6). Here we found interesting relationship that total fixed
assets increased on the basis of liabilities (due to acquisition) but this relationship shows that it
might be risky for the current investor because he or she is more interested for short term
earning but it might be fruitful for future potential investor because assets acquired in the
current period by acquisitions will fully be utilized in the future which will defiantly boost up
future earnings.

63
We observed the trend in equity increased just like assets and liabilities in year 2005. Equity
increased by 20.81% and in subsequent year 2006 and 2007, increasing rate was 10.18% and
7.32% respectively. It had been observed that the acquisition of two shipping and one oil and gas
companies was mainly financed by liability instead of equity because we found that
comparatively liabilities increased more compared to equity. That’s why total liabilities DKK
160,763 million had been greater than equity DKK 124,083 million in year 2005. (Appendix No.6)
While doing trend analysis of balance sheet, we found another red flag by doing relationship
trend between revenue and trade receivable which is an important measure for earning quality.
It had been seen that the accounts receivable increased faster than the increase in revenue
which might be a generous extension in credit policies, incentives or poor collection policies.
Trend analysis of revenue and accounts receivables from year 2004-2007 indicates growing rate
of accounts receivable exceeding more than revenue rate from year 2004 to 2007 because of
poor credit policies but APMM Group in year 2006 has been effectively implementing their
extensive credit line policies. That’s why receivable increased at a decreasing rate as compared
to revenue in year 2006 while in year 2007 it had been seen that revenue increased only by
7.20% and accounts receivable decreased by 9.64% which indicates the earning will be more in
coming years.
Trend analysis of inventories from balance sheet and its relationship with revenue from the
income statement has been conducted in order to know the effect for earning quality.
Inventories are kept consistently very high from year 2004 to 2007 as compared to revenue. This
relationship also shows the mismanagement of APMM Group because a huge amount was
invested in inventories which may have affected group’s working capital and current ratio.
Abnormal increase in year 2005 (49.10%) and 2006(34.26%) had been seen which might lose the
trust of creditors as well as other users.

64
7. Cash Flow Analysis
The investor who are interested in equity are concerned with profitability so they focus primarily
on income statement and balance sheet rather than cash flow but we think they should not
ignore the cash flow statement to elaborate the residual earning growth and abnormal growth in
income statement and balance sheet, accrual accounting number are used for distortion. A
difference between accrual accounting earning and operating cash flow is a “red flag” that could
indicate manipulation, so the analysts must scrutinize the cash flows as well as accrual
accounting earnings57.
Our main purpose of analyzing cash flow is in order to have better insight of APMM Group (Trend
Analysis) operating, financing and investing activities. The second purpose is the analysis of major
source of cash and major uses of cash of APMM Group has been conducted. Finally we will
57
Financial Statement Analysis and security valuation, 2nd
edition, by Stephen H. Penman. Page 322
Analysis of Cash flow from
Operating activities
Investing activities
Financing activities
Major sources and uses of Cash
From year 2004 to 2007
Relationship analysis
Between net income & operating cash flow
Chapter overview
CHAPTER NO.7

65
analyze the relationship between net income and operating cash flow to find out the
manipulation done by management.
The cash flow of APMM Group gives the insight of cash situation during the year 2004-2007. For
investors and creditors, it is very important to know about the liquidity and flexibility situation by
using cash flow analysis because in cash flow, there are minor chances of manipulation as
compare to income statement and balance sheet where accrual number are used for
manipulation. Indirect method for cash flow statement has been chosen because “the indirect
method calculates cash from operations by adding back accrual (non cash) components of net
income58. The net income is always taken as starting point in indirect method. Now one by one,
we discussed cash from operating activities, cash from investing activities and cash from
financing activities.
7.1 Analysis of Cash from operating, investing & financing activities
Investor and creditors are more interested on cash from operating activities because cash from
operating is related to business activities and it is the result that how much cash is generated
from its core operation rather than all. It had been seen that cash flow from operating activities
is positive during the period 2004 to 2007. This is due to huge amount of depreciation,
amortization and impairment losses. These expenses increased by 39.17%, and 35.42% in year
2004 and 2006 respectively. The cash flow from operating activities slightly increased every year
from year 2004 to 2007 except in year 2006 when it decreased by 28.90% (From 29207 million to
DKK 33329 million) due to increase in financial expenses, taxes. Cash flow from operating
activities amounted to DKK 33329 million, particularly due to growth, particular in the container
business; there has been an increasing tying up of money in working capital59 (inventories and
debtors). While in year 2007, we observed that in spite of negative trend in last year, cash flow
from operating activities is still positive and increased by 68.03% as compared to year 2005 due
to positive change in working capital (Appendix No.7). We see that in year 2007, change in
58
Financial Statement Analysis and security valuation, 2nd
edition, by Stephen H. Penman. Page 327
59
Annual Report A.P Moller – Maersk Group 2005, Page 31

66
working capital increased due to the decline of receivables, but we think this relationship show
the red flag because it is not really a sustainable source of cash and in following year, the APMM
Group cash position will change negatively. The investors and creditors in this situation not
aggressively take any decision because it is important that APMM Group generate positive cash
flow from its operating activities are really through sustainable source of cash.
Further we analyze that cash generated by investing activities represent an interesting picture. It
had been seen that cash flow from investing activities from year 2004 to 2007 was negative. The
worst year was 2005 when cash flow from investing activities negatively reached to DKK -53619
million from DKK -26459 million which was 102.65 % more as compared to previous year
(Appendix No.7) When we analyzed deeply, we found that negative cash flow does not mean
that the APMM Group activities are unfavorable because in year 2005, cash flow negatively
increased due to the adoption of IFRS, movements in marketable securities included in
investment60 and afterwards the APMM Group used much investment for expanding business
and restructuring plan. In year 2004, the acquisition of subsidiaries and activities was only DKK -
404 million while in year 2005; it was DKK -33131 million (8100.74%). The change in capital
expenditure also had been seen from DKK-18388 to DKK-61760 million (235.87%). We can
conclude that for short term, it seems that APMM negative cash flow investment more related to
reduce in revenue and a negative return on equity, Due to above said reasons; creditors and
investors might interoperate it negatively which is an important problem for A.P Moller – Maersk
Group.
We also conduct the analysis of cash flow generated from financing activities. The cash flow in
year 2004 was DKK -295 million while in year 2005, it was DKK 22250 million. The cash flow had
been seen positive each year except in year 2004. This positive trend was due to proceed from
loan from DKK 11993 million to DKK 35486 million (195.89%). This shows positive signal for
investor and creditors. Although, after that in year 2006 and 2007, the cash flow lit bit decrease
but it’s not a big problem.
60
Annual Report A.P Moller – Maersk Group 2005, Page 31

67
7.2 Major Sources & Uses of Cash (2004-2007)
In the below charts, we analyze the major sources and its uses of cash during the year 2004 to
2007. It had been seen that cash flow from operations of the APMM Group was steady and it had
growing sources of cash. The cash flow from operations slightly increased during the year 2004 to
2007. It has been observed that during the four years the major cash flow source was cash flow
from operations DKK 126,050 million (38.21%), the second major source was proceeds from
debts DKK 96.843 million (29.35%), the third source was the sale of marketable securities DKK
76,773 million (23.27%), than disposal of non-cash assets, Gain disposal from subsidiaries and
activities and capital increases with DKK 24,592 million (7.45%), DKK 4,538 million (1.38%) and
DKK 1,107 million (0.34%) respectively. In all four years, payment for dividend and investment
needs was fulfilled by cash flow from operating activities (Appendix No.8)
Major uses of cash during the year 2004 to 2007 were investment in non-current assets DKK
148,129 million (46.44%), purchase of marketable securities DKK 71,078 million (22.29%),
repayment of loans including short and long term DKK 47,544 million, acquisitions of subsidiaries
and activities DKK 37,211 million, dividend distributed DKK 7,613 million and acquisitions and
other investment in associated companies DKK 7,361 million out of total cash during the period
from years 2004 to 2007.(Appendix No.8)
As we can see that marketable securities have an important impact on both side (Sources and
Uses). A very small decrease had been seen in marketable securities.
Figure 15: Major sources and uses of cash
It had been seen that cash collected from different sources has been allocated for the investment
68
in acquisition of two shipping and one oil and gas company which was DKK 37 billion and also
investment in non-current assets which was DKK 168 billion during the year 2005. This huge
amount arranged mainly from net cash flow from operation and proceed from loans were 39%
and 30% of total respectively. A 15% of cash flows used for repayment of loans. (Appendix No.8)
From the investor and creditor point of view, they are not sure about whether huge investment
successfully integrated and manageable or not. If management failed to implement it than might
be earning will be affected negatively due to huge amount of depreciation and other related
expenses because a huge amount invested for the purchase and acquisition of asset and on the
other hand in later years, debts will be increased which alternatively negatively effect the
earning and decrease the safety margin. So the situation will not be favorable for equity investor
as well as creditors because mostly they concern their income. It seems that emphasis of the
management of the group was to achieve more capacity, new opportunity in different segments
especially container & shipping and oil & gas segment through acquisitions in all over the world.
7.3 Relationship between net income and operating cash flow
Income statement is on based on accrual accounting while cash flow statement based on actual
cash transaction so accounting choices does affect cash flow like income statement. The analysis
of net income and cash flow from operating activities has been conducted from year 2004 to
2007 in order to know the manipulation. Profit which is derived from income statement involves
accrual that’s why we have compared it with operating cash flow (cash based inflow). The
manipulation or distortion levels used in driving net income in each year are shown in below
section (diagram).

69
Net Income Vs Cash flow from operating
From year 2004 to 2007
Dkk
in
Billion
Years
Source: Annual Report A.P Moller- Maersk Group 2007, page 2
Figure 16: Net income Vs cash flow from operating
One can see the net operating cash flow generated from activities on upper curve and net profit
on derived from income statement lower curve. The green shaded area indicates about the use
of accruals and conservative accounting conventions which become the cause of fluctuation in
profit. For distortion, management of the APMM Group used different tool such as depreciation,
impairment losses and amortization expenses was used to understate the profit. We can say this
because in year 2004 depreciation expenses was lowered by 62% which reduced the gap
between net income (DKK 28.26 billion) and cash flow from operations (DKK 29.21 billion), while
in next year’s, the depreciation expenses charged by changing their policies on the basis of
judgment which increased the gap again in 2005.
After the analysis of net profit and cash flow from operations of APMM Group, we found that for
the development of financial statement, creditor oriented strategy has been used in order to give
maximum attraction and protection to creditors.

70

71
8. Final Conclusion This chapter draws the conclusion based on research questions to obtain the purpose of our
chosen research topic. Furthermore, we will give the overall answer of our research questions and
finding of our analysis presented in previous chapters. On the basis of this conclusion, suggestions
for future research presented.
APMM Group is a well known and highly reputable position in shipping industry. A.P Moller-
Maersk Group’s financial statements have been analyzed by applying different approaches such
as Square Models approach, Ratio and Cash Flow analysis. The exact interpretation of the
financial statements of such a huge company is very challenging and it becomes even more
difficult when the company is one of its’ kind in its industry and have a commanding position in
regards to following the accounting rules and regulations.
Performance analysis of APMM Group showed that revenue increased substantially during the
period from year 2004 to 2007 but net profit in the same period does not show substantial
increase. In year 2005, APMM reported 62% increase in net profit but result shows that increase
was due to earning management rather than operating efficiency. The analysis of APMM Group
has revealed poor disclosure about accounting estimates and policies. It is observed that APMM
Group is using conservatism accounting for the purpose of deriving income which indicates the
efficient management operations. The strength of the APMM Group is consistently increased in
sales by acquiring two big companies. The three major business segments, Container and
shipping, Tanker offshore & Oil and Gas significantly contributed to the revenue as a whole.
Moreover, major resources are consumed by container and shipping but these provide lower
return, whereas Oil and Gas generated higher return by consuming fewer resources. In addition,
Group invested huge amount in fixed assets which could provide future earning potential. It is
observed in the financial statements that the earning quality is poor. Group implemented lose
credit policies and recognized future revenue which ultimately accelerated overall profitability.
Depreciation, amortization and impairment losses are taking huge proportion of revenue which
reduces its overall profitability.

72
The cash flow of the APMM Group is fairly good from the operations. Group invested huge
amount of borrowed funds to expand its business operations rather than running its day to day
business operations, which are good signs for investors and creditors. But behind the positive
cash flow, there are some distortions made by the management in using different tools for
reporting depreciation, impairment losses and amortization expenses that were used to
understate the profit. It is observed that in 2004 depreciation expenses was lowered by 62%
which reduced the gap between net income and cash flow from operation while in year 2005,
management changed their policies regarding depreciation on the basis of their own judgment
and not giving any disclosure in the annual report which increased the gap again. Net operating
cash flow along with net income shows consistent high cash flow, which clearly indicate that
APMM Group is using conservative accounting policies for creditors and investors. So it can said
that creditor oriented strategy is used in the preparation of financial statement.
The analysis of the balance sheet between the periods of 2004-2007 shows that more than 70%
of the growth of assets is financed by liabilities. Which indicate that safety margin is decreased in
the context of creditors and investors. The results of different ratios are striking. Liquidity and
solvency ratios indicate significant improvement of creditworthiness of the company. Assets
Utilization ratios show slight improvement because of decreasing accounts receivable by DKK 2
billion in year 2007 and also because of adoption of aggressive credit policies. ROIC ratio shows
that different resources are allocated into its operation efficiently. WACC shows that rate of
return demanded by the creditors and investors are acceptable. But however, the result of
current ratio was not positive.
The overall analysis of APMM Group shows sufficient positive sign; however, there are some
factors that will change the shape of the future for the company such as the current financial
crisis development and the management’s ability to reduce the cost structure.
73
8.1 Suggestions for Future Researcher
In the present circumstance the interest of investors and creditors has increased much because
of safety margin. To build the confidence of different users, much needs to be done in order to
increase the accountability of an organization. Our work was limited by the research question
and hence elaborate observation was not possible. We used secondary data for analyzing the
company’s financial position. We analyzed the financial statements by using square model, cash
flow, ratio analysis and balance sheet, but couldn’t do the analysis of the share price of the
company in the market. We would like to give an advice to new researchers of APMM Group that
they should use primary data (Interview based study) along with secondary data in order to know
the effect of management distortion especially on non-current depreciation, amortization and
impairment expense items. As far as APMM Group is concerned new researcher should conduct
The effects of merger and acquisition after two years.
Analysis of APMM Group with its competitors.
The significant relationship between research and development cost and share price.
What are the opportunities of APMM Group in Asian countries in next decade?
We think, our research will provide the basis for appropriate approach that will make further
research more useful.

74
References:
Books:
Leopold A. Bernstein, Financial Statement Analysis: theory, application, and interpretation-5th ed, R.R. Donnelley & Sons Company (,=America). Leonard C. Soffer and Robin J. Soffer (2003), Financial Statement Analysis: A valuation approach, upper saddle river, NU: Prentice Hall. Stephen H. Penman (2003), Financial Statement Analysis and security valuation, Boston, Mass: McGraw-Hill/Irwin. J.M Samuels, R.E. Brayshaw and J.M Craner(1995), Financial Statement analysis in Europe, London: Chapman & Hall. Stickney, clyde P(1996), Financial reporting and statement analysis: a strategic perspective, Forth Worth, Tex: Dryden. Berman, Karen (2006), Financial Intelligence: a manager’s guides to knowing what the numbers really mean, Boston: Harvard Business School. Yin. Robert K. (2004). The Case Study Anthology. Sage publications, cop. Thousand Oaks, CA Alexander David, Britton Anne, Jorissen Ann (2007) International Financial Reporting and Analysis. London: Thomson Learning. Saunders, Mark, Thornhill, Adrian & Lewis, Philp (2003) Research Method for Business Students. London: Prentice Hall. Fay, John. (1997). Sources of Secondary Data. In Brannick, Teresa and K.Roche William (eds.), Business research methods, strategies, techniquesand sources (pp. 215, 220). Ireland: Oak Tree Press. Ibert, Jerome, Baumard, Philippe, Donada, Carole, and Xuereb, Jean-Marc.(2001). Data collection and managing the data source. In Thietart,Raymond-Alain, et al. (eds.), Doing management research, acomprehensive guide (p. 172). London: SAGE Publications Isobel D, Robin L. (1999), International marketing strategy.
Thesis: Larsson, Hiba & Falkemark, Christian (2007), B.M.W, A company analysis (Master thesis), Graduate Business School, Gothenburg University, Sweden. Consolata Jepkemei Kandie and Aloysius Nnaji(2005), Corporate accounting and resources dependency theory: study on the impact of financial restructuring, shareholder activism and the associate corporate response in the oil industry (Master thesis), Graduate Business School, Gothenburg University, Sweden.

75
Ruchi Dube (2006), Roles of financial experts and information technology in financial fraud deterrence (Master thesis), Graduate Business School, Gothenburg University, Sweden. Do, Linh Thuy & Intal, Tiina (2003), Financial Statement Fraud (Master Thesis), Graduate Business School, Gothenburg University, Sweden. Khwaja Arafat Abdullah, Muhammad Shabbir & Shah Syed Abdul Haleem (2008), Accounting Project on A.P Moller-Maresk, Graduate Business School, Gothenburg University, Sweden.
Internet http://shareholders.maersk.com/uk/FinancialReports/2007/AnnualReport/InteractiveReport2007.htm http://about.maersk.com/en/Pages/AboutHomeNew.aspx http://www.iasplus.com/dttpubs/pocket2008.pdf
http://news.morningstar.com/classroom2/course.asp?docId=3072&page=2&CN=COM
http://news.morningstar.com/classroom2/course.asp?docId=3072&page=3&CN=COM http://www.investopedia.com/terms/c/cash-asset-ratio.asp
http://www.investopedia.com/terms/w/workingcapital.asp
http://www.investopedia.com/terms/w/wacc.asp
http://www.solutionmatrix.com/return-on-investment.html
http://www.valuebasedmanagement.net/methods_wacc.html

76
Appendix No.1
Income Statement & Balance Sheet for Square Model
Amount in DKK million
CALCULATION OF REVENUE
Description 2004 2005 2006 2007
Revenue 159,544 208,702 260,134 278,872
Other operating income 1,194 1,204 1,896 1,588
Gain on sales of ships, rigs etc. 1,482 1,676 4,227 6,062
Associated companies-Share of profit after tax 361 3,037 2,881 3,084
Financial Income 2,842 1,732 2,952 2,309
Value adjustment of financial assets 5,013
Less/Add: Profit/Loss for the year, discontinued operation 2,026 404 131 533
Net Revenue 172,462 216,755 272,221 291,382
Net revenue in billion 172.46 216.76 272.22 291.38
CALCULATION OF EXPENSES & PROFIT
External costs 100,103 135,898 179,120 183,886
Other operating cost - - 731 1,404
Staff costs 20,068 24,037 30,987 30,328
Depreciation, amortization and impairment losses 12,758 17,755 19,357 26,213
Integration cost on acquisition - 1,783 734 -
Financial expenses 2,097 3,853 5,171 6,356
Income tax expense 9,180 13,223 19,935 24,537
Total Expenses 144,206 196,549 256,035 272,724
Profit for the year 28,256 20,206 16,186 18,658
Profit for the year in billion 2.83 2.02 1.62 1.87
Balance Sheet for Square Model
Description 2004 2005 2006 2007
Current Assets 69.423 81.518 92.663 94.015
Fixed Assets 112.250 203.328 221.032 233.504
Total Assets 181.673 284.846 313.695 327.519
Total Assets in billion 182 285 314 328
Liabilities
Total non-current liabilities 33.999 100.183 114.672 109.370
Total current liabilities 44.968 60.580 62.312 71.434
Total Liabilities 78.967 160.763 176.984 180.804
Total liabilities in billion 79 161 177 181
Total Equity 102.706 124.083 136.711 146.715
Total Equity & Liabilities 181.673 284.846 313.695 327.519
Total Equity & Liabilities in billion 182 285 314 328
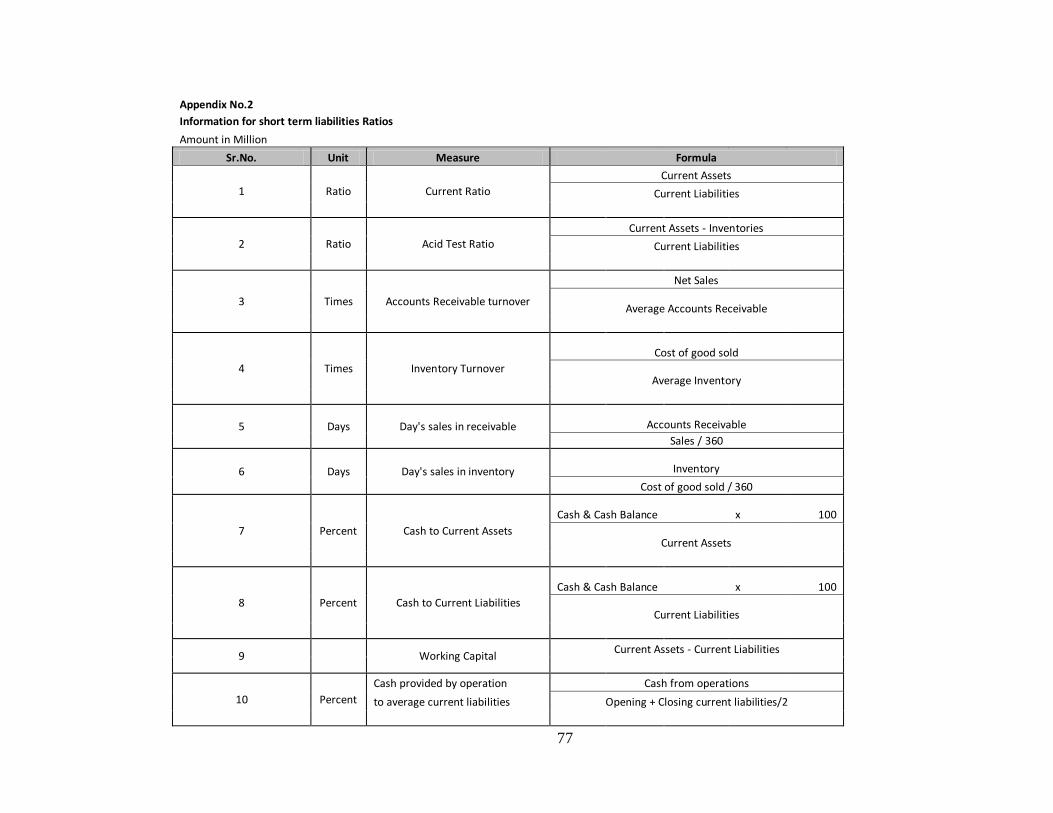
77
Appendix No.2
Information for short term liabilities Ratios
Amount in Million
Sr.No. Unit Measure Formula
1 Ratio Current Ratio
Current Assets
Current Liabilities
2 Ratio Acid Test Ratio
Current Assets - Inventories
Current Liabilities
3 Times Accounts Receivable turnover
Net Sales
Average Accounts Receivable
4 Times Inventory Turnover
Cost of good sold
Average Inventory
5 Days Day's sales in receivable Accounts Receivable
Sales / 360
6 Days Day's sales in inventory Inventory
Cost of good sold / 360
7 Percent Cash to Current Assets
Cash & Cash Balance x 100
Current Assets
8 Percent Cash to Current Liabilities
Cash & Cash Balance x 100
Current Liabilities
9 Working Capital Current Assets - Current Liabilities
10 Percent
Cash provided by operation Cash from operations
to average current liabilities Opening + Closing current liabilities/2
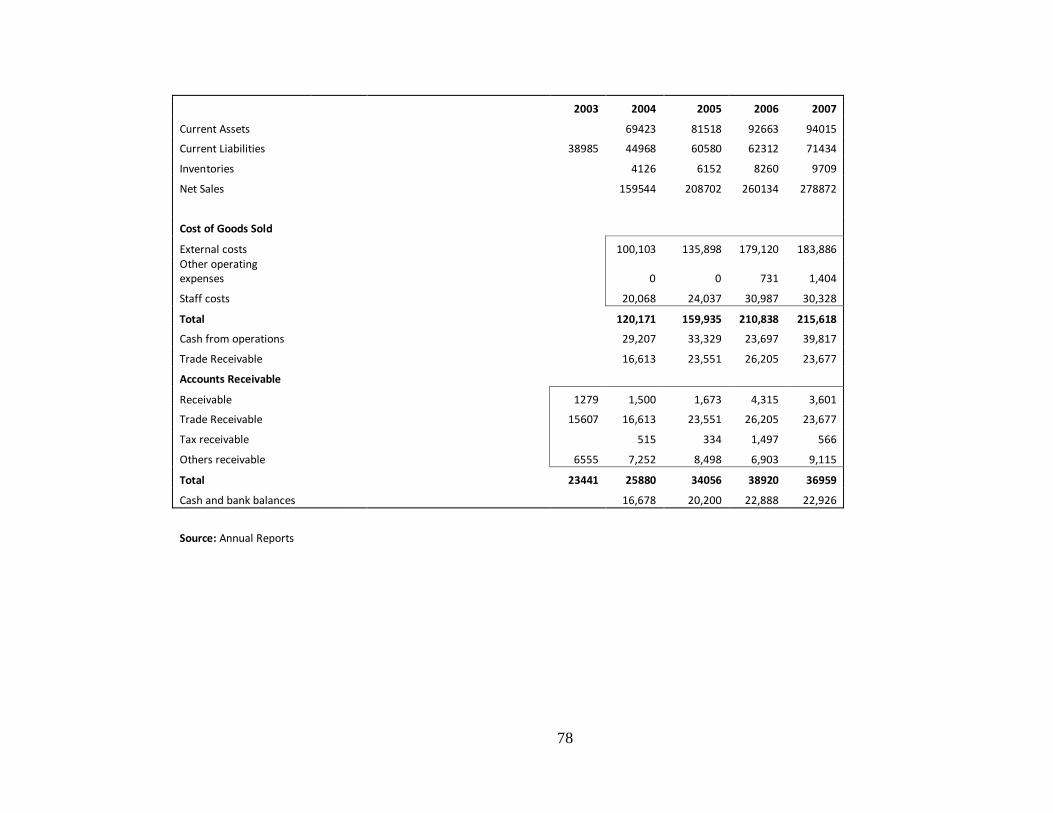
78
2003 2004 2005 2006 2007
Current Assets 69423 81518 92663 94015
Current Liabilities 38985 44968 60580 62312 71434
Inventories 4126 6152 8260 9709
Net Sales 159544 208702 260134 278872
Cost of Goods Sold
External costs 100,103 135,898 179,120 183,886 Other operating expenses 0 0 731 1,404
Staff costs 20,068 24,037 30,987 30,328
Total 120,171 159,935 210,838 215,618
Cash from operations 29,207 33,329 23,697 39,817
Trade Receivable 16,613 23,551 26,205 23,677
Accounts Receivable
Receivable 1279 1,500 1,673 4,315 3,601
Trade Receivable 15607 16,613 23,551 26,205 23,677
Tax receivable 515 334 1,497 566
Others receivable 6555 7,252 8,498 6,903 9,115
Total 23441 25880 34056 38920 36959
Cash and bank balances 16,678 20,200 22,888 22,926
Source: Annual Reports

79
Appendix No.3
Information for Capital Structure and Solvency Ratios (Amount in DKK Million)
Sr.No. Measure Formula
1 Total Debt to equity Total liabilities
Equity capital
2 Total debt to total debt + equity
Total liabilities
Total liabilities and equity
3 Long term liabilities to equity
Long term liabilities
Equity capital
4 Total equity to total liabilities
Equity capital
Total liabilities
5 Fixed assets to equity Total property, plant and equipment
Equity capital
6 Current liabilities to total liabilities Current Liabilities
Total liabilities
2004 2005 2006 2007
Total liabilities 78967 160763 176984 180804 Current Liabilities 44968 60580 62312 71434
Long term liabilities 33999 100183 114672 109370 Total liabilities and equity 181673 284846 313695 327519 Equity Capital
Equity attributed to the A.P Moller - Maresk Group 102216 123,406 129,044 138,198
Minority interests 490 677 7,667 8,517
Equity Capital 102706 124083 136711 146715 Total property, plant and equipment 83393 149,458 167,308 183,962

80
Appendix No.4
A.P Moller- Maersk Group Four years analysis (2004 to 2007)
Return on Invested capital (ROIC)
Amount in DKK Million
Description Years
2004 2005 2006 2007
Net Income 28256 20206 16186 18658
Dividend 1978 2418 2418 2857
Total Capital 181673 285548 313695 327519
Return on Invested Capital 14.46% 6.23% 4.39% 4.82%
Source: Annual Report A.P Moller - Maresk Group 2005, 2006 & 2007
Formula
ROIC

81
Appendix No.5 A.P Moller- Maersk Group
Four years analysis (2004 to 2007)
Return on total assets
Amount in Dkk Million
Description
Years
2003 2004 2005 2006 2007
Net Income 28256 20206 16186 18658
Interest Expenses 1947 2818 4802 5977
Minority interest 107 116 629 829
Total Assets 173034 181673 284846 313695 327519
Average total assets 177353.5 233260 299271 320607
Return on Invested Capital 16.81% 9.62% 6.82% 7.48%
Source: Annual Report A.P Moller - Maresk Group 2005, 2006 & 2007
Formula
Net Income Interest expenses(1-tax rate) +Minority interest
Average total assets
Calculation of Return on total assets (RTA)
Year 2007 Year 2006 Year 2005 Year 2004
18658+5977(1-0.25)+829 16186+4802(1-0.25)+629 20206+2818(1-0.25)+116 28256+1947(1-0.25)+107
320607 299271 233260 177353.5
18658+4482.75+829 16186+3601.50+629 20206+2113.5+116 28256+1460.25+107
320607 299271 233260 177353.5
7.48% 6.82% 9.62% 16.81%
Return on total Assets
(RTA)

82
APPENDIX NO.6 .Trend Analysis of Balance Sheet (For the period of 2004-07)
Balance Sheet (Amount in Million (DKK) 2004-05 2005-06 2006-07
Assets 2,004 2,005 2,006 2,007
Absolute
Change Change
Absolute
Change Change
Absolute
Change Change
Intangible assets 1,095 27,799 21,883 17,376 26,704 2438.72% -5,916 -21.28% -4,507 -20.60%
Ships, rigs, containers, etc. 53,283 96,229 95,286 102,778 42,946 80.60% -943 -0.98% 7,492 7.86%
Production facilities and equipment, etc 12,928 22,378 25,905 27,167 9,450 73.10% 3,527 15.76% 1,262 4.87%
Land and buildings 6,652 9,058 16,612 19,401 2,406 36.17% 7,554 83.40% 2,789 16.79%
Construction work in progress and payment on account for
property, plant and equipment 10,530 21,793 29,505 34,616 11,263 106.96% 7,712 35.39% 5,111 17.32%
Total property, plant and equipment 83,393 149,458 167,308 183,962 66,065 79.22% 17,850 11.94% 16,654 9.95%
Investment in associated companies 5,446 21,779 21,783 23,544 16,333 299.91% 4 0.02% 1,761 8.08%
Other investments 19,889 1,310 1,683 891 -18,579 -93.41% 373 28.47% -792 -47.06%
Receivables 1,500 1,673 4,315 3,601 173 11.53% 2,642 157.92% -714 -16.55%
Total investments 26,835 24,762 27,781 28,036 -2,073 -7.72% 3,019 12.19% 255 0.92%
Deferred tax asset 927 1,309 4,060 4,130 382 41.21% 2,751 210.16% 70 1.72%
Total non-current assets 112,250 203,328 221,032 233,504 91,078 81.14% 17,704 8.71% 12,472 5.64%
Inventories 4,126 6,152 8,260 9,709 2,026 49.10% 2,108 34.27% 1,449 17.54%
Trade receivables 16,613 23,551 26205 23,677 6,938 41.76% 2,654 11.27% -2,528 -9.65%
Tax receivables 515 334 1,497 566 -181 -35.15% 1,163 348.20% -931 -62.19%
Value of hedges 1,853 3,387 0 0.00% 1,853 0.00% 1,534 82.78%
Deffered Tax assets 0 0 0 0 0 0.00% 0 0.00% 0 0.00%
Other receivables 7,252 8,498 6,903 9,115 1,246 17.18% -1,595 -18.77% 2,212 32.04%
Prepayments 1,509 2,589 2,407 2,591 1,080 71.57% -182 -7.03% 184 7.64%
Receivables 25,889 34,972 38,865 39,336 9,083 35.08% 3,893 11.13% 471 1.21%
Securities 22630 14906 20,950 12,686 -7,724 -34.13% 6,044 40.55% -8,264 -39.45%
Cash and bank balances 16778 20200 22,888 22,926 3,422 20.40% 2,688 13.31% 38 0.17%
Assets held for sale 0 5288 1,700 9,358 5,288 0.00% -3,588 -67.85% 7,658 450.47%
Total current assets 69,423 81,518 92,663 94,015 12,095 17.42% 11,145 13.67% 1,352 1.46%
TOTAL ASSETS 181,673 284,846 313,695 327,519 103,173 56.79% 28,849 10.13% 13,824 4.41%

83
2004-05 2005-06 2006-07
Equity and liabilities 2,004 2,005 2,006 2,007
Absolute
Change Change
Absolute
Change Change
Absolute
Change Change
Share capital 4,396 4,396 4,396 4,396 0 0.00% 0 0.00% 0 0.00%
Retained earnings 95,842 116,592 122,230 130,945 20,750 21.65% 5,638 4.84% 8,715 7.13%
Dividend for distribution 1,978 2,418 2,418 2,857 440 22.24% 0 0.00% 439 18.16%
Equity attributable to A.P. Møller - Mærsk A/S 102,216 123,406 129,044 138,198 21,190 20.73% 5,638 4.57% 9,154 7.09%
Minority interests 490 677 7,667 8,517 187 38.16% 6,990 1032.50% 850 11.09%
Total equity 102,706 124,083 136,711 146,715 21,377 20.81% 12,628 10.18% 10,004 7.32%
Pensions and similar obligations 927 3,508 3,230 1,848 2,581 278.43% -278 -7.92% -1,382 -42.79%
Provisions 4,416 8,360 9,214 11,547 3,944 89.31% 854 10.22% 2,333 25.32%
Deferred tax liability 1,162 10,945 12,583 8,747 9,783 841.91% 1,638 14.97% -3,836 -30.49%
Bank and other credit institutions, etc. 27,494 77,370 89,645 87,228 49,876 181.41% 12,275 15.87% -2,417 -2.70%
Total non-current liabilities 33,999 100,183 114,672 109,370 66,184 194.66% 14,489 14.46% -5,302 -4.62%
Employee benefits 70 46 -24 -34.29% -46 -100.00% 0 0.00%
Provisions 654 1,953 1,294 662 1,299 198.62% -659 -33.74% -632 -48.84%
other provision 0 0.00% 0 0.00% 0 0.00%
Short Term portion of long term debts 0 0.00% 0 0.00% 0 0.00%
Bank and other credit institutions, etc. 14,130 14,201 14,885 17,302 71 0.50% 684 4.82% 2,417 16.24%
Trade payables 19,935 27,161 28,674 31,531 7,226 36.25% 1,513 5.57% 2,857 9.96%
Corporation tax, etc. 1,744 2,993 3,966 4,233 1,249 71.62% 973 32.51% 267 6.73%
Value of hedges, etc. 1,614 4,358 0 0.00% 1,614 0.00% 2,744 170.01%
Other payables 6,869 9,363 8,214 7,343 2,494 36.31% -1,149 -12.27% -871 -10.60%
Deferred income 1,566 2,188 1,462 1,229 622 39.72% -726 -33.18% -233 -15.94%
Prepayments received 674 2,130 0 0.00% 674 0.00% 1,456 216.02%
Liabilities associated with assets held for sale 2,675 1,529 2,646 2,675 0.00% -1,146 -42.84% 1,117 73.05%
Total current liabilities 44,968 60,580 62,312 71,434 15,612 34.72% 1,732 2.86% 9,122 14.64%
Total liabilities 78,967 160,763 176,984 180,804 81,796 103.58% 16,221 10.09% 3,820 2.16%
TOTAL EQUITY AND LIABILITIES 181,673 284,846 313,695 327,519 103,173 56.79% 28,849 10.13% 13,824 4.41%

84
Appendix No.7.Trend Analysis of Cash Flow (For the year period of
2004-07)
Amount in Million (DKK) 2004-05 2005-06 2006-07
2004 2005 2006 2007
Absolute Change
Change Absolute Change
Change Absolute Change
Change
Profit before financial items 29,652 35,146 38,209 47,775 5,494 18.53% 3,063 8.72% 9,566 25.04%
Depreciation, amortisation and impairment losses 12,758 17,755 19,357 26,213 4,997 39.17% 1,602 9.02% 6,856 35.42%
Other non-cash items 301 2411 3,180 909 2,110 701.00% 769 31.90% -2,271 -71.42%
Paid integration costs -1,742 -163 0 0.00% -1,742 0.00% 1,579 -90.64%
Gains on sale of ships, rigs -1482 -1676 -4,227 -6,062 -194 13.09% -2,551 152.21% -1,835 43.41%
Associated companies – share of profit after tax -361 -3037 -2,881 -3,084 -2,676 741.27% 156 -5.14% -203 7.05%
Change in working capital -313 -3806 -5,331 2,570 -3,493 1115.97% -1,525 40.07% 7,901 -148.21%
Financial income, received 1955 3734 2,691 3,947 1,779 91.00% -1,043 -27.93% 1,256 46.67%
Financial expenses, paid -2626 -3086 -5,023 -6,082 -460 17.52% -1,937 62.77% -1,059 21.08%
Taxes paid -10541 -14362
-
20,536
-
26,206 -3,821 36.25% -6,174 42.99% -5,670 27.61%
Discontinued operations -136 250 386 -283.82% -250 -100.00% 0 0.00%
Cash flow from operating activities 29,207 33,329 23,697 39,817 4,122 14.11% -9,632 -28.90% 16,120 68.03%
Purchase of non-current assets -22451 -29361
-
40,938
-
55,379 -6,910 30.78% -11,577 39.43% -14,441 35.28%
Disposal of non-current assets 3243 3327 8,837 9,185 84 2.59% 5,510 165.61% 348 3.94%
Acquisition of subsidiaries and activities -404 -33131 -209 -3,467 -32,727 8100.74% 32,922 -99.37% -3,258 1558.85%
Disposal of subsidiaries and activities 3379 -51 819 391 -3,430 -101.51% 870 -1705.88% -428 -52.26%
Acquisition/disposal of investments in associated companies, etc., net -1095 -2583 -3,446 -267 -1,488 135.89% -863 33.41% 3,179 -92.25%
Other investments and receivables, net -1007 -113 616 534 894 -88.78% 729 -645.13% -82 -13.31%
Discontinued operations -53 152 205 -386.79% -152 -100.00% 0 0.00%
Cash flow used for capital expenditure -18388 -61760
-
34,321
-
49,003 -43,372 235.87% 27,439 -44.43% -14,682 42.78%
Purchase of marketable securities -23108 -19206
-
18,767 -9,997 3,902 -16.89% 439 -2.29% 8,770 -46.73%
Sale of marketable securities 15037 27347 19,862 14,527 12,310 81.86% -7,485 -27.37% -5,335 -26.86%
Cash flow used for investing activities
-
26,459
-
53,619
-
33,226
-
44,473 -27,160 102.65% 20,393 -38.03% -11,247 33.85%
Repayment of loans -10306 -10849 -8,851
-
17,358 -543 5.27% 1,998 -18.42% -8,507 96.11%
Proceeds from loans, etc. 11993 35486 23,180 26,184 23,493 195.89% -12,306 -34.68% 3,004 12.96%

85
2004-05
2005-06
2006-07
2004 2005 2006 2007
Absolute
Change Change
Absolute
Change Change
Absolute
Change Change
Dividends distributed -1235 -1852 -2,263 -2,263 -617 49.96% -411 22.19% 0 0.00%
Dividends distributed to minority interests -162 -81 -166 -210 81 -50.00% -85 104.94% -44 26.51%
cash merger acquisitions 0 0.00% 0 0.00% 0 0.00%
Others 0 0.00% 0 0.00% 0 0.00%
Capital increases from minority interests, etc. 38 67 538 464 29 76.32% 471 702.99% -74 -13.75%
Discontinued operations -623 -521 102 -16.37% 521 -100.00% 0 0.00%
Cash flow from financing activities -295 22250 12,438 6,817 22,545 -7642.37% -9,812 -44.10% -5,621 -45.19%
Net cash flow from continuing operations 2453 1960 2,909 2,161 -493 -20.10% 949 48.42% -748 -25.71%
Discontinued operations 0 0.00% 0 0.00% 0 0.00%
Cash flow from operating activities 523 -109 0 0.00% 523 0.00% -632 -120.84%
Cash flow used for investing activities 1,430 120 0 0.00% 1,430 0.00% -1,310 -91.61%
Cash flow from financing activities -1,111 -354 0 0.00% -1,111 0.00% 757 -68.14%
Net cash flow for the year from discontinued operations 842 -343 0 0.00% 842 0.00% -1,185 -140.74%
Net cash flow for the year 3,751 1,818 0 0.00% 3,751 0.00% -1,933 -51.53%
Cash and bank balance at 1st January 15548 16778 19,750 23,031 1,230 7.91% 2,972 17.71% 3,281 16.61%
Effect of companies changed to subsidiaries, etc. 1,193 0 0.00% 1,193 0.00% -1,193 -100.00%
Exchange rate adjustment of cash and bank balances, etc. -1223 1948 -1,663 -1,737 3,171 -259.28% -3,611 -185.37% -74 4.45%
Cash and bank balances at 31 December 16778 20686 23,031 23,112 3,908 23.29% 2,345 11.34% 81 0.35%
Of which classified as assets held for sale 0 -486 -143 -186 -486 0.00% 343 -70.58% -43 30.07%
Cash and bank balances at 31 December 16,778 20,200 22,888 22,926 3,422 20.40% 2,688 13.31% 38 0.17%

86
Appendix No. 8
A.P Moller - Maersk Group
Sources of Cash
From Year 2004 to 2007
Amount in DKK Million
Years
Description 2004 2005 2006 2007 Total. Percentage
Net Cash flow from operation 29,207.00 33,329.00 23,697.00 39,817.00 126,050.00 38.21%
Proceeds from Debts 11,993.00 35,486.00 23,180.00 26,184.00 96,843.00 29.35%
Sale of marketable securities 15,037.00 27,347.00 19,862.00 14,527.00 76,773.00 23.27%
Disposal of non-current assets 3,243.00 3,327.00 8,837.00 9,185.00 24,592.00 7.45%
Gain Disposal of subsidiaries and activities 3,379.00 - 51.00 819.00 391.00 4,538.00 1.38%
Capital increases 38.00 67.00 538.00 464.00 1,107.00 0.34%
Total Cash inflow 62,897.00 99,505.00 76,933.00 90,568.00 329,903.00 100.00%
A.P Moller - Maersk Group
Uses of Cash
From Year 2004 to 2007
Amount in DKK Million
Years
Description 2004 2005 2006 2007 Total. Percentage
Purchase of non-current assets - 22,451.00 - 29,361.00 - 40,938.00 - 55,379.00 - 148,129.00 46.44%
Purchase of marketable securities - 23,108.00 - 19,206.00 - 18,767.00 - 9,997.00 - 71,078.00 22.29%
Repayment of loans - 10,306.00 - 10,849.00 - 8,851.00 - 17,538.00 - 47,544.00 14.91%
Acquisition of subsidiaries and activities - 404.00 - 33,131.00 - 209.00 - 3,467.00 - 37,211.00 11.67%
Dividends distributed - 1,235.00 - 1,852.00 - 2,263.00 - 2,263.00 - 7,613.00 2.39%
Acquisition & Other investment in associated companies - 2,102.00 - 2,696.00 - 2,830.00 267.00 - 7,361.00 2.31%
Total Cash Outflow - 59,606.00 - 97,095.00 - 73,858.00 - 88,377.00 - 318,936.00 100.00%

87
Appendix No.9
A.P. Moller – Maersk Group
Comparative Income Statement
For the period of 2004-07
Amount in Billion(DKK)
2003-04 2004-05 2005-06 2006-07
2,004 2,005 2,006 2,007
Absolute
Change Change
Absolute
Change Change
Absolute
Change Change
Absolute
Change Change
Revenue 159.544 208.702 260.134 278.872 2.432 2% 49.158 31% 51.432 25% 18.738 7%
Other operating income 1.194 1.204 1.896 1.588 - 1.088 -48% 0.010 1% 0.692 57% - 0.308 -16%
External costs 100.103 135.898 179.120 183.886 3.122 3% 35.795 36% 43.222 32% 4.766 3%
Other operating expenses - - 1.000 1.000 - 0% - 0% 1.000 0% - 0%
Staff costs 20.068 24.037 30.987 30.328 - 2.835 -12% 3.969 20% 6.950 29% - 0.659 -2%
Profit before depreciation, amortisation and 40.567 49.971 50.923 65.246 1.057 3% 9.404 23% 0.952 2% 14.323 28%
impairments losses - - - - - 0% - 0% - 0% - 0%
Depreciation, amortisation and impairment losses 12.758 17.755 19.357 26.213 - 5.006 -28% 4.997 39% 1.602 9% 6.856 35%
Gains on sale of ships, rigs, etc. 1.482 1.676 4.227 6.062 1.482 0% 0.194 13% 2.551 152% 1.835 43%
Associated companies – share of profit after tax 3.037 2.881 3.084 - 0% - - - 0.156 -5% 0.203 7%
Profit before integration costs 29.652 36.929 38.943 47.775 29.652 0% 7.277 25% 2.014 5% 8.832 23%
Integration costs on acquisitions - 1.783 0.734 - - 0% 1.783 0% - 1.049 -59% - 0.734 -100%
Profit before financial items 30.000 35.000 38.000 48.000 8.254 38% 5.000 17% 3.000 9% 10.000 26%
Associated companies – share of result before tax - - - - - 0.568 -100% - 0% - 0% - 0%
Financial income 2.842 1.732 2.952 2.309 0.657 30% - 1.110 -39% 1.220 70% - 0.643 -22%
Financial expenses 2.097 3.853 5.171 6.356 - 0.447 -18% 1.756 84% 1.318 34% 1.185 23%
Result before special items - - - - - 21.955 -100% - 0% - 0% - 0%
value adjustment of financial assets 5.013 - - - 2.495 99% - 5.013 -100% - 0% - 0%
Exchange rate adjustment of loans, etc - - - - - 2.149 -100% - 0% - 0% - 0%
Profit before tax 35.410 33.025 35.990 43.728 8.788 33% - 2.385 -7% 2.965 9% 7.738 22%
Tax on profit for the year 9.180 13.223 19.935 24.537 - 0.050 -1% 4.043 44% 6.712 51% 4.602 23%
Profit for the year – continuing operations 26.230 19.802 16.055 19.191 8.838 51% - 6.428 -25% - 3.747 -19% 3.136 20%
Profit/loss for the year – discontinued operations 2.026 0.404 0.131 - 0.533 2.026 0% - 1.622 -80% - 0.273 -68% - 0.664 -507%
Profit for the year 28.256 20.206 16.186 18.658 10.864 62% - 8.050 -28% - 4.020 0% 2.472 15%
Minority interests 0.107 0.116 0.629 0.829 0.226 -190% 0.009 8% 0.513 442% 0.200 32%
A.P. Møller - Mærsk A/S’s share of profit for the
year 28.149 20.090 15.557 17.829 10.876 63% - 8.059 -29% - 4.533 -23% 2.272 15%
Earnings per share, DKK 6.841 4.88 3.781 4.333 6.841 0% - 1.958 -29% - 1.102 -23% 0.552 15%