mad science: polyglot bridges
TRANSCRIPT


"or using" ... hmmm

JVM
JavaJRubyScalaClojure

Javascript
OpalCoffeeScriptClojureScript

C

Libraries

Languages!

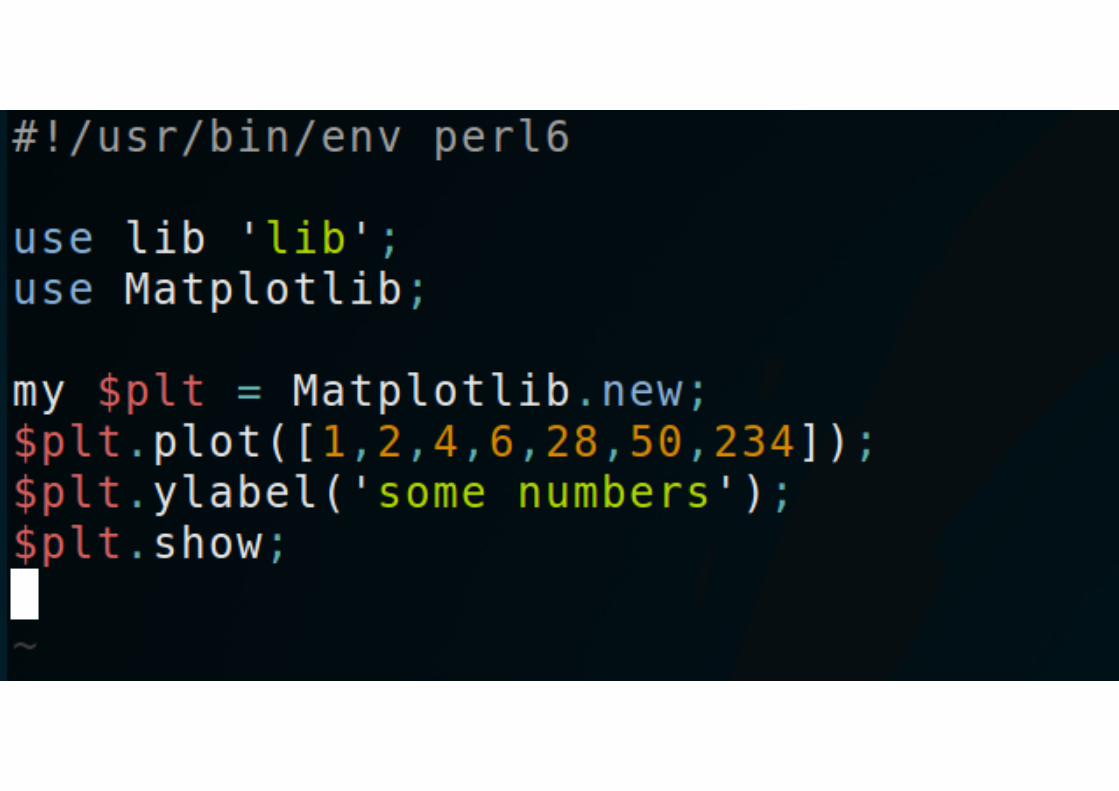
Use case: graph some stuff from Perl6/Rakudo

> sudo apt-get install matplotlib
# Pythonimport matplotlib.pyplot as plt

panda install Inline::Python
Perl6 (Rakudo) → Python


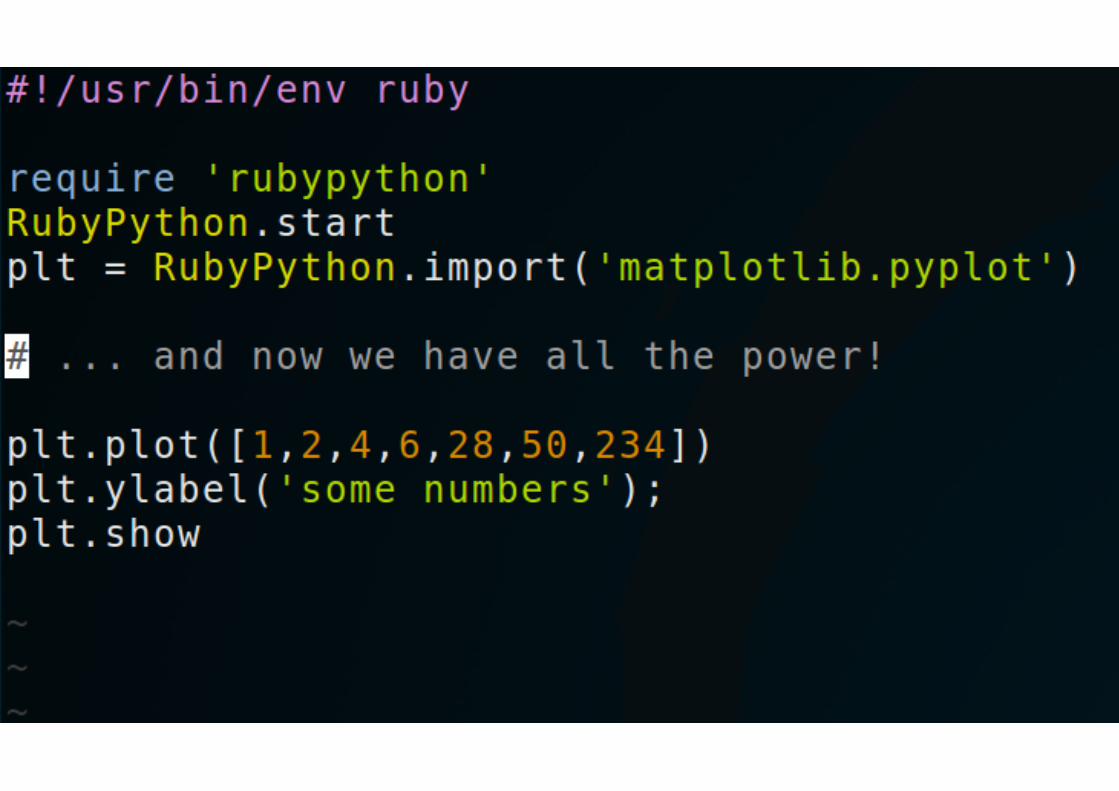
Ruby?


gem install rubypython # !!!
(small patch to fix lib)
Ruby (YARV) → Python


FFI... so sweet!

Ruby (JVM) → Python

Also works!

Exercise for the reader:
Pick a model. Visualize it!

require 'rubypython'RubyPython.startplt = RubyPython.import('matplotlib.pyplot')
# The 'left' slices it down to year-monthorder_counts = Order .group("left(created_at, 7)") .count .values
plt.plot(order_counts)
plt.show

THE END