macular function measured by binocular mferg and · pdf filemacular function measured by...
TRANSCRIPT

LUND UNIVERSITY
PO Box 117221 00 Lund+46 46-222 00 00
Macular function measured by binocular mfERG and compared with macular structurein healthy children.
Molnar, Anna E C; Andréasson, Sten; Larsson, Eva K B; Åkerblom, Hanna M; Holmström,Gerd EPublished in:Documenta Ophthalmologica
DOI:10.1007/s10633-015-9513-y
Published: 2015-01-01
Link to publication
Citation for published version (APA):Molnar, A. E. C., Andréasson, S., Larsson, E. K. B., Åkerblom, H. M., & Holmström, G. E. (2015). Macularfunction measured by binocular mfERG and compared with macular structure in healthy children. DocumentaOphthalmologica, 131(3), 169-176. DOI: 10.1007/s10633-015-9513-y
General rightsCopyright and moral rights for the publications made accessible in the public portal are retained by the authorsand/or other copyright owners and it is a condition of accessing publications that users recognise and abide by thelegal requirements associated with these rights.
• Users may download and print one copy of any publication from the public portal for the purpose of privatestudy or research. • You may not further distribute the material or use it for any profit-making activity or commercial gain • You may freely distribute the URL identifying the publication in the public portal

ORIGINAL RESEARCH ARTICLE
Macular function measured by binocular mfERGand compared with macular structure in healthy children
Anna E. C. Molnar . Sten O. L. Andreasson .
Eva K. B. Larsson . Hanna M. Akerblom .
Gerd E. Holmstrom
Received: 14 May 2015 / Accepted: 6 October 2015
� Springer-Verlag Berlin Heidelberg 2015
Abstract
Purpose To create normative data in children from
binocular multifocal ERG (mfERG) recordings and
compare results with the macular thickness.
Methods Forty-nine 5- to 15-year-old healthy, full-
term children were examined with Espion Multifocal
System, using DTL electrodes. The stimulus matrix
consisted of 37 hexagonal elements. Amplitudes,
implicit times and response densities (presented in
three rings) of the first-order component P1 were
analyzed. Measurements of macular thickness were
performed with spectral-domain Cirrus OCT.
Results There were no significant differences
between right and left eyes regarding mfERG record-
ings. Median P1 implicit times of Rings 1–3 of the 46
right eyes were 30.0, 30.0 and 30.8 ms and response
densities 20.5, 10.9 and 7.6 nV/deg2, respectively.
Implicit time was longer in boys than in girls
(p = 0.009, 0.039, 0.005 in Rings 1–3) and was
correlated with age (rs = 0.417, 0.316, 0.274 in Rings
1–3). Implicit time in Ring 1 correlated significantly
with the inner circle of the OCT measurements
(p = 0.014).
Conclusion Binocular mfERG with DTL electrodes
is a reliable test of the central macular function in
children and correlates with macular structure. As
previously not shown, there was a significant differ-
ence in implicit time between boys and girls.
Keywords Binocular � Multifocal
electroretinogram � DTL electrodes � Healthychildren � Optic coherence tomography
Introduction
Early and proper diagnosis is essential in children with
visual impairment, which emphasizes the importance
of evaluation of the prognosis, the habilitation, and
current and subsequent treatment. Electrophysiologi-
cal examinations have been shown to be of great
significance in the investigation of reduced visual
acuity of unknown origin [1]. Since introduction of the
multifocal retinogram (mfERG) in 1992 by Sutter and
Tran [2], it has been possible to objectively evaluate
the function of the macular area, i.e., photoreceptors,
predominantly the cones, and bipolar cell function [3,
4]. The mfERG has been shown to be a valuable tool in
the diagnosis of macular disease at an early stage, in
particular when appearance of the fundus is normal or
pathological findings are subtle [5].
A. E. C. Molnar � E. K. B. Larsson � H. M. Akerblom �G. E. Holmstrom (&)
Department of Neuroscience/Ophthalmology, Uppsala
University, Uppsala, Sweden
e-mail: [email protected]
S. O. L. Andreasson
Department of Ophthalmology, Lund University, Lund,
Sweden
123
Doc Ophthalmol
DOI 10.1007/s10633-015-9513-y
The full-field electroretinogram (ffERG), which
reflects the total retinal function, can be normal,
whereas the mfERG may detect reduced local cone
function in the macular region in patients with
Stargardt disease, even in the absence of major fundus
abnormalities [5, 6]. Further, because the mfERG
mainly reflects macular cone function, it could
enhance our possibilities to differentiate between
optic nerve disorder and retinal disorder in patients
with visual loss of unknown origin [7]. Finally,
examination with mfERGmakes it possible to monitor
the course of a macular/retinal disease [8], and it can
be useful when evaluating macular function after
possible gene therapy in the future.
Examination in children requires methods that are
painless, fast, and at the same time accurate, in
providing necessary diagnostic information. We have
recently reported normative data regarding optical
coherence tomography (OCT) in children [9]. The
primary aim of the present study was to create
normative data from binocular mfERG recordings in
children with the help of a clinically applicable
protocol. A second aim was to relate the findings to
age and gender. A third aim was to correlate the
mfERG recordings with macular morphology mea-
sured with OCT.
Materials and methods
A number of 200 study participants aged 5–15 years
were randomly chosen from the birth register of the
Swedish National Board of Health and Welfare, living
in Uppsala County. A letter for recruitment to the
study was sent out to their parents. A written consent
was obtained from the parents of the participating
children and oral consent from children. Ethical
approval for the study was obtained from the Ethics
Committee of Uppsala University. Altogether, forty-
nine children accepted both examinations with
mfERG and OCT and were examined from December
2012 until September 2014. Inclusion criteria were
having been born at term (C37 weeks of gestation),
normal birth weight (C2500 g), normal health, no eye
disease, manifest strabismus, refraction with a spher-
ical equivalent between ?3 and -3 and cylinder
strength[-2 and a visual acuity B0.1 logMar.
Monocular visual acuity (VA) was obtained with a
linear LogMar chart. Pupils were fully dilated with
cyclopentolate 0.85 % and phenylephrine 1.5 % eye-
drops. Cycloplegic autorefraction and fundus exami-
nation were performed.
The mfERG signals were recorded using the Espion
Multifocal System (Diagnosys, Lowell, MA, USA
version 6.2012.1211.52), and accorded to ISCEV
recommendations [10] except for the stimulus matrix,
which consisted of 37 hexagonal elements corre-
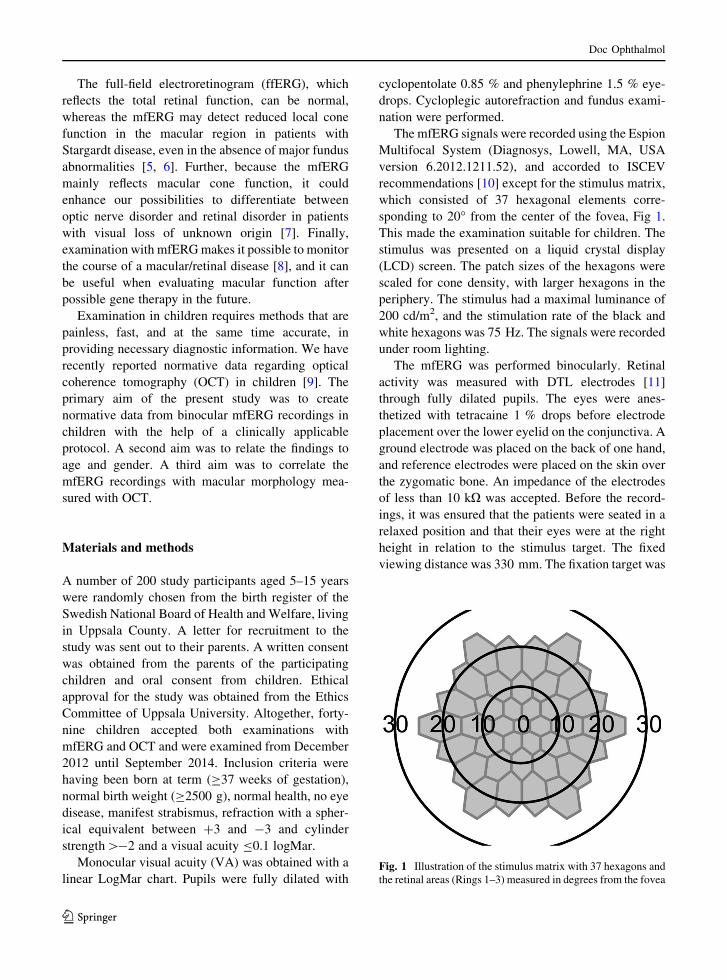
sponding to 20� from the center of the fovea, Fig 1.
This made the examination suitable for children. The
stimulus was presented on a liquid crystal display
(LCD) screen. The patch sizes of the hexagons were
scaled for cone density, with larger hexagons in the
periphery. The stimulus had a maximal luminance of
200 cd/m2, and the stimulation rate of the black and
white hexagons was 75 Hz. The signals were recorded
under room lighting.
The mfERG was performed binocularly. Retinal
activity was measured with DTL electrodes [11]
through fully dilated pupils. The eyes were anes-
thetized with tetracaine 1 % drops before electrode
placement over the lower eyelid on the conjunctiva. A
ground electrode was placed on the back of one hand,
and reference electrodes were placed on the skin over
the zygomatic bone. An impedance of the electrodes
of less than 10 kX was accepted. Before the record-
ings, it was ensured that the patients were seated in a
relaxed position and that their eyes were at the right
height in relation to the stimulus target. The fixed
viewing distance was 330 mm. The fixation target was
Fig. 1 Illustration of the stimulus matrix with 37 hexagons and
the retinal areas (Rings 1–3) measured in degrees from the fovea
Doc Ophthalmol
123

a central red cross. During the whole test period,
fixation was monitored with the help of a camera.
Examination time was 2 min if the test was performed
without pauses or blinks. Throughout the test, the
examiner encouraged the child to fixate on the target.
If blinks occurred during the measurements, the
signals were rejected by the artifact rejector and the
measurements restarted. The mfERG signals were
filtered through a 10- to 100-Hz band-pass filter and
amplified with 32-bit amplifiers. Further, as in other
published mfERG systems, spatial averaging of 25 %
was used.
The electrical potential measurements (nanovolts)
were cross-correlated with the pseudorandom binary
m-sequence responses producing the focal macular
responses [2]. Implicit times and amplitudes of the
first-order component P1 (first positive peak) were
summarized and analyzed, Fig. 2.
The hexagons were divided into three areas, Rings
1–3 (Fig. 3), of which Rings 1 and 2 measure the
macular area. The measurements of the response
density were also investigated using the formula
nanovolts per square degree (nV/deg2), i.e., the
amplitudes in a ring are divided by the area of the
hexagons in the same ring.
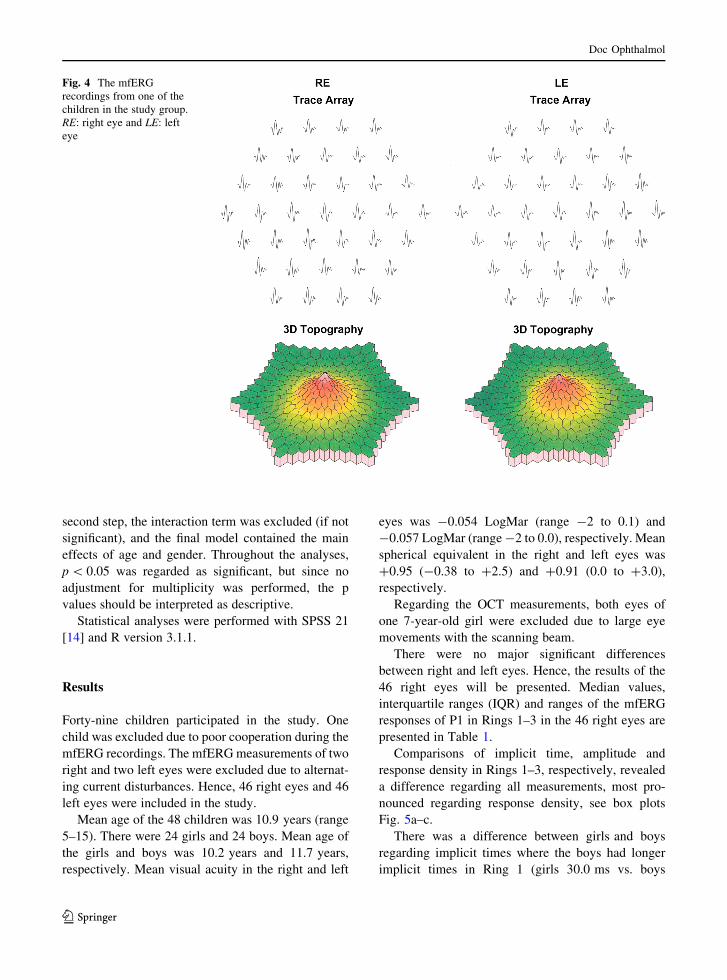
The results of the mfERG measurements were
presented as a trace array, see Fig. 4. The majority of
the examinations were performed by the first author.
Measurements of the macular thickness were
obtained with spectral-domain Cirrus, version
6.0.2.81 (Carl Zeiss Meditec, Dublin, CA, USA),
using the macular cube protocol 512 9 128. The OCT
measurements were performed by an experienced
research nurse (E.N). Three examinations of each eye
were done, and inclusion criteria were: a signal
strength[7, no large movements with the scanning
beam, and no blinks over the measured area. The mean
values of the three measurements were calculated. The
OCT values were presented in nine ETDRS areas
established by the Early Treatment Diabetic Retinopa-
thy Study Research Group [12]. The central retinal
area (A1) has a diameter of 1 mm, the inner circle
(A2–A5) together with A1 has a diameter of 3 mm,
and the outer circle (A6–A9) together with A1 and the
inner circle has a total diameter of 6 mm [12].
According to Holm and Lovestam Adrian [13],
1 mm of the OCT macular map corresponds to 4� ofthe mfERG rings. Hence, Ring 1, with a diameter of
20�, was chosen when comparing the mfERG record-
ings with the OCT values.
Statistical methods
According to recommendations regarding analysis of
mfERG [10], nonparametric tests were used through-
out the analyses. The Wilcoxon signed rank test was
used for comparison of right and left eyes, the
Friedman rank sum test for comparison between
Rings 1 and 3, Mann–Whitney analysis for compar-
ison of girls and boys, and Spearman’s test for
correlation (rs) between mfERG responses and age,
as well as between mfERG responses and OCT
measurements.
Multivariate analysis of covariance (ANCOVA)
was performed in order to explore the effects of age
and gender on implicit time. Each analysis was
performed in two steps. In the first step, the model
included the interaction term of age and gender. In the
P1
nV
ms
Fig. 2 The waveform of the multifocal electroretinogram
(mfERG)
Fig. 3 Schematic illustration of the three mfERG rings (Ring 1:
orange, Ring 2: green, Ring 3: lilac). In this figure, there is no
scaling for photoreceptor density
Doc Ophthalmol
123
second step, the interaction term was excluded (if not
significant), and the final model contained the main
effects of age and gender. Throughout the analyses,
p\ 0.05 was regarded as significant, but since no
adjustment for multiplicity was performed, the p
values should be interpreted as descriptive.
Statistical analyses were performed with SPSS 21
[14] and R version 3.1.1.
Results
Forty-nine children participated in the study. One
child was excluded due to poor cooperation during the
mfERG recordings. The mfERGmeasurements of two
right and two left eyes were excluded due to alternat-
ing current disturbances. Hence, 46 right eyes and 46
left eyes were included in the study.
Mean age of the 48 children was 10.9 years (range
5–15). There were 24 girls and 24 boys. Mean age of
the girls and boys was 10.2 years and 11.7 years,
respectively. Mean visual acuity in the right and left
eyes was -0.054 LogMar (range -2 to 0.1) and
-0.057 LogMar (range-2 to 0.0), respectively. Mean
spherical equivalent in the right and left eyes was
?0.95 (-0.38 to ?2.5) and ?0.91 (0.0 to ?3.0),
respectively.
Regarding the OCT measurements, both eyes of
one 7-year-old girl were excluded due to large eye
movements with the scanning beam.
There were no major significant differences
between right and left eyes. Hence, the results of the
46 right eyes will be presented. Median values,
interquartile ranges (IQR) and ranges of the mfERG
responses of P1 in Rings 1–3 in the 46 right eyes are
presented in Table 1.
Comparisons of implicit time, amplitude and
response density in Rings 1–3, respectively, revealed
a difference regarding all measurements, most pro-
nounced regarding response density, see box plots
Fig. 5a–c.
There was a difference between girls and boys
regarding implicit times where the boys had longer
implicit times in Ring 1 (girls 30.0 ms vs. boys
Fig. 4 The mfERG
recordings from one of the
children in the study group.
RE: right eye and LE: left
eye
Doc Ophthalmol
123

30.8 ms, p = 0.009), Ring 2 (girls 30.0 ms vs. boys
30.8 ms, p = 0.039) and Ring 3 (girls 30.0 ms vs.
boys 30.8 ms, p = 0.005). There were no differences
regarding amplitudes or response densities and gender.
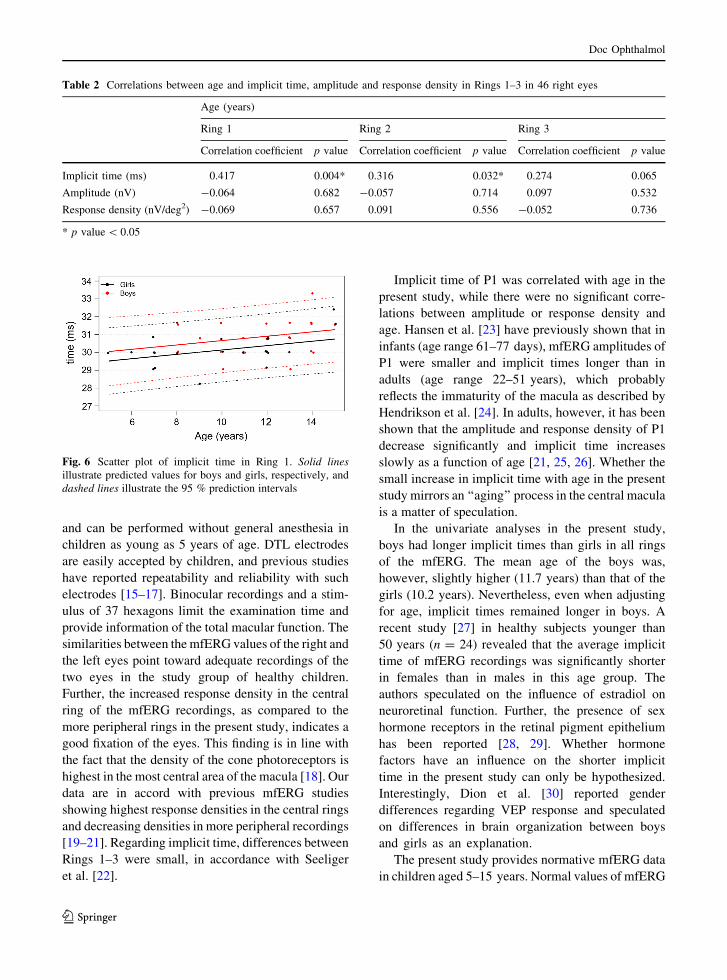
There was a significant correlation between age and
implicit time in Ring 1 and Ring 2 and a borderline
correlation in Ring 3, see Table 2.
In multivariate analysis of Rings 1–3, the effect of
both age and gender remained similar to that in the
univariate analyses, where implicit time increased
with age and was slightly longer in boys. The results
for Ring 1 are illustrated in Fig. 6. In the figure, the
predicted values for boys and girls at different ages are
illustrated along with 95 % prediction intervals.
Correlations between implicit time in Ring 1 and
the different OCT variables are illustrated in Table 3.
Regarding amplitude and response density, no signif-
icant correlations were found with any of the OCT
variables.
Discussion
In the present population-based study, 49 healthy, full-
term children were examined with mfERG and Cirrus
OCT. Implicit time in the mfERG recordings
increased with age and was longer in boys than in
girls. There was also a correlation between implicit
time in Ring 1 and the inner circle of the OCT
measurements.
The mfERG method used in this study has several
strengths. It is well tolerated in children, and all except
one child were able to cooperate. It is painless, quick
Table 1 Median values,
interquartile range (IQR)
and range of the mfERG
responses of P1 in 46 right
eyes; implicit time (ms),
amplitude (nV) and
response density (nV/deg2)
Area Implicit time (ms) Amplitude (nV) Response density (nV/deg2)
Median
IQR
(range)
Median
IQR
(range)
Median
IQR
(range)
Ring 1 30.0
30.0–31.0
(28.3–33.3)
583.9
454.8–651.1
(337.3–975.6)
20.45
15.9–22.8
(11.8–34.2)
Ring 2 30.0
30.0–30.8
(28.3–32.4)
533.3
403.9–584.2
(283.7–970.2)
10.85
8.2–11.9
(5.8–19.7)
Ring 3 30.8
30.0–31.6
(29.1–32.4)
521.2
414.5–587.5
(233.8–986.3)
7.6
6.0–8.5
(3.4–14.3)
●
●
●
●
●
Ring 1 Ring 2 Ring 3
2930
3132
33
Impl
icit
time
(ms)
P−value for difference between rings = <0.001
● ●●
Ring 1 Ring 2 Ring 3
200
400
600
800
1000
Am
plitu
de (n
V)
P−value for difference between rings = <0.001
●
●
●
Ring 1 Ring 2 Ring 3
5
10
15
20
25
30
35
Res
pons
e de
nsity
(nV
/ deg
2 )
P−value for difference between rings = <0.001
a
b
c
Fig. 5 a Comparison of implicit time (ms) in Rings 1–3.
b Comparison of amplitude (nV) in Rings 1–3. c Comparison of
response density (nV/deg2) in Rings 1–3
Doc Ophthalmol
123
and can be performed without general anesthesia in
children as young as 5 years of age. DTL electrodes
are easily accepted by children, and previous studies
have reported repeatability and reliability with such
electrodes [15–17]. Binocular recordings and a stim-
ulus of 37 hexagons limit the examination time and
provide information of the total macular function. The
similarities between themfERG values of the right and
the left eyes point toward adequate recordings of the
two eyes in the study group of healthy children.
Further, the increased response density in the central
ring of the mfERG recordings, as compared to the
more peripheral rings in the present study, indicates a
good fixation of the eyes. This finding is in line with
the fact that the density of the cone photoreceptors is
highest in the most central area of the macula [18]. Our
data are in accord with previous mfERG studies
showing highest response densities in the central rings
and decreasing densities in more peripheral recordings
[19–21]. Regarding implicit time, differences between
Rings 1–3 were small, in accordance with Seeliger
et al. [22].
Implicit time of P1 was correlated with age in the
present study, while there were no significant corre-
lations between amplitude or response density and
age. Hansen et al. [23] have previously shown that in
infants (age range 61–77 days), mfERG amplitudes of
P1 were smaller and implicit times longer than in
adults (age range 22–51 years), which probably
reflects the immaturity of the macula as described by
Hendrikson et al. [24]. In adults, however, it has been
shown that the amplitude and response density of P1
decrease significantly and implicit time increases
slowly as a function of age [21, 25, 26]. Whether the
small increase in implicit time with age in the present
study mirrors an ‘‘aging’’ process in the central macula
is a matter of speculation.
In the univariate analyses in the present study,
boys had longer implicit times than girls in all rings
of the mfERG. The mean age of the boys was,
however, slightly higher (11.7 years) than that of the
girls (10.2 years). Nevertheless, even when adjusting
for age, implicit times remained longer in boys. A
recent study [27] in healthy subjects younger than
50 years (n = 24) revealed that the average implicit
time of mfERG recordings was significantly shorter
in females than in males in this age group. The
authors speculated on the influence of estradiol on
neuroretinal function. Further, the presence of sex
hormone receptors in the retinal pigment epithelium
has been reported [28, 29]. Whether hormone
factors have an influence on the shorter implicit
time in the present study can only be hypothesized.
Interestingly, Dion et al. [30] reported gender
differences regarding VEP response and speculated
on differences in brain organization between boys
and girls as an explanation.
The present study provides normative mfERG data
in children aged 5–15 years. Normal values of mfERG
Table 2 Correlations between age and implicit time, amplitude and response density in Rings 1–3 in 46 right eyes
Age (years)
Ring 1 Ring 2 Ring 3
Correlation coefficient p value Correlation coefficient p value Correlation coefficient p value
Implicit time (ms) 0.417 0.004* 0.316 0.032* 0.274 0.065
Amplitude (nV) -0.064 0.682 -0.057 0.714 0.097 0.532
Response density (nV/deg2) -0.069 0.657 0.091 0.556 -0.052 0.736
* p value\ 0.05
Fig. 6 Scatter plot of implicit time in Ring 1. Solid lines
illustrate predicted values for boys and girls, respectively, and
dashed lines illustrate the 95 % prediction intervals
Doc Ophthalmol
123

recordings in adults have been reported [19, 25, 31],
but to our knowledge, there are no previous studies
regarding normative data in children. Our normal
values may be of help to other electrophysiological
departments. The number of children in the present
study was too small for creating normal values with
respect to age and gender. However, based on a model,
predictive values for boys and girls of different ages
were calculated (Fig. 6) and may be of value in the
clinical situation.
The mfERG recordings were finally compared with
OCT measurements of the macular area, and this
pointed to a correlation between structure and function
of the central retina. The implicit time of Ring 1
became longer with increasing thickness of the inner
circle of the OCT measurements. Fovea is an
interesting region histologically. Previous studies
have shown that implicit time is prolonged with
increasing macular thickness, for example macular
edema in diabetic retinopathy [32]. Interestingly, the
present study shows a positive correlation between
implicit time and macular thickness also in healthy
eyes.
Function and structure of the central macula are
affected in various diseases in childhood such as
Stargardt disease, achromatopsia and x-linked juve-
nile retinoschisis [33–35]. Although not always in
agreement, a combination of mfERG and OCT
provides important and complementary information
about the central retina [36]. Early diagnosis is crucial
in order to facilitate early habilitation, information to
families and schools, genetic counseling and possibly
future gene therapy. The present study shows that
mfERG is a useful and objective test of the central
macular function also in children. The method is well
tolerated, seems to provide reliable results and can be
recommended, together with OCT, in the investigation
of reduced visual function of unknown origin in
children.
Acknowledgments We thank Eva Nuija for efficient help and
for performing the OCT measurements in the study. We also
thank Marcus Thuresson, Statisticon AB, for valuable help with
the statistical analyses. The study was supported by the Crown
Princess Margareta Foundation for the Visually Impaired,
Ogonfonden, and the Sigvard and Marianne Bernadotte
Foundation. All authors certify that they have NO affiliations
with or involvement in any organization or entity with any
financial interest (such as honoraria; educational grants;
participation in speakers’ bureaus; membership, employment,
consultancies, stock ownership, or other equity interest; and
expert testimony or patent-licensing arrangements) or
nonfinancial interest (such as personal or professional
relationships, affiliations, knowledge or beliefs) in the subject
matter or materials discussed in this manuscript.
Compliance with ethical standards
Conflict of interest All authors certify that they have NO
affiliations with or involvement in any organization or entity
with any financial interest (such as honoraria; educational
grants; participation in speakers’ bureaus; membership,
employment, consultancies, stock ownership, or other equity
interest; and expert testimony or patent-licensing arrange-
ments), or non-financial interest (such as personal or profes-
sional relationships, affiliations, knowledge or beliefs) in the
subject matter or materials discussed in this manuscript.
Statements of human rights The tenets of the Declaration of
Helsinki were strictly adhered to during the course of the study.
Informed consent Written consent was obtained from the
parents of the participating children and oral consent from
children. Ethical approval for the study was obtained from the
Ethics Committee of Uppsala University.
Table 3 Correlations between implicit time, amplitude and response density in Ring 1 and OCT parameters in 46 right eyes
OCT parameters Ring 1
Implicit time (ms)
Ring 1
Amplitude (nV)
Ring 1
Response density (nV/deg2)
Correlation coefficient p value Correlation coefficient p value Correlation coefficient p value
Central area 0.192 0.211 0.171 0.266 0.171 0.267
Inner circle 0.368 0.014* 0.132 0.394 0.129 0.405
Outer circle 0.153 0.321 0.074 0.634 0.072 0.642
CV 0.243 0.111 0.109 0.482 0.107 0.490
CAT 0.240 0.117 0.104 0.500 0.102 0.508
CV cube volume (mm3), CAT cube average thickness (lm)
* p value\0.05
Doc Ophthalmol
123

References
1. van Genderen M, Riemslag F, Jorritsma F et al (2006) The
key role of electrophysiology in the diagnosis of visually
impaired children. Acta Ophthalmol Scand 84:799–806
2. Sutter EE, Tran D (1992) The field topography of ERG
components in man—I. The photopic luminance response.
Vision Res 32:433–446
3. Hood DC, Greenstein V, Frishman L et al (1999) Identifying
inner retinal contributions to the human multifocal ERG.
Vision Res 39:2285–2291
4. Hood DC, Frishman LJ, Saszik S et al (2002) Retinal origins
of the primate multifocal ERG: implications for the human
response. Invest Ophthalmol Vis Sci 43:1673–1685
5. Sisk RA, Leng T (2014)Multimodal imaging andmultifocal
electroretinography demonstrate autosomal recessive Star-
gardt disease may present like occult macular dystrophy.
Retina 34:1567–1575
6. Praidou A, Hagan R, Newman W et al (2014) Early diag-
nosis of Stargardt disease with multifocal electroretinogram
in children. Int Ophthalmol 34:613–621
7. Kretschmann U, Bock M, Gockeln R et al (2000) Clinical
applications of multifocal electroretinography. Doc Oph-
thalmol 100:99–113
8. Andreasson S, Gosh F (2014) Cone implicit time as a pre-
dictor of visual outcome in macular hole surgery. Graefes
Arch Clin Exp Ophthalmol 252:1903–1909
9. Molnar A, Holmstrom G, Larsson E (2015) Macular
thickness assessed with spectral domain OCT in a popula-
tion-based study of children: normative data, repeatability
and reproducibility and comparison with time domain OCT.
Acta Ophthalmol 2015(93):470–475
10. Hood DC, Bach M, Brigell M et al (2012) International
Society For Clinical Electrophysiology of Vision. ISCEV
standard for clinical multifocal electroretinography
(mfERG) (2011 edition). Doc Ophthalmol 124:1–13
11. Dawson WW, Trick GL, Litzkow CA (1979) Improved
electrode for electroretinography. Invest Ophtalmol Vis Sci
18:988–991
12. Early Treatment Diabetic Retinopathy Study Research
Group (1985) Photocoagulation for diabetic macular edema.
Early treatment diabetic retinopathy study report. Arch
Ophthalmol 103:1796–1806
13. Holm K, Lovestam Adrian M (2012) In diabetic eyes,
multifocal ERG reflects differences in function between the
nasal part and the temporal part of the macula. Graefes Arch
Clin Exp Ophthalmol 250:1143–1148
14. R Core Team (2014). R: A language and environment for
statistical computing. BM Corporation, Armonk, NY. R ver-
sion 3.0.1 R Foundation for Statistical Computing, Vienna,
Austria. http://www.R-project.org. Accessed 10 Mar 2015
15. Mohidin N, Yap MK, Jacobs RJ (1997) The repeatability
and variability of the multifocal electroretinogram for four
different electrodes. Ophthalmic Physiol Opt 17:530–535
16. Hennessy MP, Vaegan (1995) Amplitude scaling relation-
ships of Burian-Allen, gold foil and Dawson, Trick and
Litzkow electrodes. Doc Ophthalmol 89:235–248
17. Hebert M, Lachapelle P, Dumont M (1995–1996). Repro-
ducibility of electroretinograms recorded with DTL elec-
trodes. Doc Ophthalmol 91:333–342
18. Curcio CA, Sloan KR, Kalina RE et al (1990) Human
photoreceptor topography. J Comp Neurol 292:497–523
19. VerdonWA, Haegerstrom-Portnoy G (1998) Topography of
themultifocal electroretinogram.DocOphthalmol 95:73–90
20. Fulton AB, Hansen RM, Moskowitz A et al (2005) Multi-
focal ERG in subjects with a history of retinopathy of pre-
maturity. Doc Ophthalmol 111:7–13
21. Jackson GR, Ortega J, Girkin C et al (2002) Aging-related
changes in the multifocal electroretinogram. J Opt Soc Am
A Opt Image Sci Vis 19:185–189
22. Seeliger MW, Kretschmann UH, Apfelstedt-Sylla E et al
(1998) Implicit time topography of multifocal elec-
troretinograms. Invest Ophthalmol Vis Sci 39:718–723
23. HansenRM,MoskowitzA, FultonAB (2009)Multifocal ERG
responses in infants. Invest Ophthalmol Vis Sci 50:470–475
24. Hendrickson A, Possin D, Vajzovic L et al (2012) Histo-
logic development of the human fovea from midgestation to
maturity. Am J Ophthalmol 154:767–778
25. Seiple W, Vajaranant TS, Szlyk JP et al (2003) Multifocal
electroretinography as a function of age: the importance of
normative values for older adults. Invest Ophthalmol Vis
Sci 44:1783–1792
26. Gerth C, Sutter EE, Werner JS (2003) mfERG response
dynamics of the aging retina. Invest Ophthalmol Vis Sci
44:4443–4450
27. Ozawa GY, Bearse MA Jr, Harrison WW et al (2014) Dif-
ferences in neuroretinal function between adult males and
females. Optom Vis Sci 91:602–607
28. Munaut C, Lambert V, Noel A et al (2001) Presence of
oestrogen receptor type beta in human retina. Br J Oph-
thalmol 85:877–882
29. Marin-Castano ME, Elliot SJ, Potier M et al (2003) Regu-
lation of estrogen receptors and MMP-2 expression by
estrogens in human retinal pigment epithelium. Invest
Ophthalmol Vis Sci 44:50–59
30. Dion LA, Muckle G, Bastien C et al (2013) Sex differences
in visual evoked potentials in school-age children: What is
the evidence beyond the checkerboard? Int J Psychophysiol
88:136–142
31. Azad R, Ghatak U, Sharma YR et al (2012) Multifocal
electroretinogram in normal emmetropic subjects: correla-
tion with optical coherence tomography. Indian J Ophthal-
mol 60:49–52
32. Holm K, Larsson J, Lovestam-Adrian M (2007) In diabetic
retinopathy, foveal thickness of 300 lm seems to correlate
with functionally significant loss of vision. Doc Ophthalmol
114:117–124
33. Fujinami K, Zernant J, Chana RK et al (2015) Clinical and
molecular characteristics of childhood-onset Stargardt dis-
ease. Ophthalmology 122:326–334
34. Eksandh L, Kohl S, Wissinger B (2002) Clinical features of
achromatopsia in Swedish patients with defined genotypes.
Ophthalmic Genet 23:109–120
35. Kjellstrom S, Vijayasarathy C, Ponjavic V et al (2010)
Long-term 12 year follow-up of X-linked congenital
retinoschisis. Ophthalmic Genet 31:114–125
36. Dale EA, Hood DC, Greenstein VC et al (2010) A com-
parison of multifocal ERG and frequency domain OCT
changes in patients with abnormalities of the retina. Doc
Ophthalmol 120:175–186
Doc Ophthalmol
123