macstats: medicaid and chip data book december 2018 · chip data book december 2018 medicaid and...
TRANSCRIPT

MACStats: Medicaid and CHIP Data Book
December 2018
Medicaid and CHIP Payment and Access Commission

About MACPAC The Medicaid and CHIP Payment and Access Commission (MACPAC) is a non-partisan legislative branch agency that provides policy and data analysis and makes recommendations to Congress, the Secretary of the U.S. Department of Health and Human Services, and the states on a wide array of issues affecting Medicaid and the State Children’s Health Insurance Program (CHIP). The U.S. Comptroller General appoints MACPAC’s 17 commissioners, who come from diverse regions across the United States and bring broad expertise and a wide range of perspectives on Medicaid and CHIP.
MACPAC serves as an independent source of information on Medicaid and CHIP, publishing issue briefs and data reports throughout the year to support policy analysis and program accountability. The Commission’s authorizing statute, 42 USC 1396, outlines a number of areas for analysis, including:
• payment;• eligibility; • enrollment and retention;• coverage;• access to care;• quality of care; and• the programs’ interaction with Medicare and the health care system generally.
MACPAC’s authorizing statute also requires the Commission to submit reports to Congress by March 15 and June 15 of each year. In carrying out its work, the Commission holds public meetings and regularly consults with state officials, congressional and executive branch staff, beneficiaries, health care providers, researchers, and policy experts.

MACStats: Medicaid and CHIP Data Book
Medicaid and CHIP Payment and Access Commission
December 2018


MACStats: Medicaid and CHIP Data Book iii
Commission Members and Terms
Commission Members and TermsPenny Thompson, MPA, Chair Ellicott City, MD
Stacey Lampkin, FSA, MAAA, MPA, Vice Chair Tallahassee, FL
Term Expires April 2019Brian Burwell IBM Watson Health Cambridge, MA
Toby Douglas, MPP, MPH Kaiser Permanente Davis, CA
Christopher Gorton, MD, MHSA Medford, MA
Stacey Lampkin, FSA, MAAA, MPA Mercer Government Human Services Consulting Tallahassee, FL
Penny Thompson, MPA Penny Thompson Consulting, LLC Ellicott City, MD
Alan Weil, JD, MPP Health Affairs Bethesda, MD
Term Expires April 2020Martha Carter, DHSc, MBA, APRN, CNM FamilyCare Health Centers Scott Depot, WV
Frederick Cerise, MD, MPH Parkland Health and Hospital System Dallas, TX
Kisha Davis, MD, MPH Casey Health Institute Gaithersburg, MD
Darin Gordon Gordon & Associates Nashville, TN
William Scanlon, PhD Independent Consultant Oak Hill, VA
Term Expires April 2021Melanie Bella, MBA Cityblock Health Philadelphia, PA
Leanna George Beneficiary Representative Benson, NC
Charles Milligan, JD, MPH UnitedHealthcare Community Plan of New Mexico Albuquerque, NM
Sheldon Retchin, MD, MSPH The Ohio State University Columbus, OH
Peter Szilagyi, MD, MPH University of California, Los Angeles Los Angeles, CA
Katherine Weno, DDS, JD Independent Public Health Consultant Iowa City, IA

December 2018iv
Commission StaffAnne L. Schwartz, PhD, Executive Director
Office of the Executive DirectorAnnie Andrianasolo, MBA Executive Administrator
Kathryn Ceja, Director of Communications
Kohl Fallin, MPS Communications Specialist
Policy DirectorsMoira Forbes, MBA Kate Kirchgraber, MA
Principal AnalystsKirstin Blom, MIPA
Martha Heberlein, MA
Joanne Jee, MPH Principal Analyst and Congressional Liaison
Erin McMullen, MPP
Jessica Morris, MPA Principal Analyst and Contracting Officer
Robert Nelb, MPH
Chris Park, MS
Kristal Vardaman, MSPH
Senior AnalystsKacey Buderi, MPA
Nevena Minor, MPP
Rick Van Buren, JD
AnalystsKayla Holgash, MPH Nisha Kurani, MPP
Research AssistantsMadeline Britvec Ilham Dehry
Operations and FinanceRicardo Villeta, MBA, Deputy Director of Operations, Finance, and Management
Jim Boissonnault, MA, Chief Information Officer
Allissa Jones, Administrative Assistant
Kevin Ochieng, IT Specialist
Ken Pezzella, CGFM, Chief Financial Officer
Brian Robinson, Financial Analyst
Eileen Wilkie, Administrative Officer
Commission Staff

MACStats: Medicaid and CHIP Data Book v
Table of Contents
Table of Contents
Commission Members and Terms ...................................................................................................................... iii
Commission Staff ................................................................................................................................................ iv
Introduction ..........................................................................................................................................................xi
SECTION 1: Overview—Key Statistics ........................................................................................................ 1
Key Points ........................................................................................................................................... 2
EXHIBIT 1: Medicaid and CHIP Enrollment as a Percentage of the U.S. Population, 2017 (millions) ...................................................................................................................... 3
EXHIBIT 2: Characteristics of Non-Institutionalized Individuals by Age and Source of Health Coverage, 2017 ..................................................................................................................... 4
EXHIBIT 3: National Health Expenditures by Type and Payer, 2016 ................................................... 9
EXHIBIT 4: Major Health Programs and Other Components of the Federal Budget as a Share of Federal Outlays, FYs 1965–2017 ...................................................................... 12
EXHIBIT 5: Medicaid as a Share of States’ Total Budgets and State-Funded Budgets, SFY 2016 ............................................................................................................................. 14
EXHIBIT 6: Federal Medical Assistance Percentages and Enhanced Federal Medical Assistance Percentages by State, FYs 2015–2019 ............................................................................ 17
SECTION 2: Trends ............................................................................................................................. 21
Key Points ......................................................................................................................................... 22
EXHIBIT 7: Medicaid Beneficiaries (Persons Served) by Eligibility Group, FYs 1975–2013 (thousands) ........................................................................................ 23
EXHIBIT 8: Medicaid Enrollment and Spending, FYs 1966—2017 ................................................ 25
EXHIBIT 9: Annual Growth in Medicaid Enrollment and Spending, FYs 1977—2017 .................. 26
EXHIBIT 10: Medicaid Enrollment and Total Spending Levels and Annual Growth, FYs 1966–2017 ............................................................................................................. 27

December 2018vi
Table of Contents
EXHIBIT 11: Full-Benefit Medicaid and CHIP Enrollment, Selected Months in 2013–2018 .......... 29
EXHIBIT 12: Historical and Projected National Health Expenditures by Payer for Selected Years, CYs 1970–2026 .................................................................................. 32
EXHIBIT 13: Medicaid as a Share of State Budgets Including and Excluding Federal Funds, SFYs 1990–2016 ........................................................................................................... 34
SECTION 3: Program Enrollment and Spending ....................................................................................... 37
Key Points ......................................................................................................................................... 38
Medicaid Overall
EXHIBIT 14: Medicaid Enrollment by State, Eligibility Group, and Dually Eligible Status .............. 39
EXHIBIT 14a: FY 2013 (thousands) ........................................................................ 39
EXHIBIT 14b: FY 2014 (thousands) ........................................................................ 42
EXHIBIT 15: Medicaid Full-Year Equivalent Enrollment by State and Eligibility Group .................. 44
EXHIBIT 15a: FY 2013 (thousands) ........................................................................ 44
EXHIBIT 15b: FY 2014 (thousands) ........................................................................ 47
EXHIBIT 16: Medicaid Spending by State, Category, and Source of Funds, FY 2017 (millions) .... 49
Medicaid Benefits
EXHIBIT 17: Total Medicaid Benefit Spending by State and Category, FY 2017 (millions) ........... 52
EXHIBIT 18: Distribution of Medicaid Benefit Spending by Eligibility Group and Service Category, FY 2013 ................................................................................................... 55
EXHIBIT 19: Medicaid Benefit Spending per Full-Year Equivalent Enrollee by Eligibility Group and Service Category, FY 2013 .......................................................................... 56
EXHIBIT 20: Distribution of Medicaid Enrollment and Benefit Spending by Users and Non-Users of Long-Term Services and Supports, FY 2013 ....................................... 57

MACStats: Medicaid and CHIP Data Book vii
Table of Contents
EXHIBIT 21: Medicaid Spending by State, Eligibility Group, and Dually Eligible Status ................ 58
EXHIBIT 21a: FY 2013 (millions) ............................................................................. 58
EXHIBIT 21b: FY 2014 (millions) ............................................................................ 60
EXHIBIT 22: Medicaid Benefit Spending per Full-Year Equivalent Enrollee by State and Eligibility Group ...................................................................................................... 62
EXHIBIT 22a: FY 2013 ............................................................................................. 62
EXHIBIT 22b: FY 2014 ............................................................................................. 65
EXHIBIT 23: Medicaid Benefit Spending per Full-Year Equivalent Enrollee for Newly Eligible Adult and All Enrollees by State, FY 2017 ............................................................................. 67
EXHIBIT 24: Medicaid Supplemental Payments to Hospital Providers by State, FY 2017 (millions) ......................................................................................................... 70
EXHIBIT 25: Medicaid Supplemental Payments to Non-Hospital Providers by State, FY 2017 (millions) ......................................................................................................... 72
EXHIBIT 26: Medicaid Gross Spending for Drugs by Delivery System and Brand or Generic Status, FY 2017 (millions) ............................................................................................ 75
EXHIBIT 27: Medicaid Drug Prescriptions by Delivery System and Brand or Generic Status, FY 2017 (thousands) .................................................................................................... 78
EXHIBIT 28: Medicaid Gross Spending and Rebates for Drugs by Delivery System, FY 2017 (millions) ......................................................................................................... 80
Medicaid Managed Care
EXHIBIT 29: Percentage of Medicaid Enrollees in Managed Care by State, July 1, 2016 .............. 83
EXHIBIT 30: Percentage of Medicaid Enrollees in Managed Care by State and Eligibility Group ............................................................................................................. 86
EXHIBIT 30a: FY 2013 ............................................................................................. 86
EXHIBIT 30b: FY 2014 ............................................................................................. 89

December 2018viii
Medicaid Program Administration
EXHIBIT 31: Total Medicaid Administrative Spending by State and Category, FY 2017 (millions) ......................................................................................................... 91
CHIP
EXHIBIT 32: Child Enrollment in CHIP and Medicaid by State, FY 2017 (thousands) ................... 94
EXHIBIT 33: CHIP Spending by State, FY 2017 (millions) ............................................................... 96
EXHIBIT 34: Federal CHIP Allotments, FYs 2016–2018 (millions) ................................................. 99
SECTION 4: Medicaid and CHIP Eligibility ..................................................................................... 101
Key Points ....................................................................................................................................... 102
EXHIBIT 35: Medicaid and CHIP Income Eligibility Levels as a Percentage of the Federal Poverty Level for Children and Pregnant Women by State, April 2018 .................... 103
EXHIBIT 36: Medicaid Income Eligibility Levels as a Percentage of the Federal Poverty Level for Non-Aged, Non-Disabled, Non-Pregnant Adults by State, April 2018 ................. 106
EXHIBIT 37: Medicaid Income Eligibility Levels as a Percentage of the Federal Poverty Level for Individuals Age 65 and Older and Persons with Disabilities by State, 2018 ........... 109
EXHIBIT 38: Income as a Percentage of the Federal Poverty Level for Various Family Sizes, 2018 ......................................................................................... 112
SECTION 5: Beneficiary Health, Service Use, and Access to Care .................................................. 115
Key Points ....................................................................................................................................... 116
EXHIBIT 39: Coverage, Demographic, and Health Characteristics of Non-Institutionalized Individuals Age 0–18 by Primary Source of Health Coverage, 2017 ....................... 117
EXHIBIT 40: Use of Care among Non-Institutionalized Individuals Age 0–18 by Primary Source of Health Coverage, 2017, NHIS Data ........................................................................ 120
EXHIBIT 41: Use of Care among Non-Institutionalized Individuals Age 0–18 by Primary Source of Health Coverage, 2016, MEPS Data ....................................................................... 122
Table of Contents

MACStats: Medicaid and CHIP Data Book ix
EXHIBIT 42: Measures of Access to Care among Non-Institutionalized Individuals Age 0–18 by Primary Source of Health Coverage, 2017 .................................................................... 124
EXHIBIT 43: Coverage, Demographic, and Health Characteristics of Non-Institutionalized Individuals Age 19–64 by Primary Source of Health Coverage, 2017 ............................ 126
EXHIBIT 44: Use of Care among Non-Institutionalized Individuals Age 19–64 by Primary Source of Health Coverage, 2017, NHIS Data .................................................................... 131
EXHIBIT 45: Use of Care among Non-Institutionalized Individuals Age 19–64 by Primary Source of Health Coverage, 2016, MEPS Data ................................................................................ 134
EXHIBIT 46: Measures of Access to Care among Non-Institutionalized Individuals Age 19–64 by Primary Source of Health Coverage, 2017 ................................................ 136
SECTION 6: Technical Guide to MACStats ..................................................................................... 139
Interpreting Medicaid and CHIP Enrollment and Spending Numbers ....................................................... 141
Understanding Data on Health and Other Characteristics of Medicaid and CHIP Populations ............ 143
Methodology for Adjusting Benefit Spending Data ..................................................................................... 144
EXHIBIT 47: Medicaid Benefit Spending in MSIS and CMS-64 Data by State ..................................... 146
EXHIBIT 47a: FY 2013 (millions) ................................................................................... 146
EXHIBIT 47b: FY 2014 (millions) ................................................................................... 148
EXHIBIT 48: Service Categories Used to Adjust FYs 2013 and 2014 Medicaid Benefit Spending in the MSIS to Match CMS-64 Totals .................................................................................. 150
Understanding Managed Care Enrollment and Spending Data ................................................................. 152
Endnotes .................................................................................................................................................. 153
Table of Contents


MACStats: Medicaid and CHIP Data Book xi
Introduction
IntroductionThis 2018 edition of the MACStats: Medicaid and CHIP Data Book presents the most current data available on Medicaid and the State Children’s Health Insurance Program (CHIP), two programs that provide a safety net for low-income populations who otherwise would not have access to health care coverage and that cover services other payers often do not cover.
The MACStats data book compiles the broad range of Medicaid and CHIP statistics that MACPAC regularly updates on macpac.gov into a single, end-of-year publication. Our purpose is to bring together in one place federal and state data on Medicaid and CHIP that come from multiple data sources and are often difficult to find.
The data book provides context for understanding these programs and how they fit in the larger health care system. For example: Medicaid and CHIP combined still account for a smaller share of total health care spending than Medicare, despite covering more people (Section 1). After experiencing high rates of growth in 2014 and 2015, Medicaid and CHIP enrollment has slowed and even decreased slightly in the past few years; enrollment grew by about 1 percent in 2016 and 2017 but decreased 2.2 percent in 2018 (Exhibit 11). Managed care enrollment and spending continue to climb (Exhibits 17 and 29). And children whose primary coverage source is Medicaid or CHIP are reported to have well-child checkups at rates slightly less than those with private coverage, but more than those who are uninsured (Exhibit 40).
This 2018 edition includes reprints of 11 exhibits that display enrollment and spending by eligibility group that could not be updated from last year’s publication due to a lack of available data caused by the transition from the Medicaid Statistical Information System (MSIS) to the Transformed MSIS (T-MSIS). While all states have begun submitting T-MSIS data to CMS, these data are still being verified for completeness and accuracy and are not available for publication at this time. When these data become available, we will provide
updated tables on our website. For several of the tables that are reprinted, there are two versions: the (a) version provides fiscal year (FY) 2013 data and the (b) version provides FY 2014 data for the states that had sufficient data. For the (b) version FY 2014 exhibits, we have not published national totals due to the number of states excluded.
The pages that follow are divided into six sections:
• an overview with key statistics on Medicaid and CHIP;
• trends in Medicaid spending, enrollment, and share of state budgets;
• Medicaid and CHIP enrollment and spending, with information provided by state, service category, and eligibility group;
• Medicaid and CHIP eligibility;
• measures of beneficiary health, use of services, and access to care; and
• a technical guide.
The technical guide describes the data sources used in MACStats and the methods that MACPAC uses to analyze these data. It also provides guidance in interpreting the exhibits and how specific data—such as those on enrollment and spending—may differ from each other or from those published elsewhere.
We would like to thank the many individuals at the Centers for Medicare & Medicaid Services and our contractors—the State Health Access Data Assistance Center (SHADAC) and Acumen, LLC—who provided their insights and assistance. We would also like to thank Paula Gordon and Dave Rinaldo and his talented team at CHIEF for providing valuable support in copyediting, formatting, and producing this data book.


SECTION 1
Overview— Key Statistics

December 20182
Section 1: Overview—Key Statistics
Section 1: Overview—Key Statistics
Key Points• In 2017, more than one-quarter of the U.S. population was enrolled in Medicaid or the State
Children's Health Insurance Program (CHIP) at some point during the year: 85.3 million in Medicaid and 9.5 million in CHIP (Exhibit 1).
• About 36.5 percent of children had Medicaid or CHIP coverage in 2017. Medicaid and CHIP enrollees of all ages were more likely to be in fair or poor health than individuals who were covered by private insurance or who were uninsured (Exhibit 2).
• Over 40 percent of all individuals enrolled in Medicaid or CHIP in 2017 had family incomes below 100 percent of the federal poverty level (FPL). About 59.4 percent of all individuals enrolled in Medicaid or CHIP had incomes of less than 138 percent FPL, the threshold used to determine eligibility for Medicaid in states that have expanded Medicaid to low-income adults (Exhibit 2).
• Medicaid and CHIP accounted for 17.5 percent of national health expenditures in calendar year 2016, less than either Medicare (20.1 percent) or private insurance (33.7 percent) (Exhibit 3).
• The share of the federal budget devoted to Medicaid and Medicare has grown steadily since the programs were enacted in 1965. Even so, in fiscal year 2017, Medicaid accounted for a smaller share (9.4 percent) than Medicare (14.9 percent) (Exhibit 4).
• Medicaid spending as a share of state budgets varies depending on whether federal funds are included. Considering only the state-funded portion of state budgets (that is, the portion financed by states through taxes and other means), Medicaid’s share was 15.9 percent in state fiscal year (SFY) 2016. When federal funds are included, Medicaid’s share was 28.7 percent in SFY 2016 (Exhibit 5).

MA
CStats: Medicaid and CH
IP Data Book
3
Section 1: Overview
—Key Statistics
MACStats Section 1
EXHIBIT 1. Medicaid and CHIP Enrollment as a Percentage of the U.S. Population, 2017 (millions)
Population Ever during FY 2017 Point in time during FY 2017 Point in time during CY 2017
Estimates based on administrative data (CMS)1 Survey data (NHIS)2
Medicaid enrollees 85.33 72.4 Not available
CHIP enrollees 9.5 6.9 Not available
Totals for Medicaid and CHIP 94.83 79.3 56.4
Census Bureau data Survey data (NHIS)2
U.S. population 326.24 325.14 318.7
Administrative and Census Bureau data Survey data (NHIS)2
Medicaid and CHIP enrollment as a percentage of U.S. population 29.1%1 24.4% 17.7%
Notes: FY is fiscal year. CY is calendar year. NHIS is National Health Interview Survey. Excludes the territories. Medicaid and CHIP enrollment numbers can vary for reasons including differences in the sources of data (e.g., administrative records versus survey interviews), categories of individuals included in the data (e.g., those receiving full versus limited benefits, those who are living in the community versus an institution such as a nursing facility), and the enrollment period examined (e.g., ever during the year versus at a point in time). For a more detailed discussion of enrollment numbers, see https://www.macpac.gov/macstats/data-sources-and-methods/.1 Estimates based on administrative data are from the President’s budget: point-in-time estimates are from the FY 2018 President's budget and ever-enrolled estimates are from the FY 2017 President's budget because the CMS Office of the Actuary did not produce ever-enrolled for the FY 2018 President's budget. Medicaid and CHIP enrollment numbers obtained from administrative data include individuals who received limited benefits (e.g., emergency services only). Combining administrative totals from Medicaid and CHIP may cause some individuals to be double-counted if they were enrolled in both programs during the year. Overcounting of enrollees in the administrative data may occur for other reasons—for example, an individual moved and may be enrolled in two states’ Medicaid programs during the year. Excludes about 1.4 million individuals in the territories.2 NHIS data exclude individuals in active-duty military and in institutions such as nursing facilities; also, surveys such as the NHIS generally do not classify limited benefits (e.g., emergency Medicaid) as Medicaid or CHIP coverage. The NHIS reports a combined total for the Medicaid and CHIP populations. Respondents are also known to underreport Medicaid and CHIP coverage.3 Ever-enrolled estimate was not available from CMS for the group of new adults enrolled under state expansions of Medicaid that began in January 2014; total reflects the point-in-time estimate for this group instead. As a result, the total is an underestimate of the number of people ever enrolled.4 The Census Bureau number in the ever-enrolled column was the estimated U.S. resident population as of September 2017 (the month with the largest count in FY 2017); the number of residents ever living in the United States during the year is not available. The Census Bureau point-in-time number is the average estimated monthly number of U.S. residents for FY 2017.
Source: MACPAC, 2018, analysis of the following: CMS, Office of the Actuary, 2017a, e-mail to MACPAC, August 15; CMS, Office of the Actuary, 2017b, e-mail to MACPAC, July 24; NHIS data; and U.S. Bureau of the Census, 2018, Monthly population estimates for the United States: April 1, 2010 to December 1, 2018, National totals: vintage 2017 https://www.census.gov/data/tables/2017/demo/popest/nation-total.html.

Decem
ber 20184
Section 1: Overview
—Key Statistics
MACStats Section 1
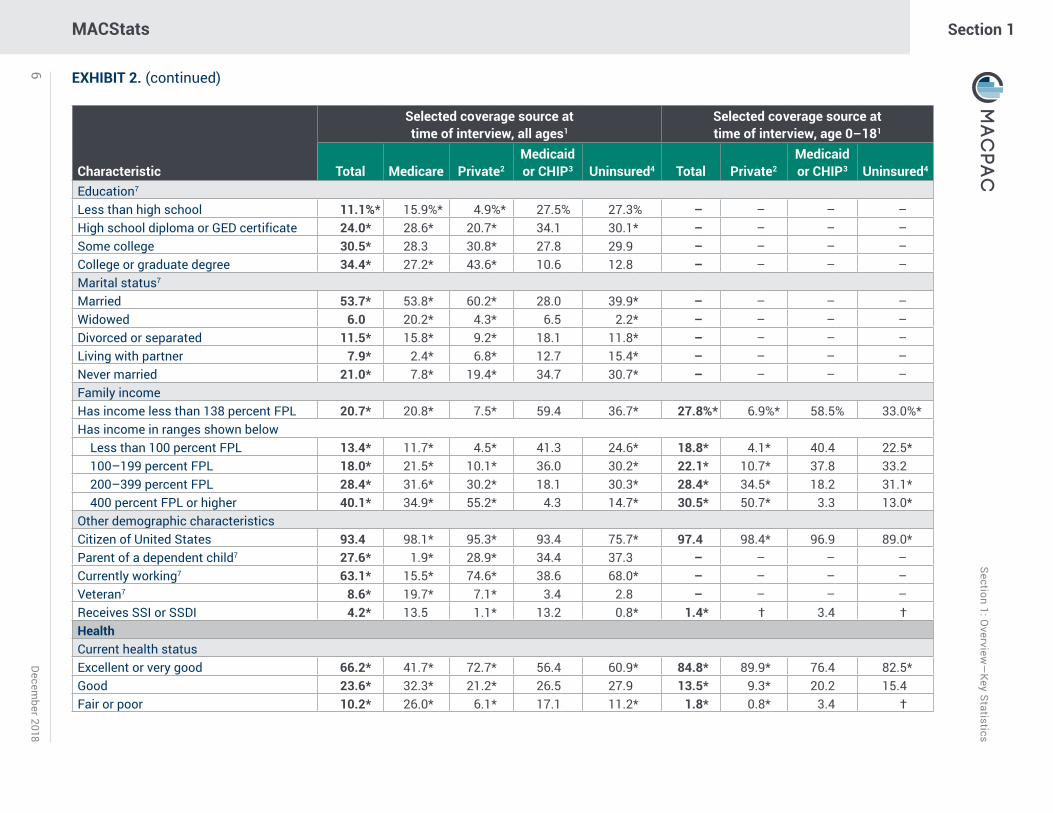
EXHIBIT 2. Characteristics of Non-Institutionalized Individuals by Age and Source of Health Coverage, 2017
Characteristic
Selected coverage source at time of interview, all ages1
Selected coverage source at time of interview, age 0–181
Total Medicare Private2Medicaid or CHIP3 Uninsured4 Total Private2
Medicaid or CHIP3 Uninsured4
Total (percent distribution across coverage sources)5 100.0% 17.3% 63.0% 17.7% 8.9% 100.0% 55.4% 36.5% 5.1%CoverageLength of time with any coverage during yearFull year 88.4* 99.4* 96.3* 94.2 – 92.5* 97.1* 95.9 –Part year 5.7 0.6* 3.7* 5.8 26.4* 4.6 2.9* 4.1 31.7*No coverage during year 5.9* – – – 73.6* 2.9* – – 68.3*Multiple coverage sources at time of interviewYes, any Medicare and Medicaid or CHIP combination6 1.8* 10.4 – 10.2 – † – † –Yes, any private and Medicaid or CHIP combination 0.5* – 0.7* 2.6 – 1.1* 2.0* 3.1 –Yes, any other combination 7.3* 42.3* 11.6* 0.6 – † † – –No 90.4* 47.3* 87.7 86.7 100.0* 98.8* 97.8 96.9 100.0*DemographicsAge0–18 24.5* † 21.5* 50.5 14.0* 100.0 100.0 100.0 100.019–64 60.0* 14.1* 66.7* 42.5 85.0* – – – –65 or older 15.5* 85.4* 11.8* 7.0 0.9* – – – –GenderMale 48.9* 44.8 49.6* 43.8 53.2* 51.1 51.2 50.0 55.1Female 51.1* 55.2 50.4* 56.2 46.8* 48.9 48.8 50.0 44.9RaceHispanic 18.0* 8.9* 12.4* 31.5 38.4* 25.0* 15.6* 37.7 38.2White, non-Hispanic 62.0* 75.9* 69.9* 39.8 40.8 53.0* 66.2* 34.4 42.9*Black, non-Hispanic 12.6* 10.3* 9.9* 21.4 14.1* 14.7* 9.6* 22.5 11.5*Other non-white, non-Hispanic 7.3 4.9* 7.8 7.3 6.6 7.3* 8.6* 5.5 7.4

MA
CStats: Medicaid and CH
IP Data Book
5
Section 1: Overview
—Key Statistics
MACStats Section 1
EXHIBIT 2. (continued)
Characteristic
Selected coverage source at time of interview, age 19–641
Selected coverage source at time of interview, age 65 or older1
Total Medicare Private2Medicaid or CHIP3 Uninsured4 Total Medicare Private2
Medicaid or CHIP3
Total (percent distribution across coverage sources)5 100.0% 4.1% 70.0% 12.5% 12.6% 100.0% 94.9% 47.8% 8.0%CoverageLength of time with any coverage during yearFull year 84.0* 98.7* 95.5* 91.3 – 99.1 99.6 99.7 99.4Part year 7.4 1.3* 4.5* 8.7 25.7* 0.5 0.4 † †
No coverage during year 8.6* – – – 74.3* 0.4* – – –Multiple coverage sources at time of interviewYes, any Medicare and Medicaid or CHIP combination6 1.2* 29.6* – 9.6 – 7.0* 7.3* – 86.6Yes, any private and Medicaid or CHIP combination 0.3* – 0.4* 2.4 – – – – –Yes, any other combination 0.7 16.0 0.9 † – 44.3* 46.7* 92.7* 4.9No 97.8* 54.3* 98.6* 87.5 100.0* 48.8* 46.0* 7.3 8.5DemographicsAge0–18 – – – – – – – – –19–64 100.0 100.0 100.0 100.0 100.0 – – – –65 or older – – – – – 100.0 100.0 100.0 100.0GenderMale 49.0* 47.0* 50.0* 37.6 53.1* 44.8* 44.4* 44.7* 37.5Female 51.0* 53.0* 50.0* 62.4 46.9* 55.2* 55.6* 55.3* 62.5RaceHispanic 17.7* 13.8* 12.9* 25.2 38.4* 8.3* 7.8* 4.1* 25.1White, non-Hispanic 61.7* 63.1* 68.2* 46.2 40.6* 77.3* 78.3* 85.9* 40.2Black, non-Hispanic 12.7* 18.0 10.6* 20.6 14.5* 9.1* 9.0* 6.2* 19.2Other non-white, non-Hispanic 7.9 5.2* 8.3 8.0 6.4 5.2* 4.8* 3.7* 15.5
Decem
ber 20186
Section 1: Overview
—Key Statistics
MACStats Section 1
EXHIBIT 2. (continued)
Characteristic
Selected coverage source at time of interview, all ages1
Selected coverage source at time of interview, age 0–181
Total Medicare Private2Medicaid or CHIP3 Uninsured4 Total Private2
Medicaid or CHIP3 Uninsured4
Education7
Less than high school 11.1%* 15.9%* 4.9%* 27.5% 27.3% – – – –High school diploma or GED certificate 24.0* 28.6* 20.7* 34.1 30.1* – – – –Some college 30.5* 28.3 30.8* 27.8 29.9 – – – –College or graduate degree 34.4* 27.2* 43.6* 10.6 12.8 – – – –Marital status7
Married 53.7* 53.8* 60.2* 28.0 39.9* – – – –Widowed 6.0 20.2* 4.3* 6.5 2.2* – – – –Divorced or separated 11.5* 15.8* 9.2* 18.1 11.8* – – – –Living with partner 7.9* 2.4* 6.8* 12.7 15.4* – – – –Never married 21.0* 7.8* 19.4* 34.7 30.7* – – – –Family incomeHas income less than 138 percent FPL 20.7* 20.8* 7.5* 59.4 36.7* 27.8%* 6.9%* 58.5% 33.0%*Has income in ranges shown below
Less than 100 percent FPL 13.4* 11.7* 4.5* 41.3 24.6* 18.8* 4.1* 40.4 22.5*100–199 percent FPL 18.0* 21.5* 10.1* 36.0 30.2* 22.1* 10.7* 37.8 33.2200–399 percent FPL 28.4* 31.6* 30.2* 18.1 30.3* 28.4* 34.5* 18.2 31.1*400 percent FPL or higher 40.1* 34.9* 55.2* 4.3 14.7* 30.5* 50.7* 3.3 13.0*
Other demographic characteristicsCitizen of United States 93.4 98.1* 95.3* 93.4 75.7* 97.4 98.4* 96.9 89.0*Parent of a dependent child7 27.6* 1.9* 28.9* 34.4 37.3 – – – –Currently working7 63.1* 15.5* 74.6* 38.6 68.0* – – – –Veteran7 8.6* 19.7* 7.1* 3.4 2.8 – – – –Receives SSI or SSDI 4.2* 13.5 1.1* 13.2 0.8* 1.4* † 3.4 †HealthCurrent health statusExcellent or very good 66.2* 41.7* 72.7* 56.4 60.9* 84.8* 89.9* 76.4 82.5*Good 23.6* 32.3* 21.2* 26.5 27.9 13.5* 9.3* 20.2 15.4Fair or poor 10.2* 26.0* 6.1* 17.1 11.2* 1.8* 0.8* 3.4 †

MA
CStats: Medicaid and CH
IP Data Book
7
Section 1: Overview
—Key Statistics
MACStats Section 1
EXHIBIT 2. (continued)
Characteristic
Selected coverage source at time of interview, age 19–641
Selected coverage source at time of interview, age 65 or older1
Total Medicare Private2Medicaid or CHIP3 Uninsured4 Total Medicare Private2
Medicaid or CHIP3
Education7
Less than high school 10.0%* 22.6% 4.2%* 24.9% 26.9% 15.2%* 14.8%* 9.1%* 43.5%High school diploma or GED certificate 23.2* 35.2 19.5* 35.5 30.2* 27.0 27.5 27.5 25.1Some college 31.3 33.1 31.5 29.4 30.1 27.4* 27.5* 27.0* 18.2College or graduate degree 35.4* 9.0 44.8* 10.2 12.8* 30.4* 30.2* 36.3* 13.1Marital status7
Married 52.9* 36.4* 59.9* 27.5 40.1* 56.8* 56.7* 62.1* 30.5Widowed 1.8* 5.4* 1.5* 2.9 1.6* 22.3* 22.6* 20.6* 28.4Divorced or separated 10.8* 26.2* 8.8* 16.7 11.7* 14.2* 14.0* 11.6* 26.3Living with partner 9.4* 5.3* 7.7* 14.4 15.5 1.9 1.9 1.7 †Never married 25.1* 26.7* 22.1* 38.4 31.0* 4.8* 4.7* 4.1* 12.4Family incomeHas income less than 138 percent FPL 18.8* 43.7* 7.7* 58.9 37.1* 16.9* 16.7* 8.0* 68.1Has income in ranges below
Less than 100 percent FPL 12.5* 28.9* 4.8* 41.5 24.9* 8.9* 8.7* 3.5* 46.2100–199 percent FPL 16.1* 34.6 9.4* 34.1 29.6* 19.1* 19.4* 13.2* 35.0200–399 percent FPL 27.4* 25.3* 28.2* 18.7 30.3* 32.2* 32.7* 33.4* 13.9400 percent FPL or higher 44.0* 10.8* 57.6* 5.4 15.0* 39.6* 39.1* 49.9* 4.7
Other demographic characteristicsCitizen of United States 90.8 97.7* 93.6* 90.0 73.8* 97.4* 98.1* 98.7* 89.3Parent of a dependent child7 34.6* 10.9* 33.9* 39.9 37.7 0.5 0.4 0.5 †Currently working7 74.7* 10.9* 83.8* 44.0 68.6* 17.9* 16.3* 22.7* 6.0Veteran7 5.3* 7.5* 4.3* 2.7 2.8 21.5* 21.8* 22.5* 7.8Receives SSI or SSDI 5.3* 72.3* 1.4* 21.8 0.8* 3.9* 3.9* 0.7* 31.8HealthCurrent health statusExcellent or very good 63.8* 14.1* 71.0* 39.2 57.5* 46.1* 46.1* 51.4* 17.4Good 25.4* 30.9 23.1* 33.8 29.9* 32.4* 32.5* 32.2 27.6Fair or poor 10.8* 55.0* 6.0* 27.0 12.6* 21.5* 21.4* 16.4* 55.0

Decem
ber 20188
Section 1: Overview
—Key Statistics
MACStats Section 1
EXHIBIT 2. (continued)
Notes: GED is General Equivalence Diploma. FPL is federal poverty level. SSI is Supplemental Security Income. SSDI is Social Security Disability Insurance. Percentage calculations for each item in the exhibit exclude individuals with missing and unknown values. Standard errors are available online in the downloadable Excel version of this exhibit at https://www.macpac.gov/publication/characteristics-of-non-institutionalized-individuals-by-source-of-health-insurance/. The individual components listed under the subcategories are not always mutually exclusive and may not sum to 100 percent. Due to differences in methodology (such as the wording of questions, length of recall periods, and prompts or probes used to elicit responses), estimates obtained from different survey data sources will vary. For example, the National Health Interview Survey (NHIS) is known to produce higher estimates of service use than the Medical Expenditures Panel Survey (MEPS). For purposes of comparing groups of individuals (as in this exhibit), the NHIS provides the most recent information available. For other purposes, such as measuring levels of use relative to a particular benchmark or goal, it may be appropriate to consult estimates from MEPS or another source.
* Difference from Medicaid or CHIP is statistically significant at the 0.05 level.
† Estimate is unreliable because it has a relative standard error greater than or equal to 30 percent.
– Dash indicates zero.1 Total includes all non-institutionalized individuals, regardless of coverage source. In this exhibit, the values across health insurance coverage types may not sum to 100 percent for each age group because individuals may have multiple sources of coverage and because not all types of coverage are displayed. Other MACStats exhibits apply a hierarchy to assign individuals with multiple coverage sources to a primary source, and may therefore have different results than those shown here. Coverage source is defined as of the time of the survey interview. Because an individual may have multiple coverage sources or changes over time, responses to survey questions may reflect characteristics or experiences associated with a coverage source other than the one assigned in this exhibit.2 Private health insurance coverage excludes plans that paid for only one type of service, such as accidents or dental care.3 Medicaid or CHIP also includes persons covered by other state-sponsored health plans.4 Individuals were defined as uninsured if they did not have any private health insurance, Medicaid, CHIP, Medicare, state-sponsored or other government-sponsored health plan, or military plan. Individuals were also defined as uninsured if they had only Indian Health Service coverage or only a private plan that paid for one type of service, such as accidents or dental care.5 Components may not sum to 100 percent because individuals may have multiple sources of coverage and because not all types of coverage are displayed.6 NHIS and other survey data underestimate the number of individuals dually enrolled in Medicare and Medicaid, in part because most surveys do not count those whose only Medicaid benefit is payment of Medicare premiums and cost sharing as having Medicaid coverage.7 Information is limited to those age 19 or older.
Source: MACPAC, 2018, analysis of NHIS data.

MA
CStats: Medicaid and CH
IP Data Book
9
Section 1: Overview
—Key Statistics
MACStats Section 1
EXHIBIT 3. National Health Expenditures by Type and Payer, 2016
Type of expenditure
Payer amount (millions)
Total Medicaid CHIP MedicarePrivate
insurance
Other health
insurance1
Other third party
payers2Out of pocket
Total payer expenditures $3,337,248 $565,550 $16,883 $672,093 $1,123,372 $108,945 $497,868 $352,537
Hospital care 1,082,479 189,824 4,466 267,504 426,671 62,651 98,693 32,671
Physician and clinical services 664,882 72,564 3,911 149,964 287,254 26,069 66,206 58,913
Dental services 124,373 12,122 1,829 511 57,729 1,783 470 49,929
Other professional services3 91,980 7,263 355 22,582 31,576 – 7,350 22,854
Home health care 92,364 33,981 62 37,376 9,641 652 2,600 8,052
Other non-durable medical products4 62,201 – – 2,050 – – – 60,151
Prescription drugs 328,588 33,445 1,750 95,393 142,617 8,477 1,873 45,032
Durable medical equipment5 50,952 7,653 174 7,476 9,932 – 869 24,848
Nursing care facilities and continuing care retirement communities6 162,685 49,991 14 37,477 14,809 5,042 11,574 43,778
Other health, residential, and personal care services7 173,486 98,379 1,398 4,944 13,538 968 47,950 6,310
Administration8 263,652 60,327 2,923 46,814 129,605 3,305 20,679 –
Public health activity 82,187 – – – – – 82,187 –
Investment 157,418 – – – – – 157,418 –

Decem
ber 201810
Section 1: Overview
—Key Statistics
MACStats Section 1
EXHIBIT 3. (continued)
Type of expenditure
Share of total
Total Medicaid CHIP MedicarePrivate
insurance
Other health
insurance1
Other third party
payers2Out of pocket
Total payer share of expenditures 100.0% 16.9% 0.5% 20.1% 33.7% 3.3% 14.9% 10.6%
Hospital care 100.0 17.5 0.4 24.7 39.4 5.8 9.1 3.0
Physician and clinical services 100.0 10.9 0.6 22.6 43.2 3.9 10.0 8.9
Dental services 100.0 9.7 1.5 0.4 46.4 1.4 0.4 40.1
Other professional services3 100.0 7.9 0.4 24.6 34.3 – 8.0 24.8
Home health care 100.0 36.8 0.1 40.5 10.4 0.7 2.8 8.7
Other non-durable medical products4 100.0 – – 3.3 – – – 96.7
Prescription drugs 100.0 10.2 0.5 29.0 43.4 2.6 0.6 13.7
Durable medical equipment5 100.0 15.0 0.3 14.7 19.5 – 1.7 48.8
Nursing care facilities and continuing care retirement communities6 100.0 30.7 0.0 23.0 9.1 3.1 7.1 26.9
Other health, residential, and personal care services7 100.0 56.7 0.8 2.8 7.8 0.6 27.6 3.6
Administration8 100.0 22.9 1.1 17.8 49.2 1.3 7.8 –
Public health activity 100.0 – – – – – 100.0 –
Investment 100.0 – – – – – 100.0 –
Notes: Every five years the National Health Expenditure Accounts undergo a comprehensive revision that includes the incorporation of newly available source data, methodological and definitional changes, and benchmark estimates from the U.S. Census Bureau’s quinquennial Economic Census. The values shown here reflect the comprehensive revision made in 2014, and thus, the figures shown here may reflect methodological and definitional shifts within payer and service categories from prior publications of MACStats. For example, the 2014 methodology implemented a new method for allocating Medicaid managed care premiums to the goods and services categories for states that have a large percentage of Medicaid managed care spending. That change caused a downward revision for hospitals and home health and an upward revision for other service categories.
MA
CStats: Medicaid and CH
IP Data Book
11
Section 1: Overview
—Key Statistics
MACStats Section 1
EXHIBIT 3. (continued)
– Dash indicates zero; 0.0% indicates an amount less than 0.05% that rounds to zero.1 U.S. Department of Defense and U.S. Department of Veterans Affairs.2 Includes all other public and private programs and expenditures except for out-of-pocket amounts.3 The other professional services category includes services provided in establishments operated by health practioners other than physicians and dentists, including those provided by private-duty nurses, chiropractors, podiatrists, optometrists, and physical, occupational, and speech therapists.4 The other non-durable medical products category includes the retail sales of non-prescription drugs and medical sundries.5 The durable medical equipment category includes retail sales of items such as contact lenses, eyeglasses, and other ophthalmic products, surgical and orthopedic products, hearing aids, wheelchairs, and medical equipment rentals.6 The nursing care facilities and continuing care retirement communities category includes nursing and rehabilitative services provided in freestanding nursing home facilities that are generally provided for an extended period of time by registered or licensed practical nurses and other staff.7 The other health, residential, and personal care category includes spending for Medicaid home and community-based waivers, care provided in residential facilities for people with intellectual disabilities or mental health and substance abuse disorders, ambulance services, school health, and worksite health care.8 The administrative category includes the administrative cost of health care programs (e.g., Medicare and Medicaid) and the net cost of private health insurance (administrative costs, as well as additions to reserves, rate credits and dividends, premium taxes, and plan profits or losses).
Sources: Office of the Actuary (OACT), CMS, 2017, National health expenditures by type of service and source of funds: Calendar years 1960–2016, Baltimore, MD: OACT, https://www.cms.gov/Research-Statistics-Data-and-Systems/Statistics-Trends-and-Reports/NationalHealthExpendData/Downloads/NHE2016.zip. OACT, 2017, National health expenditure accounts: Methodology paper, 2016, Baltimore, MD: OACT, https://www.cms.gov/Research-Statistics-Data-and-Systems/Statistics-Trends-and-Reports/NationalHealthExpendData/Downloads/DSM-16.pdf. OACT, 2014, Summary of 2014 comprehensive revision to the national health expenditure accounts, Baltimore, MD: OACT, https://www.cms.gov/Research-Statistics-Data-and-Systems/Statistics-Trends-and-Reports/NationalHealthExpendData/Downloads/benchmark2014.pdf.

December 201812
Section 1: Overview—Key Statistics
MAC
Stat
sSe
ctio
n 1
EXHIBIT 4. Major Health Programs and Other Components of the Federal Budget as a Share of Federal Outlays, FYs 1965–2017
Discretionary, non-defense
Net interest
Discretionary, defense
Other mandatory programs
Social security
Medicare
Exchange subsidies
CHIP
Medicaid
Fiscal year

MA
CStats: Medicaid and CH
IP Data Book
13
Section 1: Overview
—Key Statistics
MACStats Section 1
EXHIBIT 4. (continued)
Fiscal year
Mandatory programs Discretionary programs
Net interestMedicaid CHIP MedicareExchange subsidies
Social Security Other Defense
Non-defense
1965 0.2% – – – 14.4% 12.3% 43.2% 22.6% 7.3%1970 1.4 – 3.0% – 15.2 11.6 41.9 19.6 7.31975 2.1 – 3.7 – 19.1 20.6 26.4 21.2 7.01980 2.4 – 5.2 – 19.8 16.9 22.8 24.0 8.91985 2.4 – 6.8 – 19.7 13.5 26.7 17.2 13.71990 3.3 – 7.6 – 19.7 14.7 24.0 16.0 14.71991 4.0 – 7.7 – 20.1 13.2 24.1 16.1 14.71992 4.9 – 8.4 – 20.6 13.0 21.9 16.7 14.41993 5.4 – 9.1 – 21.4 11.7 20.7 17.5 14.11994 5.6 – 9.7 – 21.7 12.1 19.3 17.7 13.91995 5.9 – 10.4 – 22.0 10.5 18.0 17.9 15.31996 5.9 – 11.0 – 22.2 11.3 17.0 17.1 15.41997 6.0 – 11.7 – 22.6 10.3 17.0 17.2 15.21998 6.1 0.0% 11.5 – 22.8 11.6 16.4 17.1 14.61999 6.3 0.0 11.0 – 22.7 12.7 16.2 17.4 13.52000 6.6 0.1 10.9 – 22.7 13.0 16.5 17.9 12.52001 6.9 0.2 11.5 – 23.0 12.4 16.4 18.4 11.12002 7.3 0.2 11.3 – 22.5 13.7 17.4 19.1 8.52003 7.4 0.2 11.4 – 21.8 13.9 18.7 19.4 7.12004 7.7 0.2 11.6 – 21.4 13.1 19.8 19.2 7.02005 7.4 0.2 11.9 – 21.0 12.9 20.0 19.2 7.42006 6.8 0.2 12.2 – 20.5 13.4 19.6 18.7 8.52007 7.0 0.2 13.6 – 21.3 11.0 20.1 18.1 8.72008 6.8 0.2 12.9 – 20.5 13.0 20.5 17.5 8.52009 7.1 0.2 12.1 – 19.3 20.8 18.7 16.5 5.32010 7.9 0.2 12.9 – 20.3 14.1 19.9 19.0 5.72011 7.6 0.2 13.3 – 20.1 14.9 19.4 18.0 6.42012 7.1 0.3 13.2 – 21.7 15.2 19.0 17.4 6.22013 7.7 0.3 14.2 – 23.4 13.2 18.1 16.7 6.42014 8.6 0.3 14.4 0.4% 24.1 12.1 17.0 16.6 6.52015 9.5 0.3 14.6 0.7 23.9 13.2 15.8 15.9 6.12016 9.6 0.4 15.3 0.8 23.6 13.4 15.2 15.6 6.22017 9.4 0.4 14.9 1.0 23.6 14.0 14.8 15.3 6.6
Notes: FY is fiscal year.– Dash indicates zero; 0.0% indicates amounts less than 0.05% that round to zero.Source: MACPAC, 2018, analysis of Office of Management and Budget (OMB), Tables 6.1, 8.5, and 8.7, in Historical tables, budget of the United States Government, fiscal year 2019, Washington, DC: OMB, https://www.gpo.gov/fdsys/search/pagedetails.action?granuleId=&packageId=BUDGET-2019-TAB.

Decem
ber 201814
Section 1: Overview
—Key Statistics
MACStats Section 1
EXHIBIT 5. Medicaid as a Share of States’ Total Budgets and State-Funded Budgets, SFY 2016
State
Total budget (including state and federal funds) State-funded budget
Dollars (millions)
Total spending as a share of total budget1
Dollars (millions)
State-funded spending as a share of state-funded budget1
Medicaid
Elementary and secondary
educationHigher
education Medicaid
Elementary and secondary
educationHigher
educationTotal $1,898,194 28.7% 19.6% 10.5% $1,306,260 15.9% 24.5% 13.7%Alabama 25,838 24.6 20.7 20.5 16,203 12.1 26.8 25.5Alaska 10,032 17.0 16.4 8.0 6,755 9.4 21.2 10.0Arizona 39,682 29.0 15.0 15.8 25,515 11.1 18.9 22.2Arkansas 23,961 27.4 14.7 14.5 16,563 8.9 18.0 20.9California 250,899 32.5 20.7 7.2 160,209 17.7 28.4 8.2Colorado 36,727 24.5 23.7 14.7 27,210 13.2 29.7 18.6Connecticut 31,842 22.7 14.9 10.0 25,626 14.1 16.5 11.3Delaware 10,236 19.8 23.5 4.1 8,085 9.2 27.2 4.6District of Columbia2 12,552 22.7 16.5 1.3 9,348 8.4 19.4 1.5Florida 72,319 32.2 18.7 9.7 47,013 20.7 25.1 14.8Georgia 47,534 20.9 24.5 18.8 33,638 9.8 27.7 26.4Hawaii 13,836 16.4 14.2 9.4 11,273 6.9 15.5 11.3Idaho 7,335 26.4 25.3 8.4 4,649 15.8 33.9 13.1Illinois 54,347 29.5 17.2 1.6 38,604 13.8 18.2 1.7Indiana 31,406 35.9 28.9 6.2 18,958 14.3 42.4 10.3Iowa 23,094 22.8 15.7 25.7 16,766 13.5 18.9 32.3Kansas 15,123 21.3 29.4 18.2 11,488 12.2 34.6 18.8Kentucky 32,699 30.3 16.3 24.1 20,517 10.2 21.9 34.1Louisiana 27,735 29.0 19.2 10.2 18,479 15.2 23.1 14.9Maine 8,040 33.0 17.2 3.9 5,504 19.1 21.5 5.7Maryland 40,779 24.3 18.1 14.4 28,745 13.4 22.0 19.2Massachusetts 61,285 24.7 11.3 9.9 50,238 13.0 11.8 12.1Michigan 54,413 31.1 25.2 4.1 33,541 14.0 35.9 6.4Minnesota 36,798 30.4 25.3 4.7 26,481 17.9 32.4 6.5Mississippi 19,766 26.1 16.7 19.3 11,900 11.4 21.6 30.4

MA
CStats: Medicaid and CH
IP Data Book
15
Section 1: Overview
—Key Statistics
MACStats Section 1
EXHIBIT 5. (continued)
State
Total budget (including state and federal funds) State-funded budget
Dollars (millions)
Total spending as a share of total budget1
Dollars (millions)
State-funded spending as a share of state-funded budget1
Medicaid
Elementary and secondary
educationHigher
education Medicaid
Elementary and secondary
educationHigher
educationMissouri $24,628 37.2% 23.0% 4.8% $16,951 26.1% 27.7% 6.9%Montana 6,384 20.3 15.8 10.7 4,014 9.6 21.0 16.0Nebraska 11,610 17.1 14.2 23.9 8,621 11.1 15.2 27.9Nevada 12,918 25.0 18.8 6.6 8,267 9.1 26.1 10.3New Hampshire 5,834 33.6 19.6 2.4 3,676 20.7 26.2 3.7New Jersey 56,540 25.0 24.3 8.1 42,186 12.0 30.5 10.8New Mexico 18,083 29.9 17.4 16.9 10,708 11.1 25.5 22.4New York 150,707 31.9 19.6 7.1 101,231 16.7 25.3 10.2North Carolina 44,439 31.0 23.6 13.5 31,432 15.9 28.6 18.9North Dakota 7,459 15.4 15.4 17.2 5,852 7.1 17.2 19.9Ohio 67,450 37.7 16.7 4.0 55,000 35.3 17.1 4.9Oklahoma 22,719 23.5 15.4 25.0 15,063 14.5 19.3 32.8Oregon 37,266 22.3 12.4 3.4 26,949 7.0 14.8 4.6Pennsylvania 76,354 36.6 18.1 2.5 49,281 24.2 23.1 3.9Rhode Island 8,627 29.8 14.9 12.9 5,750 18.7 19.1 19.0South Carolina 22,948 27.3 19.1 19.7 15,334 12.1 22.3 28.8South Dakota 4,172 20.6 14.4 20.0 2,801 13.4 15.6 27.4Tennessee 31,933 34.4 17.7 14.4 19,366 21.3 23.7 22.7Texas 122,754 33.8 24.5 13.8 76,841 23.1 32.7 17.0Utah 13,643 18.7 25.6 13.6 10,061 8.9 30.4 18.4Vermont 5,562 29.5 31.9 1.7 3,570 18.7 46.2 2.6Virginia 49,089 18.1 14.8 15.1 39,251 11.6 16.0 15.9Washington 41,779 18.1 23.4 14.5 29,972 7.6 30.1 20.2West Virginia 16,172 21.8 15.2 12.2 11,666 7.9 17.5 16.7Wisconsin 45,730 20.1 15.7 14.6 34,971 12.1 18.4 14.3Wyoming 5,116 11.4 15.8 7.6 4,138 7.0 19.5 9.3
Decem
ber 201816
Section 1: Overview
—Key Statistics
MACStats Section 1
EXHIBIT 5. (continued)
Notes: SFY is state fiscal year. Total budget includes federal and all other funds. State-funded budget includes state general funds, other state funds, and bonds. Other state funds are amounts from revenue sources that are restricted by law for particular government functions or activities, which for Medicaid includes provider taxes and local funds. Medicaid, elementary and secondary education, and higher education represent the largest total budget shares among functions broken out separately by the National Association of State Budget Officers (NASBO). Functions not shown here are transportation, corrections, public assistance, and all other (includes hospitals, economic development, housing environmental programs, CHIP, parks and recreation, natural resources, and air and water transportation). Medicaid spending amounts exclude administrative costs but include Medicare Part D phased-down state contribution (also referred to as clawback) payments.1 Total and state-funded budget shares should be viewed with caution because they reflect varying state practices. For example, because federal reimbursements for Medicaid expenditures funded from the General Revenue Fund (GRF) are deposited into the GRF, Ohio's general revenue expenditures look higher and conversely make Ohio's federal expenditures look lower relative to most other states that don't follow this practice. In addition, in many states, some functions—particularly elementary and secondary education—may be partially funded outside of the state budget by local governments.2 This is the first year that the NASBO state expenditure report includes the District of Columbia.
Source: NASBO, 2017, State expenditure report: Examining fiscal 2015–2017 state spending, Washington, DC: NASBO, https://higherlogicdownload.s3.amazonaws.com/NASBO/9d2d2db1-c943-4f1b-b750-0fca152d64c2/UploadedImages/SER%20Archive/State_Expenditure_Report__Fiscal_2015-2017_-S.pdf.
MA
CStats: Medicaid and CH
IP Data Book
17
Section 1: Overview
—Key Statistics
MACStats Section 1
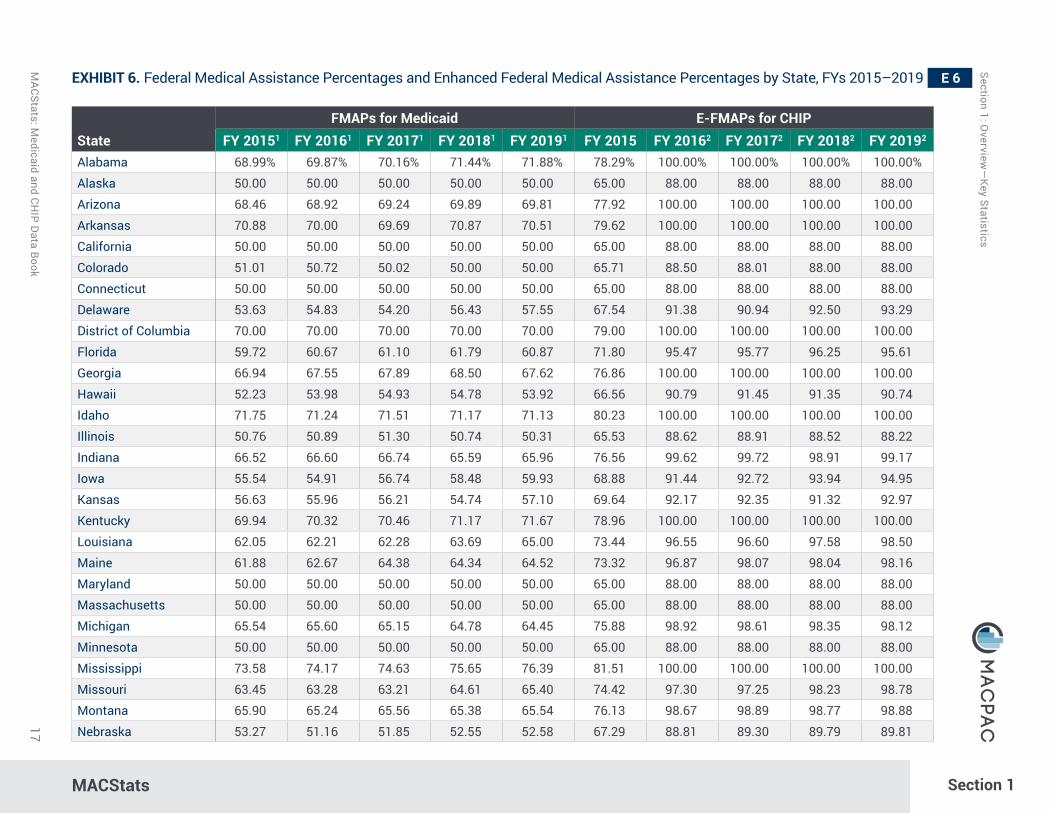
EXHIBIT 6. Federal Medical Assistance Percentages and Enhanced Federal Medical Assistance Percentages by State, FYs 2015–2019
StateFMAPs for Medicaid E-FMAPs for CHIP
FY 2015 1 FY 2016 1 FY 2017 1 FY 20181 FY 20191 FY 2015 FY 2016 2 FY 2017 2 FY 20182 FY 20192
Alabama 68.99% 69.87% 70.16% 71.44% 71.88% 78.29% 100.00% 100.00% 100.00% 100.00%
Alaska 50.00 50.00 50.00 50.00 50.00 65.00 88.00 88.00 88.00 88.00
Arizona 68.46 68.92 69.24 69.89 69.81 77.92 100.00 100.00 100.00 100.00
Arkansas 70.88 70.00 69.69 70.87 70.51 79.62 100.00 100.00 100.00 100.00
California 50.00 50.00 50.00 50.00 50.00 65.00 88.00 88.00 88.00 88.00
Colorado 51.01 50.72 50.02 50.00 50.00 65.71 88.50 88.01 88.00 88.00
Connecticut 50.00 50.00 50.00 50.00 50.00 65.00 88.00 88.00 88.00 88.00
Delaware 53.63 54.83 54.20 56.43 57.55 67.54 91.38 90.94 92.50 93.29
District of Columbia 70.00 70.00 70.00 70.00 70.00 79.00 100.00 100.00 100.00 100.00
Florida 59.72 60.67 61.10 61.79 60.87 71.80 95.47 95.77 96.25 95.61
Georgia 66.94 67.55 67.89 68.50 67.62 76.86 100.00 100.00 100.00 100.00
Hawaii 52.23 53.98 54.93 54.78 53.92 66.56 90.79 91.45 91.35 90.74
Idaho 71.75 71.24 71.51 71.17 71.13 80.23 100.00 100.00 100.00 100.00
Illinois 50.76 50.89 51.30 50.74 50.31 65.53 88.62 88.91 88.52 88.22
Indiana 66.52 66.60 66.74 65.59 65.96 76.56 99.62 99.72 98.91 99.17
Iowa 55.54 54.91 56.74 58.48 59.93 68.88 91.44 92.72 93.94 94.95
Kansas 56.63 55.96 56.21 54.74 57.10 69.64 92.17 92.35 91.32 92.97
Kentucky 69.94 70.32 70.46 71.17 71.67 78.96 100.00 100.00 100.00 100.00
Louisiana 62.05 62.21 62.28 63.69 65.00 73.44 96.55 96.60 97.58 98.50
Maine 61.88 62.67 64.38 64.34 64.52 73.32 96.87 98.07 98.04 98.16
Maryland 50.00 50.00 50.00 50.00 50.00 65.00 88.00 88.00 88.00 88.00
Massachusetts 50.00 50.00 50.00 50.00 50.00 65.00 88.00 88.00 88.00 88.00
Michigan 65.54 65.60 65.15 64.78 64.45 75.88 98.92 98.61 98.35 98.12
Minnesota 50.00 50.00 50.00 50.00 50.00 65.00 88.00 88.00 88.00 88.00
Mississippi 73.58 74.17 74.63 75.65 76.39 81.51 100.00 100.00 100.00 100.00
Missouri 63.45 63.28 63.21 64.61 65.40 74.42 97.30 97.25 98.23 98.78
Montana 65.90 65.24 65.56 65.38 65.54 76.13 98.67 98.89 98.77 98.88
Nebraska 53.27 51.16 51.85 52.55 52.58 67.29 88.81 89.30 89.79 89.81

Decem
ber 201818
Section 1: Overview
—Key Statistics
MACStats Section 1
EXHIBIT 6. (continued)
StateFMAPs for Medicaid E-FMAPs for CHIP
FY 2015 1 FY 2016 1 FY 2017 1 FY 20181 FY 20191 FY 2015 FY 2016 2 FY 2017 2 FY 20182 FY 20192
Nevada 64.36% 64.93% 64.67% 65.75% 64.87% 75.05% 98.45% 98.27% 99.03% 98.41%
New Hampshire 50.00 50.00 50.00 50.00 50.00 65.00 88.00 88.00 88.00 88.00
New Jersey 50.00 50.00 50.00 50.00 50.00 65.00 88.00 88.00 88.00 88.00
New Mexico 69.65 70.37 71.13 72.16 72.26 78.76 100.00 100.00 100.00 100.00
New York 50.00 50.00 50.00 50.00 50.00 65.00 88.00 88.00 88.00 88.00
North Carolina 65.88 66.24 66.88 67.61 67.16 76.12 99.37 99.82 100.00 100.00
North Dakota 50.00 50.00 50.00 50.00 50.00 65.00 88.00 88.00 88.00 88.00
Ohio 62.64 62.47 62.32 62.78 63.09 73.85 96.73 96.62 96.95 97.16
Oklahoma 62.30 60.99 59.94 58.57 62.38 73.61 95.69 94.96 94.00 96.67
Oregon 64.06 64.38 64.47 63.62 62.56 74.84 98.07 98.13 97.53 96.79
Pennsylvania 51.82 52.01 51.78 51.82 52.25 66.27 89.41 89.25 89.27 89.58
Rhode Island 50.00 50.42 51.02 51.45 52.57 65.00 88.29 88.71 89.02 89.80
South Carolina 70.64 71.08 71.30 71.58 71.22 79.45 100.00 100.00 100.00 100.00
South Dakota 51.64 51.61 54.94 55.34 56.71 66.15 89.13 91.46 91.74 92.70
Tennessee 64.99 65.05 64.96 65.82 65.87 75.49 98.54 98.47 99.07 99.11
Texas 58.05 57.13 56.18 56.88 58.19 70.64 92.99 92.33 92.82 93.73
Utah 70.56 70.24 69.90 70.26 69.71 79.39 100.00 100.00 100.00 100.00
Vermont 54.01 53.90 54.46 53.47 53.89 67.81 90.73 91.12 90.43 90.72
Virginia 50.00 50.00 50.00 50.00 50.00 65.00 88.00 88.00 88.00 88.00
Washington 50.03 50.00 50.00 50.00 50.00 65.02 88.00 88.00 88.00 88.00
West Virginia 71.35 71.42 71.80 73.24 74.34 79.95 100.00 100.00 100.00 100.00
Wisconsin 58.27 58.23 58.51 58.77 59.37 70.79 93.76 93.96 94.14 94.56
Wyoming 50.00 50.00 50.00 50.00 50.00 65.00 88.00 88.00 88.00 88.00
American Samoa 55.00 55.00 55.00 55.00 55.00 68.50 91.50 91.50 91.50 91.50
Guam 55.00 55.00 55.00 55.00 55.00 68.50 91.50 91.50 91.50 91.50
N. Mariana Islands 55.00 55.00 55.00 55.00 55.00 68.50 91.50 91.50 91.50 91.50
Puerto Rico 55.00 55.00 55.00 55.00 55.00 68.50 91.50 91.50 91.50 91.50
Virgin Islands 55.00 55.00 55.00 55.00 55.00 68.50 91.50 91.50 91.50 91.50

MA
CStats: Medicaid and CH
IP Data Book
19
Section 1: Overview
—Key Statistics
MACStats Section 1
EXHIBIT 6. (continued)
Notes: FMAP is federal medical assistance percentage. E-FMAP is enhanced FMAP. FY is fiscal year. The federal government’s share of most Medicaid service costs is determined by the FMAP, with some exceptions. For Medicaid administrative costs, the federal share does not vary by state and is generally 50 percent. The E-FMAP determines the federal share of both service and administrative costs for CHIP, subject to the availability of funds from a state’s federal allotments for CHIP.
FMAPs for Medicaid are generally calculated based on a formula that compares each state’s per capita income to U.S. per capita income and provides a higher federal match for states with lower per capita incomes, subject to a statutory minimum (50 percent) and maximum (83 percent). The general formula for a given state is: FMAP = 1 – [(state per capita income squared ÷ U.S. per capita income squared) × 0.45].
Medicaid exceptions to this formula include the District of Columbia (set in statute at 70 percent) and the territories (set in statute at 55 percent). Other Medicaid exceptions apply to certain services, providers, or situations (e.g., services provided through an Indian Health Service facility receive an FMAP of 100 percent). E-FMAPs for CHIP are calculated by reducing the state share under regular FMAPs for Medicaid by 30 percent and adding 23 percentage points.1 For certain newly eligible individuals under the Medicaid expansion beginning in 2014, there is an increased FMAP (100 percent in 2014 through 2016, phasing down to 90 percent in 2020 and subsequent years). An increased FMAP is also available for certain states that expanded eligibility to low-income parents and non-pregnant adults without children prior to enactment of the Patient Protection and Affordable Care Act (ACA, P.L. 111-148, as amended).2 Under the ACA, beginning on October 1, 2015, and ending on September 30, 2019, the E-FMAP will be increased by 23 percentage points, not to exceed 100 percent, for all states.
Source: U.S. Department of Health and Human Services, Federal Register notices for FYs 2015–2019.


SECTION 2
Trends

December 201822
Section 2: Trends
Section 2: Trends
Key Points• Medicaid spending and enrollment are affected by federal and state policy choices as well as
economic factors (Exhibits 8–10). For example, spending and enrollment both grew during therecessions of 2001 and 2007–2009, and leveled off as economic conditions improved. Morerecently, since fiscal year (FY) 2014, Medicaid spending has grown, in part due to expandedeligibility under the Patient Protection and Affordable Care Act (ACA, P.L. 111-148, as amended).
• Medicaid enrollment trends vary by eligibility group. Adults (excluding those eligible onthe basis of disability) generally experience larger enrollment increases during periodsof economic recession than other eligibility groups. For example, from FYs 2008–2013,enrollment for adults grew on average 5.8 percent annually, compared to about 3.0 percentannually for children (excluding those eligible on the basis of disability) and individualsqualifying for Medicaid on the basis of disability. Individuals age 65 or older generally have theslowest growth rate regardless of time period (Exhibit 7).
• Medicaid’s share of state-funded budgets (excluding federal funds) and total state budgets(including federal funds) has varied over time. In state fiscal year 2015, Medicaid’s share oftotal state budgets increased, but its share of state-funded budgets decreased slightly—thedecrease can be attributed to 100 percent federal funding made available for low-incomeadults not otherwise eligible on the basis of disability, who became newly eligible for Medicaidunder the ACA (Exhibit 13).
• In July 2018, 73.2 million individuals were enrolled in Medicaid and the State Children’s HealthInsurance Program (CHIP). Enrollment in July 2018 was about 27.5 percent higher thanaverage monthly enrollment during July to September 2013, a baseline period that precedesthe start of open enrollment for exchange plans and state expansions of Medicaid for newlyeligible adults under the ACA (Exhibit 11).
• Enrollment growth has slowed and even decreased slightly in recent years. Enrollment inMedicaid and CHIP decreased by about 2.2 percent from July 2017 to July 2018 after a coupleof years of modest growth; enrollment grew by about 1.3 percent from calendar years (CYs)2015–2016 and by about 1.6 percent from CYs 2016–2017. Growth rates continue to vary bystate; in 2018, enrollment decreased in the majority of states (37 states and the District ofColumbia) (Exhibit 11).
• Medicaid and CHIP expenditures as a share of national health expenditures are projected togrow from 17.2 percent in 2017 to about 18.0 percent in 2026. Medicare’s share is projected toincrease from 20.2 percent to 24.0 percent during the same time period (Exhibit 12).

MA
CStats: Medicaid and CH
IP Data Book
23
Section 2: Trends
MACStats Section 2
EXHIBIT 7. Medicaid Beneficiaries (Persons Served) by Eligibility Group, FYs 1975–2013 (thousands)
Fiscal year Total Children Adults Disabled Aged Unknown1975 22,007 9,598 4,529 2,464 3,615 1,8011976 22,815 9,924 4,773 2,669 3,612 1,8371977 22,832 9,651 4,785 2,802 3,636 1,9581978 21,965 9,376 4,643 2,718 3,376 1,8521979 21,520 9,106 4,570 2,753 3,364 1,7271980 21,605 9,333 4,877 2,911 3,440 1,0441981 21,980 9,581 5,187 3,079 3,367 7661982 21,603 9,563 5,356 2,891 3,240 5531983 21,554 9,535 5,592 2,921 3,372 1341984 21,607 9,684 5,600 2,913 3,238 1721985 21,814 9,757 5,518 3,012 3,061 4661986 22,515 10,029 5,647 3,182 3,140 5171987 23,109 10,168 5,599 3,381 3,224 7371988 22,907 10,037 5,503 3,487 3,159 7211989 23,511 10,318 5,717 3,590 3,132 7541990 25,255 11,220 6,010 3,718 3,202 1,1051991 27,967 12,855 6,703 4,033 3,341 1,0351992 31,150 15,200 7,040 4,487 3,749 6741993 33,432 16,285 7,505 5,016 3,863 7631994 35,053 17,194 7,586 5,458 4,035 7801995 36,282 17,164 7,604 5,858 4,119 1,5371996 36,118 16,739 7,127 6,221 4,285 1,7461997 34,872 15,791 6,803 6,129 3,955 2,1951998 40,096 18,969 7,895 6,637 3,964 2,6311999 39,748 18,233 7,446 6,690 3,698 3,6822000 41,212 18,528 8,538 6,688 3,640 3,8172001 45,164 20,181 9,707 7,114 3,812 4,3492002 46,839 21,487 10,847 7,182 3,789 3,534

Decem
ber 201824
Section 2: Trends
MACStats Section 2
EXHIBIT 7. (continued)
Fiscal year Total Children Adults Disabled Aged Unknown2003 50,716 23,742 11,530 7,664 4,041 3,7392004 54,250 25,415 12,325 8,123 4,349 4,0372005 56,276 25,979 12,431 8,205 4,395 5,2662006 56,264 26,358 12,495 8,334 4,374 4,7032007 55,210 26,061 12,264 8,423 4,044 4,4182008 56,962 26,479 12,739 8,685 4,147 4,9122009 60,880 28,344 14,245 9,031 4,195 5,0662010 63,730 30,024 15,368 9,341 4,289 4,7092011 65,831 30,175 16,069 9,609 4,331 5,6462012 65,584 30,467 16,483 9,836 4,376 4,42320131 67,516 30,703 16,889 10,123 4,500 5,301
Notes: FY is fiscal year. Excludes Medicaid-expansion CHIP and the territories. Beneficiaries (enrollees for whom payments are made) are shown here because they provide the only historical time series data directly available prior to FY 1990. Most current analyses of individuals in Medicaid reflect enrollees. For additional discussion, see https://www.macpac.gov/macstats/data-sources-and-methods/. The increase in FY 1998 reflects a change in how Medicaid beneficiaries were counted: beginning in FY 1998, a Medicaid-eligible person who received coverage only for managed care benefits was included in this series as a beneficiary.
Children and adults who qualify for Medicaid on the basis of a disability are included in the disabled category. In addition, although disability is not a basis of eligibility for aged individuals, states may report some enrollees age 65 and older in the disabled category. Unlike the majority of MACStats, this exhibit does not recode individuals age 65 and older who are reported as disabled, due to lack of detail in the historical data. Generally, individuals whose eligibility group is unknown are persons who were enrolled in the prior year but had a Medicaid claim paid in the current year.
For MACPAC's analysis, Medicaid enrollees were assigned a unique national identification number using an algorithm that incorporates state-specific ID numbers and beneficiary characteristics such as date of birth and gender. The national enrollment counts shown here are unduplicated using this national ID.1 Values have not been updated from those published in the December 2017 data book due to the unavailability of more recent Medicaid Statistical Information System (MSIS) or Transformed MSIS data. FY 2013 values were updated from those published in the December 2016 data book. This table could not be updated to reflect the number of beneficiaries in FY 2014 due to insufficient MSIS data for several states.
Sources: For FYs 1999–2013: MACPAC, 2017, analysis of MSIS data. For FYs 1975–1998: CMS, Table 13.4: Number of Medicaid persons served (beneficiaries), by eligibility group: fiscal years 1975–2008, in Medicare & Medicaid statistical supplement, 2010 edition, https://www.cms.gov/Research-Statistics-Data-and-Systems/Statistics-Trends-and-Reports/MedicareMedicaidStatSupp/Downloads/2010_Section13.pdf#Table%2013.4.

MACStats: Medicaid and CHIP Data Book 25
Section 2: Trends
MAC
Stat
sSe
ctio
n 2
EXHIBIT 8. Medicaid Enrollment and Spending, FYs 1966–2017
Spen
ding
(bill
ions
)
Fiscal year
Spending
FYE enrollment
FYE
enro
llmen
t (m
illio
ns)
Notes: FY is fiscal year. FYE is full-year equivalent, which also may be referred to as average monthly enrollment. All numbers exclude CHIP-financed coverage. Data prior to FY 1977 have been adjusted to the current federal fiscal year basis (October 1 through September 30). The amounts shown in this exhibit may differ from those published elsewhere due to slight differences in the timing of data and the treatment of certain adjustments. The amounts may also differ from prior versions of MACStats due to changes in methodology by the CMS Office of the Actuary (OACT). Spending consists of federal and state Medicaid expenditures for benefits and administration, excluding the Vaccines for Children program. Enrollment counts are full-year equivalents and, for fiscal years prior to FY 1990, have been estimated from counts of persons served (see https://www.macpac.gov/macstats/data-sources-and-methods/ for a discussion of how enrollees are counted). Enrollment data for FYs 2013–2017 are projected; those for FYs 1999–2017 include estimates for Puerto Rico and the Virgin Islands.
Sources: OACT, CMS, 2018, 2017 Actuarial Report on the Financial Outlook of Medicaid, Baltimore, MD: OACT, https://www.cms.gov/Research-Statistics-Data-and-Systems/Research/ActuarialStudies/Downloads/MedicaidReport2017.pdf. OACT, 2017, data compilation provided to MACPAC, July 24.

December 201826
Section 2: Trends
MAC
Stat
sSe
ctio
n 2
EXHIBIT 9. Annual Growth in Medicaid Enrollment and Spending, FYs 1977—2017
Notes: FY is fiscal year. FYE is full-year equivalent, which also may be referred to as average monthly enrollment. All numbers exclude CHIP-financed coverage. Data prior to FY 1977 have been adjusted to the current federal fiscal year basis (October 1 through September 30). The amounts shown in this exhibit may differ from those published elsewhere due to slight differences in the timing of data and the treatment of certain adjustments. The amounts may also differ from prior versions of MACStats due to changes in methodology by the CMS Office of the Actuary (OACT). Spending consists of federal and state Medicaid expenditures for benefits and administration, excluding the Vaccines for Children program. Enrollment counts are FYEs and, for fiscal years prior to FY 1990, have been estimated from counts of persons served (see https://www.macpac.gov/macstats/data-sources-and-methods/ for a discussion of how enrollees are counted). Enrollment data for FYs 2013–2017 are projected; those for FYs 1999–2017 include estimates for Puerto Rico and the Virgin Islands.
Sources: OACT, CMS, 2018, 2017 Actuarial Report on the Financial Outlook of Medicaid, Baltimore, MD: OACT, https://www.cms.gov/Research-Statistics-Data-and-Systems/Research/ActuarialStudies/Downloads/MedicaidReport2017.pdf; OACT, 2017, data compilation provided to MACPAC, July 24.
Fiscal year
Spending
FYE enrollment

MA
CStats: Medicaid and CH
IP Data Book
27
Section 2: Trends
MACStats Section 2
EXHIBIT 10. Medicaid Enrollment and Total Spending Levels and Annual Growth, FYs 1966–2017
Fiscal yearSpending (billions)
FYE enrollment (millions)
Spending per FYE enrollee
Annual growth
SpendingFYE
enrollmentSpending per FYE enrollee
1966 $1 4.0 $222 – – –1967 2 7.4 321 165.4% 83.3% 44.8%1968 4 10.6 343 52.4 42.9 6.71969 4 11.5 381 21.1 8.9 11.31970 5 14.0 365 15.9 21.3 -4.41971 7 16.3 401 28.5 16.9 9.91972 8 16.5 484 22.4 1.3 20.91973 9 17.6 534 17.0 6.2 10.21974 11 19.0 567 15.1 8.3 6.31975 13 20.2 651 21.8 6.1 14.81976 15 20.7 720 13.6 2.7 10.61977 17 20.7 830 15.3 0.1 15.31978 19 20.0 959 11.2 -3.8 15.61979 22 19.6 1,115 14.0 -2.0 16.31980 25 19.6 1,285 15.7 0.4 15.21981 30 20.0 1,493 18.2 1.7 16.21982 32 19.6 1,620 6.7 -1.7 8.51983 35 19.6 1,779 9.6 -0.2 9.91984 37 19.8 1,890 7.4 1.2 6.21985 41 19.8 2,081 10.2 0.0 10.21986 44 20.5 2,172 7.7 3.2 4.41987 50 21.0 2,382 12.5 2.6 9.61988 54 20.8 2,609 8.6 -0.9 9.51989 61 21.4 2,850 12.1 2.6 9.31990 72 22.9 3,147 18.6 7.4 10.41991 94 26.3 3,587 30.6 14.6 14.01992 120 28.9 4,161 27.4 9.8 16.01993 131 31.2 4,182 8.7 8.1 0.51994 144 32.4 4,434 10.1 3.9 6.0

Decem
ber 201828
Section 2: Trends
MACStats Section 2
EXHIBIT 10. (continued)
Fiscal yearSpending (billions)
FYE enrollment (millions)
Spending per FYE enrollee
Annual growth
SpendingFYE
enrollmentSpending per FYE enrollee
1995 $159 33.4 $4,779 10.9% 2.9% 7.8%1996 160 33.2 4,804 0.1 -0.4 0.51997 166 33.0 5,025 3.9 -0.6 4.61998 177 32.5 5,462 6.8 -1.7 8.71999 190 32.1 5,924 7.1 -1.2 8.52000 206 34.5 5,972 8.6 7.7 0.82001 229 36.9 6,213 11.0 6.7 4.02002 258 40.5 6,380 12.8 9.8 2.72003 276 43.5 6,352 6.9 7.4 -0.42004 296 45.2 6,560 7.3 3.9 3.32005 316 46.3 6,819 6.6 2.6 3.92006 315 46.7 6,751 -0.3 0.7 -1.02007 332 46.4 7,157 5.4 -0.5 6.02008 352 47.7 7,383 5.9 2.7 3.22009 379 50.9 7,443 7.6 6.7 0.82010 402 54.5 7,361 6.1 7.2 -1.12011 427 56.3 7,582 6.3 3.2 3.02012 431 58.9 7,313 0.9 4.6 -3.52013 456 59.8 7,621 5.8 1.5 4.22014 495 65.1 7,597 8.5 8.8 -0.32015 549 70.0 7,841 11.0 7.6 3.22016 577 72.2 7,993 5.1 3.1 1.92017 592 73.8 8,024 2.6 2.2 0.4
Notes: FY is fiscal year. FYE is full-year equivalent, which also may be referred to as average monthly enrollment. All numbers exclude CHIP-financed coverage. Data prior to FY 1977 have been adjusted to the current federal fiscal year basis (October 1 through September 30). The amounts shown in this exhibit may differ from those published elsewhere due to slight differences in the timing of data and the treatment of certain adjustments. The amounts may also differ from prior versions of MACStats due to changes in methodology by the CMS Office of the Actuary (OACT). Spending consists of federal and state Medicaid expenditures for benefits and administration, excluding the Vaccines for Children program. Enrollment counts are FYEs and, for fiscal years prior to FY 1990, have been estimated from counts of persons served (see https://www.macpac.gov/macstats/data-sources-and-methods/ for a discussion of how enrollees are counted). Enrollment data for FYs 2013–2017 are projected; those for FYs 1999–2017 include estimates for Puerto Rico and the Virgin Islands.
– Dash indicates not applicable; 0.0% indicates an amount less than 0.05% that rounds to zero.
Sources: OACT, CMS, 2018, 2017 Actuarial Report on the Financial Outlook of Medicaid, Baltimore, MD: OACT, https://www.cms.gov/Research-Statistics-Data-and-Systems/Research/ActuarialStudies/Downloads/MedicaidReport2017.pdf. OACT, 2017, data compilation provided to MACPAC, July 24.

MA
CStats: Medicaid and CH
IP Data Book
29
Section 2: Trends
MACStats Section 2
EXHIBIT 11. Full-Benefit Medicaid and CHIP Enrollment, Selected Months in 2013–2018
State
Number of individuals enrolled Annual and cumulative growth
July–September 2013 average July 2015 July 2016 July 2017 July 2018
July 2015 to
July 2016
July 2016 to
July 2017
July 2017 to
July 2018
July– September
2013 average to July 2018
Total 56,533,472 1 72,672,694 73,628,614 74,800,477 73,189,584 1.3% 1.6% -2.2% 27.5%2
Alabama 799,1763 891,912 896,741 892,956 899,824 0.5 -0.4 0.8 12.6Alaska 122,334 127,401 162,869 196,121 209,491 27.8 20.4 6.8 71.2Arizona 1,201,770 1,595,617 1,699,635 1,745,097 1,688,791 6.5 2.7 -3.2 40.5Arkansas 556,851 823,741 889,082 909,062 878,537 7.9 2.2 -3.4 57.8California 7,755,3814 12,648,6374 12,201,179 12,277,389 11,960,965 -3.5 0.6 -2.6 54.2Colorado 783,420 1,274,849 1,362,887 1,399,170 1,337,830 6.9 2.7 -4.4 70.8Connecticut – 754,054 753,413 799,8375 844,165 -0.1 6.2 5.5 –Delaware 223,324 241,749 236,248 244,960 247,466 -2.3 3.7 1.0 10.8District of Columbia 235,7866 255,6606 258,9186 277,4086 258,839 1.3 7.1 -6.7 9.8Florida 3,695,306 3,558,0927 3,620,0857 4,357,190 4,229,664 1.7 20.4 -2.9 14.5Georgia 1,535,090 1,781,537 1,775,301 1,754,492 1,834,246 -0.4 -1.2 4.5 19.5Hawaii 288,357 332,027 341,072 346,435 337,502 2.7 1.6 -2.6 17.0Idaho 238,150 278,268 291,057 294,571 273,384 4.6 1.2 -7.2 14.8Illinois 2,626,9438 3,162,522 3,118,055 3,073,670 2,949,575 -1.4 -1.4 -4.0 12.3Indiana 1,120,6749 1,389,5199 1,481,4259 1,494,850 1,439,013 6.6 0.9 -3.7 28.4Iowa 493,515 599,305 613,386 666,420 678,106 2.3 8.6 1.8 37.4Kansas 378,160 398,007 422,549 403,231 386,547 6.2 -4.6 -4.1 2.2Kentucky 606,805 1,119,198 1,223,869 1,256,677 1,241,612 9.4 2.7 -1.2 104.6Louisiana 1,019,787 1,075,652 1,308,428 1,449,244 1,449,055 21.6 10.8 -0.0 42.1Maine – 280,241 273,367 266,623 261,636 -2.5 -2.5 -1.9 –Maryland 856,297 1,179,937 1,236,465 1,306,788 1,296,128 4.8 5.7 -0.8 51.4Massachusetts 1,296,359 1,649,42310 1,677,180 1,602,714 1,589,897 1.7 -4.4 -0.8 22.6Michigan 1,912,009 2,352,127 2,304,48011, 12 2,380,232 2,332,229 -2.0 3.3 -2.0 22.0Minnesota 873,04013 1,028,161 1,047,507 1,065,061 1,070,221 1.9 1.7 0.5 22.6Mississippi 637,229 709,510 696,139 681,976 638,956 -1.9 -2.0 -6.3 0.3Missouri 846,084 932,026 961,07314 967,47714 933,441 3.1 0.7 -3.5 10.3Montana 148,974 176,714 220,378 262,329 278,662 24.7 19.0 6.2 87.1

Decem
ber 201830
Section 2: Trends
MACStats Section 2
EXHIBIT 11. (continued)
State
Number of individuals enrolled Annual and cumulative growth
July–September 2013 average July 2015 July 2016 July 2017 July 2018
July 2015 to
July 2016
July 2016 to
July 2017
July 2017 to
July 2018
July– September
2013 average to July 2018
Nebraska 244,600 237,243 241,723 245,909 243,308 1.9% 1.7% -1.1% -0.5%Nevada 332,560 566,017 609,435 633,019 669,499 7.7 3.9 5.8 101.3New Hampshire 127,082 184,266 189,484 187,798 182,182 2.8 -0.9 -3.0 43.4New Jersey 1,283,851 1,789,264 1,782,594 1,780,482 1,754,725 -0.4 -0.1 -1.4 36.7New Mexico 457,678 717,189 761,033 781,857 728,449 6.1 2.7 -6.8 59.2New York 5,678,417 6,512,1378 6,417,3888, 12 6,421,32312 6,491,2928, 12 -1.5 0.1 1.1 14.3North Carolina 1,595,952 1,982,496 2,059,981 2,092,418 2,037,412 3.9 1.6 -2.6 27.7North Dakota 69,98015 88,719 89,460 93,148 93,970 0.8 4.1 0.9 34.3Ohio 2,130,322 2,988,934 2,976,705 2,788,908 2,727,989 -0.4 -6.3 -2.2 28.1Oklahoma 790,051 821,867 787,331 802,957 788,159 -4.2 2.0 -1.8 -0.2Oregon 626,35616 1,055,685 1,036,984 989,582 963,773 -1.8 -4.6 -2.6 53.9Pennsylvania 2,386,046 2,665,455 2,861,112 2,947,533 2,970,511 7.3 3.0 0.8 24.5Rhode Island 190,833 277,232 284,455 313,103 310,587 2.6 10.1 -0.8 62.8South Carolina 889,744 999,438 1,021,192 1,032,955 999,452 2.2 1.2 -3.2 12.3South Dakota 115,501 118,715 119,252 118,132 117,558 0.5 -0.9 -0.5 1.8Tennessee 1,244,516 1,512,658 1,632,972 1,484,821 1,371,010 8.0 -9.1 -7.7 10.2Texas 4,203,449 4,678,394 4,744,278 4,772,545 4,326,567 1.4 0.6 -9.3 2.9Utah9 294,029 310,273 312,936 307,267 293,770 0.9 -1.8 -4.4 -0.1Vermont 161,081 185,991 179,421 168,455 161,766 -3.5 -6.1 -4.0 0.4Virginia 935,434 980,591 984,787 1,015,609 1,032,764 0.4 3.1 1.7 10.4Washington 1,117,576 1,728,834 1,782,418 1,789,309 1,745,561 3.1 0.4 -2.4 56.2West Virginia 354,544 542,077 572,107 563,596 543,289 5.5 -1.5 -3.6 53.2Wisconsin 985,53117 1,048,817 1,045,160 1,037,696 1,032,239 -0.3 -0.7 -0.5 4.7Wyoming 67,518 64,516 63,618 60,075 57,970 -1.4 -5.6 -3.5 -14.1

MA
CStats: Medicaid and CH
IP Data Book
31
Section 2: Trends
MACStats Section 2
EXHIBIT 11. (continued)
Notes: Enrollment excludes individuals with limited benefits, such as those who receive only Medicaid coverage of Medicare premiums and cost sharing, family planning services, or emergency coverage due to non-citizen status (state-specific exceptions are noted below). The July–September 2013 period shown here serves as a baseline from before the Patient Protection and Affordable Care Act (P.L. 111-148, as amended) was implemented, representing the number of people covered by Medicaid and CHIP prior to the start of open enrollment for exchange plans in October 2013 and the state expansions of Medicaid for adults that began in January 2014. Some data are preliminary or estimated, and all data are subject to change as states may revise their submissions at any time. See data sources for full details.
– Dash indicates that state did not report data; 0.0% or -0.0% indicates an amount between 0.05% and -0.05% that rounds to zero.1 Excludes two states not reporting data.2 Percentage calculated based only on states reporting data for both periods.3 Data are for September 2013 only.4 Includes approximately 650,000 individuals transferred from the Low Income Health Program Section 1115 demonstration. 5 May not include all enrollees.6 Includes individuals receiving limited benefits who are dually eligible for Medicare and Medicaid and individuals enrolled in the locally funded DC Health Alliance.7 Excludes Supplemental Security Income beneficiaries enrolled in Medicaid.8 Includes retroactive enrollment.9 Includes individuals receiving limited benefits who are dually eligible for Medicare and Medicaid.10 Excludes individuals receiving temporary transitional coverage.11 Does not include share of cost and full-benefit Section 1115 waiver enrollees. 12 Includes partial-benefit enrollees.13 May include duplicates.14 Does not include all individuals funded under Title XXI or enrollees in a premium grace period.15 Data are for July 2013 only.16 Includes emergency Medicaid population.17 Excludes retroactive enrollment.
Source: MACPAC, 2018, analysis of CMS, 2018, Medicaid and CHIP July 2018 application, eligibility, and enrollment data, https://www.medicaid.gov/medicaid/program-information/downloads/july-2018-enrollment-data.zip; CMS, 2017, Medicaid and CHIP September 2017 application, eligibility, and enrollment data, https://www.medicaid.gov/medicaid/program-information/downloads/september-2017-enrollment-data.zip; CMS, 2016, Medicaid and CHIP August and September 2016 application, eligibility, and enrollment data, https://www.medicaid.gov/medicaid/program-information/downloads/september-2016-enrollment-data.zip; and CMS, 2015, Medicaid and CHIP August and September 2015 application, eligibility, and enrollment data, https://www.medicaid.gov/medicaid/program-information/downloads/august-and-september-2015-enrollment-data.zip.

Decem
ber 201832
Section 2: Trends
MACStats Section 2
EXHIBIT 12. Historical and Projected National Health Expenditures by Payer for Selected Years, CYs 1970–2026
Calendar year
Total (billions)
Payer amount (billions) and share of total
Medicaid and CHIP Medicare
Private insurance
Other health insurance1
Other third party payers2 Out of pocket
Historical
1970 $75 $5 7.1% $8 10.3% $15 20.8% $3 4.4% $18 23.9% $25 33.5%
1975 133 13 10.1 16 12.3 31 22.9 6 4.5 30 22.3 37 28.0
1980 255 26 10.2 37 14.6 69 27.1 10 3.8 55 21.5 58 22.8
1985 443 41 9.2 72 16.2 131 29.6 15 3.4 88 19.9 96 21.6
1990 721 74 10.2 110 15.3 234 32.4 21 3.0 144 20.0 138 19.1
1995 1,022 145 14.2 184 18.0 325 31.8 27 2.6 195 19.1 145 14.2
2000 1,369 203 14.9 225 16.4 458 33.5 33 2.4 251 18.4 199 14.5
2005 2,024 317 15.7 340 16.8 701 34.6 56 2.8 346 17.1 264 13.0
2010 2,599 409 15.7 520 20.0 864 33.3 84 3.2 422 16.2 300 11.5
2011 2,689 419 15.6 545 20.3 899 33.4 88 3.3 429 16.0 310 11.5
2012 2,797 435 15.6 570 20.4 928 33.2 90 3.2 456 16.3 318 11.4
2013 2,879 459 15.9 590 20.5 946 32.9 92 3.2 466 16.2 325 11.3
2014 3,026 510 16.8 619 20.5 1,000 33.0 99 3.3 468 15.5 330 10.9
2015 3,201 559 17.5 649 20.3 1,069 33.4 106 3.3 479 15.0 339 10.6
2016 3,337 582 17.5 672 20.1 1,123 33.7 109 3.3 498 14.9 353 10.6
Projected
2017 $3,489 $600 17.2% $706 20.2% $1,187 34.0% $115 3.3% $517 14.8% $365 10.5%
2018 3,675 641 17.4 748 20.4 1,244 33.8 122 3.3 540 14.7 380 10.3
2019 3,868 677 17.5 808 20.9 1,286 33.3 129 3.3 570 14.7 398 10.3
2020 4,091 718 17.5 873 21.3 1,349 33.0 136 3.3 598 14.6 417 10.2
2021 4,322 761 17.6 943 21.8 1,411 32.6 144 3.3 627 14.5 437 10.1

MA
CStats: Medicaid and CH
IP Data Book
33
Section 2: Trends
MACStats Section 2
EXHIBIT 12. (continued)
Calendar year
Total (billions)
Payer amount (billions) and share of total
Medicaid and CHIP Medicare
Private insurance
Other health insurance1
Other third party payers2 Out of pocket
2022 $4,562 $806 17.7% $1,016 22.3% $1,473 32.3% $152 3.3% $656 14.4% $459 10.1%
2023 4,818 853 17.7 1,093 22.7 1,544 32.1 160 3.3 687 14.3 482 10.0
2024 5,091 903 17.7 1,176 23.1 1,620 31.8 167 3.3 719 14.1 506 9.9
2025 5,370 960 17.9 1,253 23.3 1,698 31.6 176 3.3 753 14.0 531 9.9
2026 5,696 1,025 18.0 1,366 24.0 1,776 31.2 185 3.3 789 13.9 555 9.7
Notes: CY is calendar year. Components may not sum to total due to rounding. The latest projections begin after the latest historical year (2016) and go through 2026.1 U.S. Department of Defense and U.S. Department of Veterans Affairs.2 Includes all other public and private programs and expenditures except for out-of-pocket amounts.
Sources: For historical data: MACPAC, 2018, analysis of Office of the Actuary (OACT), CMS, 2017, National health expenditures by type of service and source of funds: Calendar years 1960–2016, https://www.cms.gov/Research-Statistics-Data-and-Systems/Statistics-Trends-and-Reports/NationalHealthExpendData/Downloads/NHE2016.zip. For projected data: MACPAC, 2018, analysis of OACT, 2018, National health expenditure (NHE) amounts by type of expenditure and source of funds: Calendar years 1960–2026 in projections format, as of February 2018, https://www.cms.gov/Research-Statistics-Data-and-Systems/Statistics-Trends-and-Reports/NationalHealthExpendData/Downloads/NHE60-26.zip; and OACT, 2018, Table 17: Health insurance enrollment and enrollment growth rates, calendar years, 2010–2026, https://www.cms.gov/Research-Statistics-Data-and-Systems/Statistics-Trends-and-Reports/NationalHealthExpendData/Downloads/Proj2017Tables.zip.

December 201834
Section 2: Trends
MAC
Stat
sSe
ctio
n 2
EXHIBIT 13. Medicaid as a Share of State Budgets Including and Excluding Federal Funds,SFYs 1990–2016
State fiscal year
All federal and state funds
State general funds only
All state funds

MACStats: Medicaid and CHIP Data Book 35
Section 2: Trends
MAC
Stat
sSe
ctio
n 2
EXHIBIT 13. (continued)
State fiscal yearMedicaid as a share of all
federal and state fundsMedicaid as a share of
state general funds onlyMedicaid as a share of
all state funds1990 12.5% 9.5% 6.9%1991 14.2 10.5 7.91992 17.8 12.1 10.01993 18.8 13.3 10.91994 19.7 14.2 11.31995 19.8 14.4 11.61996 19.9 14.7 11.71997 20.0 14.6 11.51998 19.6 14.8 11.61999 19.5 14.4 11.42000 19.1 15.0 11.02001 19.7 15.2 11.72002 20.7 15.8 12.22003 22.0 17.2 13.12004 22.1 16.9 12.92005 22.3 17.1 13.52006 21.4 17.4 13.32007 20.9 16.6 12.82008 20.5 16.0 12.52009 21.9 16.3 12.32010 22.2 14.8 11.62011 23.8 16.5 13.32012 23.6 19.2 14.52013 24.3 19.3 15.22014 26.5 20.0 15.82015 27.9 19.5 15.62016 28.7 19.7 15.9
Notes: SFY is state fiscal year. Amounts shown here reflect the most recent information available in cases where data for a given year were published and then updated in a subsequent report.
The all federal and state funds category reflects amounts from any source. The state general funds only category reflects amounts from revenues raised through income, sales, and other broad-based state taxes and excludes federal funds. The all state funds category reflects amounts from any non-federal source; these include state general funds, other state funds (amounts from revenue sources that are restricted by law for particular government functions or activities, which for Medicaid includes provider taxes and local funds), and bonds (expenditures from the sale of bonds, generally for capital projects) and excludes federal funds.
Source: MACPAC, 2018, analysis of state expenditure reports from the National Association of State Budget Officers, http://nasbo.org/mainsite/reports-data/state-expenditure-report/state-expenditure-archives.


SECTION 3
Program Enrollment and Spending

December 201838
Section 3: Program Enrollment and Spending
Section 3: Program Enrollment and Spending
Key Points• Total Medicaid spending was $605 billion in fiscal year (FY) 2017 (Exhibit 16). Spending for
the State Children’s Health Insurance Program (CHIP) was $17.5 billion (Exhibit 33).
• Almost half (49.3 percent) of Medicaid benefit spending in FY 2017 was for capitationpayments for managed care, up from 46.3 percent in the prior year (Exhibit 17).
• In FY 2013, individuals eligible on the basis of disability and enrollees age 65 and olderaccounted for about one-quarter of Medicaid enrollees but about two-thirds of programspending (Exhibits 14 and 21). Many of these individuals used long-term services andsupports (LTSS). LTSS users accounted for 5.9 percent of Medicaid enrollees but 41.9 percentof all Medicaid spending (Exhibit 20).
• Most FY 2013 Medicaid spending for enrollees eligible on the basis of disability and those age65 and older was for LTSS; for children and adults eligible on a basis other than disability, mostspending was for capitation payments to managed care plans (Exhibit 18).
• Medicaid benefit spending per enrollee varies substantially across states (Exhibits 22aand 22b). This variation reflects differences in the underlying costs of delivering healthcare services in specific geographic areas, the breadth of covered benefits, and enrolleecharacteristics, such as health status, that affect their use of services.
• Drug rebates reduced gross Medicaid drug spending by more than half (54.5 percent) in FY2017 (Exhibit 28). Gross drug spending increased 5.2 percent from FY 2016, but net drugspending (i.e., after rebates) decreased by 1.7 percent. Over half (62.4 percent) of Medicaidgross spending for drugs occurred under managed care in FY 2017 (Exhibit 26).
• Disproportionate share hospital (DSH), upper payment limit, and other types of supplementalpayments accounted for about half of fee-for-service payments to hospitals in FY 2017(Exhibit 24).

MA
CStats: Medicaid and CH
IP Data Book
39
Section 3: Program Enrollm
ent and Spending—M
edicaid Overall
MACStats Section 3
EXHIBIT 14a. Medicaid Enrollment by State, Eligibility Group, and Dually Eligible Status, FY 2013 (thousands)
State TotalBasis of eligibility1
Dually eligible status2
All dually eligible enrollees
Dually eligible with full benefits
Dually eligible with limited benefits
Child Adult Disabled Aged Total Age 65+ Total Age 65+ Total Age 65+Total 70,161 32,270 20,477 10,516 6,898 10,850 6,361 7,877 4,647 2,973 1,714Alabama 1,212 597 244 242 129 236 128 104 54 132 74Alaska 136 74 35 17 10 16 9 15 8 1 0Arizona 1,681 805 579 176 121 193 113 148 82 46 31Arkansas 696 355 109 160 73 135 71 71 41 65 29California 11,742 4,027 5,483 1,094 1,138 1,429 1,004 1,386 971 43 32Colorado 896 500 194 137 65 104 59 74 44 30 16Connecticut 858 331 325 81 122 174 117 84 49 90 68Delaware 260 102 114 28 16 29 16 13 7 16 9District of Columbia 246 84 102 39 21 29 18 28 17 0 0Florida 4,313 2,145 943 662 563 817 529 402 279 416 250Georgia3 2,013 1,129 350 340 194 326 189 158 92 168 97Hawaii 300 121 108 43 28 40 27 35 23 5 3Idaho 288 175 44 48 21 37 17 21 9 16 8Illinois 3,039 1,585 883 326 245 394 223 349 196 45 27Indiana 1,250 667 260 221 102 190 89 123 61 66 28Iowa 634 286 212 90 46 93 45 73 33 20 12Kansas 442 262 61 81 39 75 36 48 25 27 12Kentucky 927 450 139 238 99 192 96 104 55 88 42Louisiana 1,284 623 293 245 122 217 120 116 63 100 58Maine3 371 132 104 72 63 106 62 61 29 45 34Maryland 1,139 515 389 149 85 142 80 90 50 52 29Massachusetts 1,547 442 518 396 191 307 162 281 137 26 24Michigan 2,291 1,149 594 392 156 315 145 267 122 48 24Minnesota 1,154 469 442 142 101 156 82 140 72 17 10Mississippi 786 400 118 175 93 170 93 86 49 84 43

Decem
ber 201840
Section 3: Program Enrollm
ent and Spending—M
edicaid Overall
MACStats
EXHIBIT 14a. (continued)
State TotalBasis of eligibility1
Dually eligible status2
All dually eligible enrollees
Dually eligible with full benefits
Dually eligible with limited benefits
Child Adult Disabled Aged Total Age 65+ Total Age 65+ Total Age 65+Missouri 1,122 571 238 218 94 189 89 164 76 25 13Montana 142 81 23 25 14 27 14 17 9 10 5Nebraska 262 147 47 43 25 46 23 40 20 5 3Nevada 422 248 83 55 35 57 34 25 16 31 17New Hampshire 166 92 23 33 17 37 16 23 10 14 6New Jersey 1,190 635 195 198 162 239 150 210 131 29 19New Mexico 660 354 186 74 46 78 46 42 25 35 20New York 6,002 2,120 2,485 710 687 892 602 756 503 137 99North Carolina 2,000 1,058 389 360 193 352 188 267 141 84 47North Dakota 87 47 18 13 10 17 9 13 7 3 2Ohio 2,645 1,133 890 417 203 383 188 249 129 134 58Oklahoma 951 499 253 130 68 127 66 103 53 24 13Oregon 760 367 210 114 69 121 67 72 41 49 25Pennsylvania 2,567 1,097 487 722 261 469 249 385 200 85 50Rhode Island 170 71 38 38 23 37 20 31 16 6 3South Carolina 1,091 562 267 174 89 169 89 143 74 27 15South Dakota 134 77 23 21 13 23 13 14 8 9 5Tennessee 1,557 796 325 283 152 293 150 156 79 137 71Texas 5,240 3,274 727 742 497 764 485 449 294 315 191Utah 389 225 96 49 19 39 18 34 15 6 3Vermont 206 69 88 26 23 38 22 29 16 9 6Virginia 1,136 591 234 192 118 204 111 133 76 71 35Washington 1,421 794 286 232 109 195 106 137 79 58 27West Virginia 437 208 62 124 44 89 44 51 26 38 18Wisconsin 1,254 492 440 179 143 178 87 154 71 24 16Wyoming 89 58 13 12 6 12 6 7 4 5 3
Section 3

MA
CStats: Medicaid and CH
IP Data Book
41
Section 3: Program Enrollm
ent and Spending—M
edicaid Overall
MACStats Section 3
EXHIBIT 14a. (continued)
Notes: FY is fiscal year. Enrollment numbers generally include individuals ever enrolled in Medicaid-financed coverage during the year, even if for a single month; however, in the event individuals were also enrolled in CHIP-financed Medicaid coverage (i.e., Medicaid-expansion CHIP) during the year, they are excluded if their most recent enrollment month was in Medicaid-expansion CHIP. Numbers exclude individuals enrolled only in Medicaid-expansion CHIP during the year and enrollees in the territories. Values have not been updated from those published in the December 2017 data book due to the unavailability of more recent Medicaid Statistical Information System (MSIS) or Transformed MSIS data.
For MACPAC’s analysis, Medicaid enrollees were assigned a unique national identification number using an algorithm that incorporates state-specific ID numbers and beneficiary characteristics such as date of birth and gender. The state and national enrollment counts shown here are unduplicated using this national ID. Categories may not sum to total for each state due to rounding. In addition, the sum of the state totals exceeds the national total because individuals may be enrolled in more than one state during the year.
0 indicates an amount less than 500 that rounds to zero. 1 Children and adults under age 65 who qualify for Medicaid on the basis of disability are included in the disabled category. About 746,000 enrollees age 65 and older are identified in the data as disabled; because disability is not an eligibility pathway for individuals age 65 and older, MACPAC recodes these enrollees as aged.2 Dually eligible enrollees are covered by both Medicaid and Medicare; those with limited benefits receive only Medicaid assistance with Medicare premiums and cost sharing. 3 State had a change in total enrollment of 10 percent or more over the prior year. These data may reflect data anomalies in the submission of MSIS data for the current or prior years; if so, data may be updated in future MSIS submissions by states. MSIS data anomalies have been compiled and reported by Mathematica Policy Research; the data anomalies report can be found at http://www.cms.gov/Research-Statistics-Data-and-Systems/Computer-Data-and-Systems/MedicaidDataSourcesGenInfo/downloads/anomalies1.pdf.
Source: MACPAC, 2017, analysis of MSIS data as of December 2016.

Decem
ber 201842
Section 3: Program Enrollm
ent and Spending—M
edicaid Overall
EXHIBIT 14b. Medicaid Enrollment by State, Eligibility Group, and Dually Eligible Status, FY 2014 (thousands)
insert exhibit here
MACStats Section 3
State1 TotalBasis of eligibility2
Dually eligible status3
All dually eligible enrollees
Dually eligible with full benefits
Dually eligible with limited benefits
Child Adult4 Disabled Aged Total Age 65+ Total Age 65+ Total Age 65+Arizona 1,671 810 557 177 127 202 119 152 86 49 33Arkansas 866 377 257 159 74 137 71 70 41 67 30California 14,309 4,238 7,783 1,091 1,197 1,505 1,056 1,463 1,024 43 32Connecticut 921 340 372 82 128 182 123 86 50 96 73Georgia 2,109 1,200 362 349 198 336 194 158 92 178 102Idaho 303 182 49 50 23 40 18 22 9 18 9Iowa 685 287 263 89 46 94 46 74 33 20 13Louisiana 1,281 629 289 241 122 220 121 116 62 103 59Massachusetts 1,924 467 873 392 192 319 167 293 143 26 24Michigan 2,542 1,112 882 390 159 323 148 272 124 51 24Minnesota 1,305 509 540 137 118 162 85 146 76 17 10Mississippi 782 392 120 177 93 172 92 85 48 86 44New Jersey 1,702 676 667 195 165 250 153 221 133 29 20New York 6,502 2,212 2,880 698 713 917 619 773 516 144 104Ohio 2,949 1,166 1,183 396 204 382 188 247 128 135 59Oklahoma 930 485 247 131 68 128 65 103 52 25 13Oregon 1,102 395 523 112 72 125 70 75 43 50 26Pennsylvania 2,625 1,114 513 730 268 480 255 392 204 88 51South Carolina 1,181 594 325 173 89 174 91 147 75 27 16South Dakota 137 79 23 21 13 23 13 14 8 9 5Tennessee 1,522 769 325 279 149 289 148 154 77 135 70Utah 423 251 103 50 20 41 19 35 16 6 3Vermont 209 70 89 26 25 38 22 30 16 8 6Washington 1,839 815 715 197 113 204 111 141 81 63 29West Virginia 605 219 231 110 45 93 45 54 26 39 18Wyoming 86 55 13 12 6 12 6 7 4 5 3
MACStats Section 3
MA
CStats: Medicaid and CH
IP Data Book
43
Section 3: Program Enrollm
ent and Spending—M
edicaid Overall
EXHIBIT 14b. (continued)
Notes: FY is fiscal year. Enrollment numbers generally include individuals ever enrolled in Medicaid-financed coverage during the year, even if for a single month; however, in the event individuals were also enrolled in CHIP-financed Medicaid coverage (i.e., Medicaid-expansion CHIP) during the year, they are excluded if their most recent enrollment month was in Medicaid-expansion CHIP. Numbers exclude individuals enrolled only in Medicaid-expansion CHIP during the year and enrollees in the territories.
For MACPAC’s analysis, Medicaid enrollees were assigned a unique national identification number using an algorithm that incorporates state-specific ID numbers and beneficiary characteristics such as date of birth and gender. The state enrollment counts shown here are unduplicated using this national ID. Categories may not sum to total for each state due to rounding.1 Several states did not submit complete Medicaid Statistical Information System (MSIS) data for FY 2014 due to the ongoing transition to Transformed MSIS (T-MSIS) and were excluded from this exhibit. In addition, a few states were excluded due to data reliability concerns regarding the completeness and quality of the submitted MSIS data. This exhibit includes only states that had sufficient FY 2014 MSIS data. Due to the number of states excluded, a national total is not provided. Values have not been updated from those published in the December 2017 data book due to the unavailability of more recent MSIS or T-MSIS data. 2 Children and adults under age 65 who qualify for Medicaid on the basis of disability are included in the disabled category. About 528,000 enrollees age 65 and older are identified in the data as disabled; because disability is not an eligibility pathway for individuals age 65 and older, MACPAC recodes these enrollees as aged. 3 Dually eligible enrollees are covered by both Medicaid and Medicare; those with limited benefits receive only Medicaid assistance with Medicare premiums and cost sharing.4 Includes the new adult group made eligible under Section 1902(a)(10)(A)(i)(VIII) of the Social Security Act by the Patient Protection and Affordable Care Act (P.L. 111-148, as amended).
Source: MACPAC, 2017, analysis of MSIS data as of December 2016.
MACStatsMACStats Section 3

Decem
ber 201844
Section 3: Program Enrollm
ent and Spending—M
edicaid Overall
MACStats
EXHIBIT 15a. Medicaid Full-Year Equivalent Enrollment by State and Eligibility Group, FY 2013 (thousands)
State
Total Child Adult Disabled AgedAll
enrolleesFull-benefit enrollees1
All enrollees
Full-benefit enrollees1
All enrollees
Full-benefit enrollees1
All enrollees
Full-benefit enrollees1
All enrollees
Full-benefit enrollees1
Total 58,109 50,801 27,327 27,026 15,060 10,736 9,644 8,516 6,078 4,524Alabama 968 728 480 480 165 39 212 162 110 46Alaska 111 110 61 61 25 25 16 16 9 9Arizona 1,359 1,235 648 636 442 373 161 147 108 78Arkansas 601 478 310 304 82 23 144 113 65 38California 9,307 6,761 3,340 3,160 3,907 1,599 1,023 1,013 1,036 990Colorado2 718 690 406 406 145 142 111 99 56 43Connecticut 731 649 291 291 257 255 75 56 108 47Delaware 213 184 85 84 88 74 26 18 14 7District of Columbia3 215 215 74 74 85 85 37 37 19 19Florida 3,386 2,909 1,727 1,719 581 478 586 440 492 272Georgia2 1,593 1,387 894 894 221 164 307 244 171 85Hawaii 252 248 107 107 82 82 39 37 25 22Idaho 230 216 142 142 27 27 43 36 18 11Illinois 2,677 2,555 1,412 1,412 746 666 302 285 217 192Indiana 1,030 954 564 564 184 168 197 161 85 61Iowa 516 458 236 234 157 119 83 77 39 28Kansas 352 328 209 209 38 38 72 59 33 23Kentucky 770 692 375 375 90 90 217 176 88 51Louisiana 1,128 953 563 563 228 146 226 186 111 57Maine2 322 280 115 114 85 84 65 55 56 26Maryland 963 891 448 447 305 278 137 117 74 48Massachusetts3 1,302 1,206 370 357 402 348 363 361 167 140Michigan 1,877 1,753 971 963 418 345 355 334 132 111Minnesota 901 863 383 380 314 293 131 125 74 65Mississippi 654 549 328 328 84 55 159 122 83 45
Section 3

MA
CStats: Medicaid and CH
IP Data Book
45
Section 3: Program Enrollm
ent and Spending—M
edicaid Overall
MACStats Section 3
EXHIBIT 15a. (continued)
State
Total Child Adult Disabled AgedAll
enrolleesFull-benefit enrollees1
All enrollees
Full-benefit enrollees1
All enrollees
Full-benefit enrollees1
All enrollees
Full-benefit enrollees1
All enrollees
Full-benefit enrollees1
Missouri 917 812 480 480 176 91 183 173 77 68Montana 114 103 65 65 15 13 22 18 11 7Nebraska 213 208 124 124 30 30 38 36 21 18Nevada 318 292 191 191 52 51 47 35 29 15New Hampshire 136 124 79 79 14 14 28 22 14 9New Jersey 986 959 541 541 122 120 181 172 143 125New Mexico 566 476 307 307 150 91 67 54 41 23New York 5,115 4,821 1,815 1,783 2,010 1,885 672 637 617 516North Carolina 1,646 1,502 902 901 250 182 325 291 169 128North Dakota 65 62 36 36 10 10 11 10 8 6Ohio 2,211 1,913 978 973 689 515 373 305 170 120Oklahoma 745 661 405 405 164 101 117 107 60 48Oregon 625 557 295 289 167 147 104 83 60 38Pennsylvania 2,159 1,964 914 913 375 257 646 613 225 182Rhode Island 4 4 4 4 4 4 4 4 4 4
South Carolina 926 805 489 488 201 104 157 147 79 66South Dakota 107 100 63 63 14 14 19 15 11 7Tennessee 1,320 1,200 682 682 249 249 255 198 133 71Texas 4,081 3,674 2,590 2,590 389 252 669 564 433 268Utah 286 280 170 170 58 57 42 40 16 14Vermont 170 162 58 58 67 67 24 22 20 15Virginia 935 822 496 496 163 114 173 141 102 71Washington 1,168 1,038 678 677 195 116 202 174 94 71West Virginia 354 322 166 166 40 40 110 93 38 23Wisconsin 1,049 931 413 398 346 266 165 157 125 111Wyoming 68 62 44 44 8 7 11 9 5 3

Decem
ber 201846
Section 3: Program Enrollm
ent and Spending—M
edicaid Overall
MACStats Section 3
EXHIBIT 15a. (continued)
Notes: FY is fiscal year. Full-year equivalent (FYE) may also be referred to as average monthly enrollment. Enrollment numbers generally include individuals ever enrolled in Medicaid-financed coverage during the year, even if for a single month; however, in the event individuals were also enrolled in CHIP-financed Medicaid coverage (i.e., Medicaid-expansion CHIP) during the year, they are excluded if their most recent enrollment month was in Medicaid-expansion CHIP. Numbers exclude individuals enrolled only in Medicaid-expansion CHIP during the year and enrollees in the territories. Children and adults under age 65 who qualify for Medicaid on the basis of disability are included in the disabled category. About 746,000 enrollees age 65 and older are identified in the data as disabled; because disability is not an eligibility pathway for individuals age 65 and older, MACPAC recodes these enrollees as aged. Values have not been updated from those published in the December 2017 data book due to the unavailability of more recent Medicaid Statistical Information System (MSIS) or Transformed MSIS data.
For MACPAC’s analysis, Medicaid enrollees were assigned a unique national identification number using an algorithm that incorporates state-specific ID numbers and beneficiary characteristics such as date of birth and gender. The state and national enrollment counts shown here are unduplicated using this national ID. Categories may not sum to total for each state due to rounding. In addition, the sum of the state totals exceeds the national total because individuals may be enrolled in more than one state during the year.1 In this exhibit, full-benefit enrollees columns exclude enrollees reported by states in the MSIS as receiving coverage of only emergency services, family planning services, or assistance with Medicare premiums and cost sharing.2 State had a change in total FYE enrollees of 10 percent or more over the prior year. These data may reflect data anomalies in the submission of MSIS data for the current or prior years; if so, data may be updated in future MSIS submissions by states. MSIS data anomalies have been compiled and reported by Mathematica Policy Research; the data anomalies report can be found at http://www.cms.gov/Research-Statistics-Data-and-Systems/Computer-Data-and-Systems/MedicaidDataSourcesGenInfo/downloads/anomalies1.pdf.3 When compared to the December 2015 edition of this table, District of Columbia and Massachusetts had a change in total FYE enrollees of 10 percent or more over the prior year. However, both states have since updated their 2012 enrollment total and no longer have a change of 10 percent or more.4 State was excluded due to data reliability concerns regarding completeness of monthly claims and enrollment data.
Source: MACPAC, 2017, analysis of MSIS data as of December 2016.
MACStats Section 3

MA
CStats: Medicaid and CH
IP Data Book
47
Section 3: Program Enrollm
ent and Spending—M
edicaid Overall
EXHIBIT 15b. Medicaid Full-Year Equivalent Enrollment by State and Eligibility Group, FY 2014 (thousands)
MACStats Section 3
State1
Total Child Adult2 Disabled AgedAll
enrolleesFull-benefit enrollees3
All enrollees
Full-benefit enrollees3
All enrollees
Full-benefit enrollees3
All enrollees
Full-benefit enrollees3
All enrollees
Full-benefit enrollees3
Arizona 1,317 1,190 654 643 387 318 162 147 113 82Arkansas 673 585 336 335 126 100 146 113 66 38California 11,057 8,559 3,588 3,423 5,336 3,063 1,037 1,027 1,095 1,045Connecticut 757 670 283 283 286 284 75 55 113 48Georgia 1,682 1,496 972 971 224 194 312 246 175 85Idaho 245 230 152 152 29 28 45 37 19 12Iowa 548 493 236 234 189 153 84 77 40 29Louisiana 1,142 966 577 577 231 153 222 180 111 56Massachusetts 1,603 1,497 398 384 665 603 369 367 171 144Michigan 2,010 1,859 946 934 570 475 359 336 136 114Minnesota 1,033 996 427 425 399 380 128 122 78 69Mississippi 687 577 346 345 92 63 164 125 85 44New Jersey 1,371 1,343 576 575 468 467 181 173 146 128New York 5,445 5,166 1,872 1,850 2,269 2,156 663 626 641 534Ohio 2,463 2,187 1,030 1,025 890 739 368 299 176 123Oklahoma 742 664 407 407 159 102 117 107 59 48Oregon 911 831 342 336 401 373 105 83 63 40Pennsylvania 2,183 1,987 912 911 386 269 654 619 231 187South Carolina 1,018 861 525 525 254 121 159 148 80 66South Dakota 109 101 64 64 14 14 19 15 11 7Tennessee 1,359 1,236 694 694 273 273 258 200 134 70Utah 300 294 182 182 58 58 43 40 17 14Vermont 176 169 62 62 68 68 24 22 22 16Washington 1,448 1,327 692 685 477 417 181 152 98 73West Virginia 477 442 182 182 153 153 103 84 40 23Wyoming 70 64 45 45 9 8 11 9 5 3
MACStats Section 3

Section 1Section 2Section 4Section 5Section 6
48
Section 3: Program Enrollm
ent and Spending—M
edicaid Overall
EXHIBIT 15b. (continued)
MACStats Section 3
Notes: FY is fiscal year. Full-year equivalent (FYE) may also be referred to as average monthly enrollment. Enrollment numbers generally include individuals ever enrolled in Medicaid-financed coverage during the year, even if for a single month; however, in the event individuals were also enrolled in CHIP-financed Medicaid coverage (i.e., Medicaid-expansion CHIP) during the year, they are excluded if their most recent enrollment month was in Medicaid-expansion CHIP. Numbers exclude individuals enrolled only in Medicaid-expansion CHIP during the year and enrollees in the territories. Children and adults under age 65 who qualify for Medicaid on the basis of disability are included in the disabled category. About 528,000 enrollees age 65 and older are identified in the data as disabled; because disability is not an eligibility pathway for individuals age 65 and older, MACPAC recodes these enrollees as aged. Values have not been updated from those published in the December 2017 data book due to the unavailability of more recent Medicaid Statistical Information System (MSIS) or Transformed MSIS (T-MSIS) data.
For MACPAC’s analysis, Medicaid enrollees were assigned a unique national identification number using an algorithm that incorporates state-specific ID numbers and beneficiary characteristics such as date of birth and gender. The state enrollment counts shown here are unduplicated using this national ID. Categories may not sum to total for each state due to rounding.1 Several states did not submit complete MSIS data for FY 2014 due to the ongoing transition to T-MSIS and were excluded from this exhibit. In addition, a few states were excluded due to data reliability concerns regarding the completeness and quality of the submitted MSIS data. This exhibit includes only states that had sufficient FY 2014 MSIS data. Due to the number of states excluded, a national total is not provided.2 Includes the new adult group made eligible under Section 1902(a)(10)(A)(i)(VIII) of the Social Security Act by the Patient Protection and Affordable Care Act (P.L. 111-148, as amended).3 In this exhibit, full-benefit enrollees columns exclude enrollees reported by states in the MSIS as receiving coverage of only emergency services, family planning services, or assistance with Medicare premiums and cost sharing.
Source: MACPAC, 2017, analysis of MSIS data as of December 2016.
Decem
ber 2018

MA
CStats: Medicaid and CH
IP Data Book
49
Section 3: Program Enrollm
ent and Spending—M
edicaid Overall
MACStats Section 3
EXHIBIT 16. Medicaid Spending by State, Category, and Source of Funds, FY 2017 (millions)
State1
Benefits State program administration Total MedicaidTotal Federal State Total Federal State Total Federal State
Alabama $5,562 $3,920 $1,642 $238 $148 $89 $5,800 $4,068 $1,732Alaska 1,962 1,371 591 122 67 56 2,084 1,437 646Arizona 11,824 8,974 2,849 277 194 83 12,101 9,169 2,932Arkansas 6,364 4,943 1,421 418 291 128 6,782 5,234 1,549California 82,384 48,601 33,783 5,930 3,650 2,279 88,314 52,251 36,063Colorado 7,805 4,508 3,297 379 230 148 8,184 4,738 3,446Connecticut 7,401 4,294 3,107 420 287 133 7,821 4,581 3,240Delaware 2,134 1,313 820 127 87 40 2,261 1,401 860District of Columbia 2,783 2,058 725 178 117 60 2,961 2,176 785Florida 23,169 14,186 8,983 752 442 310 23,921 14,628 9,293Georgia 10,106 6,882 3,224 545 370 175 10,651 7,252 3,399Hawaii 2,338 1,528 810 109 82 28 2,448 1,610 838Idaho 1,822 1,303 519 107 70 37 1,929 1,373 556Illinois 15,054 9,343 5,711 1,009 606 403 16,063 9,950 6,113Indiana 11,106 8,017 3,089 534 354 180 11,640 8,371 3,270Iowa 4,066 2,548 1,518 175 126 50 4,241 2,674 1,567Kansas 3,214 1,810 1,405 212 145 67 3,427 1,955 1,472Kentucky 9,527 7,401 2,126 253 183 70 9,780 7,584 2,197Louisiana 10,914 7,711 3,202 341 229 112 11,254 7,940 3,314Maine 2,565 1,654 911 169 124 46 2,735 1,778 957Maryland 11,161 6,775 4,386 449 290 159 11,610 7,065 4,545Massachusetts 17,121 9,355 7,766 1,027 624 403 18,148 9,979 8,169Michigan 16,711 12,126 4,585 654 442 212 17,365 12,568 4,797Minnesota 11,352 6,493 4,859 730 437 292 12,082 6,930 5,152Mississippi 5,462 4,081 1,381 215 146 69 5,677 4,227 1,450Missouri 10,096 6,397 3,699 432 281 151 10,528 6,678 3,850Montana 1,772 1,419 353 94 63 31 1,866 1,482 384Nebraska 2,042 1,060 982 123 86 37 2,165 1,146 1,019Nevada 3,530 2,646 884 186 129 57 3,717 2,775 941New Hampshire 2,055 1,224 831 108 73 35 2,163 1,297 866New Jersey 14,744 8,867 5,877 822 532 290 15,566 9,399 6,166New Mexico 4,804 3,713 1,092 216 146 70 5,020 3,858 1,162

Decem
ber 201850
Section 3: Program Enrollm
ent and Spending—M
edicaid Overall
MACStats
EXHIBIT 16. (continued)
State1
Benefits State program administration Total MedicaidTotal Federal State Total Federal State Total Federal State
New York $76,398 $37,264 $39,134 $2,165 $1,268 $897 $78,563 $38,532 $40,031North Carolina 13,337 8,937 4,400 675 474 201 14,012 9,411 4,600North Dakota 1,216 747 469 104 70 34 1,320 818 503Ohio 23,056 15,889 7,167 933 589 343 23,989 16,479 7,510Oklahoma 4,630 2,854 1,776 210 129 80 4,840 2,984 1,856Oregon 8,313 6,199 2,114 513 314 199 8,825 6,513 2,312Pennsylvania 28,081 17,112 10,969 1,003 630 373 29,084 17,742 11,341Rhode Island 2,623 1,554 1,069 163 111 53 2,786 1,665 1,122South Carolina 5,964 4,255 1,709 304 212 93 6,268 4,467 1,802South Dakota 851 501 350 52 31 21 903 532 371Tennessee 9,088 5,915 3,174 573 384 190 9,661 6,298 3,363Texas 35,645 20,112 15,533 1,508 967 541 37,153 21,079 16,074Utah 2,452 1,718 734 135 90 45 2,587 1,807 779Vermont 1,600 943 657 142 98 45 1,743 1,040 702Virginia 8,988 4,504 4,484 470 308 162 9,458 4,812 4,646Washington 11,893 7,573 4,320 714 424 290 12,607 7,997 4,610West Virginia 4,001 3,165 836 157 112 45 4,158 3,277 880Wisconsin 8,050 4,741 3,309 453 292 161 8,503 5,033 3,470Wyoming 592 304 288 57 40 17 649 343 305Subtotal (states) $569,730 $350,810 $218,920 $27,681 $17,594 $10,087 $597,411 $368,404 $229,007American Samoa 33 18 15 1 1 0 35 19 15Guam 79 51 28 4 3 1 83 54 29Northern Mariana Islands 30 17 13 1 0 0 30 17 13Puerto Rico 2,318 1,540 778 119 92 27 2,436 1,632 805Virgin Islands 54 34 20 16 13 3 70 47 23Subtotal (states and territories) $572,244 $352,470 $219,774 $27,821 $17,702 $10,119 $600,065 $370,172 $229,893MFCU – – – 339 254 85 339 254 85Medicaid survey and certification of nursing and intermediate care facilities – – – 357 268 89 357 268 89Vaccines for Children program – – – – – – 4,427 4,427 –Total $572,244 $352,470 $219,774 $28,517 $18,224 $10,293 $605,1882 $375,1212 $230,067
Section 3

MA
CStats: Medicaid and CH
IP Data Book
51
Section 3: Program Enrollm
ent and Spending—M
edicaid Overall
MACStats Section 3
EXHIBIT 16. (continued)
Notes: FY is fiscal year. MFCU is Medicaid Fraud Control Unit. Total federal spending shown here ($375,121 million) will differ from total federal outlays shown in FY 2019 budget documents due to slight differences in the timing of data for the states and the treatment of certain adjustments. Federal spending in the territories is capped; however, territories report their total spending regardless of whether they have reached their caps. As a result, federal spending shown here may exceed the amounts actually paid to the territories. State shares for Medicaid Fraud Control Units (MFCUs) and survey and certification are MACPAC estimates based on 75 percent federal match. State-level estimates for these items are available but are not shown here. The Vaccines for Children (VFC) program is authorized in the Medicaid statute but is operated as a separate program; 100 percent federal funding finances the purchase of vaccines for children who are enrolled in Medicaid, uninsured, or privately insured without vaccine coverage. Spending on administration is only for state programs; federal oversight spending is not included.
– Dash indicates zero; $0 indicates an amount less than $0.5 million that rounds to zero.1 Not all states had certified their CMS-64 Financial Management Report (FMR) submissions as of July 20, 2018. California’s fourth quarter submission was not certified; North Dakota's second, third, and fourth quarter submissions were not certified; Alabama's first quarter submission was not certified. Figures presented in this exhibit may change if states revise their expenditure data after this date.2 Amounts exceed the sum of benefits and state program administration columns due to the inclusion of the VFC program.
Sources: For state and territory spending: MACPAC, 2018, analysis of CMS-64 FMR net expenditure data as of July 20, 2018. For all other spending (MCFUs, survey and certification, VFC program): CMS, 2018, Fiscal year 2019 justification of estimates for appropriations committees, Baltimore, MD: CMS, https://www.cms.gov/About-CMS/Agency-Information/PerformanceBudget/Downloads/FY2019-CJ-Final.pdf.

Decem
ber 201852
Section 3: Program Enrollm
ent and Spending—M
edicaid Benefits
MACStats
EXHIBIT 17. Total Medicaid Benefit Spending by State and Category, FY 2017 (millions)
State1
Total spending
on benefits
Fee for service Managed care and premium
assistance
Medicare premiums
and coinsurance CollectionsHospital Physician Dental
Other practitioner
Clinic and health center
Other acute services Drugs
Institutional LTSS
Home and community-based LTSS
Alabama $5,562 $2,096 $460 $74 $62 $92 $535 $327 $1,002 $500 $117 $330 -$31
Alaska 1,962 591 183 100 37 298 144 45 208 343 0 29 -18
Arizona 11,824 1,255 51 5 8 43 487 6 84 1 9,546 339 -2
Arkansas 6,364 1,141 354 81 26 50 986 165 1,015 593 1,662 350 -59
California 82,384 10,346 806 1,016 15 3,095 10,218 777 4,011 8,540 41,327 2,882 -649
Colorado 7,805 2,537 745 123 – 305 297 252 835 1,279 1,323 181 -71
Connecticut 7,401 1,805 437 166 196 337 532 507 1,653 1,852 0 482 -565
Delaware2 2,134 74 12 40 0 2 69 -27 91 134 1,699 47 -8
District of Columbia 2,783 398 46 18 4 157 205 107 342 502 972 55 -23
Florida 23,169 2,290 239 4 18 190 541 215 967 1,263 15,898 1,657 -112
Georgia 10,106 2,091 335 24 33 19 657 250 1,433 1,176 3,738 447 -98
Hawaii2 2,338 44 0 31 0 27 6 -1 9 112 2,105 52 -48
Idaho 1,822 424 130 -0 24 32 196 62 302 376 229 66 -20
Illinois 15,054 3,812 298 57 124 162 777 218 1,908 1,354 5,936 505 -97
Indiana 11,106 944 95 57 8 410 281 81 2,762 1,323 4,920 286 -61
Iowa2 4,066 165 48 56 2 37 146 -175 84 48 3,590 155 -92
Kansas2 3,214 162 5 0 0 1 42 -2 92 0 2,829 105 -20
Kentucky 9,527 373 35 3 4 191 443 34 1,182 835 6,226 260 -59
Louisiana 10,914 1,402 48 4 – 29 206 68 1,488 763 6,677 353 -125
Maine 2,565 599 85 23 47 196 460 79 481 485 3 225 -117
Maryland 11,161 1,127 130 140 39 156 1,361 372 1,389 1,346 4,819 351 -69
Massachusetts 17,121 2,830 329 287 27 198 1,071 268 1,744 3,435 6,535 555 -158
Michigan 16,711 1,551 344 42 12 312 522 358 2,009 784 10,370 524 -117
Minnesota2 11,352 668 161 34 196 143 683 -67 1,164 2,952 5,329 220 -133
Mississippi 5,462 633 113 5 9 32 252 55 1,114 434 2,571 262 -17
Missouri 10,096 2,833 13 13 13 425 988 618 1,483 1,764 1,658 381 -92
Montana 1,772 662 122 58 43 34 280 98 196 231 15 52 -19
Nebraska2 2,042 101 11 42 1 2 64 -72 421 373 1,059 79 -40
Nevada 3,530 557 146 44 28 56 419 105 311 246 1,469 176 -27
New Hampshire2 2,055 264 11 23 2 6 194 -0 385 314 837 38 -17
Section 3

MA
CStats: Medicaid and CH
IP Data Book
53
Section 3: Program Enrollm
ent and Spending—M
edicaid Benefits
MACStats Section 3
EXHIBIT 17. (continued)
State1
Total spending
on benefits
Fee for service Managed care and premium
assistance
Medicare premiums
and coinsurance CollectionsHospital Physician Dental
Other practitioner
Clinic and health center
Other acute services Drugs
Institutional LTSS
Home and community-based LTSS
New Jersey $14,744 $1,561 $56 $3 $6 $373 $853 $17 $1,940 $1,107 $8,630 $412 -$214New Mexico 4,804 494 26 12 48 6 66 12 31 390 3,592 152 -24New York2 76,398 9,218 346 55 185 1,214 6,590 -3,957 8,504 7,029 47,018 1,620 -1,424North Carolina 13,337 4,633 956 318 106 267 1,223 623 897 782 3,247 480 -195North Dakota 1,216 143 40 14 13 19 47 16 377 240 299 15 -6Ohio 23,056 2,657 192 43 11 120 1,762 97 2,312 3,560 11,786 622 -106Oklahoma 4,630 1,779 446 94 32 352 352 393 683 552 130 169 -350Oregon 8,313 599 37 3 31 182 378 75 451 1,918 4,476 239 -77Pennsylvania 28,081 1,533 67 22 2 59 387 20 5,101 5,309 15,017 762 -198Rhode Island2 2,623 340 6 10 0 45 455 -2 142 1 1,580 60 -14South Carolina 5,964 1,031 122 127 19 104 341 41 835 608 2,742 235 -240South Dakota 851 235 63 19 3 79 59 23 185 156 1 35 -8Tennessee 9,088 909 41 172 0 59 278 506 254 680 5,802 438 -50Texas2 35,645 5,255 123 48 359 27 5,527 -19 1,651 2,411 19,694 1,269 -700Utah 2,452 287 66 23 3 11 130 59 373 321 1,185 52 -57Vermont2 1,600 40 1 0 0 0 1,499 -121 125 52 0 5 -1Virginia 8,988 988 139 159 32 64 1,197 18 1,161 1,656 3,340 292 -57Washington 11,893 669 58 177 10 705 441 172 1,030 2,276 6,053 416 -113West Virginia 4,001 619 83 13 9 20 210 86 784 516 1,544 153 -36Wisconsin 8,050 803 43 50 21 344 674 381 851 924 3,759 324 -124Wyoming 592 129 39 13 20 42 26 17 150 139 12 14 -7Subtotal (states) $569,730 $77,696 $8,739 $3,946 $1,891 $11,130 $45,555 $3,181 $58,000 $63,985 $283,369 $19,204 -$6,966American Samoa 33 28 – – – 0 3 1 – – – 2 –Guam 79 23 7 2 0 1 23 22 1 0 – 2 –N. Mariana Islands 30 15 – 1 – 3 5 3 – 2 – 1 –Puerto Rico 2,318 – – – – – 33 – – – 2,284 – –Virgin Islands 54 28 5 2 2 1 4 11 0 0 – 1 –Total (states and territories) $572,244 $77,790 $8,752 $3,951 $1,892 $11,134 $45,622 $3,218 $58,001 $63,987 $285,653 $19,209 -$6,966Percent of total, exclusive of collections — 13.4% 1.5% 0.7% 0.3% 1.9% 7.9% 0.6% 10.0% 11.0% 49.3% 3.3% —

Decem
ber 201854
Section 3: Program Enrollm
ent and Spending—M
edicaid Benefits
MACStats Section 3
EXHIBIT 17. (continued)
Notes: FY is fiscal year. LTSS is long-term services and supports. Includes federal and state funds. Service category definitions and spending amounts shown here may differ from other CMS data sources, such as the Medicaid Statistical Information System. The specific services included in each category have changed over time and therefore may not be directly comparable to earlier editions of MACStats. Collections includes third-party liability, estate, and other recoveries.
– Dash indicates zero; $0 or -$0 indicates an amount between $0.5 and -$0.5 million that rounds to zero.
Additional detail on categories:
• Hospital includes inpatient, outpatient, critical access hospital, and emergency hospital services, as well as related disproportionate share hospital payments.
• Physician includes physician and surgical services, both regular payments and those associated with the primary care physician payment increase.
• Clinic and health center includes non-hospital outpatient clinic, rural health clinic, federally qualified health center, and freestanding birth center.
• Other acute services includes lab or X-ray; sterilizations; abortions; early and periodic screening, diagnostic, and treatment screenings; emergency services forunauthorized aliens; non-emergency transportation; physical, occupational, speech, and hearing therapy; prosthetics, dentures, and eyeglasses; U.S. Preventive ServicesTask Force (USPSTF) grade A or B preventive services and Advisory Committee on Immunization Practices (ACIP) vaccines; other diagnostic screening and preventiveservices; school-based services; health home with chronic conditions; tobacco cessation for pregnant women; private duty nursing; case management (excluding primarycare case management); rehabilitative services; hospice; and other care not otherwise categorized.
• Drugs are net of rebates.
• Institutional LTSS includes nursing facility, intermediate care facility for individuals with intellectual disabilities, and mental health facility.
• Home and community-based LTSS includes home health, waiver and state plan services, personal care, and certified community behavioral health clinic.
• Managed care and premium assistance includes comprehensive and limited-benefit managed care plans, primary care case management, employer-sponsored premiumassistance programs, and Programs of All-Inclusive Care for the Elderly. Comprehensive plans account for over 90 percent of spending in the managed care category.Managed care also includes rebates for drugs provided by managed care plans and managed care payments associated with the primary care physician paymentincrease, Community First Choice option, USPSTF grade A or B preventive services, ACIP vaccines, and certified community behavioral health clinic.
1 Not all states had certified their CMS-64 Financial Management Report (FMR) submissions as of July 20, 2018. California’s fourth quarter submission was not certified; North Dakota's second, third, and fourth quarter submissions were not certified; Alabama's first quarter submission was not certified. Figures presented in this exhibit may change if states revise their expenditure data after this date.2 State reports negative fee-for-service (FFS) drug spending after the application of drug rebates. The negative net amount may reflect a shift of some FFS drug spending into Medicaid managed care or the state not separately reporting the FFS and managed care drug rebates. Vermont shows negative drug spending because it reports most of its benefit spending under other care services in its CMS-64 submission.
Source: MACPAC, 2018, analysis of CMS-64 FMR net expenditure data as of July 20, 2018.
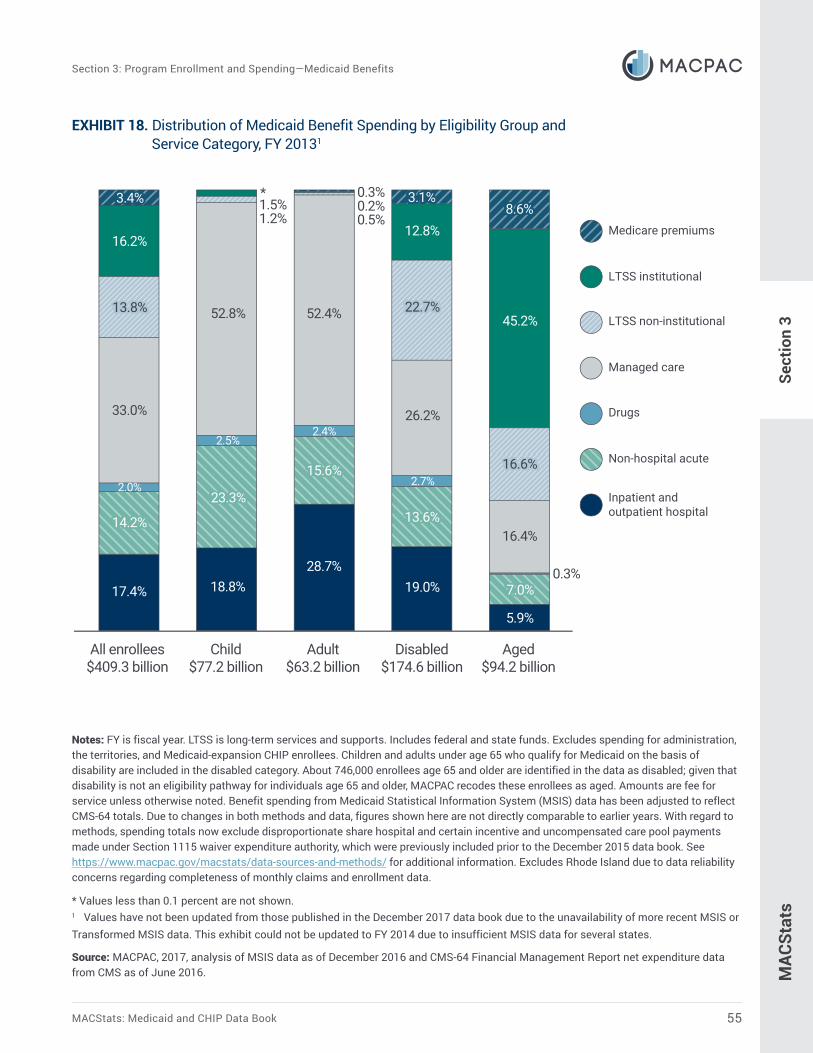
MACStats: Medicaid and CHIP Data Book 55
Section 3: Program Enrollment and Spending—Medicaid Benefits
MAC
Stat
sSe
ctio
n 3
EXHIBIT 18. Distribution of Medicaid Benefit Spending by Eligibility Group andService Category, FY 20131
Notes: FY is fiscal year. LTSS is long-term services and supports. Includes federal and state funds. Excludes spending for administration, the territories, and Medicaid-expansion CHIP enrollees. Children and adults under age 65 who qualify for Medicaid on the basis of disability are included in the disabled category. About 746,000 enrollees age 65 and older are identified in the data as disabled; given that disability is not an eligibility pathway for individuals age 65 and older, MACPAC recodes these enrollees as aged. Amounts are fee for service unless otherwise noted. Benefit spending from Medicaid Statistical Information System (MSIS) data has been adjusted to reflect CMS-64 totals. Due to changes in both methods and data, figures shown here are not directly comparable to earlier years. With regard to methods, spending totals now exclude disproportionate share hospital and certain incentive and uncompensated care pool payments made under Section 1115 waiver expenditure authority, which were previously included prior to the December 2015 data book. See https://www.macpac.gov/macstats/data-sources-and-methods/ for additional information. Excludes Rhode Island due to data reliability concerns regarding completeness of monthly claims and enrollment data.
* Values less than 0.1 percent are not shown.1 Values have not been updated from those published in the December 2017 data book due to the unavailability of more recent MSIS orTransformed MSIS data. This exhibit could not be updated to FY 2014 due to insufficient MSIS data for several states.
Source: MACPAC, 2017, analysis of MSIS data as of December 2016 and CMS-64 Financial Management Report net expenditure data from CMS as of June 2016.
Medicare premiums
LTSS institutional
LTSS non-institutional
Managed care
Drugs
Non-hospital acute
Inpatient and outpatient hospital
All enrollees $409.3 billion
Child$77.2 billion
Adult$63.2 billion
Disabled $174.6 billion
Aged$94.2 billion
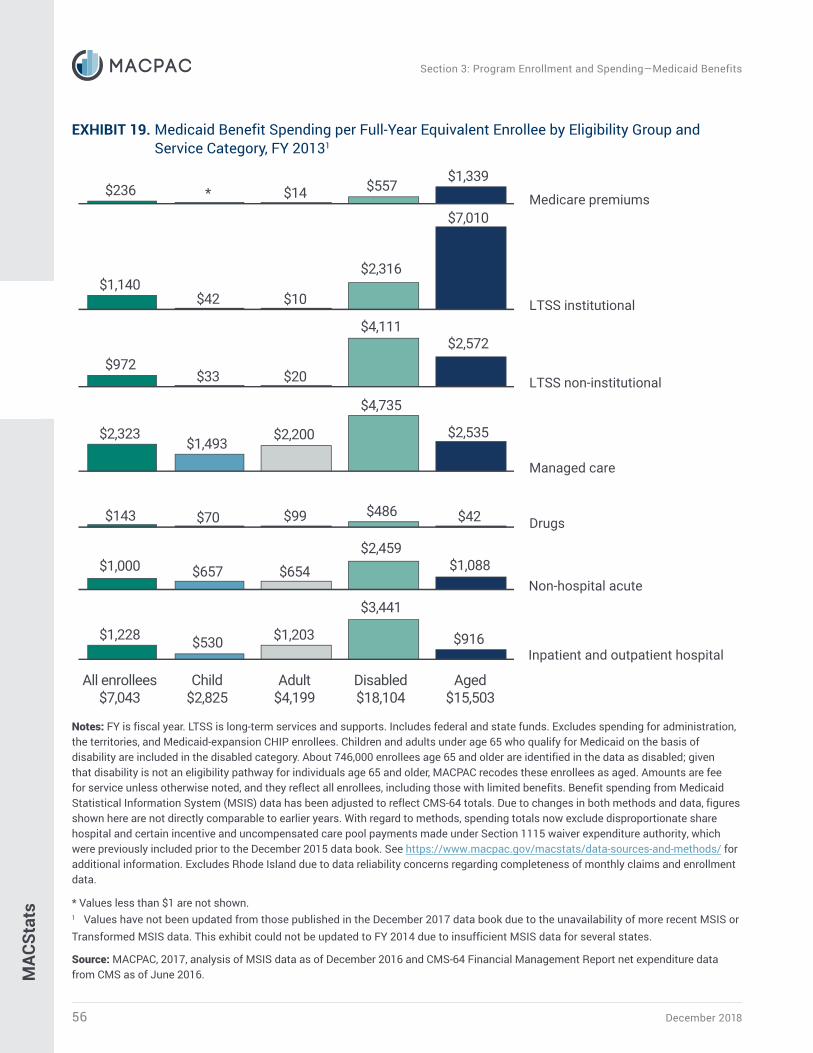
December 201856
Section 3: Program Enrollment and Spending—Medicaid Benefits
MAC
Stat
s
EXHIBIT 19. Medicaid Benefit Spending per Full-Year Equivalent Enrollee by Eligibility Group and Service Category, FY 2013
Notes: FY is fiscal year. LTSS is long-term services and supports. Includes federal and state funds. Excludes spending for administration, the territories, and Medicaid-expansion CHIP enrollees. Children and adults under age 65 who qualify for Medicaid on the basis of disability are included in the disabled category. About 746,000 enrollees age 65 and older are identified in the data as disabled; given that disability is not an eligibility pathway for individuals age 65 and older, MACPAC recodes these enrollees as aged. Amounts are fee for service unless otherwise noted, and they reflect all enrollees, including those with limited benefits. Benefit spending from Medicaid Statistical Information System (MSIS) data has been adjusted to reflect CMS-64 totals. Due to changes in both methods and data, figures shown here are not directly comparable to earlier years. With regard to methods, spending totals now exclude disproportionate share hospital and certain incentive and uncompensated care pool payments made under Section 1115 waiver expenditure authority, which were previously included prior to the December 2015 data book. See https://www.macpac.gov/macstats/data-sources-and-methods/ for additional information. Excludes Rhode Island due to data reliability concerns regarding completeness of monthly claims and enrollment data.
* Values less than $1 are not shown.1 Values have not been updated from those published in the December 2017 data book due to the unavailability of more recent MSIS orTransformed MSIS data. This exhibit could not be updated to FY 2014 due to insufficient MSIS data for several states.
Source: MACPAC, 2017, analysis of MSIS data as of December 2016 and CMS-64 Financial Management Report net expenditure data from CMS as of June 2016.
1
Sect
ion
3Se
ctio
n 3
Medicare premiums
LTSS institutional
LTSS non-institutional
Managed care
Drugs
All enrollees $7,043
Child$2,825
Adult$4,199
Disabled $18,104
Aged$15,503
Non-hospital acute
Inpatient and outpatient hospital

MACStats: Medicaid and CHIP Data Book 57
Section 3: Program Enrollment and Spending—Medicaid Benefits
MAC
Stat
sSe
ctio
n 3
EXHIBIT 20. Distribution of Medicaid Enrollment and Benefit Spending by Users andNon-Users of Long-Term Services and Supports, FY 2013
1
Notes: FY is fiscal year. LTSS is long-term services and supports. HCBS is home and community-based services. Includes federal and state funds. Excludes spending on administration, the territories, and Medicaid-expansion CHIP enrollees. Benefit spending from Medicaid Statistical Information System (MSIS) data has been adjusted to reflect CMS-64 totals, and enrollment counts are unduplicated using unique national identification numbers. Due to changes in both methods and data, figures shown here are not directly comparable to earlier years. With regard to methods, spending totals now exclude disproportionate share hospital payments and certain incentive and uncompensated care pool payments made under Section 1115 waiver expenditure authority, which were previously included prior to the December 2015 data book. See https://www.macpac.gov/macstats/data-sources-and-methods/ for additional information.
LTSS users are defined here as enrollees using at least one LTSS service during the year under a fee-for-service arrangement. (The data do not allow a breakout of LTSS services delivered through managed care.) For example, an enrollee with a short stay in a nursing facility for rehabilitation following a hospital discharge and an enrollee with permanent residence in a nursing facility would both be counted as LTSS users. Excludes Rhode Island due to data reliability concerns regarding completeness of monthly claims and enrollment data.1 Values have not been updated from those published in the December 2017 data book due to the unavailability of more recent MSIS or Transformed MSIS data. This exhibit could not be updated to FY 2014 due to insufficient MSIS data for several states. 2 All states have HCBS waiver programs that provide a range of LTSS for targeted populations of non-institutionalized enrollees who require institutional levels of care. Based on a comparison with CMS-372 data (a state-reported source containing aggregate spending and enrollment for HCBS waivers), the number of HCBS waiver enrollees may be underreported in the MSIS.
Source: MACPAC, 2017, analysis of MSIS data as of December 2016 and CMS-64 Financial Management Report net expenditure data from CMS as of June 2016.
Sect
ion
3
Not using LTSS
Using LTSS: Non-institutional only, no services under HCBS waiver 2
Using LTSS: Non-institutional only, some with services under HCBS waiver 2
Using LTSS: Institutional only
Using LTSS: Both institutional and non-institutional
41.9% of spending ($171.7 billion) is for LTSS users
5.9% of enrollees (4.2 million) are
LTSS users
All enrollees 70.0 million
Benefit spending for LTSS and all other services
$409.3 billion

Decem
ber 201858
Section 3: Program Enrollm
ent and Spending—M
edicaid Benefits
MACStats
EXHIBIT 21a. Medicaid Spending by State, Eligibility Group, and Dually Eligible Status, FY 2013 (millions)
State TotalBasis of eligibility1
Dually eligible status2
All dually eligible enrollees
Dually eligible with full benefits
Dually eligible with limited benefits
Child Adult Disabled Aged Total Age 65+ Total Age 65+ Total Age 65+Total $409,266 18.9% 15.5% 42.7% 23.0% $146,091 60.4% $139,820 60.7% $6,271 53.5%Alabama 4,568 23.7 9.9 41.9 24.6 1,651 67.1 1,414 69.2 237 54.7Alaska 1,335 27.4 16.3 36.1 20.1 399 57.2 398 57.2 1 69.3Arizona 7,586 24.0 28.5 33.7 13.7 1,611 57.3 1,553 57.1 57 62.4Arkansas 4,141 25.0 4.9 47.4 22.7 1,494 60.9 1,346 63.4 148 38.0California 57,297 17.3 17.9 40.8 24.0 18,105 67.4 17,635 67.4 471 68.8Colorado 4,898 21.3 15.0 42.5 21.1 1,585 61.3 1,544 61.7 41 46.5Connecticut 6,452 15.6 24.0 31.3 29.0 2,985 59.2 2,810 58.8 175 65.1Delaware 1,552 19.1 31.5 32.0 17.4 465 56.0 431 56.8 34 46.0District of Columbia 2,232 11.2 20.9 47.9 20.0 610 61.3 609 61.3 1 36.2Florida 17,232 19.0 14.0 40.9 26.1 6,706 63.0 5,867 64.4 839 53.2Georgia 8,530 24.1 13.0 41.4 21.5 2,634 67.2 2,372 68.9 262 51.8Hawaii 1,524 14.1 22.0 35.3 28.6 578 71.8 568 72.0 10 62.8Idaho 1,648 21.7 11.6 47.5 19.2 403 46.5 368 47.1 35 40.2Illinois 15,211 24.1 17.6 38.0 20.4 4,725 57.8 4,637 58.0 88 49.5Indiana 7,630 16.8 12.4 46.0 24.9 3,145 57.8 2,947 59.3 198 35.7Iowa 3,649 17.3 10.6 49.3 22.7 1,682 48.9 1,643 48.7 39 56.6Kansas 2,441 22.9 7.8 46.6 22.8 945 55.5 893 56.6 52 37.4Kentucky 5,606 22.9 11.0 47.3 18.8 1,678 60.6 1,517 62.3 161 45.4Louisiana 6,380 17.1 12.0 50.7 20.2 2,166 57.6 1,975 58.2 191 51.3Maine 2,850 14.2 16.1 44.8 24.8 1,264 55.3 1,149 54.0 115 67.5Maryland 7,647 19.2 20.3 41.0 19.5 2,323 59.4 2,188 60.1 135 49.0Massachusetts 12,338 12.1 13.7 47.3 26.9 5,512 57.0 5,471 56.7 40 94.7Michigan 11,998 18.6 16.1 45.8 19.5 3,804 58.8 3,699 59.1 105 48.0Minnesota 8,873 15.8 22.3 41.6 20.2 3,430 50.1 3,403 50.1 27 51.0Mississippi 4,518 20.3 9.9 45.5 24.4 1,711 64.0 1,504 66.7 207 44.2Missouri 8,248 23.6 9.2 49.3 17.9 2,695 49.7 2,637 49.8 58 46.6Montana 989 25.2 10.7 39.0 25.1 387 64.0 363 65.1 24 47.1Nebraska 1,788 18.6 10.6 46.2 24.6 787 51.3 778 51.3 9 52.5Nevada 1,742 28.7 13.2 43.2 14.8 385 60.3 331 62.0 55 49.9New Hampshire 1,162 23.5 6.1 38.0 32.4 607 59.0 585 59.7 22 40.5New Jersey 9,266 15.5 8.4 46.7 29.3 4,491 56.9 4,448 56.8 43 66.1
Section 3Section 3

MA
CStats: Medicaid and CH
IP Data Book
59
Section 3: Program Enrollm
ent and Spending—M
edicaid Benefits
MACStats Section 3
EXHIBIT 21a. (continued)
State TotalBasis of eligibility1
Dually eligible status2
All dually eligible enrollees
Dually eligible with full benefits
Dually eligible with limited benefits
Child Adult Disabled Aged Total Age 65+ Total Age 65+ Total Age 65+New Mexico $3,270 38.3% 26.0% 32.2% 3.6% $351 31.2% $301 27.3% $50 54.6%New York 50,354 10.6 21.6 38.9 28.9 21,470 63.3 21,169 63.2 301 70.7North Carolina 11,298 23.1 13.6 45.6 17.8 3,499 56.7 3,361 57.1 138 47.5North Dakota 783 16.7 8.4 43.2 31.6 429 56.9 424 57.0 5 46.1Ohio 16,154 15.0 17.1 44.8 23.0 5,899 56.9 5,627 57.8 272 38.1Oklahoma 4,754 28.8 15.6 38.9 16.7 1,380 53.7 1,348 53.8 33 51.3Oregon 4,782 16.9 22.7 37.8 22.6 1,637 63.8 1,551 64.9 86 44.3Pennsylvania 20,245 16.1 6.7 52.9 24.3 7,719 61.5 7,588 61.6 131 54.8Rhode Island 3 3 3 3 3 3 3 3 3 3 3
South Carolina 4,449 23.0 15.8 41.4 19.7 1,500 58.5 1,470 58.5 29 56.0South Dakota 765 23.4 11.7 44.2 20.8 284 54.9 265 55.6 20 44.9Tennessee 7,617 23.2 14.4 39.5 22.9 2,885 59.1 2,684 60.1 201 45.2Texas 24,417 30.2 6.9 43.4 19.6 7,330 63.5 6,596 63.6 733 62.6Utah 2,101 28.8 17.1 43.8 10.2 559 36.8 551 36.7 8 40.3Vermont 1,431 4 4 4 4 4 4 4 4 4 4
Virginia 7,105 21.1 11.4 45.7 21.8 2,575 54.4 2,446 55.0 129 41.7Washington 7,805 22.2 15.0 44.0 18.8 2,338 61.2 2,215 62.2 123 41.8West Virginia 2,949 16.8 9.6 50.1 23.6 1,120 61.1 1,054 62.1 66 46.4Wisconsin 7,105 11.9 15.7 43.7 28.8 3,522 56.3 3,484 56.3 39 57.6Wyoming 554 20.4 8.8 45.3 25.6 277 50.7 257 51.3 19 41.4
Notes: FY is fiscal year. Includes federal and state funds. Excludes spending for administration, the territories, and Medicaid-expansion CHIP enrollees. Benefit spending from Medicaid Statistical Information System (MSIS) data has been adjusted to reflect CMS-64 totals. Due to changes in both methods and data, figures shown here are not directly comparable to earlier years. With regard to methods, spending totals now exclude disproportionate share hospital (DSH) and certain incentive and uncompensated care pool payments made under Section 1115 waiver expenditure authority, which were included prior to the December 2015 data book. See https://www.macpac.gov/macstats/data-sources-and-methods/ for additional information. Values have not been updated from those published in the December 2017 data book due to the unavailability of more recent MSIS or Transformed MSIS data.1 Children and adults under age 65 who qualify for Medicaid on the basis of disability are included in the disabled category. About 746,000 enrollees age 65 and older are identified in the data as disabled; because disability is not an eligibility pathway for individuals age 65 and older, MACPAC recodes these enrollees as aged.2 Dually eligible enrollees are covered by both Medicaid and Medicare; those with limited benefits receive Medicaid assistance only with Medicare premiums and cost sharing.3 State was excluded due to data reliability concerns regarding the completeness of monthly claims and enrollment data.4 Due to large differences in the way Vermont reports spending in CMS-64 and in MSIS, MACPAC’s adjustment methodology is applied only to total Medicaid spending.
Source: MACPAC, 2017, analysis of MSIS data as of December 2016 and CMS-64 Financial Management Report net expenditure data as of June 2016.
Section 3

Section 6 Section 5 Section 2Section 4 Section 1
60
Section 3: Program Enrollm
ent and Spending—M
edicaid BenefitsEXHIBIT 21b. Medicaid Spending by State, Eligibility Group, and Dually Eligible Status, FY 2014 (millions)
MACStats Section 3
State1 TotalBasis of eligibility2
Dually eligible status3
All dually eligible enrollees
Dually eligible with full benefits
Dually eligible with limited benefits
Child Adult4 Disabled Aged Total Age 65+ Total Age 65+ Total Age 65+Arizona $8,757 25.0% 23.9% 36.4% 14.6% $2,080 55.5% $2,004 55.3% $76 61.2%
Arkansas 4,858 27.9 8.9 42.1 21.2 1,596 61.9 1,444 64.4 152 37.7
California 58,116 16.9 24.2 36.1 22.9 17,321 67.7 16,906 67.7 415 70.6
Connecticut 7,082 16.3 27.9 29.7 26.1 2,944 58.9 2,732 58.5 212 64.0
Georgia 9,051 26.9 13.7 39.3 20.0 2,624 66.9 2,353 68.6 271 51.7
Idaho 1,584 23.4 11.5 45.6 19.5 402 46.8 368 47.2 33 42.4
Iowa 3,993 16.1 18.0 44.4 21.5 1,712 49.7 1,671 49.5 41 56.6
Louisiana 6,233 18.5 12.6 49.3 19.5 2,064 57.5 1,878 58.0 185 52.3
Massachusetts 13,338 11.2 20.4 42.5 26.0 5,543 59.1 5,502 58.8 41 95.2
Michigan 13,019 19.2 19.2 43.7 17.8 3,785 58.8 3,682 59.3 103 42.1
Minnesota 10,013 17.4 24.3 39.3 19.0 3,678 49.4 3,650 49.3 28 55.0
Mississippi 4,662 20.8 10.4 45.7 23.1 1,700 62.8 1,483 65.6 217 43.9
New Jersey 11,235 14.6 20.6 39.6 25.3 4,664 57.2 4,624 57.1 41 67.1
New York 48,190 11.0 23.7 34.7 30.5 19,985 68.5 19,685 68.5 300 71.6
Ohio 18,909 16.5 25.8 39.1 18.6 5,678 54.9 5,429 55.7 249 37.4
Oklahoma 4,922 28.9 15.4 39.0 16.6 1,408 54.3 1,374 54.4 35 50.1
Oregon 6,555 14.2 37.9 28.0 19.9 1,892 66.7 1,801 67.7 92 46.9
Pennsylvania 22,666 17.8 7.1 52.2 22.9 8,146 61.2 8,008 61.3 138 54.3
South Carolina 5,058 24.4 17.4 39.8 18.3 1,597 58.1 1,567 58.2 29 56.6
South Dakota 783 24.2 12.0 43.5 20.3 287 54.6 266 55.2 20 47.0
Tennessee 8,480 26.5 17.7 39.4 16.4 2,512 53.7 2,307 54.3 205 46.8
Utah 2,062 29.4 15.4 43.4 11.8 598 39.6 588 39.6 9 38.1
Vermont 1,465 5 5 5 5 5 5 5 5 5 5
Washington 10,022 15.2 41.2 28.2 15.4 2,466 61.2 2,336 62.2 130 43.7
West Virginia 3,275 16.3 21.0 40.8 21.9 1,154 61.2 1,085 62.3 70 44.9
Wyoming 547 20.8 8.0 45.9 25.3 282 49.0 259 49.4 23 43.9
MACStats Section 3
Decem
ber 2018

Section 6 Section 5 Section 2Section 4 Section 1
MA
CStats: Medicaid and CH
IP Data Book
61
Section 3: Program Enrollm
ent and Spending—M
edicaid BenefitsEXHIBIT 21b. (continued)
MACStats Section 3
Notes: FY is fiscal year. Includes federal and state funds. Excludes spending for administration, the territories, and Medicaid-expansion CHIP enrollees. Benefit spending from Medicaid Statistical Information System (MSIS) data has been adjusted to reflect CMS-64 totals. Due to changes in both methods and data, figures shown here are not directly comparable to earlier years. With regard to methods, spending totals now exclude disproportionate share hospital and certain incentive and uncompensated care pool payments made under Section 1115 waiver expenditure authority, which were included prior to the December 2015 data book. See https://www.macpac.gov/macstats/data-sources-and-methods/ for additional information. 1 Values have not been updated from those published in the December 2017 data book due to the unavailability of more recent MSIS or Transformed MSIS (T-MSIS) data. Several states did not submit complete MSIS data for FY 2014 due to the ongoing transition to T-MSIS and were excluded from this exhibit. In addition, a few states were excluded due to data reliability concerns regarding the completeness and quality of the submitted MSIS data. This exhibit includes only states that had sufficient FY 2014 MSIS data. Due to the number of states excluded, a national total is not provided.2 Children and adults under age 65 who qualify for Medicaid on the basis of disability are included in the disabled category. About 528,000 enrollees age 65 and older are identified in the data as disabled; because disability is not an eligibility pathway for individuals age 65 and older, MACPAC recodes these enrollees as aged.3 Dually eligible enrollees are covered by both Medicaid and Medicare; those with limited benefits receive Medicaid assistance only with Medicare premiums and cost sharing.4 Includes the new adult group made eligible under Section 1902(a)(10)(A)(i)(VIII) of the Social Security Act by the Patient Protection and Affordable Care Act (P.L. 111-148, as amended).5 Due to large differences in the way Vermont reports spending in CMS-64 and in MSIS, MACPAC’s adjustment methodology is applied only to total Medicaid spending.
Source: MACPAC, 2017, analysis of MSIS data as of December 2016 and CMS-64 Financial Management Report net expenditure data as of June 2016.
MACStats Section 3

Decem
ber 201862
Section 3: Program Enrollm
ent and Spending—M
edicaid Benefits
MACStats
EXHIBIT 22a. Medicaid Benefit Spending per Full-Year Equivalent Enrollee by State and Eligibility Group, FY 2013
State
Total Child Adult Disabled AgedAll
enrolleesFull-benefit enrollees1
All enrollees
Full-benefit enrollees1
All enrollees
Full-benefit enrollees1
All enrollees
Full-benefit enrollees1
All enrollees
Full-benefit enrollees1
Total $7,043 $7,742 $2,825 $2,842 $4,199 $5,149 $18,104 $20,077 $15,503 $19,950
Alabama 4,717 5,598 2,252 2,252 2,731 5,077 9,001 11,092 10,173 21,493
Alaska 12,061 12,102 5,957 5,957 8,879 8,869 30,736 31,013 29,998 31,101
Arizona 5,582 5,821 2,810 2,844 4,894 5,337 15,920 16,495 9,666 12,321
Arkansas 6,890 8,206 3,338 3,374 2,473 6,080 13,598 16,603 14,555 23,224
California 6,156 7,898 2,960 3,090 2,624 4,564 22,866 22,826 13,279 13,364
Colorado2 6,819 6,922 2,574 2,558 5,072 4,822 18,779 20,628 18,399 23,590
Connecticut 8,830 9,671 3,463 3,465 6,036 6,075 26,992 35,009 17,353 37,286
Delaware 7,272 8,110 3,476 3,500 5,547 6,206 19,352 25,982 18,766 38,639
District of Columbia3 10,366 10,338 3,373 3,373 5,466 5,382 29,100 29,127 23,326 23,401
Florida 5,090 5,420 1,899 1,880 4,155 3,978 12,038 15,048 9,120 14,733
Georgia2 5,355 5,819 2,301 2,300 5,000 5,633 11,530 13,929 10,713 19,895
Hawaii 6,046 6,097 2,017 2,015 4,066 4,058 13,961 14,402 17,696 19,529
Idaho 7,176 7,446 2,515 2,511 7,099 7,002 18,368 21,352 17,741 26,761
Illinois 5,683 5,854 2,595 2,595 3,582 3,794 19,133 20,049 14,305 15,856
Indiana 7,409 7,743 2,270 2,270 5,128 5,361 17,836 20,940 22,232 29,935
Iowa 7,078 7,647 2,674 2,679 2,471 2,405 21,626 23,183 21,130 28,468
Kansas 6,944 7,249 2,671 2,669 5,004 4,771 15,782 18,719 16,956 23,749
Kentucky 7,279 7,848 3,422 3,416 6,835 6,749 12,236 14,526 11,954 19,363
Louisiana 5,654 6,354 1,937 1,937 3,350 4,361 14,321 16,844 11,616 20,667
Maine2 8,856 9,754 3,538 3,542 5,392 5,422 19,495 22,395 12,556 24,275
Maryland 7,937 8,195 3,278 3,266 5,094 4,851 22,912 26,128 20,151 29,613
Massachusetts3 9,474 10,088 4,022 4,129 4,192 4,581 16,106 16,156 19,864 23,377
Michigan 6,394 6,729 2,301 2,316 4,615 5,375 15,482 16,252 17,646 20,479
Minnesota 9,842 10,181 3,671 3,682 6,309 6,619 28,098 29,370 24,397 27,425
Mississippi 6,904 7,625 2,792 2,791 5,305 5,864 12,902 15,905 13,237 22,683
Section 3Section 3
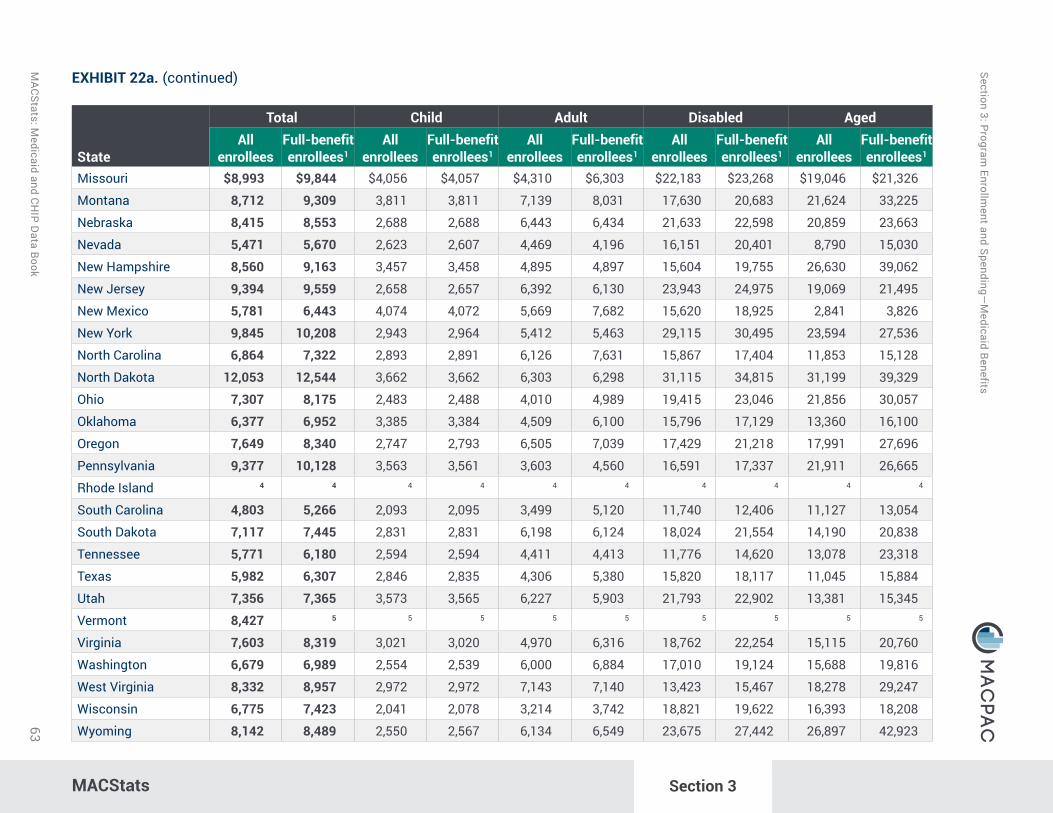
MA
CStats: Medicaid and CH
IP Data Book
63
Section 3: Program Enrollm
ent and Spending—M
edicaid Benefits
MACStats Section 3
EXHIBIT 22a. (continued)
State
Total Child Adult Disabled AgedAll
enrolleesFull-benefit enrollees1
All enrollees
Full-benefit enrollees1
All enrollees
Full-benefit enrollees1
All enrollees
Full-benefit enrollees1
All enrollees
Full-benefit enrollees1
Missouri $8,993 $9,844 $4,056 $4,057 $4,310 $6,303 $22,183 $23,268 $19,046 $21,326
Montana 8,712 9,309 3,811 3,811 7,139 8,031 17,630 20,683 21,624 33,225
Nebraska 8,415 8,553 2,688 2,688 6,443 6,434 21,633 22,598 20,859 23,663
Nevada 5,471 5,670 2,623 2,607 4,469 4,196 16,151 20,401 8,790 15,030
New Hampshire 8,560 9,163 3,457 3,458 4,895 4,897 15,604 19,755 26,630 39,062
New Jersey 9,394 9,559 2,658 2,657 6,392 6,130 23,943 24,975 19,069 21,495
New Mexico 5,781 6,443 4,074 4,072 5,669 7,682 15,620 18,925 2,841 3,826
New York 9,845 10,208 2,943 2,964 5,412 5,463 29,115 30,495 23,594 27,536
North Carolina 6,864 7,322 2,893 2,891 6,126 7,631 15,867 17,404 11,853 15,128
North Dakota 12,053 12,544 3,662 3,662 6,303 6,298 31,115 34,815 31,199 39,329
Ohio 7,307 8,175 2,483 2,488 4,010 4,989 19,415 23,046 21,856 30,057
Oklahoma 6,377 6,952 3,385 3,384 4,509 6,100 15,796 17,129 13,360 16,100
Oregon 7,649 8,340 2,747 2,793 6,505 7,039 17,429 21,218 17,991 27,696
Pennsylvania 9,377 10,128 3,563 3,561 3,603 4,560 16,591 17,337 21,911 26,665
Rhode Island 4 4 4 4 4 4 4 4 4 4
South Carolina 4,803 5,266 2,093 2,095 3,499 5,120 11,740 12,406 11,127 13,054
South Dakota 7,117 7,445 2,831 2,831 6,198 6,124 18,024 21,554 14,190 20,838
Tennessee 5,771 6,180 2,594 2,594 4,411 4,413 11,776 14,620 13,078 23,318
Texas 5,982 6,307 2,846 2,835 4,306 5,380 15,820 18,117 11,045 15,884
Utah 7,356 7,365 3,573 3,565 6,227 5,903 21,793 22,902 13,381 15,345
Vermont 8,427 5 5 5 5 5 5 5 5 5
Virginia 7,603 8,319 3,021 3,020 4,970 6,316 18,762 22,254 15,115 20,760
Washington 6,679 6,989 2,554 2,539 6,000 6,884 17,010 19,124 15,688 19,816
West Virginia 8,332 8,957 2,972 2,972 7,143 7,140 13,423 15,467 18,278 29,247
Wisconsin 6,775 7,423 2,041 2,078 3,214 3,742 18,821 19,622 16,393 18,208
Wyoming 8,142 8,489 2,550 2,567 6,134 6,549 23,675 27,442 26,897 42,923
Section 3

64
Section 3: Program Enrollm
ent and Spending—M
edicaid Benefits
MACStats Section 3
EXHIBIT 22a. (continued)
Notes: FY is fiscal year. Full-year equivalent (FYE) may also be referred to as average monthly enrollment. Includes federal and state funds. Excludes spending for administration, the territories, and Medicaid-expansion CHIP enrollees. Children and adults under age 65 who qualify for Medicaid on the basis of disability are included in the disabled category. About 746,000 enrollees age 65 and older are identified in the data as disabled; because disability is not an eligibility pathway for individuals age 65 and older, MACPAC recodes these enrollees as aged. Benefit spending from Medicaid Statistical Information System (MSIS) data has been adjusted to reflect CMS-64 totals. Due to changes in both methods and data, figures shown here are not directly comparable to earlier years. With regard to methods, spending totals now exclude disproportionate share hospital (DSH) and certain incentive and uncompensated care pool payments made under Section 1115 waiver expenditure authority, which were included prior to the December 2015 data book. See https://www.macpac.gov/macstats/data-sources-and-methods/ for additional information. Values have not been updated from those published in the December 2017 data book due to the unavailability of more recent MSIS or Transformed MSIS data.1 In this table, full-benefit enrollees excludes those reported by states in MSIS as receiving coverage of only emergency services, family planning services, or assistance with Medicare premiums and cost sharing.2 State had a change in FYE enrollees of 10 percent or more over the prior year. These data may reflect data anomalies in the submission of MSIS data; if so, data may be updated in future MSIS submissions. MSIS data anomalies have been compiled and reported by Mathematica Policy Research; the data anomalies report can be found at http://www.cms.gov/Research-Statistics-Data-and-Systems/Computer-Data-and-Systems/MedicaidDataSourcesGenInfo/downloads/anomalies1.pdf.3 When compared to the December 2015 edition of this table, District of Columbia and Massachusetts had a change in total FYE enrollees of 10 percent or more over the prior year. However, both states have since updated their 2012 enrollment total and no longer have a change of 10 percent or more.4 State was excluded due to data reliability concerns regarding the completeness of monthly claims and enrollment data.5 Due to large differences in the way Vermont reports spending in CMS-64 and in MSIS, MACPAC's adjustment methodology is only applied to total Medicaid spending.
Source: MACPAC, 2017, analysis of MSIS data as of December 2016 and CMS-64 Financial Management Report net expenditure data as of June 2016.
MACStats Section 3
Decem
ber 2018

Section 6 Section 5 Section 2Section 4 Section 1
MA
CStats: Medicaid and CH
IP Data Book
65
Section 3: Program Enrollm
ent and Spending—M
edicaid BenefitsEXHIBIT 22b. Medicaid Benefit Spending per Full-Year Equivalent Enrollee by State and Eligibility Group, FY 2014
MACStats Section 3
State1
Total Child Adult2 Disabled Aged
All enrolleesFull-benefit enrollees3
All enrollees
Full-benefit enrollees3
All enrollees
Full-benefit enrollees3
All enrollees
Full-benefit enrollees3
All enrollees
Full-benefit enrollees3
Arizona $6,652 $7,092 $3,350 $3,384 $5,418 $6,155 $19,686 $21,091 $11,301 $14,650
Arkansas 7,213 7,965 4,028 4,037 3,427 3,921 14,009 17,292 15,678 25,418
California 5,256 6,461 2,730 2,836 2,631 3,913 20,236 20,222 12,129 12,268
Connecticut 9,352 10,252 4,086 4,087 6,910 6,942 27,869 36,835 16,348 35,659
Georgia 5,381 5,803 2,509 2,507 5,542 5,965 11,415 13,923 10,376 19,614
Idaho 6,464 6,731 2,432 2,429 6,338 6,253 16,125 18,915 16,104 25,147
Iowa 7,285 7,833 2,730 2,737 3,809 4,123 21,153 22,722 21,541 29,170
Louisiana 5,460 6,166 2,003 2,003 3,394 4,564 13,848 16,556 10,952 20,031
Massachusetts 8,319 8,817 3,758 3,873 4,086 4,409 15,359 15,414 20,190 23,680
Michigan 6,476 6,854 2,646 2,666 4,385 4,962 15,879 16,733 17,117 19,937
Minnesota 9,693 9,950 4,080 4,090 6,084 6,257 30,629 32,027 24,521 27,316
Mississippi 6,786 7,493 2,806 2,806 5,296 5,825 12,955 16,105 12,624 22,117
New Jersey 8,194 8,305 2,846 2,845 4,938 4,883 24,519 25,637 19,438 21,971
New York 8,850 9,126 2,844 2,857 5,037 5,062 25,214 26,497 22,974 26,901
Ohio 7,676 8,388 3,025 3,031 5,483 6,200 20,112 24,166 19,992 27,790
Oklahoma 6,630 7,205 3,500 3,501 4,784 6,478 16,370 17,747 13,778 16,611
Oregon 7,196 7,703 2,726 2,770 6,181 6,504 17,576 21,491 20,638 31,887
Pennsylvania 10,385 11,202 4,412 4,408 4,181 5,168 18,099 18,941 22,504 27,371
South Carolina 4,969 5,586 2,352 2,353 3,465 5,544 12,684 13,420 11,624 13,720
South Dakota 7,202 7,553 2,955 2,955 6,527 6,509 17,969 21,573 14,065 20,744
Tennessee 6,242 6,693 3,242 3,242 5,494 5,495 12,969 16,186 10,351 18,480
Utah 6,882 6,920 3,331 3,327 5,488 5,315 20,858 21,939 14,580 16,773
Vermont 8,309 4 4 4 4 4 4 4 4 4
Washington 6,923 7,180 2,205 2,211 8,657 9,107 15,627 18,040 15,751 20,280
West Virginia 6,867 7,253 2,931 2,931 4,510 4,508 13,030 15,456 18,070 29,506
Wyoming 7,853 8,137 2,525 2,539 5,125 5,498 23,497 27,432 25,472 40,383
MACStats Section 3

Section 6 Section 5 Section 2Section 4 Section 1
66
Section 3: Program Enrollm
ent and Spending—M
edicaid BenefitsEXHIBIT 22b. (continued)
MACStats Section 3
Notes: FY is fiscal year. Full-year equivalent (FYE) may also be referred to as average monthly enrollment. Includes federal and state funds. Excludes spending for administration, the territories, and Medicaid-expansion CHIP enrollees. Children and adults under age 65 who qualify for Medicaid on the basis of disability are included in the disabled category. About 528,000 enrollees age 65 and older are identified in the data as disabled; because disability is not an eligibility pathway for individuals age 65 and older, MACPAC recodes these enrollees as aged. Benefit spending from Medicaid Statistical Information System (MSIS) data has been adjusted to reflect CMS-64 totals. Due to changes in both methods and data, figures shown here are not directly comparable to earlier years. With regard to methods, spending totals now exclude disproportionate share hospital and certain incentive and uncompensated care pool payments made under Section 1115 waiver expenditure authority, which were included prior to the December 2015 data book. See https://www.macpac.gov/macstats/data-sources-and-methods/ for additional information. 1 Values have not been updated from those published in the December 2017 data book due to the unavailability of more recent MSIS or Transformed MSIS (T-MSIS) data. Several states did not submit complete MSIS data for FY 2014 due to the ongoing transition to T-MSIS and were excluded from this exhibit. In addition, a few states were excluded due to data reliability concerns regarding the completeness and quality of the submitted MSIS data. This exhibit includes only states that had sufficient FY 2014 MSIS data. Due to the number of states excluded, a national total is not provided.2 Includes the new adult group made eligible under Section 1902(a)(10)(A)(i)(VIII) of the Social Security Act by the Patient Protection and Affordable Care Act (P.L. 111-148, as amended). 3 In this table, full-benefit enrollees excludes those reported by states in MSIS as receiving coverage of only emergency services, family planning services, or assistance with Medicare premiums and cost sharing.4 Due to large differences in the way Vermont reports spending in CMS-64 and in MSIS, MACPAC's adjustment methodology is only applied to total Medicaid spending.
Source: MACPAC, 2017, analysis of MSIS data as of December 2016 and CMS-64 Financial Management Report net expenditure data as of June 2016.
MACStats Section 3
Decem
ber 2018

Section 6 Section 5 Section 2Section 4 Section 1
MA
CStats: Medicaid and CH
IP Data Book
67
Section 3: Program Enrollm
ent and Spending—M
edicaid BenefitsEXHIBIT 23. Medicaid Benefit Spending per Full-Year Equivalent Enrollee for Newly Eligible Adult and All Enrollees by State, FY 2017
MACStats Section 3
State1
All Medicaid enrollees Newly eligible adults2
FYE enrolleesMedicaid benefit
spendingSpending per FYE enrollee FYE enrollees
Medicaid benefit spending
Spending per FYE enrollee
Alabama 1,021,690 $5,562,217,922 $5,444 – – –
Alaska 184,401 1,961,572,200 10,638 35,271 $368,976,367 $10,461
Arizona 1,943,148 11,823,748,029 6,085 111,934 521,438,520 4,658
Arkansas 945,887 6,363,923,522 6,728 311,395 1,896,124,683 6,089
California 12,182,411 82,384,159,832 6,763 3,773,520 14,167,700,564 3,755
Colorado 1,353,449 7,805,267,931 5,767 446,579 1,326,719,113 2,971
Connecticut 894,137 7,401,263,576 8,278 203,418 1,307,488,960 6,428
Delaware 206,743 2,133,796,292 10,321 10,899 58,461,915 5,364
District of Columbia 254,954 2,783,205,645 10,916 68,289 411,867,550 6,031
Florida 4,029,267 23,169,178,008 5,750 – – –
Georgia 1,853,128 10,105,996,059 5,453 – – –
Hawaii 331,024 2,338,436,723 7,064 22,032 486,141,916 22,065
Idaho 319,132 1,822,302,321 5,710 – – –
Illinois 2,889,919 15,054,073,075 5,209 651,045 3,604,556,626 5,537
Indiana 1,339,790 11,106,189,855 8,290 300,224 2,062,809,628 6,871
Iowa 596,208 4,065,931,964 6,820 139,723 613,605,130 4,392
Kansas 383,573 3,214,420,673 8,380 – – –
Kentucky 1,332,521 9,527,255,650 7,150 472,035 2,701,675,794 5,723
Louisiana 1,630,705 10,913,541,197 6,693 412,389 2,660,833,314 6,452
Maine 259,837 2,565,081,585 9,872 – – –
Maryland 1,201,665 11,161,406,671 9,288 298,900 2,732,085,172 9,140
Massachusetts 1,818,433 17,120,855,005 9,415 – – –
Michigan 2,115,865 16,711,203,272 7,898 622,573 3,992,046,026 6,412
Minnesota 1,130,594 11,351,993,115 10,041 196,776 1,661,697,561 8,445
Mississippi 711,972 5,462,308,168 7,672 – – –
MACStats Section 3

Section 6 Section 5 Section 2Section 4 Section 1
Decem
ber 201868
Section 3: Program Enrollm
ent and Spending—M
edicaid BenefitsEXHIBIT 23. (continued)
State1
All Medicaid enrollees Newly eligible adults2
FYE enrolleesMedicaid benefit
spendingSpending per FYE enrollee FYE enrollees
Medicaid benefit spending
Spending per FYE enrollee
Missouri 983,475 $10,095,843,109 $10,265 – – –
Montana 233,031 1,772,437,233 7,606 75,574 $760,260,549 $10,060
Nebraska 240,341 2,041,523,592 8,494 – – –
Nevada 601,200 3,530,342,184 5,872 209,811 1,135,800,128 5,413
New Hampshire 197,722 2,055,479,922 10,396 55,559 424,439,783 7,639
New Jersey 1,708,334 14,743,851,829 8,631 571,217 3,227,989,855 5,651
New Mexico 891,744 4,804,465,265 5,388 261,898 973,867,535 3,719
New York3 6,094,024 76,398,082,879 12,537 280,146 -673,800,177 -2,405
North Carolina 2,100,566 13,336,810,348 6,349 – – –
North Dakota 92,537 1,216,183,814 13,143 19,598 280,388,275 14,307
Ohio 3,075,806 23,055,842,742 7,496 653,518 4,489,972,316 6,870
Oklahoma 675,675 4,630,014,393 6,852 – – –
Oregon 996,908 8,312,733,407 8,339 397,755 2,276,456,190 5,723
Pennsylvania 2,817,620 28,081,163,760 9,966 743,820 5,629,233,820 7,568
Rhode Island 303,295 2,623,111,291 8,649 68,188 450,351,946 6,605
South Carolina 1,257,908 5,963,952,005 4,741 – – –
South Dakota 107,171 851,154,180 7,942 – – –
Tennessee 1,641,228 9,088,319,089 5,538 – – –
Texas 4,332,289 35,644,874,349 8,228 – – –
Utah 306,154 2,451,642,619 8,008 – – –
Vermont 184,769 1,600,236,799 8,661 – – –
Virginia 1,019,752 8,987,642,645 8,814 – – –
Washington 1,832,812 11,892,840,575 6,489 593,556 3,191,576,967 5,377
West Virginia 558,488 4,000,838,793 7,164 177,120 1,154,792,685 6,520
Wisconsin 1,188,748 8,049,889,736 6,772 – – –
Wyoming 61,733 591,622,270 9,584 – – –
MACStats Section 3MACStats Section 3

Section 6 Section 5 Section 2Section 4 Section 1
MA
CStats: Medicaid and CH
IP Data Book
69
Section 3: Program Enrollm
ent and Spending—M
edicaid BenefitsEXHIBIT 23. (continued)
State1
All Medicaid enrollees Newly eligible adults2
FYE enrolleesMedicaid benefit
spendingSpending per FYE enrollee FYE enrollees
Medicaid benefit spending
Spending per FYE enrollee
Subtotal (states) 74,433,784 $569,730,227,118 $7,654 12,184,763 $63,895,558,711 $5,244American Samoa 41,214 33,219,896 806 – – –
Guam 35,806 79,339,659 2,216 – – –
Northern Mariana Islands 15,472 29,887,537 1,932 – – –
Puerto Rico 1,256,694 2,317,682,931 1,844 – – –
Virgin Islands 24,934 53,582,469 2,149 – – –
Total (states and territories) 75,807,905 $572,243,939,610 $7,549 12,184,763 $63,895,558,711 $5,244
Notes: FY is fiscal year. FYE is full-year equivalent. FYE may also be referred to as average monthly enrollment. Includes federal and state funds. Excludes spending for administration and Medicaid-expansion CHIP enrollees. Enrollment counts come from CMS-64 enrollment data and may differ from other data sources. Quarterly enrollment was tabulated from the most recent non-zero CMS-64 submission to account for any lag in reporting; this typically is the report submitted three quarters later (e.g., January–March 2017 enrollment was taken from the submission quarter ending December 31, 2017). Unlike other MACStats exhibits that show spending per FYE, this exhibit includes spending for disproportionate share hospital (DSH) and certain incentive and uncompensated care pool payments made under Section 1115 waiver expenditure authority.
– Dash indicates zero.1 Not all states had certified their CMS-64 Financial Management Report (FMR) submissions as of July 20, 2018. California’s fourth quarter submission was not certified; North Dakota's second, third, and fourth quarter submissions were not certified; Alabama's first quarter submission was not certified. Figures presented in this exhibit may change if states revise their expenditure data after this date.2 Newly eligible adults include those enrollees who are newly eligible under Section 1902(a)(10)(A)(i)(VIII) of the Social Security Act and receive a federal matching rate of 100 percent for quarters in calendar year 2016 and 95 percent for quarters in calendar year 2017.3 New York's CMS-64 quarterly enrollment data was missing the last two quarters of FY 2017 for all enrollees and for newly eligible adults. The FYE count displayed here is the average monthly enrollment based on the first two quarters of enrollment. New York reports negative spending for the newly eligible adults due to large negative prior period adjustments.
Source: MACPAC, 2018, analysis of CMS-64 FMR net expenditure data as of July 20, 2018, and CMS-64 enrollment reports as of September 19, 2018.
MACStats Section 3MACStats Section 3

Decem
ber 201870
Section 3: Program Enrollm
ent and Spending—M
edicaid Benefits
insert exhibit here
MACStats Section 3
EXHIBIT 24. Medicaid Supplemental Payments to Hospital Providers by State, FY 2017 (millions)
MACStats Section 3
State1
Inpatient and outpatient hospitals2
Total Medicaid payments DSH payments
Non-DSH supplemental payments
Section 1115 waiver authority payments
Supplemental payments as % of total
Total $88,382.9 $12,127.8 $15,020.2 $16,009.7 48.8%Alabama 2,095.7 480.4 630.8 – 53.0Alaska 591.3 4.8 – – 0.8Arizona3 1,255.2 135.6 224.5 100.4 36.7Arkansas 1,140.8 66.2 340.0 – 35.6California3, 4, 5 16,104.0 -886.3 3,733.7 5,625.1 52.6Colorado 2,536.6 207.9 982.3 – 46.9Connecticut 1,805.5 27.0 146.1 – 9.6Delaware 74.2 15.9 – – 21.5District of Columbia 398.2 42.9 35.0 – 19.6Florida3 2,289.6 238.0 184.6 577.3 43.7Georgia 2,090.7 434.1 0.0 – 20.8Hawaii3, 6 43.9 26.4 3.5 -1.9 63.6Idaho 424.2 26.5 5.0 – 7.4Illinois 3,812.3 342.8 1,526.1 – 49.0Indiana3 943.9 496.4 18.5 0.6 54.6Iowa7 165.1 54.6 -4.4 – 30.4Kansas3 162.3 53.2 0.8 81.7 83.7Kentucky 372.8 179.2 9.7 – 50.7Louisiana 1,401.8 1,091.5 113.2 – 85.9Maine 599.0 – 48.8 – 8.1Maryland 1,127.4 76.7 51.2 – 11.3Massachusetts4, 8 3,057.1 – 174.6 1,151.2 43.4Michigan 1,551.4 70.0 1,059.2 – 72.8Minnesota8 668.1 75.1 25.8 71.3 25.8Mississippi 633.0 224.1 – – 35.4Missouri 2,833.3 460.8 140.9 – 21.2Montana 662.3 19.0 151.1 – 25.7Nebraska 101.4 36.5 – – 36.0Nevada 556.6 58.9 176.9 – 42.4New Hampshire4 270.2 214.6 2.2 6.6 82.7New Jersey4, 8 1,561.1 444.1 – 354.5 51.2New Mexico3, 4 493.6 55.2 139.3 74.7 54.5New York4 10,727.7 2,439.1 946.0 1,509.4 45.6North Carolina 4,632.7 353.1 1,149.0 – 32.4North Dakota 142.5 1.2 – – 0.9Ohio 2,657.4 1,235.4 536.9 – 66.7

Section 6 Section 5 Section 2Section 4 Section 1
MA
CStats: Medicaid and CH
IP Data Book
71
Section 3: Program Enrollm
ent and Spending—M
edicaid Benefits
insert exhibit here
MACStats Section 3
EXHIBIT 24. (continued)
State1
Inpatient and outpatient hospitals2
Total Medicaid payments DSH payments
Non-DSH supplemental payments
Section 1115 waiver authority payments
Supplemental payments as % of total
Oklahoma $1,778.8 $40.7 $824.1 – 48.6%Oregon4 599.1 77.2 105.6 $87.5 45.1Pennsylvania 1,533.1 575.9 398.6 – 63.6Rhode Island 339.9 139.7 22.8 – 47.8South Carolina 1,030.6 434.9 110.7 – 52.9South Dakota 235.1 0.8 2.9 – 1.6Tennessee3, 8 908.9 81.7 – 805.6 97.6Texas3, 4 8,386.4 1,510.7 34.0 5,511.7 84.1Utah 286.7 29.8 43.0 – 25.4Vermont 39.6 37.4 – – 94.5Virginia 987.7 43.4 515.9 – 56.6Washington4 723.1 254.9 – 54.0 42.7West Virginia 619.3 53.6 347.0 – 64.7Wisconsin 803.1 45.6 31.6 – 9.6Wyoming 128.7 0.5 32.5 – 25.6
Notes: FY is fiscal year. DSH is disproportionate share hospital. Includes federal and state funds. Excludes payments made under managed care arrangements. All amounts in this table are as reported by states in CMS-64 data during the fiscal year to obtain federal matching funds; amounts include expenditures for the current fiscal year and adjustments to expenditures for prior fiscal years that may be positive or negative. Amounts reported by states for any given category (e.g., inpatient hospital) sometimes show substantial annual fluctuations. CMS only began to require separate reporting of non-DSH supplemental payments in FY 2010 and continues to work with states to standardize this reporting. As a result, the information presented may not reflect a consistent classification of supplemental payment spending across states. Reporting is expected to improve over time.
– Dash indicates zero; $0.0 or -$0.0 indicates an amount between $0.05 million and -$0.05 million that rounds to zero.1 Not all states had certified their CMS-64 Financial Management Report (FMR) submissions as of July 20, 2018. Alabama's first quarter submission was not certified; California’s fourth quarter submission was not certified; North Dakota's second, third, and fourth quarter submissions were not certified. Figures presented in this exhibit may change if states revise their expenditure data after this date.2 Includes inpatient, outpatient, critical access hospital, and emergency hospital categories in the CMS-64 data. The CMS-64 instructions to states note that DSH payments are those made in accordance with Section 1923 of the Social Security Act. Non-DSH supplemental payments are described in the CMS-64 instructions to states as those made in addition to the standard fee schedule or other standard payment for a given service. They include payments made under institutional upper payment limit rules and payments to hospitals for graduate medical education. Section 1115 waiver expenditure authority payments include those made under uncompensated care pools, delivery system reform incentive payments (DSRIP), and other non-DSH supplemental payments that have been authorized under Section 1115 waivers. Because the majority of DSRIP payments go to hospitals, DSRIP payments that were reported as other care services on the CMS-64 were included in the Section 1115 waiver expenditure category and the total hospital payment category.3 State made supplemental payments through an uncompensated care pool under Section 1115 waiver expenditure authority.4 State made supplemental payments through a DSRIP or DSRIP-like program under Section 1115 waiver expenditure authority.5 California reported negative DSH payments due to prior period adjustments.6 Hawaii reported negative Section 1115 waiver authority payments due to prior period adjustments.7 Iowa reported negative non-DSH supplemental payments due to prior period adjustments.8 State made other supplemental payments, including graduate medical education, under Section 1115 waiver expenditure authority.
Source: MACPAC, 2018, analysis of CMS-64 FMR net expenditure data as of July 20, 2018, and CMS-64 Schedule C waiver report data as of October 19, 2018.
MACStats Section 3

Decem
ber 201872
Section 3: Program Enrollm
ent and Spending—M
edicaid Benefits
insert exhibit here
MACStats Section 3
EXHIBIT 25. Medicaid Supplemental Payments to Non-Hospital Providers by State, FY 2017 (millions)
MACStats Section 3
State1
Mental health facilities2 Nursing facilities and ICF/IDs3 Physicians and other practitioners4
Total Medicaid payments
Supplemental payments
Supplemental payments as
% of total
Total Medicaid payments
Supplemental payments
Supplemental payments as
% of total
Total Medicaid payments
Supplemental payments
Supplemental payments as
% of totalTotal $5,455.0 $3,143.6 57.6% $52,544.9 $3,546.2 6.7% $10,350.2 $860.3 8.3%Alabama 80.1 – – 921.6 – – 485.2 – –Alaska 34.8 14.8 42.5 173.4 – – 220.1 – –Arizona 32.1 28.5 88.7 52.3 6.8 12.9 56.5 – –Arkansas 113.6 0.8 0.7 901.3 – – 377.5 40.7 10.8California5, 6 541.1 -0.2 -0.0 3,470.2 253.5 7.3 817.5 153.6 18.8Colorado 6.4 – – 828.2 110.8 13.4 744.7 7.3 1.0Connecticut 196.8 105.6 53.7 1,455.8 – – 633.4 – –Delaware 21.0 12.0 57.0 70.1 – – 12.0 – –District of Columbia 14.5 6.3 43.6 327.2 – – 47.3 – –Florida5 150.0 118.6 79.0 816.7 – – 255.8 27.9 10.9Georgia 13.8 – – 1,419.6 129.7 9.1 368.8 – –Hawaii – – – 9.5 0.3 2.6 0.2 – –Idaho 2.1 – – 300.1 73.4 24.5 153.9 – –Illinois 142.8 89.0 62.3 1,764.8 – – 404.8 – –Indiana5 51.3 – – 2,710.8 996.5 36.8 102.8 28.3 27.6Iowa7, 8 4.8 – – 79.6 -0.0 -0.0 49.4 24.9 50.4Kansas 13.1 13.0 98.8 79.3 – – 5.1 0.8 15.6Kentucky 39.0 38.1 97.8 1,143.1 0.4 0.0 36.5 8.2 22.5Louisiana 66.7 59.6 89.4 1,421.2 3.9 0.3 48.3 2.3 4.8Maine 98.5 42.1 42.8 382.2 – – 115.6 2.6 2.2Maryland 177.8 67.6 38.0 1,211.1 – – 156.3 – –Massachusetts9 179.6 125.5 69.9 1,564.4 – – 344.1 48.9 14.2Michigan 245.2 198.3 80.9 1,764.1 313.3 17.8 350.4 203.8 58.2Minnesota 104.0 10.8 10.3 1,060.2 – – 334.8 10.2 3.1Mississippi 64.0 – – 1,049.7 31.5 3.0 115.3 9.5 8.3Missouri 230.8 206.9 89.6 1,251.8 – – 25.3 – –Montana 22.4 – – 173.2 16.8 9.7 163.2 – –Nebraska 1.8 1.8 100.0 419.0 0.8 0.2 11.8 – –Nevada 44.5 – – 266.8 94.4 35.4 163.7 2.4 1.5

Section 6 Section 5 Section 2Section 4 Section 1
MA
CStats: Medicaid and CH
IP Data Book
73
Section 3: Program Enrollm
ent and Spending—M
edicaid Benefits
insert exhibit here
MACStats Section 3
EXHIBIT 25. (continued)
State1
Mental health facilities2 Nursing facilities and ICF/IDs3 Physicians and other practitioners4
Total Medicaid payments
Supplemental payments
Supplemental payments as
% of total
Total Medicaid payments
Supplemental payments
Supplemental payments as
% of total
Total Medicaid payments
Supplemental payments
Supplemental payments as
% of totalNew Hampshire $39.5 $37.7 95.5% $345.6 – – $11.6 – –New Jersey 452.8 357.4 78.9 1,487.2 – – 58.7 – –New Mexico 3.0 – – 27.6 – – 72.9 $5.6 7.6%New York 989.6 514.0 51.9 7,514.2 $472.8 6.3% 530.8 40.7 7.7North Carolina10 -176.0 159.8 -90.8 1,072.9 – – 978.1 102.8 10.5North Dakota 22.9 1.0 4.3 353.7 2.6 0.7 50.3 – –Ohio 93.5 93.4 99.9 2,218.4 – – 202.7 48.1 23.8Oklahoma 65.1 3.3 5.0 617.9 – – 475.4 – –Oregon 26.8 20.0 74.5 424.3 – – 64.7 – –Pennsylvania 375.1 297.2 79.2 4,726.2 841.7 17.8 68.7 – –Rhode Island 4.6 – – 137.4 – – 6.6 – –South Carolina 67.1 60.9 90.7 768.3 15.8 2.1 138.1 31.4 22.7South Dakota 4.4 0.8 16.9 180.3 5.2 2.9 65.8 – –Tennessee 44.5 – – 209.3 – – 41.0 – –Texas5, 7, 11 306.1 295.9 96.7 1,344.6 4.2 0.3 470.0 -15.0 -3.2Utah 17.2 0.9 5.4 355.6 83.0 23.3 68.7 19.0 27.7Vermont – – – 124.8 – – 0.8 – –Virginia 144.4 9.7 6.7 1,016.5 11.8 1.2 170.8 27.7 16.2Washington 172.0 133.9 77.8 858.2 6.4 0.7 67.8 5.7 8.5West Virginia 73.2 18.9 25.8 710.5 – – 88.9 22.8 25.6Wisconsin 21.2 – – 829.4 40.7 4.9 63.1 – –Wyoming 15.3 – – 134.7 30.3 22.5 54.3 – –
Notes: FY is fiscal year. ICF/ID is intermediate care facility for persons with intellectual disabilities. Includes federal and state funds. Excludes payments made under managed care arrangements. All amounts in this table are as reported by states in CMS-64 data during the fiscal year to obtain federal matching funds; amounts include expenditures for the current fiscal year and adjustments to expenditures for prior fiscal years that may be positive or negative. Amounts reported by states for any given category (e.g., nursing facility) sometimes show substantial annual fluctuations.
– Dash indicates zero; $0.0 or -$0.0 indicates an amount between $0.05 million and -$0.05 million that rounds to zero; 0.0% or -0.0% indicates an amount between 0.05% and-0.05% that rounds to zero.
MACStats Section 3

Decem
ber 201874
Section 3: Program Enrollm
ent and Spending—M
edicaid Benefits
MACStats
EXHIBIT 25. (continued)
1 Not all states had certified their CMS-64 Financial Management Report (FMR) submissions as of July 20, 2018. Alabama's first quarter submission was not certified; California’s fourth quarter submission was not certified; North Dakota's second, third, and fourth quarter submissions were not certified. Figures presented in this exhibit may change if states revise their expenditure data after this date.2 Includes inpatient psychiatric services for individuals under age 21 and inpatient hospital or nursing facility services for individuals age 65 and older in an institution for mental diseases. Supplemental payments include disproportionate share hospital (DSH) payments made in accordance with Section 1923 of the Social Security Act as well as uncompensated care pool and other non-DSH supplemental payments made under Section 1115 waiver expenditure authority. States are not instructed to break out non-DSH supplemental payments for mental health facilities.3 Supplemental payments to nursing facilities and ICF/IDs include those made in addition to the standard fee schedule or other standard payments for a given service, including payments made under institutional upper payment limit rules and uncompensated care pools made under Section 1115 waiver expenditure authority.4 Includes the physician and other practitioner categories in CMS-64 data; excludes additional categories (e.g., dental, nurse-midwife, nurse practitioner) for which states are not instructed to break out supplemental payments. Supplemental payments include those made in addition to the standard fee schedule payment as well as uncompensated care pool payments made under Section 1115 waiver expenditure authority. There is no regulatory upper payment limit for physicians and other practitioners (as there is for institutional providers).5 State made payments to physicians and other practitioners through an uncompensated care pool under Section 1115 waiver expenditure authority.6 California reported negative DSH payments to mental health facilities due to prior period adjustments.7 State made payments to nursing facilities through an uncompensated care pool under Section 1115 waiver expenditure authority.8 Iowa reported negative Section 1115 waiver authority payments to mental health facilities due to prior period adjustments.9 Massachusetts made non-DSH payments to mental health facilities through an uncompensated care pool or made other non-DSH supplemental payments under Section 1115 waiver expenditure authority. 10 North Carolina reported negative total payments to mental health facilities due to prior period adjustments.11 Texas reported negative supplemental payments to physicians and other practitioners due to prior period adjustments.
Source: MACPAC, 2018, analysis of CMS-64 FMR net expenditure data as of July 20, 2018, and CMS-64 Schedule C waiver report data as of October 19, 2018.
MACStats Section 3Section 3

Section 6 Section 5 Section 2Section 4 Section 1
MA
CStats: Medicaid and CH
IP Data Book
75
Section 3: Program Enrollm
ent and Spending—M
edicaid Benefits
insert exhibit here
MACStats
EXHIBIT 26. Medicaid Gross Spending for Drugs by Delivery System and Brand or Generic Status, FY 2017 (millions)
MACStats
StateTotal Fee for service Managed care
Total Brand1 Generic2 Unknown3 Total Brand1 Generic2 Unknown3 Total Brand1 Generic2 Unknown3
Total4 $63,973.6 80.5% 19.5% 0.1% $24,066.1 82.7% 17.2% 0.1% $39,907.5 79.1% 20.8% 0.1%
Alabama 673.1 80.8 19.1 0.0 673.1 80.8 19.1 0.0 – – – –
Alaska 131.2 78.2 21.5 0.3 131.2 78.2 21.5 0.3 – – – –
Arizona 1,203.9 77.1 22.6 0.3 17.0 94.2 5.3 0.5 1,186.9 76.9 22.8 0.3
Arkansas 356.3 77.4 22.5 0.1 356.3 77.4 22.5 0.1 – – – –
California 7,915.7 80.9 19.1 0.0 4,256.6 87.3 12.7 0.0 3,659.1 73.5 26.5 0.0
Colorado 882.4 81.0 18.7 0.3 852.6 81.0 18.6 0.4 29.8 79.0 20.9 0.1
Connecticut 1,204.1 85.7 14.2 0.0 1,204.1 85.7 14.2 0.0 – – – –
Delaware5 152.6 83.1 16.8 0.1 3.1 81.2 18.1 0.8 149.5 83.2 16.8 0.1
District of Columbia 294.0 89.9 10.1 0.0 217.5 94.7 5.3 0.0 76.5 76.5 23.5 0.0
Florida 2,980.2 84.1 15.8 0.1 480.4 89.6 10.3 0.1 2,499.8 83.1 16.9 0.0
Georgia 1,161.2 78.3 21.7 0.0 689.5 85.6 14.4 0.0 471.7 67.8 32.2 0.0
Hawaii 184.7 76.5 23.4 0.1 0.1 65.0 35.0 – 184.5 76.5 23.4 0.1
Idaho 188.0 81.0 19.0 0.0 188.0 81.0 19.0 0.0 – – – –
Illinois 1,949.4 79.7 20.3 0.0 511.7 79.6 20.4 0.0 1,437.7 79.7 20.3 0.0
Indiana 1,490.4 78.2 21.7 0.1 346.6 82.6 17.3 0.1 1,143.8 76.9 23.0 0.1
Iowa 299.1 84.6 15.4 0.0 8.5 75.9 24.1 – 290.5 84.9 15.1 0.0
Kansas 356.0 77.4 22.5 0.1 0.6 79.7 20.3 – 355.4 77.4 22.5 0.1
Kentucky 1,094.8 72.9 26.9 0.2 62.1 76.8 22.7 0.6 1,032.7 72.7 27.1 0.2
Louisiana 1,005.1 75.1 24.8 0.1 57.3 76.0 24.0 0.0 947.8 75.1 24.8 0.1
Maine 219.0 87.3 12.7 0.0 219.0 87.3 12.7 0.0 – – – –
Maryland 1,118.4 85.3 14.7 0.0 550.0 87.6 12.4 0.0 568.4 83.1 16.9 0.0
Massachusetts 1,461.7 83.4 16.4 0.2 527.0 82.2 17.5 0.2 934.6 84.1 15.8 0.1
Michigan 2,095.5 80.6 19.2 0.2 1,185.8 84.6 15.2 0.2 909.7 75.4 24.4 0.2
Minnesota 909.3 77.1 22.9 0.1 182.3 73.7 26.3 0.1 727.0 77.9 22.0 0.1
Mississippi 455.4 75.7 24.3 0.0 75.9 77.9 22.1 0.0 379.6 75.2 24.7 0.0
Missouri 1,211.5 72.7 27.2 0.1 1,211.5 72.7 27.2 0.1 – – – –
Montana 201.1 80.4 19.5 0.1 201.1 80.4 19.5 0.1 – – – –
Nebraska 168.5 77.4 22.6 0.1 41.9 77.4 22.5 0.2 126.6 77.4 22.6 0.1
Section 3Section 3

Decem
ber 201876
Section 3: Program Enrollm
ent and Spending—M
edicaid Benefits
MACStats
StateTotal Fee for service Managed care
Total Brand1 Generic2 Unknown3 Total Brand1 Generic2 Unknown3 Total Brand1 Generic2 Unknown3
Nevada $459.0 78.5% 21.4% 0.1% $224.5 83.3% 16.7% 0.1% $234.5 73.9% 26.0% 0.0%
New Hampshire 94.7 79.3 20.4 0.3 19.7 96.4 3.6 0.0 75.0 74.8 24.8 0.4
New Jersey 1,713.7 80.1 19.8 0.1 26.1 80.5 19.5 – 1,687.6 80.1 19.8 0.1
New Mexico 440.1 77.3 22.6 0.1 7.4 72.1 27.5 0.4 432.7 77.4 22.5 0.1
New York 6,082.7 81.4 18.6 0.1 655.1 81.7 18.3 0.0 5,427.6 81.3 18.6 0.1
North Carolina 1,784.5 83.0 16.9 0.1 1,784.5 83.0 16.9 0.1 – – – –
North Dakota 55.1 74.0 25.9 0.2 32.7 73.8 26.1 0.2 22.4 74.3 25.6 0.2
Ohio 3,477.1 77.6 22.4 0.0 335.8 79.2 20.8 0.0 3,141.3 77.4 22.5 0.0
Oklahoma 492.5 77.9 22.0 0.0 492.5 77.9 22.0 0.0 – – – –
Oregon 712.6 79.0 21.0 0.0 116.9 65.8 34.2 0.0 595.7 81.6 18.4 0.0
Pennsylvania 3,194.7 81.1 18.9 0.0 75.2 81.3 18.7 0.0 3,119.4 81.1 18.9 0.0
Rhode Island 222.5 79.3 20.7 – 4.2 76.8 23.2 – 218.3 79.3 20.7 –
South Carolina 443.9 81.7 18.2 0.1 132.5 89.4 10.5 0.1 311.4 78.3 21.5 0.1
South Dakota 102.4 77.3 22.7 0.0 102.4 77.3 22.7 0.0 – – – –
Tennessee 1,045.8 83.8 16.0 0.1 983.0 83.0 16.9 0.1 62.8 96.1 3.1 0.8
Texas 3,409.5 82.9 17.1 0.0 223.8 85.3 14.7 0.0 3,185.8 82.7 17.3 0.0
Utah 194.0 77.4 22.6 0.0 102.5 76.2 23.8 0.0 91.5 78.7 21.3 0.0
Vermont 160.6 86.8 13.2 – 160.6 86.8 13.2 – – – – –
Virginia 944.4 67.9 31.4 0.7 116.2 76.0 23.8 0.2 828.2 66.7 32.5 0.8
Washington 1,152.4 82.7 17.3 0.0 241.8 94.8 5.2 0.0 910.6 79.5 20.5 0.0
West Virginia 564.8 80.0 19.9 0.0 215.7 82.2 17.8 0.0 349.1 78.7 21.3 0.0
Wisconsin 1,137.1 82.4 17.6 0.0 1,137.1 82.4 17.6 0.0 – – – –
Wyoming 36.1 83.6 16.4 0.0 36.1 83.6 16.4 0.0 – – – –
EXHIBIT 26. (continued)
MACStats Section 3Section 3
Section 6 Section 5 Section 2Section 4 Section 1
MA
CStats: Medicaid and CH
IP Data Book
77
Section 3: Program Enrollm
ent and Spending—M
edicaid Benefits
MACStats
Notes: FY is fiscal year. Amounts include federal and state funds. Gross spending reflects expenditures prior to the application of manufacturer rebates. Drug expenditures in this exhibit use information from the state drug utilization data that states submit to CMS for rebate purposes and are different from the CMS-64 Financial Management Report (FMR) and Medicaid Statistical Information System (MSIS) data that serve as our usual sources of expenditure data. Spending shown in the drug utilization data may differ from these other sources due to differences in timing and run-out of data used. In addition, the drug utilization data may include physician-administered drugs for which rebates are available; these drugs are typically reported under the physician services category instead of the outpatient prescription drug category in other data. The state drug utilization data provide both fee-for-service and managed care drug utilization and spending information at the national drug code (NDC) level. To assign brand and generic status, we linked the quarterly state drug utilization data to the quarterly Medicaid drug product data from CMS using the NDC code. Brand and generic status was assigned using the drug category indicator from the drug product file.
The state drug utilization data are available at https://www.medicaid.gov/medicaid/prescription-drugs/state-drug-utilization-data/index.html and the drug product data are available at https://www.medicaid.gov/medicaid/prescription-drugs/medicaid-drug-rebate-program/data/index.html.
Since October 2016, CMS has suppressed all records in the state drug utilization data that are less than 11 counts, as obligated by the Privacy Act of 1974 (5 USC § 552a) and the Health Insurance Portability and Accountability Act of 1996 (P.L. 104-191 as implemented at 45 CFR Parts 160 and 164). The different brand and generic proportions under fee for service and managed care may reflect differences in the populations and specific drugs covered under each delivery system (e.g., behavioral health drugs carved out of managed care) as well as differences in how the state and participating health plans managed the drug benefit.
– Dash indicates zero; 0.0% indicates an amount less than 0.05% that rounds to zero.1 For this exhibit, brand drugs were defined as single source drugs and innovator, multiple source drugs as indicated in that quarter’s Medicaid drug product data.2 For this exhibit, generic drugs were defined as non-innovator, multiple source drugs as indicated in that quarter’s Medicaid drug product file.3 For this exhibit, unknown drugs were those drugs whose NDC did not have a match in that quarter’s Medicaid drug product file.4 The national total does not equal the sum of the state totals due to the suppression of records. Records for drugs that were suppressed at the state level were not necessarily suppressed once the individual state data were rolled up into the national file. Although the amount of suppressed spending in the FY 2017 national file is not known, a comparison of totals from previous years may be instructive. A comparison of the updated FY 2014 files with data suppression to prior versions without data suppression indicates that about $370 million, or 0.9 percent of gross spending, was suppressed in the FY 2014 data.5 Delaware reported all of its spending under managed care as non-Medicaid spending. For this exhibit, we have reclassified this spending as Medicaid spending.
Source: MACPAC, 2018, analysis of Medicaid drug product data and state drug rebate utilization data as of July 20, 2018.
EXHIBIT 26. (continued)
MACStats Section 3Section 3

Decem
ber 201878
Section 3: Program Enrollm
ent and Spending—M
edicaid Benefits
insert exhibit here
MACStats
EXHIBIT 27. Medicaid Drug Prescriptions by Delivery System and Brand or Generic Status, FY 2017 (thousands)
MACStats
StateTotal Fee for service Managed care
Total Brand1 Generic2 Unknown3 Total Brand1 Generic2 Unknown3 Total Brand1 Generic2 Unknown3
Total4 757,356 16.5% 83.2% 0.2% 213,734 19.4% 80.3% 0.4% 543,622 15.4% 84.4% 0.2%Alabama 7,428 20.9 79.0 0.2 7,428 20.9 79.0 0.2 – – – –Alaska 1,339 20.0 79.6 0.3 1,339 20.0 79.6 0.3 – – – –Arizona 16,920 14.1 85.3 0.6 93 18.2 81.1 0.8 16,827 14.1 85.3 0.6Arkansas 4,768 18.6 81.2 0.2 4,768 18.6 81.2 0.2 – – – –California 98,439 15.2 84.6 0.2 25,805 21.0 78.7 0.3 72,633 13.2 86.7 0.1Colorado 7,732 19.3 80.3 0.4 7,287 19.6 80.0 0.4 445 15.0 84.8 0.2Connecticut 9,194 23.8 75.9 0.3 9,194 23.8 75.9 0.3 – – – –Delaware 2,438 19.3 80.1 0.6 46 19.0 74.8 6.2 2,392 19.3 80.2 0.5District of Columbia 2,325 18.5 81.5 0.0 965 23.6 76.3 0.1 1,360 14.8 85.2 0.0Florida 31,629 17.9 81.9 0.2 2,466 25.1 74.7 0.2 29,163 17.3 82.5 0.2Georgia 17,274 16.2 83.8 0.0 7,624 18.0 82.0 0.0 9,650 14.9 85.1 0.0Hawaii 2,698 13.7 86.3 0.0 5 1.4 98.6 – 2,693 13.7 86.3 0.0Idaho 2,236 18.9 80.9 0.2 2,236 18.9 80.9 0.2 – – – –Illinois 30,238 15.2 84.8 0.0 7,531 16.5 83.5 0.0 22,706 14.7 85.3 0.0Indiana 16,558 18.0 81.8 0.1 3,112 18.7 81.2 0.1 13,446 17.9 82.0 0.2Iowa 4,035 20.0 80.0 0.0 167 19.0 81.0 – 3,868 20.1 79.9 0.0Kansas 4,450 18.8 81.1 0.1 14 13.3 86.7 – 4,437 18.8 81.1 0.1Kentucky 20,338 12.9 86.6 0.5 1,128 10.8 86.1 3.1 19,210 13.0 86.6 0.4Louisiana 18,081 13.7 86.1 0.2 848 14.8 85.0 0.2 17,233 13.6 86.1 0.2Maine 2,379 23.6 76.4 0.0 2,379 23.6 76.4 0.0 – – – –Maryland 14,146 17.7 82.2 0.0 4,357 24.0 76.0 0.0 9,789 15.0 85.0 0.0Massachusetts 16,555 15.7 81.9 2.4 6,811 15.6 80.6 3.7 9,743 15.7 82.8 1.5Michigan 31,104 14.4 85.1 0.5 10,008 17.8 82.1 0.2 21,096 12.8 86.5 0.7Minnesota 12,556 14.6 85.3 0.1 2,256 16.4 83.6 0.1 10,300 14.2 85.7 0.1Mississippi 5,985 16.7 83.3 0.0 875 17.3 82.7 0.0 5,110 16.6 83.4 0.0Missouri 12,454 18.5 81.2 0.2 12,454 18.5 81.2 0.2 – – – –Montana 2,383 19.2 80.7 0.1 2,383 19.2 80.7 0.1 – – – –Nebraska 2,742 16.9 82.9 0.3 633 16.4 83.4 0.1 2,109 17.0 82.7 0.3Nevada 6,436 13.9 86.0 0.1 2,293 17.4 82.4 0.1 4,143 11.9 87.9 0.2New Hampshire 1,126 18.5 80.9 0.6 93 24.4 75.0 0.6 1,033 18.0 81.5 0.6New Jersey 23,487 14.6 85.3 0.0 354 16.5 83.5 – 23,134 14.6 85.4 0.0New Mexico 6,305 14.7 85.3 0.0 127 16.6 83.2 0.2 6,178 14.7 85.3 0.0New York 74,707 15.2 84.7 0.1 10,169 13.8 86.1 0.0 64,538 15.5 84.5 0.1North Carolina 17,030 24.6 75.2 0.2 17,030 24.6 75.2 0.2 – – – –North Dakota 818 16.7 82.6 0.7 498 17.2 81.7 1.1 320 16.0 83.9 0.1Ohio 49,575 16.6 83.4 0.0 4,614 16.9 83.1 0.0 44,961 16.6 83.4 0.0Oklahoma 5,842 18.0 81.8 0.2 5,842 18.0 81.8 0.2 – – – –
Section 3Section 3

Section 6 Section 5 Section 2Section 4 Section 1
MA
CStats: Medicaid and CH
IP Data Book
79
Section 3: Program Enrollm
ent and Spending—M
edicaid Benefits
insert exhibit here
MACStats
EXHIBIT 27. (continued)
StateTotal Fee for service Managed care
Total Brand1 Generic2 Unknown3 Total Brand1 Generic2 Unknown3 Total Brand1 Generic2 Unknown3
Oregon 10,631 14.6% 85.3% 0.1% 2,261 8.8% 91.2% 0.0% 8,370 16.1% 83.8% 0.1%Pennsylvania 38,652 15.8 84.2 0.0 1,787 11.5 88.5 0.0 36,865 16.0 84.0 0.0Rhode Island 3,487 13.1 86.9 – 116 17.2 82.8 – 3,371 13.0 87.0 –South Carolina 5,449 18.0 81.6 0.4 1,093 20.6 78.9 0.5 4,356 17.3 82.3 0.4South Dakota 857 25.0 75.0 0.0 857 25.0 75.0 0.0 – – – –Tennessee 13,701 17.4 81.8 0.8 13,203 16.9 82.5 0.7 498 30.6 65.5 3.9Texas 35,807 20.1 79.9 0.0 1,828 26.4 73.6 0.0 33,980 19.8 80.2 0.0Utah 2,522 17.5 82.5 0.0 1,108 17.5 82.5 0.0 1,415 17.4 82.6 0.0Vermont 1,540 27.4 72.6 – 1,540 27.4 72.6 – – – – –Virginia 10,815 16.5 83.0 0.5 2,042 17.4 81.8 0.8 8,773 16.3 83.3 0.4Washington 16,488 14.0 86.0 0.0 1,445 13.7 86.2 0.1 15,043 14.0 85.9 0.0West Virginia 9,425 16.7 83.2 0.1 3,130 16.9 83.0 0.0 6,294 16.5 83.4 0.1Wisconsin 11,824 20.3 79.6 0.1 11,744 20.4 79.5 0.1 80 8.3 91.3 0.4Wyoming 443 21.0 78.9 0.0 443 21.0 78.9 0.0 – – – –
Notes: FY is fiscal year. Drug utilization in this exhibit reflects the number of prescriptions reported in the state drug utilization data that states submit to CMS for rebate purposes, and are different from Medicaid Statistical Information System (MSIS) data that serve as our usual source of utilization data. Utilization shown in the drug utilization data may differ from these other sources due to differences in timing and run-out of data used. In addition, the drug utilization data may include physician-administered drugs for which rebates are available; these drugs are typically reported under the physician services category instead of the outpatient prescription drug category in other data. The state drug utilization data provide both fee-for-service and managed care drug utilization and spending information at the national drug code (NDC) level. To assign brand and generic status, we linked the quarterly state drug utilization data to the quarterly Medicaid drug product data from CMS using the NDC code. Brand and generic status was assigned using the drug category indicator from the drug product file.
The state drug utilization data are available at https://www.medicaid.gov/medicaid/prescription-drugs/state-drug-utilization-data/index.html and the drug product data are available at https://www.medicaid.gov/medicaid/prescription-drugs/medicaid-drug-rebate-program/data/index.html.
Since October 2016, CMS has suppressed all records in the state drug utilization data that are less than 11 counts, as obligated by the Privacy Act of 1974 (5 USC § 552a) and the Health Insurance Portability and Accountability Act of 1996 (P.L. 104-191 as implemented at 45 CFR Parts 160 and 164). The different brand and generic proportions under fee for service and managed care may reflect differences in the populations and specific drugs covered under each delivery system (e.g., behavioral health drugs carved out of managed care) as well as differences in how the state and participating health plans managed the drug benefit.
– Dash indicates zero; 0.0% indicates an amount less than 0.05% that rounds to zero.1 For this exhibit, brand drugs were defined as single source drugs and innovator, multiple source drugs as indicated in that quarter’s Medicaid drug product data.2 For this exhibit, generic drugs were defined as non-innovator, multiple source drugs as indicated in that quarter’s Medicaid drug product file.3 For this exhibit, unknown drugs were those drugs whose NDC did not have a match in that quarter’s Medicaid drug product file.4 The national total does not equal the sum of the state totals due to the suppression of records. Records for drugs that were suppressed at the state level were not necessarily suppressed once the individual state data were rolled up into the national file. Although the number of suppressed prescriptions in the national file is not known, a comparison of totals from previous years may be instructive. A comparison of the updated FY 2014 files with data suppression to prior versions that did not include suppression indicates that about 4 million prescriptions (0.7 percent) were suppressed in the FY 2014 data.
Source: MACPAC, 2018, analysis of Medicaid drug product data and state drug rebate utilization data as of July 20, 2018.
MACStats Section 3Section 3

Decem
ber 201880
Section 3: Program Enrollm
ent and Spending—M
edicaid Benefits
insert exhibit here
MACStats
EXHIBIT 28. Medicaid Gross Spending and Rebates for Drugs by Delivery System, FY 2017 (millions)
MACStats
StateGross spending Rebates
Total Fee for service Managed care Total Fee for service Managed careTotal1 $63,973.6 $24,066.1 $39,907.5 -$34,877.7 -$18,854.8 -$16,022.9
Alabama 673.1 673.1 – -346.6 -346.6 –
Alaska 131.2 131.2 – -86.8 -86.8 –
Arizona 1,203.9 17.0 1,186.9 -671.3 -17.8 -653.4
Arkansas 356.3 356.3 – -226.0 -226.0 –
California 7,915.7 4,256.6 3,659.1 -4,831.1 -2,397.8 -2,433.4
Colorado 882.4 852.6 29.8 -745.0 -697.5 -47.5
Connecticut 1,204.1 1,204.1 – -783.7 -783.7 –
Delaware2 152.6 3.1 149.5 -117.5 -31.8 -85.7
District of Columbia 294.0 217.5 76.5 -174.3 -119.4 -54.9
Florida 2,980.2 480.4 2,499.8 -1,723.6 -300.2 -1,423.4
Georgia 1,161.2 689.5 471.7 -640.3 -481.0 -159.2
Hawaii 184.7 0.1 184.5 -109.2 -0.9 -108.3
Idaho 188.0 188.0 – -132.0 -133.4 1.4
Illinois 1,949.4 511.7 1,437.7 -1,061.8 -322.6 -739.2
Indiana 1,490.4 346.6 1,143.8 -742.7 -239.9 -502.8
Iowa3 299.1 8.5 290.5 -384.9 -187.5 -197.4
Kansas 356.0 0.6 355.4 -199.5 -2.0 -197.5
Kentucky 1,094.8 62.1 1,032.7 -684.8 -52.4 -632.4
Louisiana 1,005.1 57.3 947.8 -437.1 -37.3 -399.8
Maine 219.0 219.0 – -162.6 -162.6 –
Maryland 1,118.4 550.0 568.4 -580.3 -228.0 -352.3
Massachusetts 1,461.7 527.0 934.6 -851.2 -355.6 -495.5
Michigan 2,095.5 1,185.8 909.7 -1,284.4 -825.1 -459.4
Minnesota 909.3 182.3 727.0 -518.2 -288.1 -230.1
Mississippi 455.4 75.9 379.6 -288.0 -80.8 -207.2
Missouri 1,211.5 1,211.5 – -668.9 -668.9 –
Montana 201.1 201.1 – -118.1 -118.1 –
Section 3Section 3
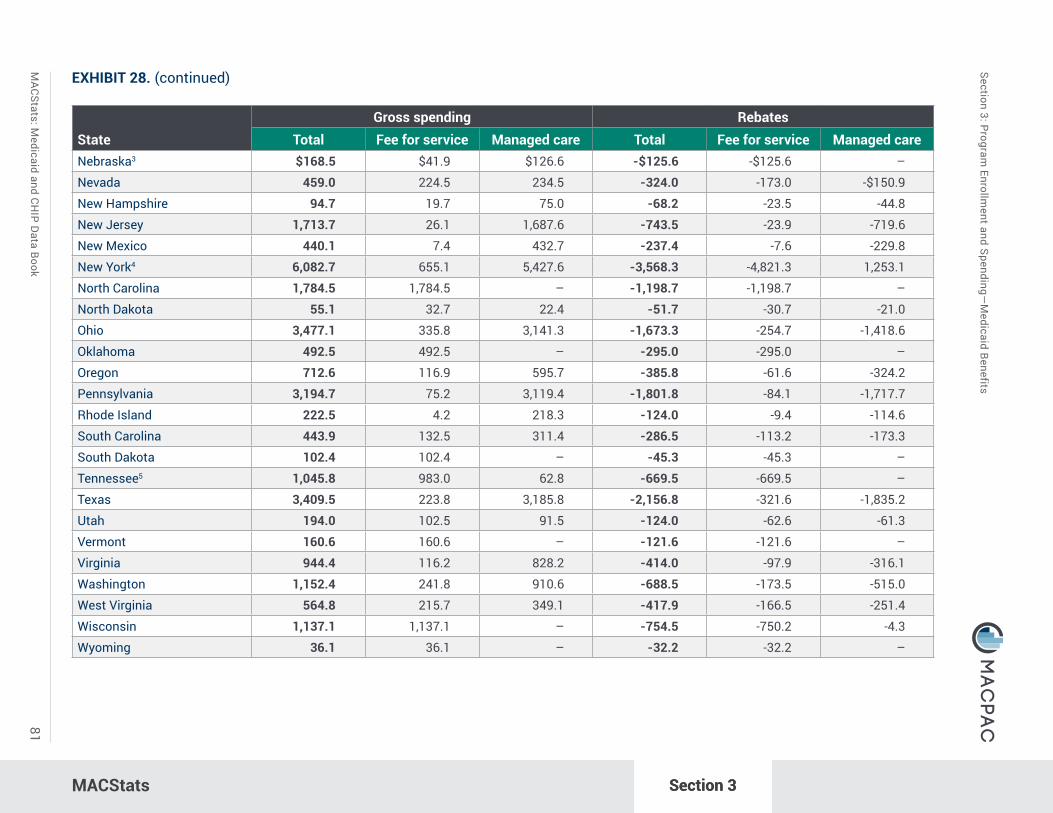
Section 6 Section 5 Section 2Section 4 Section 1
MA
CStats: Medicaid and CH
IP Data Book
81
Section 3: Program Enrollm
ent and Spending—M
edicaid Benefits
insert exhibit here
MACStats
EXHIBIT 28. (continued)
StateGross spending Rebates
Total Fee for service Managed care Total Fee for service Managed careNebraska3 $168.5 $41.9 $126.6 -$125.6 -$125.6 –
Nevada 459.0 224.5 234.5 -324.0 -173.0 -$150.9
New Hampshire 94.7 19.7 75.0 -68.2 -23.5 -44.8
New Jersey 1,713.7 26.1 1,687.6 -743.5 -23.9 -719.6
New Mexico 440.1 7.4 432.7 -237.4 -7.6 -229.8
New York4 6,082.7 655.1 5,427.6 -3,568.3 -4,821.3 1,253.1
North Carolina 1,784.5 1,784.5 – -1,198.7 -1,198.7 –
North Dakota 55.1 32.7 22.4 -51.7 -30.7 -21.0
Ohio 3,477.1 335.8 3,141.3 -1,673.3 -254.7 -1,418.6
Oklahoma 492.5 492.5 – -295.0 -295.0 –
Oregon 712.6 116.9 595.7 -385.8 -61.6 -324.2
Pennsylvania 3,194.7 75.2 3,119.4 -1,801.8 -84.1 -1,717.7
Rhode Island 222.5 4.2 218.3 -124.0 -9.4 -114.6
South Carolina 443.9 132.5 311.4 -286.5 -113.2 -173.3
South Dakota 102.4 102.4 – -45.3 -45.3 –
Tennessee5 1,045.8 983.0 62.8 -669.5 -669.5 –
Texas 3,409.5 223.8 3,185.8 -2,156.8 -321.6 -1,835.2
Utah 194.0 102.5 91.5 -124.0 -62.6 -61.3
Vermont 160.6 160.6 – -121.6 -121.6 –
Virginia 944.4 116.2 828.2 -414.0 -97.9 -316.1
Washington 1,152.4 241.8 910.6 -688.5 -173.5 -515.0
West Virginia 564.8 215.7 349.1 -417.9 -166.5 -251.4
Wisconsin 1,137.1 1,137.1 – -754.5 -750.2 -4.3
Wyoming 36.1 36.1 – -32.2 -32.2 –
MACStats Section 3Section 3

Decem
ber 201882
Section 3: Program Enrollm
ent and Spending—M
edicaid Benefits
MACStats
EXHIBIT 28. (continued)
Notes: FY is fiscal year. Amounts include federal and state funds. Gross spending reflects expenditures prior to the application of manufacturer rebates. The gross drug expenditures in this exhibit use information from the state drug utilization data that states submit to CMS for rebate purposes and are different from the CMS-64 Financial Management Report (FMR) and Medicaid Statistical Information System (MSIS) data that serve as our usual sources of expenditure data. Spending shown in the drug utilization data may differ from these other sources due to differences in timing and run-out of data used. In addition, the drug rebate data may include physician-administered drugs for which rebates are available; the spending for these drugs is typically reported under the physician services category instead of the outpatient prescription drug category in other data. The state drug utilization data provide both fee-for-service and managed care drug utilization and spending information at the national drug code (NDC) level, which is not available in CMS-64 data. The state drug utilization data are available at https://www.medicaid.gov/medicaid/prescription-drugs/state-drug-utilization-data/index.html.
Since October 2016, CMS has suppressed all records in the state drug utilization data that are less than 11 counts, as obligated by the Privacy Act of 1974 (5 USC § 552a) and the Health Insurance Portability and Accountability Act of 1996 (P.L. 104-191 as implemented at 45 CFR Parts 160 and 164). The drug rebate information comes from the CMS-64 and does allow states to separately identify fee-for-service and managed care drug rebates. The rebate totals shown here include federal rebates, state supplemental rebates, and the rebate increases attributable to the Patient Protection and Affordable Care Act (P.L. 111-148, as amended).
Due to the time it takes to collect the drug utilization information and invoice drug manufacturers for the rebate, the rebates collected in any particular quarter are generally attributable to drugs purchased in prior quarters; thus, the gross spending and rebate dollars for a given time period are not necessarily aligned. Changes in covered populations or benefit design (e.g., managed care expansion or pharmacy carve-in) can create distortions in the data, because changes will be reflected in gross spending before they are reflected in rebates collected.
– Dash indicates zero; $0.0 indicates an amount between zero and $0.05 million that rounds to zero.1 The national total does not equal the sum of the state totals due to the suppression of records. Records for drugs that were suppressed at the state level were not necessarily suppressed once the individual state data were rolled up into the national file. Although the amount of suppressed spending in the FY 2017 national file is not known, a comparison of totals from previous years may be instructive. A comparison of the updated FY 2014 files with data suppression to prior versions without data suppression indicates that about $370 million, or 0.9 percent of gross spending, was suppressed in the FY 2014 data.2 Delaware reported all of its spending under managed care as non-Medicaid spending. For this exhibit, we have reclassified this spending as Medicaid spending.3 State recently carved the pharmacy benefit into managed care, implemented a new managed care program, or expanded its managed care program. This change creates a large difference between gross spending and rebate collections for fee for service and managed care, resulting in anomalous rebate amounts at the delivery-system level.4 New York made large prior period adjustments to both fee-for-service and managed care rebates that ultimately result in a shift in rebates from managed care to fee for service. The state reports a positive managed care rebate amount due to prior period adjustments.5 State generally carves out prescription drugs from the managed care program. State managed care spending may reflect physician-administered drugs; however, rebates for these managed care expenditures are not reported separately in the CMS-64 data and appear to be reported with the fee-for-service rebates.
Source: MACPAC, 2018, analysis of Medicaid state drug rebate utilization data as of July 20, 2018 and CMS-64 FMR net expenditure data as of July 20, 2018.
MACStats Section 3Section 3

Section 6 Section 5 Section 2Section 4 Section 1
MA
CStats: Medicaid and CH
IP Data Book
83
Section 3: Program Enrollm
ent and Spending—M
edicaid Managed Care
insert exhibit here
MACStatsMACStats
EXHIBIT 29. Percentage of Medicaid Enrollees in Managed Care by State, July 1, 2016
StateTotal Medicaid
enrollees
Percentage of enrollees in managed care
Comprehensive managed care1
Limited-benefit plans
PCCMMLTSSBHO (PIHP
and/or PAHP) Dental Transportation OtherTotal 78,567,000 67.5% 0.4% 14.3% 9.7% 17.0% 1.8% 6.9%
Alabama 1,037,037 0.0 – – – – 1.7 40.1
Alaska2 155,865 – – – – – – –
Arizona 1,849,166 84.4 – – – – – –
Arkansas3 799,488 0.0 – – – 65.5 – 63.6
California 13,739,388 76.9 – 0.0 6.9 – 0.0 –
Colorado 1,344,548 10.0 – 95.7 – – – 70.1
Connecticut4 860,758 – – – – – – –
Delaware 221,229 88.6 – – – – – –
District of Columbia 251,791 71.9 – – – 21.4 – –
Florida 3,900,380 81.7 2.4 – – – – –
Georgia 1,973,586 68.0 – – – – 0.5 –
Hawaii5 358,302 98.9 – 1.5 – – – –
Idaho 295,267 0.8 – 88.4 94.2 89.0 – 91.5
Illinois 3,230,870 60.9 – – – – – 11.3
Indiana 1,421,696 75.9 – – – – – –
Iowa 624,973 90.0 – – 24.1 2.1 – –
Kansas 435,850 89.7 – – – – – –
Kentucky 1,361,722 92.7 – – – 90.0 – –
Louisiana 1,504,333 84.0 – 7.6 87.5 – – –
Maine 277,697 – – – – 86.4 – 55.0
Maryland 1,324,796 81.5 – – – – – –
Massachusetts 1,889,306 46.3 – 24.5 – – – 20.7
Michigan6 4,448,582 49.9 0.3 49.3 18.5 – – –
Minnesota 1,088,610 74.9 – – – – – –
Mississippi 726,473 68.7 – – – – – –
Section 3

Decem
ber 201884
Section 3: Program Enrollm
ent and Spending—M
edicaid Managed Care
MACStats Section 3
EXHIBIT 29. (continued)
MACStats
StateTotal Medicaid
enrollees
Percentage of enrollees in managed care
Comprehensive managed care1
Limited-benefit plans
PCCMMLTSSBHO (PIHP
and/or PAHP) Dental Transportation OtherMissouri 982,776 50.3% – – – 47.5% – –
Montana 207,340 – – – – – – 58.5%
Nebraska 244,355 78.4 – 95.2% – – – –
Nevada 629,265 63.8 – – – 88.6 – 6.1
New Hampshire 206,997 66.2 – – – – – –
New Jersey 1,679,572 92.7 – – – 100.0 – –
New Mexico 884,368 77.4 – – – – – –
New York 6,139,403 73.5 2.6% – – – – –
North Carolina 2,028,935 0.1 – 77.9 – – – 73.7
North Dakota 93,422 22.9 – – – – 0.2% 51.7
Ohio 3,022,121 79.9 – – – – – –
Oklahoma 792,387 0.0 – – – 67.1 – 67.2
Oregon7 1,109,321 80.6 – 0.4 4.7% – – –
Pennsylvania 2,753,618 81.1 – 91.3 – 22.2 – –
Rhode Island 325,177 70.9 – – 29.0 – – –8
South Carolina 1,235,361 60.1 – – – 100.0 – 0.0
South Dakota 125,395 – – – – – – 75.2
Tennessee9 1,684,268 92.4 – – 52.8 – 83.3 –
Texas 4,051,664 88.4 – 12.3 72.5 96.8 – 0.3
Utah 294,707 83.1 – 97.9 47.2 84.0 – –
Vermont10 200,481 62.1 – – – – – –
Virginia 1,111,999 68.4 – – – – – –
Washington11 1,820,084 84.4 – 100.0 – 100.0 – 0.5
West Virginia 553,318 70.5 – – – – – –
Wisconsin 1,204,511 62.6 3.6 0.1 – – 0.2 –
Wyoming 64,442 0.2 – – – – 0.4 –
Section 3
Section 6 Section 5 Section 2Section 4 Section 1
MA
CStats: Medicaid and CH
IP Data Book
85
Section 3: Program Enrollm
ent and Spending—M
edicaid Managed Care
MACStats
EXHIBIT 29. (continued)
MACStats
Notes: MLTSS is managed long-term services and supports. BHO is behavioral health organization. PIHP is prepaid inpatient health plan. PAHP is prepaid ambulatory health plan. PCCM is primary care case management. Excludes the territories. This exhibit includes Medicaid-expansion CHIP enrollees. Medicaid beneficiaries may be enrolled concurrently in more than one type of managed care program (e.g., a comprehensive plan and a BHO), so the sum of enrollment in each program type as a percentage of total Medicaid enrollment may be greater than 100 percent.
– Dash indicates zero; 0.0% indicates an amount less than 0.05% that rounds to zero.1 Includes comprehensive managed care and Programs of All-Inclusive Care for the Elderly (PACE). Comprehensive managed care organizations (MCOs) cover acute, primary, and specialty medical care services; they may also cover behavioral health, long-term services and supports, and other benefits in some states.2 Alaska was not able to provide total Medicaid enrollment as of July 1, 2016. The total Medicaid enrollment reported here is from the April–June 2016 enrollment data collected through the CMS-64, updated September 2017, and accessed February 15, 2017, at https://www.medicaid.gov/medicaid/program-information/downloads/cms-64-enrollment-report-apr-jun-2016.pdf.3 Arkansas was unable to report enrollment as of July 1, 2016. Enrollment figures represent cumulative enrollment for the state fiscal year (July 1, 2015–June 30, 2016).4 Connecticut was not able to provide total Medicaid enrollment as of July 1, 2016. The total Medicaid enrollment reported here is from the April–June 2016 enrollment data collected through the CMS-64 accessed February 15, 2017, at https://www.medicaid.gov/medicaid/program-information/downloads/cms-64-enrollment-report-apr-jun-2016.pdf.5 Some plans that appear to be limited-benefit plans (BHO, dental, or other managed care) were classified as comprehensive managed care in the CMS report. The values shown here use plan-level information in the CMS report to recategorize enrollment in Ohana Community Care Service as BHO.6 Michigan has two programs that provide home- and community-based service waiver services under capitation: MI Choice and the Specialty Prepaid Inpatient Health Plan (SPIHP). MI Choice is reported as an MLTSS program and SPIHP is reported as a BHO.7 Some plans that appear to be limited-benefit plans (BHO, dental, or other managed care) were classified as comprehensive managed care in the CMS report. The values shown here use plan-level information in the CMS report to recategorize enrollment in Greater Oregon Behavioral Health as BHO and enrollment in Access Dental Plan, Advantage Dental Services, Capitol Dental Care, CareOregon Dental, Family Dental Care, and ODS Community Health as dental.8 Rhode Island operated a PCCM program in 2016 but ended it before July 1, 2016.9 Some plans that appear to be limited-benefit plans (BHO, dental, or other managed care) were classified as comprehensive managed care in the CMS report. The values shown here use plan-level information in the CMS report to recategorize enrollment in DentaQuest USA as dental, and enrollment in Magellan Health Services as other.10 The Department of Vermont Health Access, a state agency, acts as Vermont's single MCO entity.11 Washington's enrollment in comprehensive MCOs includes 21,412 beneficiaries in health homes that provide services under contract with a comprehensive MCO.
Source: MACPAC, 2018, analysis of data from CMS, 2018, Medicaid managed care enrollment and program characteristics, 2016, Baltimore, MD: CMS, https://www.medicaid.gov/medicaid/managed-care/downloads/enrollment/2016-medicaid-managed-care-enrollment-report.pdf.
Section 3Section 3

86
Section 3: Program Enrollm
ent and Spending—M
edicaid Managed Care
insert exhibit here
EXHIBIT 30a. Percentage of Medicaid Enrollees in Managed Care by State and Eligibility Group, FY 2013
MACStats Section 3MACStats Section 3
Decem
ber 2018
Section 3Section 3
State
Total Medicaid enrollees
(thousands)
Percentage of enrollees in managed careComprehensive managed care1 Limited-benefit plans Primary care case management
Total Children Adults Disabled Aged Total Children Adults Disabled Aged Total Children Adults Disabled Aged
Total 70,161 53.9% 67.9% 50.9% 40.2% 18.1% 49.5% 58.8% 35.9% 53.1% 40.7% 12.7% 17.4% 9.3% 11.3% 2.5%
Alabama 1,212 2.4 – 0.0 5.6 12.4 – – – – – 46.0 69.7 13.4 44.4 1.4
Alaska 136 – – – – – – – – – – – – – – –
Arizona 1,681 81.1 91.4 77.9 66.9 48.1 90.6 97.6 84.6 91.3 71.3 – – – – –
Arkansas 696 0.0 – 0.0 – 0.2 78.7 98.4 46.3 74.3 40.4 64.1 91.3 27.7 56.0 3.5
California 11,742 49.6 76.5 29.4 67.2 34.7 68.2 94.1 37.1 99.6 96.5 – – – – –
Colorado 896 11.6 12.7 11.2 9.1 9.8 95.4 99.5 96.2 89.7 73.2 2.9 2.7 2.3 4.1 4.4
Connecticut 858 – – – – – – – – – – – – – – –
Delaware 260 85.9 95.0 87.8 67.6 47.8 89.4 98.9 90.2 74.2 49.5 2.1 1.7 2.5 2.6 0.5District of Columbia 246 73.9 92.1 93.3 22.1 3.0 37.3 20.1 28.3 80.5 69.9 – – – – –
Florida 4,313 39.6 53.2 37.2 26.8 6.3 46.6 78.3 13.0 29.5 2.5 24.2 33.9 14.2 24.9 3.4
Georgia 2,013 68.3 93.9 87.3 2.8 0.0 85.2 96.9 78.6 74.4 48.2 – – – – –
Hawaii 300 98.2 99.8 99.6 96.4 88.9 2.2 2.0 0.0 8.9 1.5 – – – – –
Idaho 288 – – – – – 94.5 99.9 97.3 85.1 65.8 87.1 95.2 85.8 76.9 46.1
Illinois 3,039 11.0 9.8 14.5 11.8 4.8 4.3 5.9 4.3 0.1 0.0 61.9 76.1 64.4 29.0 5.0
Indiana 1,250 69.1 92.4 85.1 11.3 0.2 – – – – – 3.9 2.1 0.1 15.2 1.7
Iowa 634 6.7 10.5 5.7 0.3 0.3 78.9 99.2 46.8 92.6 74.1 59.7 73.8 72.0 14.4 3.5
Kansas 442 46.6 66.0 52.1 1.7 0.7 75.0 82.4 66.4 74.5 39.4 5.7 2.9 1.0 19.6 2.1
Kentucky 927 85.1 99.7 97.3 71.5 34.9 89.6 99.1 97.6 80.2 57.4 – – – – –
Louisiana 1,284 0.0 – – 0.0 0.3 83.6 66.1 100.0 100.0 100.0 36.7 52.6 23.8 24.3 11.5
Maine 371 – – – – – – – – – – 54.4 78.1 74.1 29.0 0.7
Maryland 1,139 81.7 97.5 86.7 59.6 2.1 – – – – – – – – – –
Massachusetts 1,547 42.6 55.0 49.9 29.9 20.4 34.3 42.3 36.7 38.1 1.3 29.1 33.1 35.8 29.1 1.3
Michigan 2,291 73.1 87.5 70.7 58.9 11.5 93.8 98.9 85.0 95.2 85.7 – – – – –
Minnesota 1,154 76.5 87.0 80.8 40.8 59.4 – – – – – – – – – –
Mississippi 786 25.6 10.9 69.9 42.3 1.0 87.3 99.9 82.9 78.6 54.8 – – – – –

Section 6 Section 5 Section 2Section 4 Section 1
MA
CStats: Medicaid and CH
IP Data Book
87
Section 3: Program Enrollm
ent and Spending—M
edicaid Managed Care
insert exhibit here
MACStats
EXHIBIT 30a. (continued)
State
Total Medicaid enrollees
(thousands)
Percentage of enrollees in managed careComprehensive managed care1 Limited-benefit plans Primary care case management
Total Children Adults Disabled Aged Total Children Adults Disabled Aged Total Children Adults Disabled Aged
Missouri 1,122 45.5% 67.7% 50.0% 2.0% 0.2% – – – – – – – – – –
Montana 142 – – – – – 0.6% – 0.0% 3.6% 0.1% 73.3% 92.0% 75.8% 49.8% 1.4%
Nebraska 262 73.9 91.9 83.9 40.6 5.8 93.3 98.2% 89.6 91.2 74.7 – – – – –
Nevada 422 59.9 77.4 71.3 1.7 0.0 87.6 95.7 90.0 72.1 49.1 – – – – –
New Hampshire 166 – – – – – – – – – – – – – – –
New Jersey 1,190 84.2 95.0 62.9 85.5 65.5 96.8 98.7 99.4 95.1 87.8 – – – – –
New Mexico 660 66.8 84.4 58.6 43.2 2.6 67.3 84.3 38.0 68.6 53.3 – – – – –
New York 6,002 76.9 90.5 90.0 50.6 15.0 2.0 0.0 0.1 2.5 15.0 0.0 0.0 0.0 0.0 –
North Carolina 2,000 0.0 – – 0.0 0.4 91.3 99.1 81.3 89.1 72.3 80.0 96.0 60.2 72.4 46.6
North Dakota 87 2.5 4.5 0.1 0.1 0.8 2.1 3.4 0.3 1.4 0.2 53.9 71.9 72.4 1.3 0.0
Ohio 2,645 73.0 94.1 74.2 46.4 5.6 – – – – – – – – – –
Oklahoma 951 0.0 – – 0.0 0.2 88.2 96.7 75.6 85.2 79.2 70.2 90.2 64.3 41.3 1.2
Oregon 760 79.9 91.4 82.6 63.9 36.3 87.6 96.0 85.7 79.0 62.3 0.4 0.4 0.1 0.6 0.7
Pennsylvania 2,567 75.3 95.5 74.3 69.6 8.1 87.7 97.8 77.7 92.8 49.6 8.1 10.5 7.6 7.5 0.4
Rhode Island 170 58.8 88.0 81.0 15.8 1.0 31.6 70.0 0.0 9.5 – – – – – –
South Carolina 1,091 48.7 63.4 45.0 30.8 1.3 89.1 99.8 65.5 93.9 83.0 19.5 23.4 14.0 20.9 8.4
South Dakota 134 – – – – – – – – – – 72.3 91.8 87.5 28.6 0.9
Tennessee 1,557 91.6 100.0 100.0 78.6 54.2 91.6 100.0 100.0 78.6 54.0 – – – – –
Texas 5,240 81.5 96.2 62.3 67.0 34.8 11.8 14.3 7.8 10.0 4.2 0.0 0.0 – 0.0 –
Utah 389 35.4 40.7 25.7 33.2 27.5 90.1 98.7 70.6 92.2 81.8 28.1 31.5 21.6 28.9 19.1
Vermont 206 0.1 – – 0.1 0.5 – – – – – 67.1 86.7 77.1 37.7 3.1
Virginia 1,136 63.5 84.4 59.1 40.0 5.5 – – – – – – – – – –
Washington 1,421 69.7 87.6 59.8 52.2 2.3 90.9 99.9 73.1 88.3 77.4 0.8 0.9 0.9 1.1 0.0
West Virginia 437 54.1 89.1 80.2 1.4 0.0 – – – – – 1.2 1.8 1.5 0.5 0.0
Wisconsin 1,254 59.1 85.4 70.7 3.8 2.4 89.0 98.0 93.7 93.3 38.6 – – – – –
Wyoming 89 – – – – – – – – – – – – – – –
MACStats Section 3Section 3

88
Section 3: Program Enrollm
ent and Spending—M
edicaid Managed Care
EXHIBIT 30a. (continued)
Notes: FY is fiscal year. Enrollment numbers generally include individuals ever enrolled in Medicaid-financed coverage during the year, even if for a single month; however, in the event individuals were also enrolled in CHIP-financed Medicaid coverage (i.e., Medicaid-expansion CHIP) during the year, they are excluded if their most recent enrollment month was in Medicaid-expansion CHIP. Numbers exclude individuals enrolled only in Medicaid-expansion CHIP during the year and enrollees in the territories. Children and adults under age 65 who qualify for Medicaid on the basis of disability are included in the disabled category. About 746,000 enrollees age 65 and older are identified in the data as disabled; because disability is not an eligibility pathway for individuals age 65 and older, MACPAC recodes these enrollees as aged.
Due to changes in both methods and data over time, figures shown here may not be directly comparable to earlier years. With regard to methods, individuals are counted as participating in managed care if they had at least one month indicating plan enrollment; prior to the 2015 data book, individuals were counted as participating if at least one managed care payment was made on their behalf during the fiscal year. For MACPAC's analysis, Medicaid enrollees were assigned a unique national identification number using an algorithm that incorporates state-specific ID numbers and beneficiary characteristics such as date of birth and gender. The state and national enrollment counts shown here are unduplicated using this national ID. The sum of the state totals exceeds the national total because individuals may be enrolled in more than one state during the year. See https://www.macpac.gov/macstats/data-sources-and-methods/ for additional information on methods and data. Medicaid enrollees may be enrolled concurrently in more than one type of managed care program (e.g., a comprehensive plan and a limited-benefit plan), so the sum of enrollment in each program type as a percentage of total Medicaid enrollment may be greater than 100 percent.
Figures shown here, which are based on Medicaid Statistical Information System (MSIS) data, may differ from those that use Medicaid managed care enrollment report data. Reasons for differences include differing time periods, state reporting anomalies, and the treatment of Medicaid-expansion CHIP enrollees (excluded here but included in enrollment report data). Although the enrollment report is a commonly cited source, it does not provide information on the characteristics of enrollees in managed care (e.g., eligibility group). Values have not been updated from those published in the December 2017 data book due to the unavailability of more recent MSIS or Transformed MSIS data.
– Dash indicates zero; 0.0% indicates an amount less than 0.05% that rounds to zero.1 Includes comprehensive managed care and Programs of All-Inclusive Care for the Elderly.
Source: MACPAC, 2017, analysis of MSIS data as of December 2016.
MACStatsMACStats
Decem
ber 2018
Section 3Section 3

Section 6 Section 5 Section 2Section 4 Section 1
MA
CStats: Medicaid and CH
IP Data Book
89
Section 3: Program Enrollm
ent and Spending—M
edicaid Managed Care
insert exhibit here
MACStats
EXHIBIT 30b. Percentage of Medicaid Enrollees in Managed Care by State and Eligibility Group, FY 2014
MACStats Section 3Section 3
State1
Total Medicaid enrollees
(thousands)
Percentage of enrollees in managed careComprehensive managed care2 Limited-benefit plans Primary care case management
Total Children Adults3 Disabled Aged Total Children Adults3 Disabled Aged Total Children Adults3 Disabled AgedArizona 1,671 81.3% 91.9% 77.5% 66.5% 50.4% 89.7% 96.6% 83.5% 89.0% 73.4% – – – – –
Arkansas 866 0.0 – 0.0 0.0 0.3 87.0 99.2 91.0 73.6 39.8 55.0% 91.4% 16.0% 55.6% 3.5%
California 14,309 56.4 79.6 44.0 71.1 41.9 74.7 95.0 56.7 99.6 96.4 – – – – –
Connecticut 921 – – – – – – – – – – – – – – –
Georgia 2,109 68.3 93.2 86.1 2.8 0.1 85.2 96.1 82.0 73.1 46.7 – – – – –
Idaho 303 – – – – – 94.3 99.9 97.7 84.3 63.7 84.0 92.5 83.8 71.5 43.7
Iowa 685 15.7 16.3 22.7 0.8 0.6 90.6 99.3 83.4 92.5 73.8 56.3 70.9 58.7 28.1 6.4
Louisiana 1,281 34.4 44.6 24.1 32.3 10.1 79.6 59.6 97.7 99.6 99.9 38.0 54.4 23.9 25.5 11.9
Massachusetts 1,924 47.4 51.2 54.1 39.1 24.1 24.7 37.4 17.5 36.9 1.2 20.5 29.2 16.9 27.4 1.2
Michigan 2,542 73.7 87.6 72.2 61.2 14.7 95.2 99.0 92.1 95.4 86.1 – – – – –
Minnesota 1,305 77.0 85.9 82.8 43.7 50.9 – – – – – – – – – –
Mississippi 782 28.0 13.9 75.5 41.3 1.1 86.9 99.9 82.9 78.1 53.9 – – – – –
New Jersey 1,702 86.0 93.5 82.5 88.1 66.4 97.7 98.7 100.0 95.1 87.7 – – – – –
New York 6,502 76.6 90.4 87.6 50.2 15.3 2.3 0.0 0.1 3.1 17.4 0.0 – – 0.0 –
Ohio 2,949 75.6 93.5 79.5 47.2 6.0 – – – – – – – – – –
Oklahoma 930 0.0 – – 0.0 0.2 89.4 97.1 78.8 85.9 79.0 70.1 90.5 63.7 41.8 1.3
Oregon 1,102 83.5 90.9 83.9 73.1 56.2 51.2 65.0 39.4 60.5 46.6 0.0 0.0 0.0 0.0 –
Pennsylvania 2,625 76.0 95.8 77.5 69.3 8.7 87.9 97.7 80.0 92.5 49.9 – – – – –
South Carolina 1,181 63.3 85.2 50.9 43.0 1.5 86.7 99.9 59.9 93.6 82.4 14.6 20.7 8.6 12.4 0.4
South Dakota 137 – – – – – – – – – – 75.9 92.2 88.1 40.8 11.8
Tennessee 1,522 91.3 100.0 100.0 77.6 53.1 91.3 100.0 100.0 77.5 52.9 – – – – –
Utah 423 37.9 43.4 27.3 35.3 29.6 89.9 98.9 68.4 92.3 82.2 27.5 31.4 19.9 27.6 18.4
Vermont 209 – – – – – – – – – – 65.2 84.7 67.0 35.4 54.7
Washington 1,839 77.0 87.3 84.4 49.6 3.2 94.6 99.0 95.0 85.6 76.3 1.5 0.9 1.1 3.3 4.4
West Virginia 605 42.6 88.1 27.4 1.1 0.0 – – – – – 0.8 1.5 0.4 0.4 0.0
Wyoming 86 – – – – – – – – – – – – – – –
90
Section 3: Program Enrollm
ent and Spending—M
edicaid Managed Care
MACStats
EXHIBIT 30b. (continued)
Notes: FY is fiscal year. Enrollment numbers generally include individuals ever enrolled in Medicaid-financed coverage during the year, even if for a single month; however, in the event individuals were also enrolled in CHIP-financed Medicaid coverage (i.e., Medicaid-expansion CHIP) during the year, they are excluded if their most recent enrollment month was in Medicaid-expansion CHIP. Numbers exclude individuals enrolled only in Medicaid-expansion CHIP during the year and enrollees in the territories. Children and adults under age 65 who qualify for Medicaid on the basis of disability are included in the disabled category. About 528,000 enrollees age 65 and older are identified in the data as disabled; because disability is not an eligibility pathway for individuals age 65 and older, MACPAC recodes these enrollees as aged.
Due to changes in both methods and data over time, figures shown here may not be directly comparable to earlier years. With regard to methods, individuals are counted as participating in managed care if they had at least one month indicating plan enrollment; prior to the 2015 data book, individuals were counted as participating if at least one managed care payment was made on their behalf during the fiscal year. For MACPAC's analysis, Medicaid enrollees were assigned a unique national identification number using an algorithm that incorporates state-specific ID numbers and beneficiary characteristics such as date of birth and gender. The state enrollment counts shown here are unduplicated using this national ID. See https://www.macpac.gov/macstats/data-sources-and-methods/ for additional information on methods and data. Medicaid enrollees may be enrolled concurrently in more than one type of managed care program (e.g., a comprehensive plan and a limited-benefit plan), so the sum of enrollment in each program type as a percentage of total Medicaid enrollment may be greater than 100 percent.
Figures shown here, which are based on Medicaid Statistical Information System (MSIS) data, may differ from those that use Medicaid managed care enrollment report data. Reasons for differences include differing time periods, state reporting anomalies, and the treatment of Medicaid-expansion CHIP enrollees (excluded here but included in enrollment report data). Although the enrollment report is a commonly cited source, it does not provide information on the characteristics of enrollees in managed care (e.g., eligibility group). Values have not been updated from those published in the December 2017 data book due to the unavailability of more recent MSIS or Transformed MSIS data.
– Dash indicates zero; 0.0% indicates an amount less than 0.05% that rounds to zero.1 Several states did not submit complete MSIS data for FY 2014 due to the ongoing transition to the Transformed MSIS (T-MSIS) and were excluded from this exhibit. In addition, a few states were excluded due to data reliability concerns regarding the completeness and quality of the submitted MSIS data. This exhibit only includes states that had sufficient FY 2014 MSIS data. Due to the number of states excluded, a national total is not provided.2 Includes comprehensive managed care and Programs of All-Inclusive Care for the Elderly.3 Includes the new adult group made eligible under Section 1902(a)(10)(A)(i)(VIII) of the Social Security Act by the Patient Protection and Affordable Care Act (P.L. 111-148, as amended).
Source: MACPAC, 2017, analysis of MSIS data as of December 2016.
MACStats
Decem
ber 2018
Section 3Section 3

Section 6 Section 5 Section 2Section 4 Section 1
MA
CStats: Medicaid and CH
IP Data Book
91
Section 3: Program Enrollm
ent and Spending—M
edicaid Program A
dministration
insert exhibit here
MACStats
EXHIBIT 31. Total Medicaid Administrative Spending by State and Category, FY 2017 (millions)
MACStats Section 3Section 3
State1
Total spending on
administration
Spending by category
CollectionsMMIS2Eligibility systems2
EHR incentive program3
Other functions, federal match
above 50%4
Other functions, federal match
of 50%5
Alabama $238 $36 $28 $21 $11 $141 -$0Alaska 122 22 0 7 5 88 –Arizona 277 30 162 23 11 51 –Arkansas 418 117 76 21 51 154 –California 5,930 534 2,098 186 362 2,750 –Colorado 379 53 65 21 8 231 -0Connecticut 420 39 157 22 14 187 –Delaware 127 36 26 7 1 57 –District of Columbia 178 28 44 10 7 89 –Florida 752 73 107 32 28 512 –Georgia 545 98 178 31 6 232 -0Hawaii 109 13 49 16 4 27 –Idaho 107 26 22 4 6 50 –Illinois 1,009 54 144 59 68 684 –Indiana 534 78 186 28 12 231 –Iowa 175 48 86 9 8 24 –Kansas 212 56 52 16 3 84 -0Kentucky 253 39 79 37 20 78 –Louisiana 341 40 102 31 7 161 –Maine 169 53 46 17 12 41 –Maryland 449 54 119 30 23 223 –Massachusetts 1,027 98 185 39 39 666 –Michigan 654 134 137 57 18 308 –Minnesota 730 67 170 24 12 458 –Mississippi 215 53 26 38 9 88 -0Missouri 432 64 88 33 13 235 –Montana 94 22 21 6 3 42 -0Nebraska 123 24 42 6 7 44 –Nevada 186 50 71 5 10 52 –

Decem
ber 201892
Section 3: Program Enrollm
ent and Spending—M
edicaid Program A
dministration
MACStatsMACStats Section 3
EXHIBIT 31. (continued)
State1
Total spending on
administration
Spending by category
CollectionsMMIS2Eligibility systems2
EHR incentive program3
Other functions, federal match
above 50%4
Other functions, federal match
of 50%5
New Hampshire $108 $30 $42 $3 $3 $30 –New Jersey 822 66 353 21 44 339 -$2New Mexico 216 32 51 25 12 96 –New York 2,165 213 72 167 79 1,634 –North Carolina 675 53 350 36 41 196 –North Dakota 104 26 49 1 2 27 -0Ohio 933 86 244 51 16 537 –Oklahoma 210 35 8 17 16 133 –Oregon 513 34 105 25 21 328 -0Pennsylvania 1,003 96 282 44 23 557 -0Rhode Island 163 25 43 9 10 77 -0South Carolina 304 62 99 14 16 114 –South Dakota 52 7 1 5 2 37 –Tennessee 573 98 164 36 15 261 -1Texas 1,508 291 503 43 32 644 -5Utah 135 23 42 3 10 57 –Vermont 142 22 40 10 7 64 –Virginia 470 48 174 17 30 201 –Washington 714 87 83 45 13 486 -0West Virginia 157 59 29 5 24 41 -0Wisconsin 453 112 104 29 10 201 -1Wyoming 57 17 15 7 4 15 -0Subtotal (states) $27,681 $3,558 $7,418 $1,452 $1,207 $14,057 -$11American Samoa 1 – – 1 – 1 –Guam 4 – – 1 0 2 –Northern Mariana Islands 1 – – 0 – 0 –Puerto Rico 119 18 0 50 – 50 –Virgin Islands 16 2 10 0 – 3 –Subtotal (states and territories) $27,821 $3,579 $7,428 $1,503 $1,208 $14,114 -$11
Section 3

MA
CStats: Medicaid and CH
IP Data Book
93
Section 3: Program Enrollm
ent and Spending—M
edicaid Program A
dministration
MACStatsMACStats
EXHIBIT 31. (continued)
State1
Total spending on
administration
Spending by category
CollectionsMMIS2Eligibility systems2
EHR incentive program3
Other functions, federal match
above 50%4
Other functions, federal match
of 50%5
MFCU6 $339 – – – $339 – –Medicaid survey and certification of nursing and intermediate care facilities6 357 – – – 357 – –Total $28,517 $3,579 $7,428 $1,503 $1,904 $14,114 -$11Percent of total, exclusive of collections – 12.5% 26.0% 5.3% 6.7% 49.5% –
Notes: FY is fiscal year. MMIS is Medicaid Management Information Systems. EHR is electronic health record. MFCU is Medicaid Fraud Control Unit. Includes federal and state funds. Excludes administrative activities performed by Medicaid managed care plans (which are included in the capitation payments that states make to these plans) and activities that are exclusively federal, such as program oversight by CMS staff. Collections may include, for example, donations made by hospitals to compensate for the cost of on-site stationing of state or local Medicaid agency personnel to determine eligibility or provide outreach. For more information on specific items from the Medicaid and CHIP Budget Expenditure System (MBES CBES) noted in this exhibit, see CMS, 2014, MBES CBES category of service line definitions for the 64.10 base form, https://www.medicaid.gov/medicaid/financing-and-reimbursement/downloads/cms-6410-admin-category-of-services-definition-2-14.pdf.
– Dash indicates zero; $0 or -$0 indicates an amount between $0.5 and -$0.5 million that rounds to zero.1 Not all states had certified their CMS-64 Financial Management Report (FMR) submissions as of July 20, 2018. California’s fourth quarter submission was not certified; North Dakota's second, third, and fourth quarter submissions were not certified; Alabama's first quarter submission was not certified. Figures presented in this exhibit may change if states revise their expenditure data after this date.2 Includes design and development of systems (90 percent federal match), operation of approved systems (75 percent), and other costs (50 percent).3 Includes EHR incentive payments to providers (100 percent federal match) and administration of payments (90 percent).4 Includes skilled medical professionals, preadmission screening and resident review, medical and utilization review, external independent review, survey and certification, and MFCU operations (all at 75 percent federal match); translation and interpretation services for children and planning activities for the Health Home benefit (both at match equal to a state's federal medical assistance percentage); eligibility changes associated with the Temporary Assistance for Needy Families program (75 or 90 percent); administration of family planning services (90 percent); and immigration status verification systems (100 percent). Excludes MMIS and eligibility systems, which are included in their own categories.5 Excludes MMIS and eligibility systems, which are included in their own categories.6 State-level estimates for MFCUs and survey and certification are available but are not included in the CMS-64 data that MACPAC typically uses to analyze Medicaid spending.
Sources: For state and territory spending: MACPAC, 2018, analysis of CMS-64 FMR net expenditure data as of July 20, 2018. For MCFUs and survey and certification: CMS, 2018, Fiscal year 2019 justification of estimates for appropriations committees, Baltimore, MD: CMS, http://www.cms.gov/About-CMS/Agency-Information/PerformanceBudget/Downloads/FY2019-CJ-Final.pdf.
Section 3Section 3

Decem
ber 201894
Section 3: Program Enrollm
ent and Spending—CH
IP
MACStats
EXHIBIT 32. Child Enrollment in CHIP and Medicaid by State, FY 2017 (thousands)
Section 3Section 3
StateCHIP and Medicaid CHIP-funded coverage
Medicaid-funded coverage
Total Medicaid expansion Separate CHIP Total TotalTotal 46,333 5,498 3,965 9,463 36,870Alabama 821 112 109 221 600Alaska 118 19 – 19 99Arizona 1,018 84 32 115 903Arkansas1 603 69 75 144 459California 6,867 1,940 89 2,029 4,839Colorado 684 87 90 176 508Connecticut 378 – 29 29 349Delaware 121 2 12 14 107District of Columbia 98 12 0 12 86Florida 2,835 183 283 466 2,370Georgia1 1,553 73 164 237 1,316Hawaii 178 28 – 28 150Idaho 251 7 30 37 214Illinois 1,761 124 200 324 1,436Indiana 819 84 42 126 692Iowa 434 21 71 92 342Kansas 350 16 49 65 285Kentucky 642 58 39 96 546Louisiana 867 145 13 158 708Maine 170 14 9 23 147Maryland 680 142 – 142 538Massachusetts 775 90 130 220 555Michigan2 1,243 74 6 80 1,164Minnesota 667 1 3 4 663Mississippi 528 36 55 91 437Missouri 713 51 43 94 619Montana 148 12 32 44 104Nebraska 223 54 2 56 167Nevada 506 30 50 80 425New Hampshire 113 18 – 18 95New Jersey 980 103 137 240 740New Mexico 433 14 0 14 419New York 2,982 284 479 763 2,219North Carolina 1,428 157 117 274 1,154North Dakota 51 3 2 5 45

MA
CStats: Medicaid and CH
IP Data Book
95
Section 3: Program Enrollm
ent and Spending—CH
IP
MACStats
EXHIBIT 32. (continued)
StateCHIP and Medicaid CHIP-funded coverage
Medicaid-funded coverage
Total Medicaid expansion Separate CHIP Total TotalOhio 1,549 250 – 250 1,299Oklahoma 723 190 11 201 522Oregon 618 60 118 178 441Pennsylvania 1,589 107 256 363 1,226Rhode Island 139 26 1 27 112South Carolina 723 88 – 88 635South Dakota 100 15 5 20 80Tennessee 1,023 9 94 103 920Texas 4,653 364 774 1,138 3,515Utah 309 31 32 62 247Vermont 80 6 – 6 74Virginia 874 97 106 203 671Washington 872 – 65 65 807West Virginia3 283 12 26 37 246Wisconsin 710 99 81 179 530Wyoming 50 2 6 7 43
Notes: FY is fiscal year. The CHIP and Medicaid total column reflects children ever enrolled in CHIP or Medicaid during the year, even if for a single month. Most states counted children who were enrolled in multiple categories during the year (for example, in Medicaid-funded coverage for the first half of the year but in CHIP-funded coverage for the second half) in the most recent category (state-specific exceptions to this rule are noted below). Medicaid-funded child enrollment shown here includes all children, regardless of disability status; in other MACStats exhibits that break enrollment out by eligiblity group, children qualifying on the basis of disability may be counted in the disabled category rather than the child category. Data were reported by individual states as of September 17, 2018, and may be revised at a later date.
– Dash indicates zero; 0 indicates an amount less than 500 that rounds to zero.1 CMS notes that the CHIP and Medicaid total is accurate, but that "some Title XIX Medicaid children may be reported with the Title XXI CHIP data" (CMS 2018, note i).2 CHIP-funded Medicaid enrollees are "included in Medicaid enrollment counts, rather than in CHIP for FY 2016 and FY 2017. Therefore, the CHIP enrollment totals are artificially low and the Medicaid enrollment totals are artificially high for both fiscal years" (CMS 2018, note v).3 "Due to de-duplication of data and other data quality improvement efforts made in Quarter 1 of FY 2017, the Separate CHIP and Medicaid Expansion totals are artificially low in FY 2017" (CMS 2018, note viii).
Sources: CMS, 2018, Table: Unduplicated number of children ever enrolled (as of May 30), http://www.medicaid.gov/chip/downloads/fy-2017-childrens-enrollment-report.pdf. MACPAC, 2018, analysis of CHIP Statistical Enrollment Data System data as of September 17, 2018.
Section 3

Decem
ber 201896
Section 3: Program Enrollm
ent and Spending—CH
IP
MACStats Section 3
EXHIBIT 33. CHIP Spending by State, FY 2017 (millions)
State
Total CHIP
Benefits
State program administration
Section 2105(g)
spending2Medicaid-expansion CHIPSeparate CHIP programs and coverage of pregnant women1
Total Federal State Total Federal State Total Federal State Total Federal State FederalAlabama3 $332.3 $335.8 -$3.5 $132.1 $135.6 -$3.5 $192.8 $192.8 $0.0 $7.4 $7.4 $0.0 –Alaska 32.6 28.6 4.0 29.7 26.0 3.7 – – – 3.0 2.6 0.4 –Arizona3 215.0 215.0 -0.0 175.7 175.6 0.2 30.9 31.1 -0.1 8.3 8.4 -0.0 –Arkansas3 158.0 158.0 -0.0 61.8 61.8 -0.0 94.2 94.2 – 2.0 2.0 – –California 3,890.4 3,213.5 676.9 3,702.7 3,059.1 643.6 103.6 85.3 18.4 84.1 69.2 14.9 –Colorado 262.4 232.3 30.1 91.6 80.5 11.1 166.3 147.8 18.5 4.5 4.0 0.5 –Connecticut 42.2 95.6 -53.4 – – – 38.0 33.5 4.5 4.2 3.7 0.5 $58.4Delaware 38.3 34.8 3.5 4.7 4.3 0.4 31.9 29.0 2.9 1.7 1.6 0.2 –District of Columbia 36.5 36.5 – 34.5 34.5 – – – – 1.9 1.9 – –Florida 715.4 684.5 30.9 300.5 287.8 12.7 372.8 356.5 16.3 42.1 40.2 1.8 –Georgia3 406.2 406.4 -0.2 110.0 110.0 -0.0 272.7 272.9 -0.2 23.5 23.5 -0.0 –Hawaii 67.2 61.5 5.7 64.7 59.1 5.5 – – – 2.5 2.3 0.2 –Idaho3 76.2 76.1 0.1 12.2 12.2 0.1 60.5 60.5 -0.0 3.4 3.4 -0.0 –Illinois 262.7 237.3 25.4 99.3 87.9 11.4 138.0 126.2 11.8 25.3 23.2 2.2 –Indiana 217.5 217.0 0.4 149.6 149.2 0.4 56.3 56.3 0.0 11.6 11.6 0.0 –Iowa 134.7 124.9 9.8 29.6 27.4 2.2 93.4 86.6 6.8 11.6 10.8 0.8 –Kansas 111.7 103.0 8.7 25.0 23.1 1.9 76.9 70.9 6.0 9.8 9.1 0.8 –Kentucky3 212.9 212.9 0.0 124.8 124.6 0.1 82.8 82.9 -0.1 5.3 5.3 -0.0 –Louisiana 368.8 355.7 13.1 276.6 266.8 9.8 77.9 75.1 2.8 14.3 13.8 0.5 –Maine 34.9 34.2 0.7 20.5 20.1 0.4 13.4 13.2 0.2 1.0 1.0 0.0 –Maryland 316.7 278.7 38.0 315.4 277.5 37.8 -18.6 -16.3 -2.2 19.9 17.5 2.4 –Massachusetts 768.7 677.3 91.4 287.5 253.7 33.8 404.4 356.0 48.4 76.8 67.6 9.2 –Michigan 255.9 251.7 4.1 228.9 225.8 3.2 21.8 21.0 0.8 5.1 4.9 0.2 –Minnesota3 13.7 115.2 -101.5 1.7 1.5 0.2 10.8 10.9 -0.0 1.2 1.2 -0.0 101.7Mississippi 262.1 262.1 – 108.1 108.1 – 151.0 151.0 – 3.0 3.0 – –Missouri 225.2 219.2 6.0 125.3 121.9 3.4 87.7 85.5 2.3 12.2 11.8 0.3 –Montana 101.1 100.0 1.1 21.1 20.9 0.2 74.7 73.9 0.8 5.3 5.2 0.1 –Nebraska 83.1 75.5 7.6 72.2 65.8 6.4 4.3 3.9 0.5 6.6 5.9 0.7 –Nevada 69.2 68.0 1.2 21.7 21.3 0.4 44.8 44.0 0.8 2.7 2.6 0.0 –New Hampshire 34.5 43.5 -9.0 34.5 30.4 4.1 0.0 0.0 0.0 0.0 0.0 0.0 13.1New Jersey 529.9 466.5 63.4 241.0 211.8 29.1 235.0 207.2 27.8 53.9 47.5 6.4 –

MA
CStats: Medicaid and CH
IP Data Book
97
Section 3: Program Enrollm
ent and Spending—CH
IP
MACStats
EXHIBIT 33. (continued)
State
Total CHIP
Benefits
State program administration
Section 2105(g)
spending2Medicaid-expansion CHIPSeparate CHIP programs and coverage of pregnant women1
Total Federal State Total Federal State Total Federal State Total Federal State FederalNew Mexico3 $107.2 $107.3 -$0.1 $105.4 $105.5 -$0.1 $0.0 $0.0 – $1.8 $1.8 – –New York 1,445.7 1,272.2 173.5 665.8 585.9 79.9 737.2 648.7 $88.5 42.7 37.6 $5.1 –North Carolina 461.3 460.5 0.8 259.6 259.1 0.5 189.2 188.8 0.4 12.6 12.5 0.0 –North Dakota 27.2 24.2 3.1 17.7 15.6 2.1 6.6 6.0 0.6 2.9 2.6 0.3 –Ohio 570.1 542.9 27.2 535.9 510.0 25.9 – – – 34.2 32.9 1.3 –Oklahoma 236.4 224.5 11.9 234.6 222.8 11.8 -8.7 -8.4 -0.3 10.4 10.0 0.4 –Oregon 295.2 289.4 5.8 82.8 81.2 1.5 201.3 197.3 4.0 11.2 10.9 0.2 –Pennsylvania 682.0 608.7 73.3 267.4 238.7 28.7 402.7 359.4 43.3 11.9 10.6 1.3 –Rhode Island 36.0 45.3 -9.3 22.5 20.7 1.8 12.6 11.2 1.4 0.9 0.8 0.1 $12.6South Carolina 166.5 166.5 – 158.1 158.1 – – – – 8.4 8.4 – –South Dakota 31.7 29.0 2.7 22.7 20.8 1.9 8.5 7.8 0.8 0.5 0.5 0.0 –Tennessee 211.7 208.4 3.3 42.5 41.8 0.7 149.3 147.0 2.3 19.9 19.6 0.3 –Texas 1,812.0 1,672.9 139.1 794.0 733.1 60.9 957.2 883.7 73.5 60.7 56.1 4.7 –Utah3 138.3 138.4 -0.2 91.4 91.6 -0.2 41.2 41.2 -0.0 5.7 5.7 -0.0 –Vermont 12.1 27.8 -15.7 12.1 11.0 1.1 -1.1 -1.1 0.0 1.1 1.1 -0.0 16.8Virginia 333.6 293.0 40.6 137.8 121.0 16.9 174.5 153.3 21.2 21.3 18.7 2.6 –Washington 154.2 242.5 -88.3 34.1 30.0 4.1 118.0 103.7 14.3 2.1 1.8 0.3 106.9West Virginia 64.8 64.8 – 16.2 16.2 – 44.7 44.7 – 3.9 3.9 – –Wisconsin 207.7 223.1 -15.4 96.7 90.9 5.8 100.3 94.3 6.0 10.7 10.1 0.6 27.9Wyoming 13.3 11.7 1.6 2.5 2.2 0.3 9.9 8.8 1.2 0.9 0.8 0.1 –Subtotal (states) $17,283.0 $16,074.5 $1,208.5 $10,502.9 $9,440.5 $1,062.4 $6,062.1 $5,637.9 $424.1 $717.9 $658.6 $59.3 $337.3American Samoa 3.7 3.6 0.1 3.7 3.6 0.1 – – – – – – –Guam 32.8 30.2 2.6 32.8 30.2 2.6 – – – – – – –Northern Mariana Islands 10.2 9.6 0.7 10.2 9.6 0.7 – – – – – – –Puerto Rico 184.3 168.7 15.7 184.3 168.7 15.7 – – – – – – –Virgin Islands 9.0 8.2 0.8 9.0 8.2 0.8 – – – – – – –Total (states and territories) $17,522.9 $16,294.6 $1,228.3 $10,742.9 $9,660.7 $1,082.2 $6,062.1 $5,637.9 $424.1 $717.9 $658.6 $59.3 $337.3
Section 3

Decem
ber 201898
Section 3: Program Enrollm
ent and Spending—CH
IP
MACStats
EXHIBIT 33. (continued)
Notes: FY is fiscal year. Components may not add to total due to rounding. Federal CHIP spending on administration is generally limited to 10 percent of a state’s total federal CHIP spending for the year. States with Medicaid-expansion CHIP may elect to receive reimbursement for administrative spending from Medicaid rather than CHIP funds; Medicaid funds are not shown in this exhibit.
– Dash indicates zero; $0.0 or -$0.0 indicates an amount between $0.05 million and -$0.05 million that rounds to zero.1 Five states (Colorado, Missouri, New Jersey, Rhode Island, and Virginia) use CHIP funds to provide coverage for pregnant women.2 Section 2105(g) of the Social Security Act permits 11 qualifying states to use CHIP funds to pay the difference between the regular Medicaid matching rate and the enhanced CHIP matching rate for Medicaid-enrolled, Medicaid-financed children whose family income exceeds 133 percent of the federal poverty level. Although these are CHIP funds, they effectively reduce state spending on children in Medicaid and do not require a state match within CHIP. In cases where the sum of Section 2105(g) federal CHIP spending (for Medicaid enrollees) and regular federal CHIP spending (for CHIP enrollees) exceeds total spending for CHIP enrollees, states are shown in this table as having negative state CHIP spending (Connecticut, Minnesota, New Hampshire, Rhode Island, Vermont, Washington, and Wisconsin).3 State reports negative state CHIP spending for benefits or state program administration due to federal CHIP spending exceeding total CHIP spending. Federal CHIP spending exceeds total CHIP spending due to negative prior period adjustments and the 23 percentage point increase in the enhanced federal medical assistance percentage (E-FMAP) that went into effect in FY 2016. Because these prior period adjustments apply to periods before the 23 percentage point increase to the E-FMAP, these negative adjustments decrease total spending to a greater extent than federal spending.
Source: MACPAC, 2018, analysis of Medicaid and CHIP Budget Expenditure System data from CMS as of July 23, 2018.
Section 3Section 3

MA
CStats: Medicaid and CH
IP Data Book
99
Section 3: Program Enrollm
ent and Spending—CH
IP
insert exhibit here
MACStats
EXHIBIT 34. Federal CHIP Allotments, FYs 2016–2018 (millions)
Section 3
State FY 2016 federal CHIP allotments1 FY 2017 federal CHIP allotments FY 2018 federal CHIP allotmentsAlabama $457.3 $319.7 $338.5 Alaska 20.4 32.6 34.6Arizona 123.7 206.4 219.6Arkansas 174.5 194.4 205.8California 1,995.2 2,668.6 2,825.9Colorado 228.3 254.4 270.4Connecticut 61.9 77.4 82.0Delaware 38.5 35.3 37.3District of Columbia 25.6 42.5 45.8Florida 595.0 686.6 734.1Georgia 418.2 404.8 429.7Hawaii 46.3 52.3 55.4Idaho 66.4 82.9 88.4Illinois 406.2 547.4 579.7Indiana 165.7 191.1 202.3Iowa 147.6 145.7 154.6Kansas 112.2 124.7 132.0Kentucky 232.0 268.2 284.0Louisiana 238.9 358.8 380.0Maine 32.3 35.7 37.8Maryland 290.8 295.9 313.4Massachusetts 535.8 671.3 710.9Michigan 592.6 264.8 280.4Minnesota 98.6 115.2 122.3Mississippi 246.7 316.8 335.5Missouri 172.9 175.2 185.5Montana 95.8 103.5 110.3Nebraska 78.2 72.5 77.1Nevada 63.3 70.0 74.9New Hampshire 39.2 38.2 40.5New Jersey 406.8 462.9 490.2New Mexico 122.5 136.0 144.1New York 1,074.6 1,233.5 1,306.3North Carolina 448.2 479.5 508.7North Dakota 21.2 21.9 23.4Ohio 352.6 409.3 433.4

Decem
ber 2018100
Section 3: Program Enrollm
ent and Spending—CH
IP
MACStats Section 6 Section 5 Section 2Section 4 Section 1
EXHIBIT 34. (continued)
State FY 2016 federal CHIP allotments1 FY 2017 federal CHIP allotments FY 2018 federal CHIP allotmentsOklahoma $189.2 $249.0 $264.0Oregon 211.3 249.8 266.0Pennsylvania 365.1 527.3 558.4Rhode Island 65.4 72.8 77.1South Carolina 162.0 154.2 164.0South Dakota 23.6 26.9 28.8Tennessee 213.3 465.0 493.2Texas 1,345.1 1,382.1 1,476.3Utah 148.9 131.6 140.5Vermont 29.3 30.2 32.0Virginia 265.2 291.1 308.3Washington 215.3 242.5 259.3West Virginia 65.4 61.0 64.6Wisconsin 225.8 224.5 237.7Wyoming 10.9 12.6 13.4Subtotal (states) $13,761.9 $15,716.6 $16,678.5 American Samoa 2.1 2.9 3.1Guam 8.0 26.6 28.1Northern Mariana Islands 1.0 6.7 7.1Puerto Rico 179.8 192.5 203.8Virgin Islands 5.3 6.9 7.3Total (states and territories) $13,958.3 $15,952.1 $16,927.9
Notes: FY is fiscal year.1 Per statute, FY 2016 federal CHIP allotments were based on each state's prior-year federal CHIP spending. In addition, because a 23 percentage point increase in the CHIP matching rate went into effect in FY 2016, the FY 2016 allotments were calculated based on the FY 2015 amount increased by 23 percentage points (as if the increased matching rate had been in effect in FY 2015). The FY 2016 allotment increase factor, which was approximately 5 percent for most states, was then applied.
Sources: MACPAC, 2018, analysis of Medicaid and CHIP Budget Expenditure System data as of March 15, 2018. CMS, 2018, phone call to MACPAC, March 9.
MACStats Section 3Section 3

SECTION 4
Medicaid and CHIP Eligibility

December 2018102
Section 4: Medicaid and CHIP Eligibility
Section 4: Medicaid and CHIP Eligibility
Key Points• Thirty-one states and the District of Columbia now cover low-income adults not otherwise
eligible on the basis of disability, a new Medicaid eligibility group created under the PatientProtection and Affordable Care Act (P.L. 111-148, as amended). Five additional states haveapproved a Medicaid expansion but have not implemented it as of April 2018. Most of thesenew adult enrollees are eligible at incomes up to 138 percent of the federal poverty level (FPL)(Exhibit 36).
• Since 2014, eligibility levels under Medicaid and the State Children's Health Insurance Program(CHIP) for most children and adults eligible on a basis other than disability are determinedusing uniform modified adjusted gross income (MAGI) rules (Exhibits 35 and 36).
• Eligibility criteria for individuals eligible for Medicaid on the basis of disability and forindividuals age 65 and older, who are not subject to MAGI rules, were largely unchangedbetween 2017 and 2018 (Exhibit 37).
• In 2018, in the lower 48 states and the District of Columbia, 100 percent FPL is $12,140 for anindividual plus $4,320 for each additional family member (Exhibit 38).

MA
CStats: Medicaid and CH
IP Data Book
103
Section 4: Medicaid and CH
IP EligibilityEXHIBIT 35. Medicaid and CHIP Income Eligibility Levels as a Percentage of the Federal Poverty Level for Children
and Pregnant Women by State, April 2018
MACStats Section 4MACStats Section 4
StateCHIP program type1
(as of April 2018)
Medicaid coverage2Separate CHIP
coverageMedicaid or
CHIP coverageInfants under age 1 Age 1–5 Age 6–18 Birth
through age 183
Unborn children4
Pregnant women and deemed newborns5
Medicaid funded
CHIP funded
Medicaid funded
CHIP funded
Medicaid funded
CHIP funded
Alabama Combination 141% – 141% – 141% 107–141% 312% – 141%Alaska Medicaid expansion 177 159–203% 177 159–203% 177 124–203 – – 200Arizona Combination 147 – 141 – 133 104–133 200 – 156Arkansas Combination 142 – 142 – 142 107–142 211 209% 209California Combination 208 208–261 142 142–261 133 108–261 3176 317 208Colorado Combination 142 – 142 – 142 108–142 260 – 195; 260Connecticut Separate 196 – 196 – 196 – 318 – 258Delaware Combination 212 194–212 142 – 133 110–133 2127 – 212District of Columbia Medicaid expansion 319 206–319 319 146–319 319 112–319 – – 319Florida Combination 206 192–206 140 – 133 112–133 2107 – 191Georgia Combination 205 – 149 – 133 113–133 247 – 220Hawaii Medicaid expansion 191 191–308 139 139–308 133 105–308 – – 191Idaho Combination 142 – 142 – 133 107–133 185 – 133Illinois Combination 142 – 142 – 142 108–142 313 208 208Indiana Combination 208 157–208 158 141–158 158 106–158 250 – 208Iowa Combination 375 240–375 167 – 167 122–167 3027 – 375Kansas Combination 166 – 149 – 133 113–133 235 – 166Kentucky Combination 195 – 142 142–159 133 109–159 213 – 195Louisiana Combination 142 142–212 142 142–212 142 108–212 250 209 133Maine Combination 191 – 157 140–157 157 132–157 208 – 209Maryland Medicaid expansion 194 194–317 138 138–317 133 109–317 – – 259Massachusetts Combination 200 185–200 150 133–150 150 114–150 300 200 200Michigan Combination 195 195–212 160 143–212 160 109–212 – 195 195Minnesota Combination 275 275–2838 275 – 275 – – 278 278Mississippi Combination 194 – 143 – 133 107–133 209 – 194Missouri Combination 196 – 148 148–150 148 110–150 300 300 196; 300Montana Combination 143 – 143 – 133 109–143 261 – 157Nebraska Combination 162 162–213 145 145–213 133 109–213 – 197 194Nevada Combination 160 – 160 – 133 122–133 200 – 160New Hampshire Medicaid expansion 196 196–318 196 196–318 196 196–318 – – 196New Jersey Combination 194 – 142 – 142 107–142 350 – 194; 200New Mexico Medicaid expansion 240 200–300 240 200–300 190 138–240 – – 250

Decem
ber 2018104
Section 4: Medicaid and CH
IP Eligibility
insert exhibit here
EXHIBIT 35. (continued)
StateCHIP program type1
(as of April 2018)
Medicaid coverage2Separate CHIP
coverageMedicaid or
CHIP coverageInfants under age 1 Age 1–5 Age 6–18 Birth
through age 183
Unborn children4
Pregnant women and deemed newborns5
Medicaid funded
CHIP funded
Medicaid funded
CHIP funded
Medicaid funded
CHIP funded
New York Combination 218% – 149% – 149% 110–149% 400% – 218%North Carolina Combination 210 194–210% 210 141–210% 133 107–133 2119 – 196North Dakota Combination 147 – 147 – 133 111–133 170 – 147Ohio Medicaid expansion 156 141–206 156 141–206 156 107–206 – – 200Oklahoma Combination 205 169–205 205 151–205 205 115–205 – 205% 133Oregon Combination 185 133–185 133 – 133 100–133 300 185 185Pennsylvania Combination 215 – 157 – 133 119–133 314 – 215Rhode Island Combination 190 190–261 142 142–261 133 109–261 – 253 190; 253South Carolina Medicaid expansion 194 194–208 143 143–208 133 107–208 – – 194South Dakota Combination 182 147–182 182 147–182 182 111–182 204 133 133Tennessee10 Combination 195 – 142 – 133 109–133 250 250 195Texas Combination 198 – 144 – 133 109–133 201 202 198Utah Combination 139 – 139 – 133 105–133 200 – 139Vermont Medicaid expansion 312 237–312 312 237–312 312 237–312 – – 208Virginia Combination 143 – 143 – 143 109–143 200 – 143; 200Washington Separate 210 – 210 – 210 – 312 193 193West Virginia Combination 158 – 141 – 133 108–133 300 – 158Wisconsin Combination 301 – 186 – 133 101–151 3017 301 301Wyoming Combination 154 – 154 – 133 119–133 200 – 154
Notes: As of January 2018, 100 percent of the federal poverty level (FPL) in the lower 48 states and the District of Columbia was $12,140 for an individual plus $4,320 for each additional family member. Prior to 2014, states had the flexibility to disregard income sources and amounts of their choosing when determining Medicaid and CHIP eligibility. In 2014, uniform modified adjusted gross income (MAGI) rules became mandatory for determining Medicaid and CHIP eligibility for most children and adults under age 65 eligible for Medicaid on a basis other than disability, including the groups shown in this table. As a result, states are now required to use MAGI-converted eligibility levels that account for the change in income-counting rules. The eligibility levels shown in this table reflect these MAGI-converted levels or another MAGI-based income limit in effect in each state for these groups as of April 2018. Under federal regulations, the effective income limits may be 5 percentage points higher than the percentage of FPL shown in this table to account for a general income disregard that applies to an individual’s eligibility under the group with the highest income standard, rather than for particular eligibility groups within Medicaid or CHIP.
Medicaid (Title XIX of the Social Security Act (the Act)) funding continues to finance Medicaid coverage of children under age 19 in families with incomes below state eligibility levels in effect as of March 31, 1997. Any expansion of eligibility to uninsured children above those levels—through expansions of Medicaid or through separate CHIP programs—is generally financed by CHIP (Title XXI of the Act) funding. CHIP funding is not permitted for children with other coverage. Thus, where Medicaid coverage in this table shows overlapping eligibility levels for Medicaid funding and CHIP funding, children with no other coverage are funded by CHIP, while children with other coverage are funded by Medicaid. Pregnant women can receive Medicaid- or CHIP-funded services through regular state plan eligibility pathways or through Section 1115 waivers; in addition, the unborn children of pregnant women may receive CHIP-funded coverage under a state plan option.
MACStats Section 4MACStats Section 4

MA
CStats: Medicaid and CH
IP Data Book
105
Section 4: Medicaid and CH
IP Eligibility
MACStats Section 4
EXHIBIT 35. (continued)
– Dash indicates that state does not use this eligibility pathway.1 Under CHIP, states can implement Medicaid expansion, separate CHIP, or a combination program. Eight states and the District of Columbia use Medicaid expansion and two states (Connecticut and Washington) use separate CHIP. Forty states use combination programs, although some of these are combination programs solely as a result of the transition of children in families with income less than or equal to 133 percent FPL from separate CHIP to Medicaid.2 Under Medicaid-funded coverage, there is no lower threshold for income eligibility. The eligibility levels listed are the highest income levels under which each age group of children is covered under the Medicaid state plan. The eligibility levels listed under CHIP-funded Medicaid coverage are the income levels to which Medicaid has expanded using CHIP funds (which became available when CHIP was created in 1997). For states that set different CHIP-funded eligibility levels for children age 6–13 and age 14–18, this table shows only the levels for children age 6–13. In addition, Section 2105(g) of the Social Security Act permits 11 qualifying states to use CHIP funds to pay the difference between the regular Medicaid matching rate and the enhanced CHIP matching rate for Medicaid-enrolled, Medicaid-financed uninsured children whose family income exceeds 133 percent FPL (not separately noted on this table).3 Separate CHIP eligibility for children from birth through age 18 generally begins where Medicaid coverage ends (as shown in the previous columns).4 For unborn children, there is no lower threshold for income eligibility if the mother is not eligible for Medicaid.5 Deemed newborns are infants up to age one who are deemed eligible for Medicaid or CHIP—with no separate application or eligibility determination required—if the mother was enrolled at the time of the birth. Pregnant women can be covered with Medicaid or CHIP funding. Under CHIP, coverage can be through a state plan option for targeted low-income pregnant women or through continuation of an existing Section 1115 waiver. When two values are shown in this column, the first is for Medicaid and the second is for CHIP.6 In three counties in California, separate CHIP covers children with family income up to and including 317 percent FPL.7 In Delaware, Florida, Iowa, and Wisconsin, separate CHIP covers children age 1–18.8 In Minnesota, Medicaid-expansion CHIP coverage for incomes less than or equal to 283 percent FPL level applies only to infants (defined by the state as being under age two).9 North Carolina's separate CHIP covers children age 6–18.10 Although Tennessee covers children with CHIP-funded Medicaid, new enrollment is currently capped, except for children who roll over from traditional Medicaid.
Sources: MACPAC, 2018, analysis of CMS, 2018, State Medicaid and CHIP income eligibility standards (for selected MAGI groups, based on state decisions as of April 1, 2018), https://www.medicaid.gov/medicaid/program-information/medicaid-and-chip-eligibility-levels/index.html; Kaiser Family Foundation (KFF), 2018, Medicaid and CHIP eligibility, enrollment, renewal, and cost sharing policies as of January 2018: Findings from a 50-state survey, Menlo Park, CA: KFF, http://files.kff.org/attachment/Report-Medicaid-and-CHIP-Eligibility-Enrollment-Renewal-and-Cost-Sharing-Policies-as-of-January-2018; CMS, 2018, Medicaid state plan amendments, https://www.medicaid.gov/state-resource-center/medicaid-state-plan-amendments/index.html; and CMS, 2018, CHIP state plan amendments, https://www.medicaid.gov/chip/state-program-information/index.html. CMS, 2018, phone call to MACPAC, August 21.
MACStats Section 4
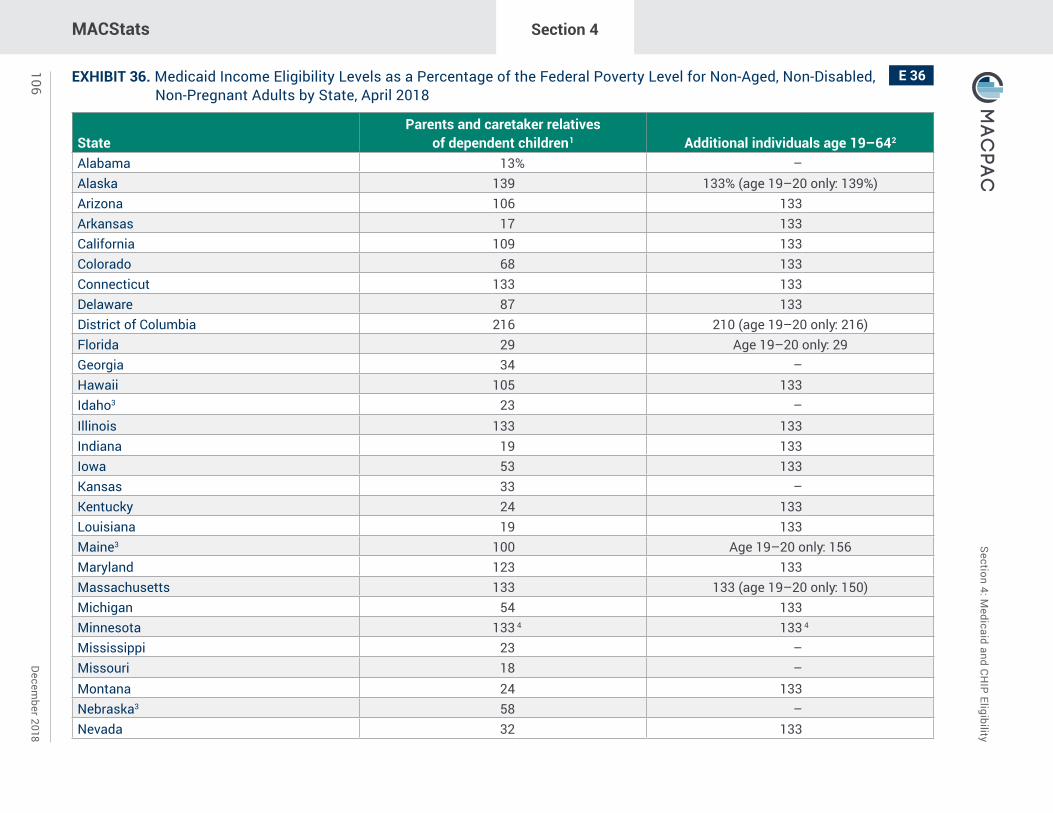
Decem
ber 2018106
Section 4: Medicaid and CH
IP EligibilityEXHIBIT 36. Medicaid Income Eligibility Levels as a Percentage of the Federal Poverty Level for Non-Aged, Non-Disabled, Non-Pregnant Adults by State, April 2018
MACStats Section 4MACStats Section 4
StateParents and caretaker relatives
of dependent children1 Additional individuals age 19–642
Alabama 13% –Alaska 139 133% (age 19–20 only: 139%)Arizona 106 133Arkansas 17 133California 109 133Colorado 68 133Connecticut 133 133Delaware 87 133District of Columbia 216 210 (age 19–20 only: 216)Florida 29 Age 19–20 only: 29Georgia 34 –Hawaii 105 133Idaho3 23 –Illinois 133 133Indiana 19 133Iowa 53 133Kansas 33 –Kentucky 24 133Louisiana 19 133Maine3 100 Age 19–20 only: 156Maryland 123 133Massachusetts 133 133 (age 19–20 only: 150)Michigan 54 133Minnesota 133 4 133 4
Mississippi 23 –Missouri 18 –Montana 24 133Nebraska3 58 –Nevada 32 133

MA
CStats: Medicaid and CH
IP Data Book
107
Section 4: Medicaid and CH
IP Eligibility
MACStats Section 4
EXHIBIT 36. (continued)
StateParents and caretaker relatives
of dependent children1 Additional individuals age 19–642
New Hampshire 67% 133%New Jersey 31 133New Mexico 45 133New York 133 4 133 4
North Carolina 43 Age 19–20 only: 44North Dakota 52 133Ohio 90 133Oklahoma 41 5 – 6
Oregon 40 133Pennsylvania 33 133Rhode Island 116 133South Carolina 62 –South Dakota 56 –Tennessee 101 –Texas 15 –Utah3 55 5 – 6
Vermont 52 133Virginia3 48 –
Washington 40 133West Virginia 19 133Wisconsin 95 95Wyoming 54 –
Notes: As of January 2018, 100 percent of the federal poverty level (FPL) in the lower 48 states and the District of Columbia was $12,140 for an individual plus $4,320 for each additional family member. Prior to 2014, states had the flexibility to disregard income sources and amounts of their choosing when determining Medicaid and CHIP eligibility. In 2014, uniform modified adjusted gross income (MAGI) rules became mandatory for determining Medicaid and CHIP eligibility for most children and adults under age 65 eligible for Medicaid on a basis other than disability, including the groups shown in this table. As a result, states are now required to use MAGI-converted eligibility levels that account for the change in income-counting rules. The eligibility levels shown in this table reflect these MAGI-converted levels or another MAGI-based income limit in effect in
MACStats Section 4

Decem
ber 2018108
Section 4: Medicaid and CH
IP EligibilityEXHIBIT 36. (continued)
each state for these groups as of April 2018. Under federal regulations, the effective income limits may be 5 percentage points higher than the percentage of FPL shown in this table to account for a general income disregard that applies to an individual’s determination of eligibility under the group with the highest income standard, rather than for particular eligibility groups within Medicaid or CHIP.
States are required to provide Medicaid coverage for parents and other caretaker relatives (and their dependent children), at or above the state's 1988 Aid to Families with Dependent Children eligibility levels. Under regular Medicaid state plan rules, states may opt to cover additional parents and caretaker relatives, children age 19–20, and other individuals age 19–64 who have incomes less than or equal to 133 percent FPL and are not pregnant or eligible for Medicare. Certain states provide coverage under Section 1115 waivers, which allow them to operate their Medicaid programs with fewer statutory requirements. As noted in this table, the covered benefits under these waivers may be more limited than those provided under regular state plan rules and might not be available to all individuals at the income levels shown.
– Dash indicates that state does not use this eligibility pathway.1 In states that use dollar amounts rather than percentage of FPL to determine eligibility for parents, dollar amounts were converted to percentage of FPL, and the highest percentage was selected to reflect eligibility level for the group. Parents and caretaker relatives with income above the reported threshold for this group may be eligible for coverage under the new adult group (under Section 1902(a)(10)(A)(i)(VIII) of the Social Security Act (the Act)) in states that have adopted the expansion.2 Reflects state plan coverage under Section 1902(a)(10)(A)(i)(VIII) of the Act for individuals who are age 19–64, have incomes less than or equal to 133 percent FPL, and are not pregnant or eligible for Medicare; state plan coverage for children age 19–20 where indicated; and Section 1115 waiver coverage that is not subject to the limitations indicated in note 4.3 Additional states have opted to expand Medicaid, but had not implemented as of April 2018. These include Idaho, Maine, Nebraska, and Utah, which opted to expand coverage to the new adult group by voter referendum, and Virginia, which adopted the expansion through the state budget.4 In Minnesota and New York, individuals with incomes greater than 133 percent FPL but that do not exceed 200 percent FPL are covered under the Basic Health Program.5 Reflects parent coverage under the Medicaid state plan. The state has some additional coverage above state plan eligibility standards through a Section 1115 demonstration or a pending demonstration proposal. The demonstration includes limitations on eligibility or benefits, is not offered to all residents of the state, or includes an enrollment cap.6 The state has a Section 1115 demonstration that provides Medicaid coverage to some low-income adults. The demonstration includes limitations on eligibility or benefits, is not offered to all residents of the state, or includes an enrollment cap.
Sources: MACPAC, 2018, analysis of CMS, 2018, State Medicaid and CHIP income eligibility standards (for selected MAGI groups, based on state decisions as of April 1, 2018), https://www.medicaid.gov/medicaid/program-information/medicaid-and-chip-eligibility-levels/index.html; Kaiser Family Foundation (KFF), 2018, Medicaid and CHIP eligibility, enrollment, renewal, and cost sharing policies as of January 2018: Findings from a 50-state survey, Menlo Park, CA: KFF, http://files.kff.org/attachment/Report-Medicaid-and-CHIP-Eligibility-Enrollment-Renewal-and-Cost-Sharing-Policies-as-of-January-2018; and CMS, 2018, Medicaid state plan amendments, https://www.medicaid.gov/state-resource-center/medicaid-state-plan-amendments/index.html. CMS, 2018, phone call to MACPAC, July 26.
MACStats Section 4MACStats Section 4

MA
CStats: Medicaid and CH
IP Data Book
109
Section 4: Medicaid and CH
IP Eligibility
MACStats
EXHIBIT 37. Medicaid Income Eligibility Levels as a Percentage of the Federal Poverty Level for Individuals Age 65and Older and Persons with Disabilities by State, 2018
StateState eligibility
type1 SSI recipients2 § 209(b) eligibility Poverty level3 Medically needy4Special income
level5
Alabama § 1634 74% – – – 222%Alaska SSI criteria 606 – – – 179Arizona § 1634 74 – 100% – 222Arkansas § 1634 74 – 80 (aged only) 11% 222California § 1634 74 – 100 59 –Colorado § 1634 74 – – – 222Connecticut § 209(b) – 63%7 – 63 222Delaware § 1634 74 – – – 185District of Columbia § 1634 74 – 100 64 222Florida § 1634 74 – 88 18 222Georgia § 1634 74 – – 31 222Hawaii § 209(b) – 65 100 41 –Idaho SSI criteria 74 – 77 – 222Illinois § 209(b) – 100 100 100 –Indiana § 1634 74 – 100 – 222Iowa § 1634 74 – – 48 222Kansas SSI criteria 74 – – 47 222Kentucky § 1634 74 – – 21 222Louisiana § 1634 74 – – 10 222Maine § 1634 74 – 100 31 222Maryland § 1634 74 – – 35 222Massachusetts8 § 1634 74 – 100 (aged); 133 (disabled) 52 222Michigan § 1634 74 – 100 40 222Minnesota § 209(b) – 80 100 80 222Mississippi § 1634 74 – – – 222Missouri § 209(b) – 85 85 85 130Montana § 1634 74 – – 52 –Nebraska SSI criteria 74 – 100 39 –Nevada SSI criteria 74 – – – 222
MACStats Section 4

Decem
ber 2018110
Section 4: Medicaid and CH
IP Eligibility
insert exhibit here
EXHIBIT 37. (continued)
StateState eligibility
type1 SSI recipients2 § 209(b) eligibility Poverty level3 Medically needy4Special income
level5
New Hampshire § 209(b) – 75% – 58% 222%New Jersey § 1634 74% – 100% 36 222New Mexico § 1634 74 – – – 222New York § 1634 74 – 83 83 –North Carolina § 1634 74 – 100 24 –North Dakota § 209(b) – 83 – 83 –Ohio9 § 1634 74 – – – 222Oklahoma9 SSI criteria 74 – 100 – 222Oregon SSI criteria 74 – – – 222Pennsylvania § 1634 74 – 100 42 222Rhode Island § 1634 74 – 100 89 222South Carolina § 1634 74 – 100 – 222South Dakota § 1634 74 – – – 222Tennessee § 1634 74 – – – 222Texas § 1634 74 – – – 222Utah SSI criteria 74 – 100 100 222Vermont § 1634 74 – – 111 222Virginia § 209(b) – 74 80 47 222Washington § 1634 74 – – 74 222West Virginia § 1634 74 – – 20 222Wisconsin § 1634 74 – 82 58 222Wyoming § 1634 74 – – – 222
Notes: SSI is Supplemental Security Income. § 209(b) refers to Section 209(b) of the Social Security Act Amendments of 1972; § 1634 refers to Section 1634 of the Social Security Act. In 2018, 100 percent of the federal poverty level (FPL) in the lower 48 states and the District of Columbia is $12,140 for an individual and $4,320 for each additional family member. Eligibility levels shown here apply to countable income; as a result, states that use optional income disregards to reduce countable income effectively allow more people to qualify at a given eligibility level (e.g., 100 percent FPL) than states that do not use income disregards. The eligibility levels listed in this table are for individuals; the eligibility levels for couples differ for certain categories. In addition, income eligibility levels for individuals who qualify based on blindness may be higher than for individuals age 65 or older or who qualify on the basis of other disabilities.
In most states, enrollment in the SSI program for individuals age 65 and older and persons eligible on the basis of disability automatically qualifies them for Medicaid. However, Section 209(b) states may use more restrictive criteria (related to income and assets, disability, or both) than SSI when determining Medicaid eligibility. All states have the option of covering additional people with low incomes or high medical expenses through other eligibility pathways, such as poverty level, medically needy, and special income level.
MACStats Section 4MACStats Section 4

MA
CStats: Medicaid and CH
IP Data Book
111
Section 4: Medicaid and CH
IP Eligibility
MACStats Section 4
– Dash indicates that state does not use this eligibility pathway.1 SSI criteria are used to determine Medicaid eligibility in both Section 1634 and SSI-criteria states. In Section 1634 states, the federal eligibility determination process for SSI automatically qualifies an individual for Medicaid; in SSI-criteria states, individuals must submit information to the state for a separate eligibility determination. Section 209(b) states may use eligibility criteria (related to income and assets, disability, or both) that are more restrictive than SSI program criteria, but they may not use more restrictive criteria than those in effect in the state on January 1, 1972. If a Section 209(b) state does not have a separate medically needy standard, it must allow individuals with higher incomes to spend down to the Section 209(b) income level shown here by deducting incurred medical expenses from the amount of income that is counted for Medicaid eligibility purposes.2 The SSI federal benefit rate as a percentage of the FPL increased from 2017 because during this period the SSI federal benefit rate increased by 2.0 percent and the FPL increased by 0.7 percent.3 Under the poverty level option, states may choose to provide Medicaid coverage to individuals who are age 65 or older or have disabilities and whose income is above the SSI or Section 209(b) level but is less than or equal to the FPL.4 Under the medically needy option, individuals with higher incomes can spend down to the medically needy income level shown here by deducting incurred medical expenses from the amount of income that is counted for Medicaid eligibility purposes. Five states (Connecticut, Louisiana, Michigan, Vermont, and Virginia) have a medically needy income standard that varies by location; the highest income standard is listed for each of these states.5 Under the special income level option, states have the option to provide Medicaid benefits to people who require at least 30 days of nursing facility or other institutional care and have incomes up to 300 percent of the SSI benefit rate (which was about 222 percent FPL in 2018). The income thresholds listed in this column may be for institutional services, home- and community-based waiver services, or both.6 The dollar amount that equals the upper income eligibility level for SSI does not vary by state; however, the dollar amount that equals the FPL is higher in Alaska, resulting in a lower percentage.7 The income standards in Connecticut vary by location; the highest income standard for region A is listed. The income standard in regions B and C is 52 percent of FPL.8 Massachusetts provides medically needy coverage for individuals who are age 65 and older and those who are eligible on the basis of disability, but the rules for counting income and spend-down expenses vary for these groups.9 Oklahoma was a Section 209(b) state until October 1, 2015, when it became an SSI-criteria state. Ohio was a Section 209(b) state until August 1, 2016, when it became a Section 1634 state; Ohio also eliminated its medically needy program during the conversion to Section 1634 criteria.
Source: MACPAC, 2018, analysis of eligibility information from state websites and Medicaid state plans as of September 2018.
EXHIBIT 37. (continued)
MACStats Section 4

Decem
ber 2018112
Section 4: Medicaid and CH
IP Eligibility
insert exhibit here
EXHIBIT 38. Income as a Percentage of the Federal Poverty Level for Various Family Sizes, 2018
State FPL
Annual amount Monthly amount
Family size Family size
1 2 3 4
Each additional
person 1 2 3 4
Each additional
person
Lower 48 states and District of Columbia
100% $12,140 $16,460 $20,780 $25,100 $4,320 $1,012 $1,372 $1,732 $2,092 $360
133 16,146 21,892 27,637 33,383 5,746 1,346 1,824 2,303 2,782 479
138 16,753 22,715 28,676 34,638 5,962 1,396 1,893 2,390 2,887 497
150 18,210 24,690 31,170 37,650 6,480 1,518 2,058 2,598 3,138 540
185 22,459 30,451 38,443 46,435 7,992 1,872 2,538 3,204 3,870 666
200 24,280 32,920 41,560 50,200 8,640 2,023 2,743 3,463 4,183 720
250 30,350 41,150 51,950 62,750 10,800 2,529 3,429 4,329 5,229 900
300 36,420 49,380 62,340 75,300 12,960 3,035 4,115 5,195 6,275 1,080
400 48,560 65,840 83,120 100,400 17,280 4,047 5,487 6,927 8,367 1,440
Alaska 100 15,060 20,290 25,520 30,750 5,400 1,255 1,691 2,127 2,563 450
133 20,030 26,986 33,942 40,898 7,182 1,669 2,249 2,828 3,408 599
138 20,783 28,000 35,218 42,435 7,452 1,732 2,333 2,935 3,536 621
150 22,590 30,435 38,280 46,125 8,100 1,883 2,536 3,190 3,844 675
185 27,861 37,537 47,212 56,888 9,990 2,322 3,128 3,934 4,741 833
200 30,120 40,580 51,040 61,500 10,800 2,510 3,382 4,253 5,125 900
250 37,650 50,725 63,800 76,875 13,500 3,138 4,227 5,317 6,406 1,125
300 45,180 60,870 76,560 92,250 16,200 3,765 5,073 6,380 7,688 1,350
400 60,240 81,160 102,080 123,000 21,600 5,020 6,763 8,507 10,250 1,800
MACStats Section 4MACStats Section 4

MA
CStats: Medicaid and CH
IP Data Book
113
Section 4: Medicaid and CH
IP Eligibility
MACStats
insert exhibit here
EXHIBIT 38. (continued)
State FPL
Annual amount Monthly amount
Family size Family size
1 2 3 4
Each additional
person 1 2 3 4
Each additional
person
Hawaii 100% $13,860 $18,670 $23,480 $28,290 $4,970 $1,155 $1,556 $1,957 $2,358 $414
133 18,434 24,831 31,228 37,626 6,610 1,536 2,069 2,602 3,135 551
138 19,127 25,765 32,402 39,040 6,859 1,594 2,147 2,700 3,253 572
150 20,790 28,005 35,220 42,435 7,455 1,733 2,334 2,935 3,536 621
185 25,641 34,540 43,438 52,337 9,195 2,137 2,878 3,620 4,361 766
200 27,720 37,340 46,960 56,580 9,940 2,310 3,112 3,913 4,715 828
250 34,650 46,675 58,700 70,725 12,425 2,888 3,890 4,892 5,894 1,035
300 41,580 56,010 70,440 84,870 14,910 3,465 4,668 5,870 7,073 1,243
400 55,440 74,680 93,920 113,160 19,880 4,620 6,223 7,827 9,430 1,657
Notes: FPL is federal poverty level. The FPLs shown here are based on the U.S. Department of Health and Human Services (HHS) 2018 federal poverty guidelines. These differ slightly from the U.S. Census Bureau’s federal poverty thresholds, which are used mainly for statistical purposes. The separate poverty guidelines for Alaska and Hawaii reflect Office of Economic Opportunity administrative practice beginning in the 1966–1970 period.
Source: HHS, 2018, Annual update of the HHS poverty guidelines, Federal Register 83, no. 12 (January 18): 2643.
MACStats Section 4


SECTION 5
Beneficiary Health, Service Use, and Access to Care
116
Section 5: Beneficiary Health, Service Use, and Access to Care
December 2018
Section 5: Beneficiary Health, Service Use, and Access to Care
Key Points• Children whose primary coverage source is Medicaid or the State Children's Health Insurance
Program (CHIP) are less likely to be in excellent or very good health than those with private coverage (Exhibit 39).
• Data from the National Health Interview Survey (NHIS) and the Medical Expenditure Panel Survey (MEPS) indicate that children with Medicaid or CHIP are less likely than those with private coverage and more likely than those who are uninsured to have seen a dentist in the past 12 months. However, measures of service use vary depending on the data source: the percentage of children with Medicaid or CHIP reported as having seen a dentist differs substantially between the NHIS (78.9 percent in 2017) and MEPS (39.8 percent in 2016), with similar differences observed for children who have private coverage or are uninsured (Exhibits 40 and 41).
• Adults age 19–64 whose primary coverage source is Medicaid or CHIP are less likely to be in excellent or very good health than those who have private coverage or are uninsured. Adults age 19–64 whose primary coverage source is Medicare, who must meet federal disability criteria to receive coverage, report the poorest health and highest service use in this age group (Exhibits 43–45).
• Children whose primary coverage source is Medicaid or CHIP are reported as seeing a general doctor or having a well-child checkup slightly less than those with private coverage, but more than those who are uninsured (Exhibit 40). They are more likely to have trouble finding a doctor or to experience delayed care than those with private coverage (Exhibit 42).
• Adults age 19–64 whose primary coverage is Medicaid report having a usual source of care slightly less than those with private coverage and are more likely to report having difficulties with access to care. Among adults age 19–64 with health coverage (i.e., excluding the uninsured), adults whose primary coverage source is Medicare report the highest rates of delayed care and unmet need due to cost (Exhibit 46).
• Measures of use of care for specific types of services should be interpreted with caution due to the limitations of survey data and the characteristics of the populations examined. For example, the results shown are unadjusted for differences in age, health, income, race and ethnicity, and family and household characteristics, which are known factors in explaining some of the differences in access and use observed between individuals with different coverage sources. In addition, this section presents data based on primary source of coverage, with multiple coverage sources narrowed down to a single source based on a hierarchy (for selected characteristics of individuals without the application of this hierarchy, see Exhibit 2).

MA
CStats: Medicaid and CH
IP Data Book
117
Section 5: Beneficiary Health, Service U
se, and Access to Care
MACStats Section 5
EXHIBIT 39. Coverage, Demographic, and Health Characteristics of Non-Institutionalized Individuals Age 0–18 byPrimary Source of Health Coverage, 2017
CharacteristicsPrimary coverage source at time of interview1
Total Private2 Medicaid or CHIP3 Uninsured4
Total (percent distribution across coverage sources)5 100.0% 55.3% 35.4% 5.1%CoverageLength of time with any coverage during the yearFull year 91.5* 97.0* 95.6 –Part year 4.6 2.9* 4.2 31.7*No coverage during year 2.9* – – 68.3*DemographicsAge0–5 29.9* 28.5* 33.4 20.6*6–11 32.0 31.5 32.8 31.012–18 38.0* 40.0* 33.8 48.3*GenderMale 51.1 51.1 49.8 55.1Female 48.9 48.9 50.2 44.9RaceHispanic 25.0* 15.5* 38.4 38.2White, non-Hispanic 53.0* 66.3* 33.6 42.9*Black, non-Hispanic 14.7* 9.6* 22.7 11.5*Other non-white, non-Hispanic 7.3* 8.6* 5.3 7.4Parents present in familyMother, no father 22.9* 12.6* 39.5 21.9*Father, no mother 3.7 3.0* 4.3 5.0Both present 70.1* 83.2* 49.3 71.2*No parents 3.3* 1.2* 6.9 †Family incomeHas income less than 138 percent FPL 27.7* 6.7* 59.4 33.0*Has income in ranges shown below
Less than 100 percent FPL 18.7* 4.0* 41.2 22.5*100–199 percent FPL 22.1* 10.7* 37.8 33.2200–399 percent FPL 28.4* 34.5* 17.9 31.1*400 percent FPL or higher 30.6* 50.8* 2.8 13.0*
MACStats Section 5

Decem
ber 2018118
Section 5: Beneficiary Health, Service U
se, and Access to Care
insert exhibit here
EXHIBIT 39. (continued)
CharacteristicsPrimary coverage source at time of interview1
Total Private2 Medicaid or CHIP3 Uninsured4
Other demographic characteristicsCitizen of United States 97.4% 98.4%* 96.8% 89.0%*Receives SSI6 1.2* † 3.0 †Family receives WIC 5.9* 1.4* 13.3 3.0*HealthCurrent health statusExcellent or very good 84.8* 90.1* 76.6 82.5*Good 13.5* 9.1* 20.0 15.4Fair or poor 1.8* 0.8* 3.4 †Body Mass Index (BMI)7
Healthy weight (BMI less than 25) 77.1* 82.4* 66.9 75.6Overweight (BMI 25–29) 14.9* 11.7* 20.6 16.8Obese (BMI 30 or higher) 8.1* 5.9* 12.6 7.7*Special needs, impairments, and health conditionsHas special health care needs8 22.4* 19.8* 26.9 18.2*Receives special education or early intervention services9 9.0* 7.6* 11.2 6.0*Has impairment requiring special equipment 1.3 1.4 1.5 †Has impairment limiting ability to crawl, walk, run, or play9 1.9* 1.3* 3.0 †Has impairment limiting ability to crawl, walk, run, or play that is expected to last 12 or more months9 1.7* 1.0* 2.7 †Ever been told he or she has selected conditionsADHD or ADD10 8.9* 7.8* 10.8 5.2*Asthma 13.4* 12.3* 15.9 10.8*Autism10 2.2 2.1 2.5 †Cerebral palsy9 0.2 † 0.4 –Congenital heart disease9 † † † †Diabetes 0.2 † † †Down syndrome9 † † † –Intellectual disability9 0.9* 0.6* 1.4 †Other developmental delay9 3.9* 3.3* 5.3 †
MACStatsMACStats Section 5

MA
CStats: Medicaid and CH
IP Data Book
119
Section 5: Beneficiary Health, Service U
se, and Access to Care
MACStats Section 5
EXHIBIT 39. (continued)Notes: FPL is federal poverty level. SSI is Supplemental Security Income. WIC is Supplemental Nutrition Program for Women, Infants, and Children. ADHD is attention deficit hyperactivity disorder. ADD is attention deficit disorder. Percentage calculations for each item in the exhibit exclude individuals with missing and unknown values. The individual components listed under the subcategories are not always mutually exclusive and may not sum to 100 percent. Standard errors are available online in the Excel version of this exhibit at https://www.macpac.gov/publication/coverage-demographic-and-health-characteristics-of-non-institutionalized-individuals-age-0-18-by-primary-source-of-health-coverage/. Due to differences in methodology (such as the wording of questions, length of recall periods, and prompts or probes used to elicit responses), estimates obtained from different survey data sources will vary. For example, the National Health Interview Survey (NHIS) is known to produce higher estimates of service use than the Medical Expenditures Panel Survey (MEPS). For purposes of comparing groups of individuals (as in this exhibit), the NHIS provides the most recent information available. For other purposes, such as measuring levels of use relative to a particular benchmark or goal, it may be appropriate to consult estimates from MEPS or another source.
* Difference from Medicaid or CHIP is statistically significant at the 0.05 level.
† Estimate is unreliable because it has a relative standard error greater than or equal to 30 percent.
– Dash indicates zero.1 Total includes all non-institutionalized children under age 19, regardless of coverage source. In this exhibit, the following hierarchy was used to assign individuals with multiple coverage sources to a primary source: Medicare, private, Medicaid and CHIP, other, uninsured. Not separately shown are the estimates for those covered by Medicare (generally children with end-stage renal disease), any type of military health plan, or other federal government-sponsored programs. Coverage source is defined as of the time of the survey interview. Because an individual may have multiple coverage sources or changes over time, responses to survey questions may reflect characteristics or experiences associated with a coverage source other than the one assigned in this exhibit.2 Private health insurance coverage excludes plans that paid for only one type of service, such as accidents or dental care.3 Medicaid or CHIP also includes persons covered by other state-sponsored health plans.4 Individuals were defined as uninsured if they did not have any private health insurance, Medicaid, CHIP, Medicare, state- or other government-sponsored health plan, or military plan. Individuals were also defined as uninsured if they had only Indian Health Service coverage or had only a private plan that paid for one type of service, such as accidents or dental care.5 Due to the fact that a hierarchy was used in this exhibit to assign individuals with multiple coverage sources to a primary source (see note 1), the Medicaid and CHIP percentages shown in this row exclude individuals who also have Medicare (which is rare for children) or private coverage. Components do not sum to 100 percent because not all coverage sources are shown.6 Characteristic is listed under demographics because low income is one of the criteria for SSI eligibility. However, SSI receipt is also an indicator of disability. For a child to be eligible for SSI, he or she must have a medically determinable physical or mental impairment that results in marked and severe functional limitations and that is generally expected to last at least 12 months or to result in death.7 Survey information is limited to children age 12 or older.8 Due in part to changes in the 2011 NHIS questionnaire as well as other methodological changes, the definition of children with special health care needs differs slightly from the definition MACPAC used in versions prior to 2016. Under the children with special health care needs definition applied here, a child must have at least one diagnosed or parent-reported condition expected to be an ongoing health condition and also must meet at least one of the criteria related to elevated service use or elevated need, including reported unmet need for care. For more information on the methods used to identify children with special health care needs, see https://www.macpac.gov/macstats/data-sources-and-methods/.9 Survey information is limited to children age 0–17.10 Survey information is limited to children age 2–17.
Source: MACPAC, 2018, analysis of NHIS data.
MACStats Section 5

Decem
ber 2018120
Section 5: Beneficiary Health, Service U
se, and Access to Care
EXHIBIT 40. Use of Care among Non-Institutionalized Individuals Age 0–18 by Primary Source ofHealth Coverage, 2017, NHIS Data
MACStats Section 5
CharacteristicsPrimary coverage source at time of interview1
Total Private2 Medicaid or CHIP3 Uninsured4
Total (percent distribution across coverage sources)5 100.0% 55.3% 35.4% 5.1%Contact with health care professionals (past 12 months)Number of times saw a doctor or other health professional, excluding dental visits and inpatient hospital stays
None 8.3 6.3* 8.4 29.6*At least 1 91.7 93.7* 91.6 70.4*
1 24.2 23.9 24.6 27.72–3 38.1 39.5 36.8 29.8*4 or more 29.4 30.3 30.2 12.9*
Saw selected health professionalGeneral doctor 83.9 87.2* 82.3 58.8*General doctor, nurse practitioner, physician assistant, midwife, or obstetrician-gynecologist 85.9 89.3* 84.2 61.3*Medical specialist 14.8 16.4* 13.5 7.0*Eye doctor 27.7* 30.3* 24.5 23.8Mental health professional6 9.0* 8.5* 10.3 3.3*Doctor, for emotional or behavioral problem7 5.3* 4.5* 7.1 † Dentist8 81.2* 84.8* 78.9 58.6*Any health professional, excluding dental9 90.2* 93.0* 88.3 72.4*Any health professional, including dental 96.8 98.1* 96.6 83.7*
Had at least 1 overnight hospital stay10 4.7 4.4 5.4 † Received care at home 0.9 0.7* 1.3 † Receipt of appropriate care (past 12 months)Had well-child checkup7 85.2 87.8* 85.3 56.2*Had more than 15 office or clinic visits 2.5 2.2 2.8 †Number of emergency room visits
None 83.0* 87.6* 76.5 85.5*At least 1 17.0* 12.4* 23.5 14.5*
1 11.8* 9.8* 14.1 12.12–3 3.9* 2.2* 7.0 † 4 or more 1.2* 0.4* 2.5 †
Had at least 1 emergency room visit, and most recent visit was for a serious health problem 12.0* 9.0* 16.1 10.4*

MA
CStats: Medicaid and CH
IP Data Book
121
Section 5: Beneficiary Health, Service U
se, and Access to Care
MACStats Section 5
EXHIBIT 40. (continued)
Notes: NHIS is National Health Interview Survey. Percentage calculations for each item in the exhibit exclude individuals with missing and unknown values. The individual components listed under the subcategories are not always mutually exclusive and may not sum to 100 percent. Standard errors are available in the Excel version of this exhibit at https://www.macpac.gov/publication/use-of-care-among-non-institutionalized-individuals-age-0-18-by-primary-source-of-health-coverage-data-from-national-health-interview-survey/. Due to differences in methodology (such as the wording of questions, length of recall periods, and prompts or probes used to elicit responses), estimates obtained from different survey data sources will vary. For example, the NHIS is known to produce higher estimates of service use than the Medical Expenditures Panel Survey (MEPS). For purposes of comparing groups of individuals (as in this exhibit), the NHIS provides the most recent information available. For other purposes, such as measuring levels of use relative to a particular benchmark or goal, it may be appropriate to consult estimates from MEPS or another source.
* Difference from Medicaid or CHIP is statistically significant at the 0.05 level.
† Estimate is unreliable because it has a relative standard error greater than or equal to 30 percent.
– Dash indicates zero; 0.0% indicates an amount less than 0.05% that rounds to zero.1 Total includes all non-institutionalized children under age 19, regardless of coverage source. In this exhibit, the following hierarchy was used to assign individuals with multiple coverage sources to a primary source: Medicare, private, Medicaid and CHIP, other, uninsured. Not separately shown are the estimates for those covered by Medicare (generally children with end-stage renal disease), any type of military health plan, or other federal government-sponsored programs. Coverage source is defined as of the time of the survey interview. Because an individual may have multiple coverage sources or changes over time, responses to survey questions may reflect characteristics or experiences associated with a coverage source other than the one assigned in this exhibit.2 Private health insurance coverage excludes plans that paid for only one type of service, such as accidents or dental care.3 Medicaid or CHIP also includes persons covered by other state-sponsored health plans.4 Individuals were defined as uninsured if they did not have any private health insurance, Medicaid, CHIP, Medicare, state- or other government-sponsored health plan, or military plan. Individuals were also defined as uninsured if they had only Indian Health Service coverage or had only a private plan that paid for one type of service, such as accidents or dental care.5 Due to the fact that a hierarchy was used in this exhibit to assign individuals with multiple coverage sources to a primary source (see note 1), the Medicaid and CHIP percentages shown in this row exclude individuals who also have Medicare (which is rare for children) or private coverage. Components do not sum to 100 percent because not all coverage sources are shown.6 Survey information is limited to children age two or older.7 Survey information is limited to children age 0–17.8 Survey information is limited to children age one or older.9 Any health professional includes general doctor, nurse practitioner, physician assistant, midwife, obstetrician-gynecologist, medical specialist, eye doctor, mental health professional, doctor for emotional or behavioral problem, therapist, chiropractor, or podiatrist.10 Includes stays for newborns.
Source: MACPAC, 2018, analysis of NHIS data.
MACStats Section 5

Decem
ber 2018122
Section 5: Beneficiary Health, Service U
se, and Access to Care
MACStatsMACStats Section 5
EXHIBIT 41. Use of Care among Non-Institutionalized Individuals Age 0–18 by Primary Source ofHealth Coverage, 2016, MEPS Data
CharacteristicsPrimary coverage source at time of most recent interview1
Total Private2 Medicaid or CHIP3 Uninsured4
Total (percent distribution across coverage sources)5 100.0% 54.0% 36.9% 7.1%Contact with health care professionals (past 12 months)Number of office-based visits (to a doctor or other health professional), excluding dental visits and inpatient hospital stays
None 27.3* 22.4* 31.3 44.5*At least 1 72.7* 77.6* 68.7 55.5*
1 23.2 22.6 24.5 23.12–3 25.3 26.9* 23.8 18.94 or more 24.3* 28.1* 20.5 13.5*
Had at least 1 overnight hospital stay 2.3 2.0 2.8 † Received care at home 1.0* 0.7* 1.7 † Saw a general dentist 44.0* 48.8* 39.8 27.3*Saw an orthodontist 9.5* 12.3* 5.4 8.0Receipt of appropriate care (past 12 months)Had at least 1 dental check-up6 85.2 86.5 85.0 76.5*Had more than 15 office-based or hospital outpatient visits 2.8 2.7 3.1 † Number of emergency room visits
None 87.9* 89.8* 85.4 89.1At least 1 12.1* 10.2* 14.6 10.9
1 9.8 8.9* 11.0 9.12–3 2.1* 1.2* 3.3 † 4 or more 0.2 † † †
Notes: MEPS is Medical Expenditure Panel Survey. Percentage calculations for each item in the exhibit exclude individuals with missing and unknown values. Standard errors are available in the Excel version of this exhibit at https://www.macpac.gov/publication/use-of-care-among-non-institutionalized-individuals-age-0-18-by-primary-source-of-health-coverage-data-from-medical-expenditures-panel-survey/. Due to differences in methodology (such as the wording of questions, length of recall periods, and prompts or probes used to elicit responses), estimates obtained from different survey data sources will vary. For example, the National Health Interview Survey (NHIS) is known to produce higher estimates of service use than MEPS. For purposes of comparing groups of individuals, the NHIS provides the most recent information available. For other purposes, such as measuring levels of use relative to a particular benchmark or goal, it may be appropriate to consult estimates from MEPS or another source.
* Difference from Medicaid or CHIP is statistically significant at the 0.05 level.
† Estimate is unreliable because it has a relative standard error greater than or equal to 30 percent.

MA
CStats: Medicaid and CH
IP Data Book
123
Section 5: Beneficiary Health, Service U
se, and Access to Care
MACStats Section 5
EXHIBIT 41. (continued)
MACStats Section 5
1 Total includes all non-institutionalized children under age 19, regardless of coverage source. In this exhibit, the following hierarchy was used to assign individuals with multiple coverage sources to a primary source: Medicare, private, Medicaid or CHIP, other, uninsured. Not separately shown are the estimates for those covered by Medicare (generally children with end-stage renal disease), any type of military health plan, or other federal government-sponsored programs. Coverage source is defined as of the time of the most recent survey interview. Because an individual may have multiple coverage sources or changes over time, responses to survey questions may reflect characteristics or experiences associated with a coverage source other than the one assigned in this exhibit.2 Private health insurance coverage excludes plans that paid for only one type of service, such as accidents or dental care.3 Medicaid or CHIP also includes persons covered by other state-sponsored health plans.4 Individuals were defined as uninsured if they did not have any private health insurance, Medicaid, CHIP, Medicare, state- or other government-sponsored health plan, or military plan. Individuals were also defined as uninsured if they had only Indian Health Service coverage or only a private plan that paid for one type of service, such as accidents or dental care.5 Due to the fact that a hierarchy was used in this exhibit to assign individuals with multiple coverage sources to a primary source (see note 1), the Medicaid or CHIP percentages shown in this row exclude individuals who also have Medicare (which is rare for children) or private coverage. Components do not sum to 100 percent because not all coverage sources are shown.6 Prior to the December 2016 databook, the characteristic was previously "Had cleaning, prophylaxis, or polishing," which was restricted to those who had a dental event in that year. Due to the change in the characteristic, these estimates should not be compared to versions of the exhibit published prior to the December 2016 databook.
Source: MACPAC, 2018, analysis of MEPS data.

Decem
ber 2018124
Section 5: Beneficiary Health, Service U
se, and Access to Care
Health Coverage, 2017
EXHIBIT 42. Measures of Access to Care among Non-Institutionalized Individuals Age 0–18 by Primary Source of
MACStats Section 5
CharacteristicsPrimary coverage source at time of interview1
Total Private2 Medicaid or CHIP3 Uninsured4
Total (percent distribution across coverage sources)5 100.0% 55.3% 35.4% 5.1%Connection to the health care system (past 12 months)Has a usual source of care6 95.2 97.2* 95.2 71.3*Had the same usual source of medical care 12 months ago 87.7 90.1* 87.2 65.2*Had trouble finding a doctor or was told that coverage or new patients were not accepted7 4.1* 2.9* 5.8 5.5Timeliness of care (past 12 months)Delayed medical care due to any access barrier indicated below 11.1* 8.4* 14.4 21.2*
Delayed because of costs 2.5* 1.8 1.8 15.7*Delayed for provider-related reasons8 8.5* 7.0* 11.4 8.0Delayed due to lack of transportation 1.6* † 3.3 †
Unmet need for selected types of care due to costMedical care 1.4 0.8 1.1 10.6*Mental health care or counseling9 1.1 1.0 1.2 † Dental care9 4.5 2.8* 4.6 21.0*Prescription drugs 1.9 1.1* 2.2 7.8*Eyeglasses9 1.9 1.0* 2.1 8.2*Specialist care 1.4 1.0* 1.7 † Follow-up care 1.4 0.8* 1.6 6.4*
Notes: Percentage calculations for each item in the table exclude individuals with missing and unknown values. The individual components listed under the subcategories are not mutually exclusive and may not sum to 100 percent. Standard errors are available in the Excel version of this exhibit athttps://www.macpac.gov/publication/measures-of-access-to-care-for-non-institutionalized-children-by-source-of-health-coverage/. Due to differences in methodology (such as the wording of questions, length of recall periods, and prompts or probes used to elicit responses), estimates obtained from different survey data sources will vary. For example, the National Health Interview Survey (NHIS) is known to produce higher estimates of service use than the Medical Expenditure Panel Survey (MEPS). For purposes of comparing groups of individuals (as in this exhibit), the NHIS provides the most recent information available. For other purposes, such as measuring levels of use relative to a particular benchmark or goal, it may be appropriate to consult estimates from MEPS or another source.
* Difference from Medicaid or CHIP is statistically significant at the 0.05 level.
† Estimate is unreliable because it has a relative standard error greater than or equal to 30 percent.

MA
CStats: Medicaid and CH
IP Data Book
125
Section 5: Beneficiary Health, Service U
se, and Access to Care
MACStats Section 5
EXHIBIT 42. (continued)
1 Total includes all non-institutionalized children under age 19, regardless of coverage source. In this exhibit, the following hierarchy was used to assign individuals with multiple coverage sources to a primary source: Medicare, private, Medicaid and CHIP, other, uninsured. Not separately shown are the estimates for those covered by Medicare (generally children with end-stage renal disease), any type of military health plan, or other federal government-sponsored programs. Coverage source is defined as of the time of the survey interview. Because an individual may have multiple coverage sources or changes over time, responses to survey questions may reflect characteristics or experiences associated with a coverage source other than the one assigned in this exhibit.2 Private health insurance coverage excludes plans that paid for only one type of service, such as accidents or dental care.3 Medicaid or CHIP also includes persons covered by other state-sponsored health plans.4 Individuals were defined as uninsured if they did not have any private health insurance, Medicaid, CHIP, Medicare, state- or other government-sponsored health plan, or military plan. Individuals were also defined as uninsured if they had only Indian Health Service coverage or had only a private plan that paid for one type of service, such as accidents or dental care.5 Due to the fact that a hierarchy was used in this exhibit to assign individuals with multiple coverage sources to a primary source (see note 1), the Medicaid and CHIP percentages shown in this row exclude individuals who also have Medicare (which is rare for children) or private coverage. Components do not sum to 100 percent because not all coverage sources are shown.6 Excludes emergency room.7 Parent reported one of these barriers in the past 12 months: trouble finding a doctor or provider, doctor’s office or clinic did not accept child’s insurance coverage, or office or clinic did not accept the child as a new patient.8 Includes any of the following: parent could not get an appointment, had to wait too long to see doctor, could not go when open, could not get through on phone.9 Survey information is limited to children age two or older.
Source: MACPAC, 2018, analysis of NHIS data.
MACStats Section 5

Decem
ber 2018126
Section 5: Beneficiary Health, Service U
se, and Access to Care
EXHIBIT 43. Coverage, Demographic, and Health Characteristics of Non-Institutionalized Individuals Age 19–64 byPrimary Source of Health Coverage, 2017
Characteristic
Primary coverage source at time of interview1
Total Medicare Private2Medicaid or CHIP3 Uninsured4
Total (percent distribution across coverage sources)5 100.0% 4.1% 69.3% 11.0% 12.6%CoverageLength of time with any coverage during yearFull year 84.0* 98.7* 95.4* 90.3 –Part year 7.4* 1.3* 4.6* 9.7 25.7*No coverage during year 8.6* – – – 74.3*DemographicsAge19–25 14.8* 3.3* 13.9* 20.5 18.626–44 41.7* 15.3* 41.2* 46.3 49.545–54 21.8* 26.2* 22.8* 18.2 18.155–64 21.7* 55.1* 22.1* 15.0 13.7GenderMale 49.0* 47.0* 50.0* 37.4 53.1*Female 51.0* 53.0* 50.0* 62.6 46.9*RaceHispanic 17.7* 13.8* 12.9* 26.1 38.4*White, non-Hispanic 61.7* 63.1* 68.1* 44.7 40.6Black, non-Hispanic 12.7* 18.0 10.7* 20.5 14.5*Other non-white, non-Hispanic 7.9 5.2* 8.3* 8.7 6.4Marital statusMarried 52.9* 36.4* 59.9* 28.3 40.1*Widowed 1.8* 5.4* 1.4* 2.7 1.6*Divorced or separated 10.8* 26.2* 8.8* 15.4 11.7*Living with partner 9.4* 5.3* 7.7* 15.5 15.5Never married 25.1* 26.7* 22.2* 38.0 31.0*Family incomeLess than 138 percent FPL 18.8* 49.4 7.6* 58.4 37.1*Has income in ranges below
Less than 100 percent FPL 12.4* † 4.7* 40.5 24.9*100–199 percent FPL 16.0* 54.4 9.3* 34.7 29.6*200–399 percent FPL 27.3* † 28.1* 19.3 30.3*
MACStats Section 5
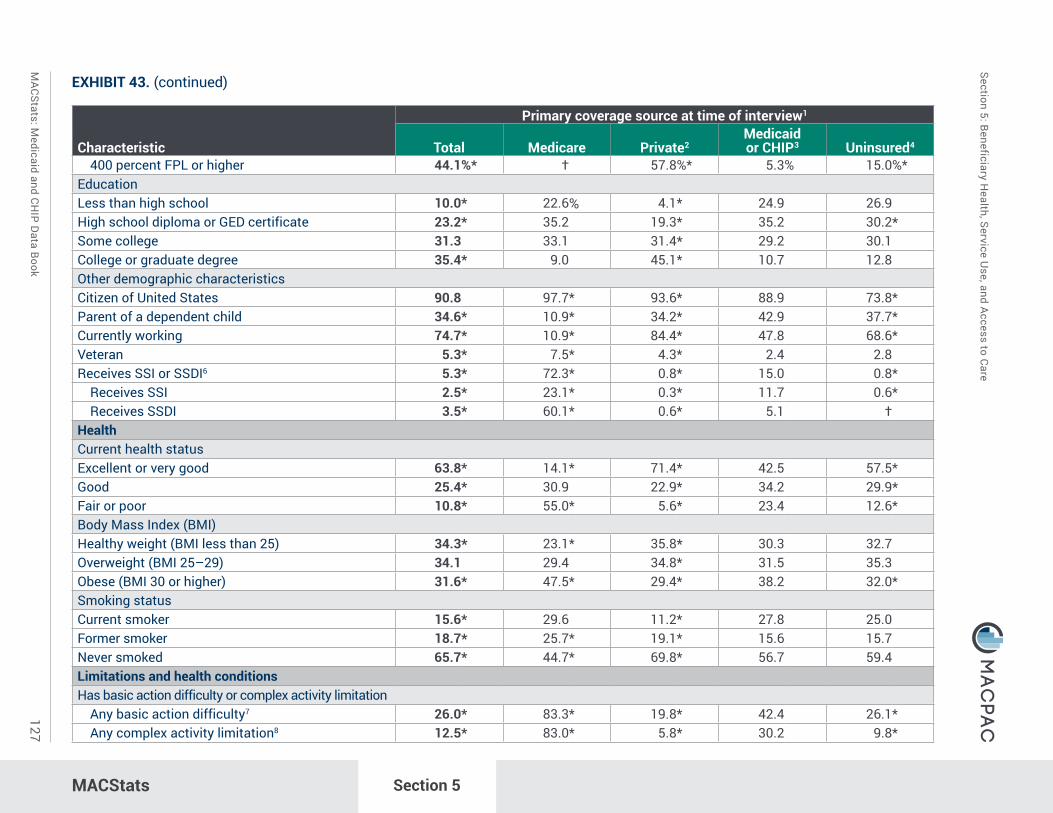
MA
CStats: Medicaid and CH
IP Data Book
127
Section 5: Beneficiary Health, Service U
se, and Access to Care
MACStats Section 5
insert exhibit here
EXHIBIT 43. (continued)
Characteristic
Primary coverage source at time of interview1
Total Medicare Private2Medicaid or CHIP3 Uninsured4
400 percent FPL or higher 44.1%* † 57.8%* 5.3% 15.0%*EducationLess than high school 10.0* 22.6% 4.1* 24.9 26.9High school diploma or GED certificate 23.2* 35.2 19.3* 35.2 30.2*Some college 31.3 33.1 31.4* 29.2 30.1College or graduate degree 35.4* 9.0 45.1* 10.7 12.8Other demographic characteristicsCitizen of United States 90.8 97.7* 93.6* 88.9 73.8*Parent of a dependent child 34.6* 10.9* 34.2* 42.9 37.7*Currently working 74.7* 10.9* 84.4* 47.8 68.6*Veteran 5.3* 7.5* 4.3* 2.4 2.8Receives SSI or SSDI6 5.3* 72.3* 0.8* 15.0 0.8*
Receives SSI 2.5* 23.1* 0.3* 11.7 0.6*Receives SSDI 3.5* 60.1* 0.6* 5.1 †
HealthCurrent health statusExcellent or very good 63.8* 14.1* 71.4* 42.5 57.5*Good 25.4* 30.9 22.9* 34.2 29.9*Fair or poor 10.8* 55.0* 5.6* 23.4 12.6*Body Mass Index (BMI)Healthy weight (BMI less than 25) 34.3* 23.1* 35.8* 30.3 32.7Overweight (BMI 25–29) 34.1 29.4 34.8* 31.5 35.3Obese (BMI 30 or higher) 31.6* 47.5* 29.4* 38.2 32.0*Smoking statusCurrent smoker 15.6* 29.6 11.2* 27.8 25.0Former smoker 18.7* 25.7* 19.1* 15.6 15.7Never smoked 65.7* 44.7* 69.8* 56.7 59.4Limitations and health conditionsHas basic action difficulty or complex activity limitation
Any basic action difficulty7 26.0* 83.3* 19.8* 42.4 26.1*Any complex activity limitation8 12.5* 83.0* 5.8* 30.2 9.8*
MACStats Section 5

Decem
ber 2018128
Section 5: Beneficiary Health, Service U
se, and Access to Care
MACStats Section 5
insert exhibit here
EXHIBIT 43. (continued)
Characteristic
Primary coverage source at time of interview1
Total Medicare Private2Medicaid or CHIP3 Uninsured4
Either one 27.7%* 90.8%* 20.9%* 46.1% 27.5%*Has functional limitation9 10.9* 62.4* 6.3* 21.3 9.6*Has difficulty walking without equipment 3.2* 31.0* 1.1* 7.6 1.7*Has health condition requiring special equipment 4.2* 32.2* 2.3* 8.1 7.1Needs help with any of the following ADLs
Personal care 1.5* 14.6* 0.3* 5.1 † Bathing 0.9* 8.6* 0.2* 3.0 † Eating 0.3* 3.6* † 1.0 † Transferring 0.7* 7.7* † 2.2 † Toileting 0.5* 5.1* † 1.5 † Getting around in home 0.6* 6.8* † 1.2 †
Number of ADLs needing assistanceNone 98.7* 87.5* 99.8* 95.8 99.5*1–2 0.6* 5.3* 0.1* 2.1 † 3–4 0.4* 3.3* † 1.3 † 5–6 0.3 4.0 † † †
Unable to work now due to health problem 7.2* 66.7* 2.1* 19.1 5.0*Limited in amount or kind of work due to health 10.5* 78.7* 4.2* 26.5 7.6*Lost all natural teeth 4.1* 15.3* 3.2* 6.4 4.3*Has depressed or anxious feelings10 3.7* 16.3* 1.8* 8.8 5.3*Currently pregnant11 2.7* † 2.6* 4.3 † Ever been told he or she has selected conditions
Hypertension 23.3* 54.2* 21.7* 27.9 17.6*Coronary heart disease 2.0 11.1* 1.5* 2.5 1.1*Heart attack 1.7* 10.6* 1.0* 2.8 1.5*Stroke 1.8* 11.2* 1.0* 3.8 1.4*Cancer 5.5 13.7* 5.5* 5.3 2.7*Diabetes 7.3* 27.2* 5.8* 10.2 6.4*Arthritis 17.3* 51.6* 15.7* 20.3 10.5*Asthma 13.9* 21.9 13.3* 18.8 10.4*
MACStats Section 5

MA
CStats: Medicaid and CH
IP Data Book
129
Section 5: Beneficiary Health, Service U
se, and Access to Care
MACStats Section 5
insert exhibit here
EXHIBIT 43. (continued)
Characteristic
Primary coverage source at time of interview1
Total Medicare Private2Medicaid or CHIP3 Uninsured4
Chronic bronchitis (past 12 months) 3.1%* 11.2%* 2.4%* 5.1% 2.7%*Liver condition (past 12 months) 1.8* 6.4* 1.3* 3.4 1.6*Weak or failing kidneys (past 12 months) 1.2* 7.7* 0.7* 2.6 1.2*
Notes: FPL is federal poverty level. GED is General Equivalence Diploma. SSI is Supplemental Security Income. SSDI is Social Security Disability Insurance. ADL is activity of daily living. Percentage calculations for each item in the exhibit exclude individuals with missing and unknown values. The individual components listed under the subcategories are not always mutually exclusive and may not sum to 100 percent. Standard errors are available online in the Excel version of this exhibit at https://www.macpac.gov/publication/coverage-demographic-and-health-characteristics-of-non-institutionalized-individuals-age-19-64-by-primary-source-of-health-coverage/. Due to differences in methodology (such as the wording of questions, length of recall periods, and prompts or probes used to elicit responses), estimates obtained from different survey data sources will vary. For example, the National Health Interview Survey (NHIS) is known to produce higher estimates of service use than the Medical Expenditures Panel Survey (MEPS). For purposes of comparing groups of individuals (as in this exhibit), the NHIS provides the most recent information available. For other purposes, such as measuring levels of use relative to a particular benchmark or goal, it may be appropriate to consult estimates from MEPS or another source.
* Difference from Medicaid or CHIP is statistically significant at the 0.05 level.
† Estimate is unreliable because it has a relative standard error greater than or equal to 30 percent.
– Dash indicates zero.1 Total includes all non-institutionalized individuals age 19–64, regardless of coverage source. In this exhibit, the following hierarchy was used to assign individuals with multiple coverage sources to a primary source: Medicare, private, Medicaid or CHIP, other, uninsured. Not separately shown are the estimates for those covered by any type of military health plan or other federal government-sponsored programs. Coverage source is defined as of the time of the survey interview. Because an individual may have multiple coverage sources or changes over time, responses to survey questions may reflect characteristics or experiences associated with a coverage source other than the one assigned in this exhibit.2 Private health insurance coverage excludes plans that paid for only one type of service, such as accidents or dental care.3 Medicaid or CHIP also includes persons covered by other state-sponsored health plans.4 Individuals were defined as uninsured if they did not have any private health insurance, Medicaid, CHIP, Medicare, state- or other government-sponsored health plan, or military plan. Individuals were also defined as uninsured if they had only Indian Health Service coverage or only a private plan that paid for one type of service, such as accidents or dental care.5 Due to the fact that a hierarchy was used in this exhibit to assign individuals with multiple coverage sources to a primary source (see note 1), the Medicaid or CHIP percentages shown in this row exclude individuals who also have Medicare or private coverage. Components do not sum to 100 percent because not all coverage sources are shown.6 Characteristic is listed under demographics because low income is one of the criteria for SSI eligibility, and the inability to engage in a specified level of work activity and earnings (referred to as substantial gainful activity in federal statute) is one of the criteria for SSDI eligibility. However, SSI or SSDI receipt is also an indicator of disability. For an adult to be eligible for SSI or SSDI, he or she must have a medically determinable physical or mental impairment that is expected to last at least 12 months or to result in death.
MACStats Section 5

Section 5: Beneficiary Health, Service U
se, and Access to Care
EXHIBIT 43. (continued)
7 Captures limitations or difficulties in movement (walking, standing, bending or kneeling, reaching overhead, and using the hands and fingers) and limitations or difficulties in sensory, emotional (i.e., feelings that interfere with accomplishing daily activities), and mental (i.e., difficulties with remembering or experiencing confusion) functioning that are associated with some health problems.8 Reflects a limitation in the tasks and organized activities that, when executed, make up numerous social roles, such as working, attending school, or maintaining a household. Adults are defined as having a complex activity limitation if they have one or more of the following types of limitations: self-care limitation, social limitation, or work limitation.9 Functional limitation is defined as "very difficult" or "cannot do" for the following activities: grasp small objects; reach above one's head; sit more than 2 hours; lift or carry 10 pounds; climb a flight of stairs; push a heavy object; walk one-quarter of a mile; stand more than 2 hours; stoop, bend, or kneel. These estimates should not be compared to the 2014 estimates published in the December 2015 data book, which also included responses of "only a little" and "somewhat difficult."10 These estimates should not be compared to the 2014 estimates published in the December 2015 data book due to a change in the characteristic's definition.11 Information is limited to women age 19–44.
Source: MACPAC, 2018, analysis of NHIS data.
MACStats
Decem
ber 2018130
MACStats Section 5

MA
CStats: Medicaid and CH
IP Data Book
131
Section 5: Beneficiary Health, Service U
se, and Access to Care
MACStats Section 5
EXHIBIT 44. Use of Care among Non-Institutionalized Individuals Age 19–64 by Primary Source of Health Coverage, 2017, NHIS Data
CharacteristicsPrimary coverage source at time of interview1
Total Medicare Private2 Medicaid or CHIP3 Uninsured4
Total (percent distribution across coverage sources)5 100.0% 4.1% 69.3% 11.0% 12.6%Contact with health care professionals (past 12 months)Number of times saw a doctor or other health professional, excluding dental visits and inpatient hospital stays
None 19.1 4.4* 15.2 17.0 48.0*At least 1 80.9 95.6* 84.8 83.0 52.0*
1 20.7* 6.0* 22.5* 17.7 18.62–3 27.5* 17.8* 30.3* 22.5 18.4*4 or more 32.7* 71.8* 31.9* 42.8 15.0*
Saw selected health professionalGeneral doctor 66.5 84.9* 70.3 67.4 37.1*General doctor, nurse practitioner, physician assistant, midwife, or obstetrician-gynecologist 74.7 89.5* 78.8* 75.5 45.2*Medical specialist 23.4 51.9* 24.3 22.6 9.0*Eye doctor 38.2* 43.7* 43.0* 28.6 18.5*Mental health professional 9.9* 21.0 8.3* 18.3 5.8*Dentist 63.6* 47.0 72.0* 50.8 33.6*Any health professional, excluding dental6 82.7 94.0* 86.7* 81.9 55.8*Any health professional, including dental 90.0* 96.4* 94.0* 87.5 66.0*
Had at least 1 overnight hospital stay 7.2* 21.6* 5.8* 12.1 5.9*Received care at home 1.3* 10.3* 0.8* 2.5 † Receipt of appropriate care (past 12 months)Had cholesterol checked7
All individuals 65.1 85.1* 68.5* 64.4 38.2*Men age 35–64 70.9 86.0* 73.8 73.0 40.5*Individuals with elevated risk of cardiac disease7, 8 73.9* 88.9* 79.1* 69.6 44.6*
Had flu shotAll individuals 37.5* 49.6* 40.7* 32.3 17.6*
MACStats Section 5

Decem
ber 2018132
Section 5: Beneficiary Health, Service U
se, and Access to Care
insert exhibit here
MACStats Section 5
EXHIBIT 44. (continued)
CharacteristicsPrimary coverage source at time of interview1
Total Medicare Private2 Medicaid or CHIP3 Uninsured4
Individuals age 50–64 45.5% 52.3%* 47.4% 44.0% 23.4%*Had any test for colorectal cancer (age 50–64) 25.0 33.5* 25.2 25.4 10.8*Had Pap smear or test for cervical cancer (women age 21–60) 54.0 39.3* 58.0* 53.1 36.1*Had professional counseling about smoking (current smokers) 51.7* 81.4* 52.8* 60.3 27.8*Had more than 15 office or clinic visits 5.2* 17.7* 4.6* 8.1 1.9*Number of emergency room visits
None 82.2* 61.1* 86.1* 67.8 80.8*At least 1 17.8* 38.9* 13.9* 32.2 19.2*
1 11.5* 19.6 10.0* 17.2 11.6*2–3 4.6* 11.7 3.0* 10.1 5.4*4 or more 1.8* 7.6* 0.9* 4.9 2.2*
Had at least 1 emergency room visit, and most recent visit was for a serious health problem 14.1* 34.3* 11.0* 25.6 14.3*
Notes: NHIS is National Health Interview Survey. Percentage calculations for each item in the exhibit exclude individuals with missing and unknown values. The individual components listed under the subcategories are not always mutually exclusive and may not sum to 100 percent. Standard errors are available online in the Excel version of this exhibit at https://www.macpac.gov/publication/use-of-care-among-non-institutionalized-individuals-age-19-64-by-primary-source-of-health-coverage-data-from-national-health-interview-survey/. Due to differences in methodology (such as the wording of questions, length of recall periods, and prompts or probes used to elicit responses), estimates obtained from different survey data sources will vary. For example, the NHIS is known to produce higher estimates of service use than the Medical Expenditures Panel Survey (MEPS). For purposes of comparing groups of individuals (as in this exhibit), the NHIS provides the most recent information available. For other purposes, such as measuring levels of use relative to a particular benchmark or goal, it may be appropriate to consult estimates from MEPS or another source.
* Difference from Medicaid or CHIP is statistically significant at the 0.05 level.
† Estimate is unreliable because it has a relative standard error greater than or equal to 30 percent.1 Total includes all non-institutionalized individuals age 19–64, regardless of coverage source. In this exhibit, the following hierarchy was used to assign individuals with multiple coverage sources to a primary source: Medicare, private, Medicaid or CHIP, other, uninsured. Not separately shown are the estimates for those covered by any type of military health plan or other federal government-sponsored programs. Coverage source is defined as of the time of the survey interview. Because an individual may have multiple coverage sources or changes over time, responses to survey questions may reflect characteristics or experiences associated with a coverage source other than the one assigned in this exhibit.2 Private health insurance coverage excludes plans that paid for only one type of service, such as accidents or dental care.
MACStats Section 5

MA
CStats: Medicaid and CH
IP Data Book
133
Section 5: Beneficiary Health, Service U
se, and Access to Care
MACStats Section 5
EXHIBIT 44. (continued)
3 Medicaid or CHIP also includes persons covered by other state-sponsored health plans.4 Individuals were defined as uninsured if they did not have any private health insurance, Medicaid, CHIP, Medicare, state- or other government-sponsored health plan, or military plan. Individuals were also defined as uninsured if they had only Indian Health Service coverage or had only a private plan that paid for one type of service, such as accidents or dental care.5 Due to the fact that a hierarchy was used in this exhibit to assign individuals with multiple coverage sources to a primary source (see note 1), the Medicaid and CHIP percentages shown in this row exclude individuals who also have Medicare or private coverage. Components do not sum to 100 percent because not all coverage sources are shown.6 Any health professional includes general doctor, nurse practitioner, physician assistant, midwife, obstetrician-gynecologist, medical specialist, eye doctor, mental health professional, therapist, chiropractor, or podiatrist.7 These estimates should not be compared to the 2014 estimates published in the December 2015 data book due to a change in the screening questions for cholesterol, blood pressure, and diabetes. In 2014 only, the NHIS included additional blood pressure and cholesterol screening questions as part of the supplemental questions pertaining to the Million Hearts® Initiative. After 2014, the NHIS reverted back to the originial screening questions, so estimates should be comparable with years earlier than 2014.8 Individuals of any age or sex who report hypertension or diabetes, or who currently smoke.
Source: MACPAC, 2018, analysis of NHIS data.
MACStats Section 5

Decem
ber 2018134
Section 5: Beneficiary Health, Service U
se, and Access to Care
MACStats Section 5
EXHIBIT 45. Use of Care among Non-Institutionalized Individuals Age 19–64 by Primary Source of Health Coverage, 2016, MEPS Data
Characteristics
Primary coverage source at time of most recent interview1
Total Medicare Private2Medicaid or CHIP3 Uninsured4
Total (percent distribution across coverage sources)5 100.0% 3.8% 68.2% 10.6% 15.7%Contact with health care professionals (past 12 months)Number of office-based visits (to a doctor or other health professional), excluding dental visits and inpatient hospital stays
None 31.4 7.3* 26.8* 31.8 57.3*At least 1 68.6 92.7* 73.2* 68.2 42.7*
1 15.1 6.6* 15.8 14.7 14.32–3 18.9 16.8 20.8* 17.2 12.1*4 or more 34.6 69.2* 36.6 36.3 16.3*
Had at least 1 overnight hospital stay 5.6* 17.7* 4.5* 10.7 4.1*Received care at home 1.3* 14.1* 0.6* 2.5 † Saw a general dentist 35.5* 30.0* 42.5* 22.1 16.0*Saw an orthodontist 1.3 † 1.4 1.3 0.9Receipt of appropriate care (past 12 months)Had at least 1 dental check-up6 65.2* 46.5 73.7* 51.3 42.0*Had more than 15 office-based or hospital outpatient visits 8.2 24.8* 8.2 9.6 2.9*Number of emergency room visits
None 87.5* 66.4* 90.3* 76.7 88.1*At least 1 12.5* 33.6* 9.7* 23.3 11.9*
1 9.4* 19.2* 7.9* 15.7 9.0*2–3 2.6* 12.8* 1.5* 6.1 2.6*4 or more 0.5* 1.6 0.2* 1.5 †
Notes: MEPS is Medical Expenditure Panel Survey. Percentage calculations for each item in the exhibit exclude individuals with missing and unknown values. Standard errors are available in the Excel version of this exhibit at https://www.macpac.gov/publication/use-of-care-among-non-institutionalized-individuals-age-19-64-by-primary-source-of-health-coverage-data-from-medical-expenditures-panel-survey/. Due to differences in methodology (such as the wording of questions, length of recall periods, and prompts or probes used to elicit responses), estimates obtained from different survey data sources will vary. For example, the National Health Interview Survey (NHIS) is known to produce higher estimates of service use than MEPS. For purposes of comparing groups of individuals, the NHIS provides the most recent information available. For other purposes, such as measuring levels of use relative to a particular benchmark or goal, it may be appropriate to consult estimates from MEPS or another source.
* Difference from Medicaid or CHIP is statistically significant at the 0.05 level.
MACStats Section 5

MA
CStats: Medicaid and CH
IP Data Book
135
Section 5: Beneficiary Health, Service U
se, and Access to Care
MACStats Section 5
EXHIBIT 45. (continued)
† Estimate is unreliable because it has a relative standard error greater than or equal to 30 percent.1 Total includes all non-institutionalized individuals age 19–64, regardless of coverage source. In this exhibit, the following hierarchy was used to assign individuals with multiple coverage sources to a primary source: Medicare, private, Medicaid or CHIP, other, uninsured. Not separately shown are the estimates for those covered by any type of military health plan or other federal government-sponsored programs. Coverage source is defined as of the time of the most recent survey interview. Because an individual may have multiple coverage sources or changes over time, responses to survey questions may reflect characteristics or experiences associated with a coverage source other than the one assigned in this exhibit.2 Private health insurance coverage excludes plans that paid for only one type of service, such as accidents or dental care.3 Medicaid or CHIP also includes persons covered by other state-sponsored health plans.4 Individuals were defined as uninsured if they did not have any private health insurance, Medicaid, CHIP, Medicare, state- or other government-sponsored health plan, or military plan. Individuals were also defined as uninsured if they had only Indian Health Service coverage or only a private plan that paid for one type of service, such as accidents or dental care.5 Due to the fact that a hierarchy was used in this exhibit to assign individuals with multiple coverage sources to a primary source (see note 1), the Medicaid or CHIP percentages shown in this row exclude individuals who also have Medicare or private coverage. Components do not sum to 100 percent because not all coverage sources are shown.6 Prior to the December 2016 databook, the characteristic was previously "Had cleaning, prophylaxis, or polishing," which was restricted to those who had a dental event in that year. Due to the change in the characteristic, these estimates should not be compared to previously published versions of the exhibit prior to the December 2016 databook.
Source: MACPAC, 2018, analysis of MEPS data.
MACStats Section 5

Decem
ber 2018136
Section 5: Beneficiary Health, Service U
se, and Access to Care
MACStats Section 5
EXHIBIT 46. Measures of Access to Care among Non-Institutionalized Individuals Age 19–64 by Primary Source ofHealth Coverage, 2017
CharacteristicsPrimary coverage source at time of interview1
Total Medicare Private2 Medicaid or CHIP3 Uninsured4
Total (percent distribution across coverage sources)5 100.0% 4.1% 69.3% 11.0% 12.6%
Connection to the health care system (past 12 months)
Has a usual source of care6 83.6 94.4* 88.5* 84.6 50.3*Had the same usual source of medical care 12 months ago 75.4 86.9* 79.9* 75.3 45.6*Had trouble finding a doctor or was told that coverage or new patients were not accepted7 6.7* 9.3 5.5* 11.0 8.9
Timeliness of care (past 12 months)Delayed medical care due to any access barrier indicated below 20.0* 32.9* 16.0* 24.9 34.1*
Delayed because of costs 9.7 15.7* 6.6* 8.6 26.8*
Delayed for provider-related reasons8 12.0* 19.1 11.1* 16.6 11.0*
Delayed due to lack of transportation 1.9* 9.1* 0.7* 5.8 2.8*
Unmet need for selected types of care due to cost
Medical care 6.7 13.2* 3.5* 7.5 22.3*
Mental health care or counseling 2.5 5.7* 1.6* 3.4 5.8*
Dental care 11.8* 25.7* 7.0* 18.8 27.5*
Prescription drugs 6.6* 17.9* 3.7* 9.6 16.9*
Eyeglasses 6.5* 18.2* 3.7* 10.4 14.5*
Specialist care 4.8 11.4* 3.0* 6.0 12.3*
Follow-up care 3.9 8.2* 2.2* 4.3 12.1*
Notes: Percentage calculations for each item in the table exclude individuals with missing and unknown values. The individual components listed under the subcategories are not mutually exclusive and may not sum to 100 percent. Standard errors are available in the Excel version of this exhibit at https://www.macpac.gov/publication/measures-of-access-to-care-for-non-institutionalized-individuals-age-19-64-by-source-of-health-coverage/. Due to differences in methodology (such as the wording of questions, length of recall periods, and prompts or probes used to elicit responses), estimates obtained from different survey data
MACStats Section 5

MA
CStats: Medicaid and CH
IP Data Book
137
Section 5: Beneficiary Health, Service U
se, and Access to Care
MACStats Section 5
EXHIBIT 46. (continued)
sources will vary. For example, the National Health Interview Survey (NHIS) is known to produce higher estimates of service use than the Medical Expenditure Panel Survey (MEPS). For purposes of comparing groups of individuals (as in this exhibit), the NHIS provides the most recent information available. For other purposes, such as measuring levels of use relative to a particular benchmark or goal, it may be appropriate to consult estimates from MEPS or another source.
* Difference from Medicaid or CHIP is statistically significant at the 0.05 level.1 Total includes all non-institutionalized individuals age 19–64, regardless of coverage source. In this exhibit, the following hierarchy was used to assign individuals with multiple coverage sources to a primary source: Medicare, private, Medicaid or CHIP, other, uninsured. Not separately shown are the estimates for those covered by any type of military health plan or other federal government-sponsored programs. Coverage source is defined as of the time of the survey interview. Because an individual may have multiple coverage sources or changes over time, responses to survey questions may reflect characteristics or experiences associated with a coverage source other than the one assigned in this exhibit.2 Private health insurance coverage excludes plans that paid for only one type of service, such as accidents or dental care.3 Medicaid or CHIP also includes persons covered by other state-sponsored health plans.4 Individuals were defined as uninsured if they did not have any private health insurance, Medicaid, CHIP, Medicare, state- or other government-sponsored health plan, or military plan. Individuals were also defined as uninsured if they had only Indian Health Service coverage or had only a private plan that paid for one type of service, such as accidents or dental care.5 Due to the fact that a hierarchy was used in this exhibit to assign individuals with multiple coverage sources to a primary source (see note 1), the Medicaid and CHIP percentages shown in this row exclude individuals who also have Medicare or private coverage. Components do not sum to 100 percent because not all coverage sources are shown.6 Excludes emergency room.7 Individual reported one of these barriers in the past 12 months: trouble finding a doctor or provider, doctor’s office or clinic did not accept individual’s insurance coverage, or office or clinic did not accept the individual as a new patient.8 Includes any of the following: individual could not get an appointment, had to wait too long to see doctor, could not go when open, could not get through on phone.
Source: MACPAC, 2018, analysis of NHIS data.
MACStats Section 5


SECTION 6
Technical Guide to MACStats


MACStats: Medicaid and CHIP Data Book 141
Section 6: Technical Guide to MACStats
MAC
Stat
sSe
ctio
n 6
This technical guide provides supplementary information to help readers interpret the exhibits in this data book as well as understand the data sources and methods used. In addition, we explain why MACPAC’s statistics, particularly those on enrollment and spending, may differ from each other or from those published elsewhere.1
Interpreting Medicaid and CHIP Enrollment and Spending NumbersPublished numbers for enrollment in Medicaid and the State Children’s Health Insurance Program (CHIP) can vary substantially depending on the source of data, the enrollment period examined, and the individuals included in the data.
Data sourcesMedicaid and CHIP enrollment and spending numbers are available from data compiled by states and the federal government in the course of administering these programs. Program data are updated on different schedules, so the latest year of available data may differ depending on the source. MACPAC commonly uses the following types of administrative data, which are submitted by the states to the Centers for Medicare & Medicaid Services (CMS):
• Form CMS-64 data for state-level Medicaid spending;
• Medicaid Statistical Information System (MSIS) data for person-level detail;
• Medicaid managed care enrollment reports; and
• Statistical Enrollment Data System (SEDS) data for CHIP enrollment.
In addition, CMS recently began compiling two new administrative data sources, referred to here as performance indicator enrollment data and CMS-
64 enrollment data.2 These sources differ in the timing of the reports and the enrollees covered. Performance indicator enrollment data are published monthly by CMS and only include full-benefit Medicaid and CHIP enrollees. CMS-64 enrollment data are published quarterly and include Medicaid enrollees with limited benefits but exclude CHIP enrollees.
Both sources provide more up-to-date information than the MSIS. CMS-64 enrollment data include detailed information about the new adult group made eligible under Section 1902(a)(10)(A)(i)(VIII) of the Social Security Act by the Patient Protection and Affordable Care Act (ACA, P.L. 111-148, as amended).
MACPAC uses the spending and enrollment data submitted on the CMS-64 to produce an exhibit on spending and enrollment from the most recent year for all Medicaid enrollees and those adults newly eligible for Medicaid under the ACA (Exhibit 23).
CMS is in the process of implementing a new version of the MSIS, referred to as the Transformed MSIS (T-MSIS) that will provide more timely data. One consequence of the transition from the MSIS to the T-MSIS is that there is now a gap in available data from many states. Several states began the transition to the T-MSIS in 2014 and do not have complete information for fiscal year (FY) 2014 available in the MSIS. Although all states have begun submitting T-MSIS data to CMS, these data are still being verified for completeness and accuracy and are not available for publication at this time.
Because T-MSIS data are not available, MACPAC was not able to update several exhibits that provide enrollment and spending data by eligibility group, and we are reprinting 11 exhibits from last year’s edition.3 For exhibits that provide national-level data derived from the MSIS, we show FY 2013 data. For exhibits that provide state-level data, we have published two versions: the A version provides FY 2013 data and the B version provides FY 2014 data for the states that had sufficient data. For the B version FY 2014 tables, we have not published national totals due to the number of states excluded.
Section 6: Technical Guide to MACStats

December 2018142
Section 6: Technical Guide to MACStats
MAC
Stat
sSe
ctio
n 6
MACStats also uses nationally representative surveys based on interviews of individuals, including the National Health Interview Survey (NHIS) and the Medical Expenditure Panel Survey (MEPS). Estimates of Medicaid and CHIP enrollment from survey data tend to be lower than estimates generated from administrative data, in part because survey respondents tend to underreport Medicaid and CHIP coverage. However, survey data provide many more details on individual and family circumstances (for example, health status, ease in accessing services, and reasons for delaying care) and can therefore provide a richer picture of the individuals enrolled in Medicaid and CHIP.
Enrollment period examinedCharacterizations of the size of the Medicaid and CHIP populations may vary based on the enrollment period examined. The number of individuals enrolled at a particular point during the year will be lower than the total number enrolled at any point during an entire year. Point-in-time numbers are sometimes referred to as average, full-year equivalent, or person-year enrollment. These statistics are often used for budget analyses (such as those by the CMS Office of the Actuary) and when comparing enrollment and expenditure numbers. Per enrollee spending levels based on full-year equivalents ensure that amounts are not biased by individuals’ transitions in and out of Medicaid coverage during the year.
Enrollees versus beneficiariesDepending on the source and the year in question, data may reflect different ways of characterizing individuals in Medicaid. Certain terms commonly used to refer to people with Medicaid have specific definitions in administrative data sources provided by CMS:4
• Enrollees (less commonly referred to as eligibles) are individuals who are eligible for and enrolled in Medicaid or CHIP. Prior to FY 1990, CMS did not track the number of Medicaid enrollees, but tracked only beneficiaries (see below). In some cases, CMS has estimated the number of enrollees prior to 1990.
• Beneficiaries, or persons served (less commonly referred to as recipients), are enrollees who receive covered services or for whom Medicaid or CHIP payments are made. Prior to FY 1998, individuals were not counted as beneficiaries if managed care payments were the only Medicaid payments made on their behalf. Beginning in FY 1998, however, Medicaid managed care enrollees with no fee-for-service (FFS) spending were also counted as beneficiaries, which increased the number of individuals reported in enrollment statistics. Generally, the number of beneficiaries will approach the number of enrollees as more of these individuals use Medicaid-covered services or are enrolled in managed care.5 (In common usage outside of CMS statistical publications, the term beneficiaries is typically synonymous with enrollees.)
Institutionalized and limited-benefit enrollees Administrative Medicaid data include enrollees who are in institutions, such as nursing facilities, as well as individuals who only receive limited benefits (for example, coverage for emergency services only). Survey data tend to exclude such individuals from counts of coverage. In percentage terms, the difference between estimates from administrative data and estimates from survey data tends to be largest among older beneficiaries, who are more likely to be living in institutions (in which case they are excluded from most surveys) and more likely to be receiving limited Medicaid benefits that pay only for their Medicare premiums and cost sharing (which may not be counted as Medicaid coverage in some surveys).
CHIP enrolleesMedicaid-expansion CHIP enrollees are children who are entitled to the covered services of a state’s Medicaid program, but whose Medicaid coverage is generally funded with CHIP dollars. Depending on the data source, Medicaid enrollment and spending figures may include not only Medicaid enrollees funded with Medicaid dollars, but also Medicaid-expansion CHIP enrollees funded with CHIP dollars. M
ACSt
ats
Sect
ion
6

MACStats: Medicaid and CHIP Data Book 143
Section 6: Technical Guide to MACStats
MAC
Stat
sSe
ctio
n 6
For MACStats, we generally exclude Medicaid-expansion CHIP enrollees from Medicaid analyses, but some data sources do not allow these children to be broken out separately.
Understanding Data on Health and Other Characteristics of Medicaid and CHIP PopulationsMACStats uses data from the federal NHIS and the MEPS to describe Medicaid and CHIP enrollees in terms of their self-reported demographic, socioeconomic, and health characteristics as well as their use of care. Background information on these surveys is provided here, along with information on how children with special health care needs are identified using NHIS data.
NHIS and MEPS dataThe NHIS is an annual face-to-face household survey of civilian non-institutionalized persons designed to monitor the health of the U.S. population through the collection of information on a broad range of health topics.6 A subsample of households that participated in the previous year’s NHIS undergo further interviews for the household component of the MEPS, which collects more detailed information on use of health care services and expenditures.7
Although other surveys are available, the NHIS is the main survey data source used in MACStats because it provides relatively timely estimates and because its sample size is large enough to produce reliable subgroup estimates and to detect meaningful differences between them. In addition, it is generally considered to be one of the best surveys for health insurance coverage estimates, and it captures detailed information on individuals’ health status.8
However, the NHIS is known to produce higher estimates of service use than the MEPS.9 As a result, MACStats includes estimates of service use from both sources. For purposes of comparing groups of individuals, the NHIS has the advantage of providing the most recent information available; for other
purposes, such as measuring levels of service use relative to a particular benchmark or goal, consulting estimates from the MEPS or another source might be more appropriate.
The NHIS does have some limitations. As in most surveys, respondents in the NHIS do not always accurately report information about participation in programs such as Medicaid, CHIP, Medicare, Supplemental Security Income (SSI), and Social Security Disability Insurance. As a result, survey data may not match estimates of program participation computed from the programs’ own administrative data. In addition, although the NHIS asks about participation in Medicaid and CHIP in two different questions, program participation estimates from the survey are not reported separately. One reason for this is that many states’ CHIP and Medicaid programs use the same name, so respondents may not necessarily know which program funds their children’s coverage. Even when the programs have different names, it may be difficult for respondents and interviewers to correctly categorize the coverage. As a result, separate survey questions regarding participation in Medicaid and CHIP are generally used to minimize the undercounting of Medicaid and CHIP enrollees, not to produce valid estimates separately for each program. Thus, survey data analyses typically combine Medicaid and CHIP into a single category.
Children with special health care needsThe term children with special health care needs (CSHCN) is defined by the U.S. Department of Health and Human Services’ Maternal and Child Health Bureau as a group of children who “have or are at increased risk for a chronic physical, developmental, behavioral, or emotional condition and who also require health and related services of a type or amount beyond that required by children generally.”10 This definition encompasses children with disabilities and also children with chronic conditions (e.g., asthma, juvenile diabetes, sickle cell anemia) that range from mild to severe. The category of CSHCN covers a broader range of children than the category of children with conditions severe enough and family incomes low enough to qualify for SSI.11
MAC
Stat
sSe
ctio
n 6
December 2018144
Section 6: Technical Guide to MACStats
MAC
Stat
sSe
ctio
n 6
To identify children in the CSHCN category in the NHIS, MACPAC uses responses to several questions, based on an approach developed by the Child and Adolescent Health Measurement Initiative.12 Children identified as meeting CSHCN criteria include those with at least one diagnosed or parent-reported ongoing health condition and elevated service use. The selected ongoing health conditions include, for example, attention deficit disorder, developmental delays, cerebral palsy, and heart disease. Examples of parent-reported conditions include suffering from seizures, frequent migraines, and allergies within the past 12 months.13 In addition to having one of the identified conditions, a child must also meet one of the following criteria related to elevated service use:
• The child is limited in his or her ability or unable to do things most children the same age can do.14
• The child needs or uses medications prescribed by a doctor (other than vitamins).15
• The child needs or uses specialized therapies such as physical, occupational, or speech therapy.16
• The child has above-routine need or use of medical, mental health, home care, or education services.17
• The child needs or receives treatment or counseling for an emotional, behavioral, or developmental problem.18
The NHIS varies from year to year in the diagnoses and health conditions it asks parents to report, so estimates for number of children in the CSHCN category may not be comparable from year to year.
Methodology for Adjusting Benefit Spending DataThe FY 2013 and FY 2014 Medicaid benefit spending amounts presented in this data book were calculated based on MSIS data that have been adjusted to match total benefit spending reported by states in CMS-64 data.19 Although the CMS-64 provides a more complete accounting of spending than the MSIS and is preferred when examining
state or federal spending totals, it cannot be used for analysis of benefit spending by eligibility group and other enrollee characteristics.20 Thus, we adjust MSIS amounts for several reasons:
• CMS-64 data provide an official accounting of state spending on Medicaid for purposes of receiving federal matching dollars; in contrast, MSIS data are used primarily for statistical purposes.
• The MSIS generally understates total Medicaid benefit spending because it excludes disproportionate share hospital (DSH) payments and additional types of supplemental payments made to hospitals and other providers, Medicare premium payments, and certain other amounts.21
• The MSIS generally overstates net spending on prescribed drugs because it excludes rebates from drug manufacturers.
• Even after accounting for differences in scope and design, the MSIS still tends to produce lower total benefit spending than the CMS-64.22
• The extent to which the MSIS differs from the CMS-64 varies by state, meaning that a cross-state comparison of unadjusted MSIS amounts may not reflect true differences in benefit spending. (See Exhibits 47a and 47b for unadjusted benefit spending amounts in the MSIS as a percentage of benefit spending in the CMS-64.)
The methodology MACPAC uses for adjusting MSIS benefit spending data involves the following steps:
• We aggregate the service types into broad categories that are comparable between the two sources. This is necessary because there is not a one-to-one correspondence of service types in MSIS and CMS-64 data. Even service types that have identical names may still be reported differently in the two sources due to differences in the instructions given to states. (See Exhibit 48 for additional detail on the categories used.)
• We calculate state-specific adjustment factors for each of the service categories by dividing

MACStats: Medicaid and CHIP Data Book 145
Section 6: Technical Guide to MACStats
MAC
Stat
sSe
ctio
n 6
CMS-64 benefit spending by MSIS benefit spending.
• We then multiply MSIS dollar amounts in each service category by the state-specific factors to obtain adjusted MSIS spending. For example, in a state with an FFS hospital factor of 1.2, each Medicaid enrollee with hospital spending in the MSIS would have that spending multiplied by 1.2; doing so makes the sum of adjusted hospital spending amounts among individual Medicaid enrollees in the MSIS total the aggregate hospital spending reported by states in the CMS-64 (as noted later, MACPAC excludes some amounts from the CMS-64 hospital total).23
These adjustments to MSIS data are meant to provide more complete estimates of Medicaid benefit spending across states that can be analyzed by eligibility group and other enrollee characteristics. Other organizations, including the CMS Office of the Actuary, the Kaiser Commission on Medicaid and the Uninsured, and the Urban Institute, use similar methodologies, although these may differ in some ways—for example, by using different service categories or producing estimates for future years based on actual data from earlier years.
Readers should note that due to changes in both methods and data, MSIS figures shown here are not directly comparable to earlier years. Key differences between the current and previous methodologies include the following:
• Beginning with the 2014 edition of the MACStats data book, we have excluded DSH payments from CMS-64 totals used to adjust MSIS spending. In earlier editions, DSH payments were included in CMS-64 totals. The rationale for doing so was that DSH payments are used to support hospitals that serve a large number of low-income and Medicaid-enrolled patients, and could therefore be partially attributed to Medicaid enrollees in the MSIS. However, an examination of annual DSH audit data submitted by states indicates that for some hospitals, Medicaid DSH payments far exceed their uncompensated care costs for Medicaid-enrolled patients and may therefore
be attributed largely to uninsured patients.24 As a result, we now exclude DSH payments from CMS-64 totals when we adjust MSIS spending.
• Also starting with the 2014 edition, we obtained a more precise separation of home- and community-based services (HCBS) waiver spending in the MSIS due to the use of more detailed MSIS data files than in previous years.
• Beginning with the 2015 edition of the MACStats data book, we excluded incentive and uncompensated care pool payments made under Section 1115 waiver expenditure authority from CMS-64 totals used to adjust MSIS spending.25 In earlier editions, these payments were included in CMS-64 totals. Because these payments may be made for purposes other than providing services to Medicaid-enrolled patients, we now exclude them when we adjust MSIS spending.
• Also starting with the 2015 edition, we shifted a portion of drug rebate amounts in the CMS-64 from fee for service to managed care for a small number of states that, despite reporting drug utilization data for managed care, reported minimal or no drug rebate amounts for managed care.
With regard to changes in data, complete MSIS Annual Person Summary (APS) files have not been available in a timely manner for use in MACStats since 2013. Therefore, beginning with the 2014 edition, we have been calculating spending and enrollment from the full MSIS data files that are used to create APS files. In general, our calculations closely match those used to create the APS. However, our development of enrollment counts is a notable exception. In MACPAC’s analysis of the full MSIS data files, Medicaid enrollees are assigned a unique national ID number using an algorithm that incorporates state-specific ID numbers and beneficiary characteristics such as date of birth and gender. The state and national enrollment counts are then unduplicated using this national ID, which results in slightly lower enrollment counts than would be the case had we used APS files.

December 2018146
Section 6: Technical Guide to MACStats
MAC
Stat
sSe
ctio
n 6
EXHIBIT 47a. Medicaid Benefit Spending in MSIS and CMS-64 Data by State, FY 2013 (millions)
State
Benefit spending totals included in analysis
Amounts excluded from CMS-64 benefit spending totals
Unadjusted MSIS CMS-641
MSIS as a percentage of CMS-64 DSH
Incentive and uncompensated
care pool waivers
Total $382,676 $409,267 93.5% $16,247 $10,799
Alabama 4,179 4,568 91.5 471 –Alaska 1,321 1,335 99.0 22 –Arizona 8,229 7,586 108.5 173 679Arkansas 3,497 4,141 84.4 61 5California 41,027 57,297 71.6 2,120 2,487Colorado 4,004 4,898 81.7 194 –Connecticut 6,241 6,453 96.7 273 –Delaware 1,662 1,552 107.1 11 –District of Columbia 2,360 2,232 105.7 56 –Florida 20,301 17,233 117.8 335 994Georgia 9,310 8,530 109.1 430 –Hawaii 1,464 1,524 96.1 25 82Idaho 1,702 1,648 103.3 24 –Illinois 13,782 15,211 90.6 447 –Indiana 6,603 7,630 86.5 338 –Iowa 3,547 3,649 97.2 55 6Kansas 2,533 2,441 103.7 77 60Kentucky 5,575 5,606 99.4 216 –Louisiana 5,513 6,380 86.4 767 –Maine 2,041 2,850 71.6 37 –Maryland 7,195 7,647 94.1 134 –Massachusetts 11,142 12,338 90.3 – 828Michigan 11,529 11,998 96.1 388 –Minnesota 8,561 8,873 96.5 46 –Mississippi 3,842 4,518 85.0 218 –Missouri 7,121 8,248 86.3 703 –Montana 864 989 87.3 18 –Nebraska 1,749 1,788 97.8 45 –Nevada 1,477 1,742 84.8 81 –New Hampshire 1,045 1,162 89.9 41 –New Jersey 9,082 9,266 98.0 1,298 42New Mexico 2,615 3,270 80.0 25 –

MACStats: Medicaid and CHIP Data Book 147
Section 6: Technical Guide to MACStats
MAC
Stat
sSe
ctio
n 6
EXHIBIT 47a. (continued)
State
Benefit spending totals included in analysis
Amounts excluded from CMS-64 benefit spending totals
Unadjusted MSIS CMS-641
MSIS as a percentage of CMS-64 DSH
Incentive and uncompensated
care pool waivers
New York $50,560 $50,354 100.4% $3,423 $644North Carolina 9,932 11,298 87.9 617 –North Dakota 805 783 102.8 1 –Ohio 16,001 16,154 99.1 649 –Oklahoma 3,925 4,754 82.6 42 –Oregon 3,996 4,782 83.6 77 253Pennsylvania 18,749 20,245 92.6 847 –Rhode Island 2 2 2 2 2
South Carolina 4,862 4,449 109.3 457 –South Dakota 757 765 99.0 1 –Tennessee 13,563 7,617 178.1 80 1,020Texas 22,084 24,417 90.4 227 3,695Utah 2,640 2,101 125.6 29 –Vermont 1,136 1,431 79.4 37 5Virginia 6,363 7,105 89.6 186 –Washington 6,684 7,805 85.6 367 –West Virginia 3,216 2,949 109.1 75 –Wisconsin 5,689 7,105 80.1 1 –Wyoming 603 554 108.9 0 –
Notes: MSIS is Medicaid Statistical Information System. FY is fiscal year. DSH is disproportionate share hospital. Includes federal and state funds. MSIS and CMS-64 data reflect unadjusted amounts as reported by states. Both sources exclude spending on administration, the territories, and Medicaid-expansion CHIP enrollees; in addition, CMS-64 amounts exclude $7.1 billion in offsetting collections from third-party liability, estate, and other recoveries. For greater detail on the difference between MSIS and CMS-64, please see the Methodology for Adjusting Benefit Spending Data section. Beginning with the December 2014 data book, DSH payments have been excluded from CMS-64 totals used to adjust MSIS spending; beginning with the December 2015 data book, incentive and uncompensated care pool payments made under Section 1115 waiver authority have also been excluded. For informational purposes, the DSH and waiver expenditure amounts that were excluded are shown here. Values have not been updated from those published in the December 2017 data book due to the unavailability of more recent MSIS or Transformed MSIS data.
– Dash indicates zero; $0 indicates an amount less than $0.5 million that rounds to zero.1 The total amount reported on the CMS-64 may differ slightly from the state and national totals of our adjusted MSIS spending reported in other exhibits due to rounding when applying certain adjustments.2 Rhode Island was excluded due to data reliability concerns regarding completeness of monthly claims and enrollment data.
Source: MACPAC, 2017, analysis of MSIS data as of December 2016 and CMS-64 Financial Management Report net expenditure data as of June 2016.

148
Section 6: Technical Guide to MACStats
EXHIBIT 47b. Medicaid Benefit Spending in MSIS and CMS-64 Data by State, FY 2014 (millions)
State1
Benefit spending totals included in analysis
Amounts excluded from CMS-64 benefit spending totals
Unadjusted MSIS CMS-642
MSIS as a percentage of CMS-64 DSH
Incentive and uncompensated
care pool waivers
Arizona $8,190 $8,757 93.5% $143 $339
Arkansas 4,231 4,858 87.1 38 1
California 47,584 58,116 81.9 2,483 3,342
Connecticut 6,729 7,082 95.0 149 –
Georgia 11,947 9,051 132.0 435 –
Idaho 1,643 1,584 103.7 24 –
Iowa 4,040 3,993 101.2 44 2
Louisiana 5,351 6,233 85.9 1,126 –
Massachusetts 12,889 13,338 96.6 – 1,265
Michigan 11,683 13,019 89.7 562 –
Minnesota 9,761 10,013 97.5 43 –
Mississippi 3,980 4,662 85.4 223 –
New Jersey 11,038 11,235 98.2 1,214 225
New York 48,722 48,190 101.1 3,366 2,648
Ohio 18,028 18,909 95.3 673 –
Oklahoma 3,908 4,922 79.4 44 –
Oregon 5,747 6,555 87.7 32 244
Pennsylvania 20,497 22,666 90.4 956 –
South Carolina 5,243 5,058 103.7 495 –
South Dakota 779 783 99.4 2 –
Tennessee 12,614 8,480 148.7 – 833
Utah 3,306 2,062 160.3 32 –
Vermont 1,230 1,465 84.0 37 –
Washington 8,508 10,022 84.9 365 –
West Virginia 3,567 3,275 108.9 74 –
Wyoming 622 547 113.7 0 –
MAC
Stat
sSe
ctio
n 6
December 2018

MACStats: Medicaid and CHIP Data Book 149
Section 6: Technical Guide to MACStats
EXHIBIT 47b. (continued)
Notes: MSIS is Medicaid Statistical Information System. FY is fiscal year. DSH is disproportionate share hospital. Includes federal and state funds. MSIS and CMS-64 data reflect unadjusted amounts as reported by states. Both sources exclude spending on administration, the territories, and Medicaid-expansion CHIP enrollees; in addition, CMS-64 amounts exclude $7.9 billion in offsetting collections from third-party liability, estate, and other recoveries. For greater detail on the difference between MSIS and CMS-64, please see the Methodology for Adjusting Benefit Spending Data section. Beginning with the December 2014 data book, DSH payments have been excluded from CMS-64 totals used to adjust MSIS spending; beginning with the December 2015 data book, incentive and uncompensated care pool payments made under Section 1115 waiver authority have also been excluded. For informational purposes, the DSH and waiver expenditure amounts that were excluded are shown here. Values have not been updated from those published in the December 2017 data book due to the unavailability of more recent MSIS or Transformed MSIS (T-MSIS) data.
– Dash indicates zero; $0 indicates an amount less than $0.5 million that rounds to zero.1 Several states did not submit complete MSIS data for FY 2014 due to the ongoing transition to the T-MSIS and were excluded from this exhibit. In addition, a few states were excluded due to data reliability concerns regarding the completeness and quality of the submitted MSIS data. This exhibit includes only states that had sufficient FY 2014 MSIS data. Due to the number of states excluded, a national total is not provided.2 The total amount reported on the CMS-64 may differ slightly from the state totals of our adjusted MSIS spending reported in other exhibits due to rounding when applying certain adjustments.
Source: MACPAC, 2017, analysis of MSIS data as of December 2016 and CMS-64 Financial Management Report net expenditure data as of June 2017.
MAC
Stat
sSe
ctio
n 6

December 2018150
Section 6: Technical Guide to MACStats
MAC
Stat
sSe
ctio
n 6
EXHIBIT 48. Service Categories Used to Adjust FYs 2013 and 2014 Medicaid Benefit Spendingin the MSIS to Match CMS-64 Totals
Service category MSIS service types1 CMS-64 service types
Hospital • Inpatient hospital• Outpatient hospital
• Inpatient hospital non-DSH• Inpatient hospital non-DSH supplemental payments• Inpatient hospital GME payments• Outpatient hospital non-DSH• Outpatient hospital non-DSH supplemental payments• Emergency services for aliens2
• Emergency hospital services• Critical access hospitals
Non-hospital acute care
• Physician• Dental• Nurse-midwife• Nurse practitioner• Other practitioner• Non-hospital outpatient
clinic• Lab and X-ray• Sterilizations• Abortions• Hospice• Targeted case management• Physical, occupational,
speech, and hearing therapy• Non-emergency
transportation• Private duty nursing• Rehabilitative services• Other care, excluding HCBS
waiver
• Physician (including primary care physician payment increase)
• Physician services supplemental payments• Preventive services with USPSTF Grade A or B and
ACIP vaccines• Dental• Nurse-midwife• Nurse practitioner• Other practitioner • Other practitioner supplemental payments• Non-hospital clinic• Rural health clinic• Federally qualified health center• Lab and X-ray• Sterilizations• Abortions• Hospice• Targeted case management• Statewide case management• Physical therapy• Occupational therapy• Services for speech, hearing, and language• Non-emergency transportation• Private duty nursing• Rehabilitative services (non-school-based)• School-based services• EPSDT screenings• Diagnostic screening and preventive services• Prosthetic devices, dentures, eyeglasses• Freestanding birth center• Health home with chronic conditions• Tobacco cessation for pregnant women• Care not otherwise categorized
Drugs • Drugs (gross spending) • Drugs (gross spending)• Drug rebates

MACStats: Medicaid and CHIP Data Book 151
Section 6: Technical Guide to MACStats
MAC
Stat
sSe
ctio
n 6
EXHIBIT 48. (continued)
Service category MSIS service types1 CMS-64 service typesManaged care and premium assistance
• HMO (i.e., comprehensive risk-based managed care; includes PACE)
• PHP• PCCM
• MCO (i.e., comprehensive risk-based managed care)• MCO drug rebates• PACE• PAHP• PIHP• PCCM• MCO, PAHP, and PIHP payments associated with the
primary care physician payment increase, Community First Choice option, preventive services with USPSTF Grade A or B, and ACIP vaccines
• Premium assistance for private coverageLTSS non-institutional • Home health
• Personal care• HCBS waiver
• Home health• Personal care• Personal care—1915(j)• HCBS waiver• HCBS—1915(i)• HCBS—1915(j)• HCBS–1915(k)
LTSS institutional • Nursing facility• ICF/ID• Inpatient psychiatric for
individuals under age 21• Mental health facility for
individuals age 65 and older
• Nursing facility• Nursing facility supplemental payments• ICF/ID• ICF/ID supplemental payments• Mental health facility for individuals under age 21 or
age 65 and older, non-DSHMedicare3, 4 • Medicare Part A and Part B premiums
• Medicare coinsurance and deductibles for QMBs
Notes: FY is fiscal year. MSIS is Medicaid Statistical Information System. DSH is disproportionate share hospital. GME is graduate medical education. HCBS is home- and community-based services. USPSTF is U.S. Preventive Services Task Force. ACIP is Advisory Committee on Immunization Practices. EPSDT is early and periodic screening, diagnostic, and treatment. HMO is health maintenance organization. PACE is Program of All-Inclusive Care for the Elderly. PHP is prepaid health plan. PCCM is primary care case management. MCO is managed care organization. PAHP is prepaid ambulatory health plan (a type of PHP). PIHP is prepaid inpatient health plan (a type of PHP). LTSS is long-term services and supports. ICF/ID is intermediate care facility for persons with intellectual disabilities. QMB is qualified Medicare beneficiary. Service categories and types reflect fee-for-service spending unless noted otherwise. Service types with identical names in MSIS and CMS-64 data may still be reported differently in the two sources due to differences in the instructions given to states; amounts for those that appear only in the CMS-64 (e.g., drug rebates) are distributed across Medicaid enrollees with MSIS spending in the relevant service categories (e.g., drugs). Service categories have not been updated from those published in the December 2017 data book due to the unavailability of more recent MSIS or Transformed MSIS data.1 Claims in the MSIS include both a service type (such as inpatient hospital, physician, personal care) and a program type (including HCBS waiver). When adjusting MSIS data to match CMS-64 totals, we count all claims with an HCBS waiver program type as HCBS waiver, regardless of their specific service type. Among claims with an HCBS waiver program type, the most common service types are other, home health, rehabilitation, and personal care.2 Emergency services for non-qualified aliens are reported under individual service types throughout the MSIS, but primarily as inpatient and outpatient hospital. As a result, we include this CMS-64 amount in the hospital category. 3 Medicare premiums are not reported in the MSIS. We distribute CMS-64 amounts proportionately across dually eligible enrollees identified in the MSIS for each state.4 Medicare coinsurance and deductibles are reported under individual service types throughout the MSIS. We distribute CMS-64 amounts for QMBs across CMS-64 spending in the hospital, non-hospital acute, and LTSS institutional categories prior to calculating state-level adjustment factors based on the distribution of Medicare cost sharing for hospital, Part B, and skilled nursing facility services among QMBs using 2011 Medicare data for the FY 2013 tables and 2012 Medicare data for the FY 2014 tables. See MedPAC and MACPAC, 2017, Table 5: Fee-for-service Medicare Part A and Part B cost sharing incurred by dual-eligible and non-dual Medicare beneficiaries, CY 2012, in Data book: Beneficiaries dually eligible for Medicare and Medicaid, Washington, DC: MedPAC and MACPAC, https://www.macpac.gov/wp-content/uploads/2017/01/Jan17_MedPAC_MACPAC_DualsDataBook.pdf; and MedPAC and MACPAC, 2016, Table 4: Fee-for-service Medicare Part A and Part B cost sharing incurred by dual-eligible and non-dual Medicare beneficiaries, CY 2011, in Data book: Beneficiaries dually eligible for Medicare and Medicaid, Washington, DC: MedPAC and MACPAC, https://www.macpac.gov/wp-content/uploads/2015/01/Dually-Eligible-Beneficiares-DataBook.pdf.Source: MACPAC, 2017, analysis of MSIS and CMS-64 Financial Management Report net expenditure data.

December 2018152
Section 6: Technical Guide to MACStats
MAC
Stat
sSe
ctio
n 6
Understanding Managed Care Enrollment and Spending DataThere are four main sources of data on Medicaid managed care available from CMS.
• Medicaid Managed Care Data Collection System (MMCDCS). The MMCDCS provides state-reported aggregate enrollment statistics and other basic information for each managed care plan within a state. CMS uses the MMCDCS to create an annual Medicaid managed care enrollment report, which is the source of information on Medicaid managed care most commonly cited by CMS as well as by outside analysts and researchers.
• MSIS. The MSIS provides person-level and claims-level information for all Medicaid enrollees. For managed care, MSIS claims include records of each capitated payment made on behalf of an enrollee to a managed care plan (generally referred to as capitated claims) as well as records of each service received by the enrollee from a provider under contract with a managed care plan (which generally do not include payment amounts and may be referred to as encounter or dummy claims). All states collect encounter data from their Medicaid managed care plans, but some do not report them in the MSIS. Managed care enrollees may also have FFS claims in the MSIS if they used services beyond those covered by a managed care plan’s contract with the state.
• CMS-64. The CMS-64 Financial Management Report provides aggregate spending information for Medicaid grouped into major benefit categories, including managed care. The spending amounts reported by states on the CMS-64 are used to calculate their federal matching dollars.
• SEDS. The SEDS provides aggregate statistics on CHIP enrollment and child Medicaid enrollment that include the number of individuals covered under FFS and managed care systems. The SEDS is the only comprehensive source of information on managed care participation among separate CHIP enrollees across states.
Although the annual Medicaid managed care enrollment report generally contains the most recent information available from CMS on Medicaid managed care for all states, it does not provide information on many characteristics of enrollees in managed care (e.g., basis of eligibility and demographics such as age, sex, race, and ethnicity). It does provide information on whether individuals are dually eligible for Medicare. As a result, MACStats also includes statistics based on MSIS and CMS-64 data, such as the percentage of individuals enrolled in managed care by eligibility group and the percentage of Medicaid benefit spending attributable to managed care.
When examining managed care statistics from various sources, the following issues should be noted:
• Figures in the annual Medicaid managed care enrollment report published by CMS include Medicaid-expansion CHIP enrollees. Although we generally exclude these children (between 2 million and 5 million, depending on the time period) from Medicaid analyses in MACStats, it is not possible to do so with the CMS annual Medicaid managed care enrollment report data.26
• The types of managed care reported by states may differ somewhat between the Medicaid managed care enrollment report and the MSIS. For example, some states report a small number of enrollees in comprehensive risk-based managed care in one data source but not the other. Anomalies in MSIS data are documented by CMS as it reviews each state’s

MACStats: Medicaid and CHIP Data Book 153
Section 6: Technical Guide to MACStats
MAC
Stat
sSe
ctio
n 6
quarterly submission, but all issues may not be identified in this process.
• The Medicaid managed care enrollment report provides point-in-time figures. In contrast, MSIS data allow the calculation of number of enrollees ever enrolled in managed care during a fiscal year or other period of time.
Endnotes1 For technical guides to earlier editions of MACStats, see MACPAC’s June reports to Congress, which are accessible through the MACStats archive page of the MACPAC website, https://www.macpac.gov/publication/macstats-archive/. 2 CMS has been collecting Medicaid and CHIP performance indicator data on key processes related to eligibility and enrollment since late 2013. In part because the new Medicaid and CHIP performance indicator enrollment data do not identify newly eligible individuals for whom there is a higher federal matching rate, CMS is using a separate process to collect monthly Medicaid enrollment by eligibility category when states submit their CMS-64 quarterly expenditures. Specifically, a new CMS-64 enrollment form has been created to accompany the current expenditure forms. Although enrollment is submitted at the same time as expenditures, there is not a direct link between the amount of federal expenditures claimed by states and the number of enrollees reported. Instead, CMS uses CMS-64 enrollment data for monitoring and oversight purposes.3 These tables are: Exhibit 7: Medicaid beneficiaries (persons served) by eligibility group; Exhibit 14: Medicaid enrollment by state, eligibility group, and dually eligible status; Exhibit 15: Medicaid full-year equivalent enrollment by state and eligibility group; Exhibit 18: Distribution of Medicaid benefit spending by eligibility group and service category; Exhibit 19: Medicaid benefit spending per full-year equivalent enrollee by eligibility group and service category; Exhibit 20: Distribution of Medicaid enrollment and benefit spending by users and non-users of long-term services and supports; Exhibit 21: Medicaid spending by state, eligibility group, and dually eligible status; Exhibit 22: Medicaid benefit spending per full-year equivalent enrollee by state and eligibility group; Exhibit 30: Percentage of Medicaid enrollees in managed care by state and eligibility group; Exhibit 47: Medicaid benefit spending in MSIS and CMS-64 data by state; and Exhibit 48: Service categories used to adjust FYs 2013 and 2014 Medicaid benefit spending in the MSIS to match CMS-64 totals.4 See, for example, CMS, 2010, Brief summaries and glossary (2010 edition), in Medicare & Medicaid statistical supplement, Baltimore, MD: CMS, https://www.cms.gov/Research-Statistics-Data-and-Systems/Statistics-Trends-and-Reports/MedicareMedicaidStatSupp/Downloads/2010SummariesGlossary.zip.5 States make capitated payments for all individuals enrolled in managed care plans even if no health care services are used. Therefore, all managed care enrollees currently are counted as beneficiaries or persons served, regardless of whether they have used any health services. 6 Centers for Disease Control and Prevention (CDC), U.S. Department of Health and Human Services, 2018, About the National Health Interview Survey, http://www.cdc.gov/nchs/nhis/about_nhis.htm.

December 2018154
Section 6: Technical Guide to MACStats
MAC
Stat
sSe
ctio
n 6
7 Agency for Health Care Research and Quality (AHRQ), U.S. Department of Health and Human Services, 2016, Medical Expenditures Panel Survey: Survey background, http://meps.ahrq.gov/mepsweb/about_meps/survey_back.jsp. 8 Kenney, G., and V. Lynch, 2010, Monitoring children’s health insurance coverage under CHIPRA using federal surveys, in Databases for estimating health insurance coverage for children: A workshop summary, Plewes, T.J., ed., Washington, DC: National Academies Press, http://www.nap.edu/catalog/13024.html.9 Rhoades, J.A., J.W. Cohen, and S.R. Machlin, 2010, Methodological comparison of estimates of ambulatory health care use from the Medical Expenditure Panel Survey and other data sources (pp. 2828–2837, health policy statistics section), in JSM Proceedings, Alexandria, VA: American Statistical Association.10 McPherson, M., P. Arrango, H. Fox, et al., 1998, A new definition of children with special health care needs, Pediatrics 102: 137–140. 11 For children under age 18 to be determined disabled under SSI rules, the child must have at least one medically determinable physical or mental impairment that causes marked and severe functional limitations and that can be expected to cause death or last at least 12 months (§ 1614(a)(3)(C)(i) of the Social Security Act). 12 To operationalize the Maternal and Child Health Bureau definition of CSHCN, researchers developed a set of survey questions referred to as the CSHCN Screener. It incorporates four components of the definition of CSHCN considered by researchers as essential: functional limitations, need for health-related services, presence of a health condition, and minimum expected duration of health condition (e.g., 12 months). The CSHCN Screener is currently used in several national surveys, but not the NHIS. An alternative approach was developed by the Child and Adolescent Health Measurement Initiative (CAHMI) specifically for use in the NHIS and uses the term children with chronic conditions and elevated service use or need, or CCCESUN. CAHMI’s work builds on earlier work conducted by Davidoff using the NHIS. (Child and Adolescent Health Measurement Initiative, 2012, Identifying children with chronic conditions and elevated service use or need (CCCESUN) in the National Health Interview Survey (NHIS), Portland, OR: Oregon Health and Science University; and Davidoff, A., 2004, Children with special health care needs in the NHIS, Health Services Research 39, no. 1: 53–72). 13 The following conditions were identified in the most recent NHIS: attention deficit disorder; intellectual disability; other developmental delay or problems that cause difficulty with activity; other mental health condition; Down syndrome; cerebral palsy; muscular dystrophy; cystic fibrosis; sickle cell anemia; autism; diabetes; arthritis; heart disease or condition; cancer; any of the following episodes/attacks in the past 12 months: seizure, asthma, respiratory allergy, eczema or skin allergy, food or digestive allergy, anemia, frequent severe headache or migraines, or frequent diarrhea or colitis; depressed or anxious feelings most or all of the time in the past 30 days, feelings interfered with life a lot in the past 30 days; depression/anxiety/emotional problem causes difficulty with activity, difficulties with emotions/concentration/behavior/getting along; very low birth weight (less than 1500
grams) and under 2 years old; chronic condition that limits activity; at least one condition that causes functional limitation and is chronic; or reported fair or poor health status.14 Limitations in ability to do things other children do include the following: any activity limitation, needs help with activities of daily living, has mobility impairment that has lasted or is expected to last more than 12 months, has any functional limitation, is blind, or has a lot of trouble with hearing ability without a hearing aid.15 Need or use of medications includes the following: took a prescription medicine for three or more months or reported unmet need for prescription medications due to cost in the past 12 months.16 Need or use of specialized therapies includes the following: saw or talked to a therapist in the past 12 months.17 Above-routine need or use of services includes the following: has impairment or health problem that requires use of special equipment, had 10 or more visits to a health professional in the past 12 months, had 2 or more emergency department visits in the past 12 months, had 1 or more hospital stays other than for birth in the past 12 months, any homecare visits in the past 12 months, received special education or early intervention services, or reported unmet need for medical care due to cost in the past 12 months. 18 Needs or receives counseling includes the following: family member seen/talked to a mental health professional concerning health of the child in the past 12 months or reported unmet need for mental health counseling due to cost in the past 12 months.19 Medicaid benefit spending reported here excludes amounts for Medicaid-expansion CHIP enrollees, the territories, administrative activities, the Vaccines for Children program (which is authorized by the Medicaid statute but operates as a separate program), and offsetting collections from third-party liability, estate, and other recoveries.20 For a discussion of these data sources, see MACPAC, 2011, Improving Medicaid and CHIP data for policy analysis and program accountability, in Report to the Congress on Medicaid and CHIP, March 2011, Washington, DC: MACPAC, https://www.macpac.gov/wp-content/uploads/2015/01/MACPAC_March2011_web.pdf.21 Some of these amounts, including certain supplemental payments to hospitals and drug rebates, are lump sums that are not paid on a claim-by-claim basis for individual Medicaid enrollees. Nonetheless, we refer to these CMS-64 amounts as benefit spending, and the adjustment methodology described here distributes them across Medicaid enrollees with MSIS spending in the relevant service categories.22 U.S. Government Accountability Office (GAO), 2012, Medicaid: Data sets provide inconsistent picture of expenditures, Washington, DC: GAO, http://www.gao.gov/assets/650/649733.pdf; National Research Council, 2010, Administrative databases, in Databases for estimating health insurance coverage for children: A workshop summary, Plewes, T.J., ed., Washington, DC: National Academies Press, http://www.nap.edu/catalog/13024.html.

MACStats: Medicaid and CHIP Data Book 155
Section 6: Technical Guide to MACStats
MAC
Stat
sSe
ctio
n 6
23 The sum of adjusted MSIS benefit spending for all service categories is equal to CMS-64 benefit spending, exclusive of offsetting collections from third-party liability, estate, and other recoveries. These collections are not reported by type of service in the CMS-64 and are not reported at all in the MSIS. 24 See MACPAC, 2016, Improving data as the first step to a more targeted disproportionate share hospital policy, in Report to Congress on Medicaid and CHIP, March 2016, Washington, DC: MACPAC, https://www.macpac.gov/wp-content/uploads/2016/03/Improving-Data-as-the-First-Step-to-a-More-Targeted-Disproportionate-Share-Hospital-Policy.pdf; and CMS, 2016, Medicaid disproportionate share hospital (DSH) payments, https://www.medicaid.gov/medicaid/financing-and-reimbursement/dsh/index.html. 25 For more on these payments, see MACPAC, 2015, Using Medicaid supplemental payments to drive delivery system reform, in Report to Congress on Medicaid and CHIP, June 2015, Washington, DC: MACPAC, https://www.macpac.gov/wp-content/uploads/2015/06/Using-Medicaid-Supplemental-Payments-to-Drive-Delivery-System-Reform.pdf.26 We generally exclude children enrolled in Medicaid-expansion CHIP from Medicaid analyses because their funding stream (CHIP, under Title XXI of the Social Security Act) differs from that of other Medicaid enrollees (Medicaid, under Title XIX of the Social Security Act). In addition, spending (and often enrollment) for the Medicaid-expansion CHIP population is reported by CMS in CHIP statistics along with information on separate CHIP enrollees.


Printed on recycled material
Advising Congress on Medicaid and CHIP Policy
1800 M Street NWSuite 650 SouthWashington, DC 20036
www.macpac.gov202-350-2000202-273-2452