macrostructure and mechanical behavior of inconel …
TRANSCRIPT
MACROSTRUCTURE AND MECHANICAL BEHAVIOR OF
INCONEL 718 SUPERALLOY FABRICATED BY A BLOWN
POWDER LASER DEPOSITION ADDITIVE
MANUFACTURING PROCESS
by
CHRIS HILL
A THESIS
Submitted in partial fulfillment of the requirements
for the degree of Master of Science in Engineering
in
The Department of Mechanical and Aerospace Engineering
to
The School of Graduate Studies
of
The University of Alabama in Huntsville
HUNTSVILLE, ALABAMA
2018

ii
In presenting this thesis in partial fulfillment of the requirements for a master's degree from
The University of Alabama in Huntsville, I agree that the Library of this University shall
make it freely available for inspection. I further agree that permission for extensive copying
for scholarly purposes may be granted by my advisor or, in his/her absence, by the Chair
of the Department or the Dean of the School of Graduate Studies. It is also understood that
due recognition shall be given to me and to The University of Alabama in Huntsville in
any scholarly use which may be made of any material in this thesis.

iii
THESIS APPROVAL FORM
Submitted by Timothy C. Hill in partial fulfillment of the requirements for the degree of
Master of Science in Engineering with an option in Mechanical Engineering and accepted
on behalf of the Faculty of the School of Graduate Studies by the thesis committee.
We, the undersigned members of the Graduate Faculty of The University of Alabama in
Huntsville, certify that we have advised and/or supervised the candidate on the work
described in this thesis. We further certify that we have reviewed the thesis manuscript and
approve it in partial fulfillment of the requirements for the degree of Master of Science in
Engineering with an option in Mechanical Engineering.

iv
ABSTRACT
The School of Graduate Studies
The University of Alabama in Huntsville
Degree: Master of Science in Engineering College/Dept. Engineering/Mechanical
Aerospace.
Name of Candidate:______ Timothy C. Hill
_____________________________________.
Title: _Macrostructure and Mechanical Behavior of Inconel 718 Superalloy Fabricated by
a Blown Powder Laser Deposition Additive Manufacturing Process.
Additive manufacturing (AM) has become a process of great interest to the aerospace world
for its potential of fabricating near net shape parts with unique complex geometries. As
certain components are being proven to be able to be manufactured with suitable material
properties on smaller scale systems, engineers are looking to scale up the size of
manufactured components for larger systems. While powder bed AM is limited to the size
of components that can be built in the box, other methods can be used to print larger
components. This study looks at blown powder AM which is scalable to larger structures.
This thesis evaluates the material property data and characterization of an Inconel 718
superalloy fabricated using a blown powder laser deposition (BPLD) AM process. A
detailed metallographic evaluation was made of the resulting macrostructure. Tension and
fatigue tests were used to determine the mechanical properties of the material.
v
Abstract Additive manufacturing (AM) has become a process of great interest to the aerospace world
for its potential of fabricating near net shape parts with unique complex geometries. As
certain components are being proven to be able to be manufactured with suitable material
properties on smaller scale systems, engineers are looking to scale up the size of
manufactured components for larger systems. While powder bed AM is limited to the size
of components that can be built in the box, other methods can be used to print larger
components. This study looks at blown powder AM which is scalable to larger structures.
This thesis evaluates the material property data and characterization of an Inconel 718
superalloy fabricated using a blown powder laser deposition (BPLD) AM process. A
detailed metallographic evaluation was made of the resulting macrostructure. Tension and
fatigue tests were used to determine the mechanical properties of the material.
vi
Acknowledgments
I would like to start off by thanking Mr. Sean Sporie, Dr. Gregg Hyatt, and the
rest of the ASI team at DMG Mori for the opportunity to work alongside them during the
early stages of my research. The lessons learned and friendships made during my time at
DMG Mori will never be forgotten and I thank you for the experience.
To my research colleagues especially Mr. Ryan Anderson, Mr. Tom Stockman,
Mr. Benjamin Lund, and Mr. Joe Indeck, thank you all for the support throughout my
graduate studies. The late nights staring through microscopes, taking countless images,
polishing our fingertips off, babysitting test machines, and laughing at poor engineering
jokes that were most likely only funny because it was 3am and we still do not have
results will be cherish memories that I will never forget. Thank you guys.
I would also like to thank my committee members Dr. Kavan Hazeli and Dr.
Sherri Messimer. Thank you for the discussions and help throughout the final stages of
my thesis writing. Your comments, advice, and attention to detail were greatly
appreciated and was a great contributor to the overall strength of my thesis.
Thank you to the NASA Marshall Space Flight Center, Jacobs ESSSA, and Aetos
Systems for your support and funding of this research effort. Your contributions were
greatly appreciated.

vii
Lastly but absolutely not the least, I want to thank my advisor Dr. Judith
Schneider. It was you who saw the potential in me during my undergraduate studies to
push me beyond what I thought I was capable of doing. It was you who believed in me
enough to send me to Chicago in the winter for one of the best experiences a young
engineer could ask for to start learning about additive manufacturing. It was also you who
kept my head above water as I balanced life with my studies and was always there to
listen. I am truly grateful for your support, guidance, and advice throughout these last
several years and it has truly been an honor to work with you throughout my graduate
studies. This experience has meant the world to me and has forever changed my life for
the better. Thank you!
Funding was provided in part by:
NASA-MSFC Cooperative Agreement for Dual Use Technology Development, “Fatigue
Behavior of Free Form, Additively Manufactured Inconel 718,” Grant No.
NNM17AA02A, POP: 3/1/17-2/28/18.
Jacobs ESSSA Subcontract, “Evaluation of additive manufacturing processes for the
production of large, regeneratively cooled, liquid rocket engine components,”
NASA Grant NNM17AA02A, POP: 2/3/17-12/31/17.
Aetos Systems, “Additive/subtractive manufacturing of combustion devices,” Grant No.
Contract NNM14AA15C / Subcontract No.2019.A52, POP: 8/4/2015-5/31/2016.

viii
Table of Contents
Page
List of Figures ........................................................................................................................................... x
List of Tables ........................................................................................................................................... xii
Nomenclature ....................................................................................................................................... xiii
CHAPTER I ................................................................................................................................................. 1
Introduction .............................................................................................................................................. 1
1.1 Background and Motivation .............................................................................................. 2
1.2 Overview of Additive Manufacturing ............................................................................ 6
1.3 Research Goals and Approach .......................................................................................... 8
CHAPTER II ............................................................................................................................................ 10
Literature Review ................................................................................................................................ 10
2. 1 Inconel 718 Overview ........................................................................................................... 10
2.2 Additive Manufacturing ........................................................................................................ 16
CHAPTER III ........................................................................................................................................... 18
Experimental Procedure ................................................................................................................... 18
3.1 Additive Manufacturing Technique and Parameters ................................................. 18
3.2 Heat Treatments ...................................................................................................................... 21
3.3 Metallographic Preparation................................................................................................. 22
3.4 Void analysis .............................................................................................................................. 24
3.5 Macrostructure Characterization ...................................................................................... 26
3.6 Tensile Testing .......................................................................................................................... 27
3.7 High Cycle Fatigue Testing ................................................................................................... 28
CHAPTER IV ........................................................................................................................................... 30
Results ...................................................................................................................................................... 30
4.1 Void Analysis ............................................................................................................................. 30
4.2 Metallography ........................................................................................................................... 34
4.3 Tensile Testing .......................................................................................................................... 43

ix
4.4 High Cycle Fatigue Testing ................................................................................................... 45
CHAPTER V ............................................................................................................................................. 51
Discussion ............................................................................................................................................... 51
5.1 Void Analysis ............................................................................................................................. 51
5.2 Macrostructure ......................................................................................................................... 55
5.3 Mechanical Properties ........................................................................................................... 55
CHAPTER VI ........................................................................................................................................... 57
Conclusions ............................................................................................................................................ 57
CHAPTER VII.......................................................................................................................................... 60
Future Work........................................................................................................................................... 60
References .............................................................................................................................................. 62
x
List of Figures Figure Page 1: Unshrouded (a) vs Shrouded Impeller (b) [8] ............................................................................. 3 2: Liquid Rocket Engine (LRE) being developed under the AMDE program showing
reduced part count achieved using AM vs conventional subtractive manufacturing [9] ..... 4 3: Overview of various liquid rocket engines (LRE) showing typical nozzle exit
diameters [34] ............................................................................................................................................ 5
4: SLM illustration from Meiners, Wissenbach and Gaser patent [13] .................................... 7
5: DMD Image from Mazumder and Koch patent [16] ................................................................. 8
6: Micrograph of γ” precipitates (white) in γ matrix (black) [21] ........................................... 12
7: Delta phase macrostructure with optical microscopy [23] ................................................... 14
8: Laves Microstructure [33] .............................................................................................................. 15
9: TTT diagram of Inconel 718 [26] ................................................................................................ 16
10: DMD Process and components .................................................................................................. 17 11: DMG Mori Seki Lasertec 4300 3D prototype machine at their Hoffman Estates
Location .................................................................................................................................................... 18
12: As-built specimens on substrate. Without argon (a), with argon (b) ............................... 20
13: Cut plan and picture locations of the two orientations studied ......................................... 23
14: Normalized void size frequencies.............................................................................................. 25
15: Round sub-sized tensile specimen mechanical drawing ..................................................... 27
16: High cycle fatigue specimen mechanical drawing ............................................................... 28
17: Transverse orientation of void area relative frequencies .................................................... 31
18: Longitudinal orientation of void area relative frequencies ................................................ 31
19: Transverse and Longitudinal orientations of void area relative frequencies ................ 32
20: Box and whisker showing void area distributions ................................................................ 33
21: Argon Shielded vs. Non-shielded Relative Void Frequency ............................................. 34
22: As-built no shielding gas macrostructure in transverse orientation at position 3
showing dendritic morphology .......................................................................................................... 35 23: As-built no shielding gas macrostructure in longitudinal orientation at position 11
showing dendritic morphology .......................................................................................................... 35
24: As-built with shielding gas macrostructure in transverse orientation at position 3 .... 36
25: As-built with shielding gas macrostructure in longitudinal orientation at position 11
..................................................................................................................................................................... 37
26: No HIP with shielding gas with HT transverse orientation at position 3 ....................... 38
27: No HIP with shielding gas with HT longitudinal orientation position 10 ..................... 38
28: No HIP no shielding gas with HT transverse orientation position 3 ............................... 39
29: With HIP with shielding gas no HT transverse orientation position 4 ........................... 40
30: With HIP with shielding gas no HT longitudinal orientation position 9 ....................... 41
31: With HIP with shielding gas with HT transverse orientation position 1........................ 42
32: With HIP with shielding gas with HT longitudinal orientation position 7 .................... 42
33: Ultimate tensile strength results compared to wrought properties ................................... 43

xi
34: Yield strength results compared to wrought properties ...................................................... 44
35: Elongation results compared to wrought properties ............................................................. 45
36: SN curve generated from the HCF results .............................................................................. 46
37: Lot 1 690 MPa HCF fracture surface ....................................................................................... 47
38: Lot 1 550 MPa HCF fracture surface ....................................................................................... 48
39: Orthographic surface plot of Lot 1 6890 MPa fracture surface ........................................ 49
40: Lot 3 690 MPa HCF fracture surface ....................................................................................... 50
41: Orthographic surface plot of Lot 3 690 MPa fracture surface .......................................... 50 42: As-built transverse orientation position 3 (a) vs HIP transverse orientation position 3
(b) ............................................................................................................................................................... 51
43: No-HIP with shielding gas no HT transverse orientation position 1 showing light
reflection indicating trapped gas ....................................................................................................... 52 44: SEM image of Inconel 718 feedstock powder mounted in resin and polished (cross-
section) [30] ............................................................................................................................................ 54

xii
List of Tables
Table 1: The Chemistry of Inconel 718 (%) [17] ........................................................................ 10
Table 2: Summary of Inconel alloy 718 phases ........................................................................... 11
Table 3: Heat Treatment Specifications for Inconel alloy 718 [17] ....................................... 15
Table 4: Deposition Parameters ........................................................................................................ 19
Table 5: Test matrix for the Inconel 718 specimens from DMG ............................................ 20
Table 6: HIP and HT parameters used on the specimens .......................................................... 21
Table 7: Macro mounting parameters ............................................................................................. 22
Table 8: Grinding and polishing parameters used ....................................................................... 24
Table 9: List of specimen types analyzed for void analysis ..................................................... 26
Table 10: Summary of tensile test results ...................................................................................... 45
Table 11: Summary of HCF results ................................................................................................. 46

xiii
Nomenclature
AM Additive Manufacturing
AMDE Advanced Manufacturing Demonstrator Engine
ASM American Society for Metals
ASTM American Society for Testing and Materials
BCT Body Centered Tetragonal
BPDLD Blown Powder Direct Laser Deposition
BPLD Blown Powder Laser Deposition
CAD Computer Aided Design
CNC Computer Numerically Controlled
DED Direct Energy Deposition
DMD Direct Metal Deposition
EBSD Electron Backscatter Diffraction
FCC Face Centered Cubic
GE General Electric
HCF High Cycle Fatigue
HIP Hot Isostatic Pressing
HT Heat Treat
LRE Liquid Rocket Engine
MMC Main Combustion Chamber
MSFC Marshall Space Flight Center
NASA National Aeronautics and Space Administration
PSD Particle Size Distribution
SLM Selective Laser Melting
SLS Selective Laser Sintering
SN Stress vs. number of cycles to failure
TEM Transmission Electron Microscopy
TTT Time-Temperature Transformation
UTS Ultimate Tensile Strength
UV Ultra Violet
YS Yield Strength

1
CHAPTER I
Introduction
Additive manufacturing (AM) has been gaining a lot of attention from multiple
industries around the world. A quick search of the word on a search engine returns hits
numbering from the tens of thousands to millions. AM technology is being used to print
components for use in applications ranging from the home do-it-yourselfers to aerospace
industries. This technology can be applied to various materials such as plastics, metals,
and ceramics. AM technology is even being used to print human organs [1].
One significant area of modern industry were AM is being used and researched is in
the aerospace field. Various aerospace companies including: General Electric (GE),
Boeing, Lockheed Martin, and the National Aeronautics and Space Administration
(NASA), are currently using AM technology [1]. The NASA-Marshall Space Flight Center
(MSFC) has recently demonstrated the capabilities of the technology by printing and
testing various liquid rocket engine (LRE) components including: a turbo pump, an
injector, an igniter, and a regeneratively cooled chamber [2-3].

2
1.1 Background and Motivation
Material selection is vital part of engineering design and fabrication. Without the
proper material for the application, even the best designs can fail to meet performance
expectations. Some of the most advanced engineering concepts have relied upon materials
that remain their strength in extreme environments. One example is the fabrication of the
RS-25 engine, or the Space Shuttle Main Engine, which used Inconel alloy 718 for
structural integrity of the main combustion chamber (MCC) [4]. Since Inconel alloy 718
retains its high strength at elevated temperatures, in addition to resisting corrosion, it is
used in a wide variety of applications ranging from rocket engine components and jet
turbines to nuclear reactor components.
The technologies used to process materials are an important element in manufacturing.
Utilizing advanced manufacturing technologies is critical to the ability of the NASA to
produce launch vehicles for space exploration [5]. As new technologies become available,
their ability to reduce the cost of fabrication continues to be explored in an effort to make
space exploration more affordable. When considering the fabrication of LREs, many
components are designed with current manufacturing technologies in mind such as
conventional subtractive machining. AM is changing the way designers and engineers
think about component manufacturing by enabling new designs with geometries and
features that were traditionally very expensive or near impossible to manufacture. AM
also allows printing monolithic components that would otherwise be traditionally
manufactured as multiple pieces requiring assembly or welding. One example of this is a
shrouded rocket turbomachinery impeller. Figure 1 shows an unshrouded (a) versus a

3
shrouded (b) impeller where it can be seen that machining a monolithic shrouded impeller
would be very difficult due to the shroud covering up the complex geometry of the fluid
flow channels. This type of LRE pump component can be designed to operate at speeds as
high as 90,000 RPM and pump cryogenic propellants [6]. One traditional method of
manufacturing this type of impeller is to subtractively machine the impeller, and then braze
on a shroud [7]. With AM, engineers now have the option to deposit the impeller as a
single monolithic piece.
Figure 1: Unshrouded (a) vs Shrouded Impeller (b) [8]
Another example of how AM is reducing time of manufacturing with more
monolithic deposited components is the NASA Additive Manufacturing Demonstrator
Engine (AMDE) project. This program is designed to gather data on the ability of AM to
reduce the time and cost of rocket engine development [9]. Figure 2 shows the engine
being developed for this project and reduction in the part count achieved by using AM as
compared to traditional subtractive manufacturing techniques.
(a) (b)

4
The individual components on this demonstrator engine are small enough to be built
in a powder bed. Currently the largest production powder bed AM machine gives a build
box of approximately 800 x 400 x 500 mm3 (31.5 x 15.7 x 19.7 in3) [10].
Figure 3 illustrates the range in size of LRE and their components. While the powder bed
process has shown great potential for reducing the part count for complex assemblies, it is
currently limited in size for these larger scale LRE components.
Figure 2: Liquid Rocket Engine (LRE) being developed under the AMDE
program showing reduced part count achieved using AM vs conventional
subtractive manufacturing [9]

5
An alternative to size limited powder bed techniques is the use of direct metal
deposition (DMD) processing. DMD techniques are not confined to a box but utilize either
robotic or computer numerical control (CNC) platforms to directly deposit the metal. RPM
Innovations, Inc. out of Rapid City, South Dakota, USA has a DMD machine with a 1.5m
x 1.5m x 2.1m (5ft x 5ft x 7ft) work envelope. Another company, DM3D out of Auburn
Hills, Michigan USA, has a robotic arm DMD system that offers a 3.2m x 3.7m x 360
degrees (10.5ft x 12.1ft x 360 degrees) work envelope.
The objective of this study is to characterize the mechanical properties of Inconel
718 specimens deposited using a DMD process. The specimens deposited for this study
were performed on a DMG MORI Lasertec 4300 prototype machine at their Advanced
Solutions Department in Hoffman Estates, Illinois, USA. After deposition, these
Figure 3: Overview of various liquid rocket engines (LRE) showing typical nozzle exit diameters [34]
6
specimens were heat treated (HT) and then machined for testing. Representative samples
were also prepared for metallurgical evaluation including grain size and void content.
1.2 Overview of Additive Manufacturing
The creation of tools have been a vital part of humanity’s survival and quality of life
from as far back as 2.6 million years ago during the Paleolithic age and is still just as vital
present day [11]. With the invention of machines and more advanced tools to aid in
manufacturing, processes can be categorized into three main categories: forming,
machining, and casting. On March 11th, 1986 a patent was published that added a fourth
category to aid in manufacturing. An Inventor by the name of Charles W. Hull filed a
patent with the United States Patent office entitled, “Apparatus for production of three-
dimensional (3D) objects by stereolithography” [12]. It was this invention that led to the
development of AM in plastics, followed later by metals. Initially the AM process utilized
photopolymerization by which an ultraviolet (UV) laser is focused into a vat of
photopolymer resin to cure the resin. The laser follows the path generated by slicing a 3-
dimensional (3D) computer aided design (CAD) model. As each cross-sectional slice of
the 3D component is cured, a new layer of resin is added and the process repeats. It is this
repetitive layer wise curing that leads to the creation of a 3D part.
AM was expanded to include metals in the mid 1997 when inventors Wilhelm Meiners,
Konrad Wissenbach, and Andres Gasser filled a patent with the United States Patent Office
entitled, “Selective laser sintering at melting temperature” [13]. Their invention, illustrated
7
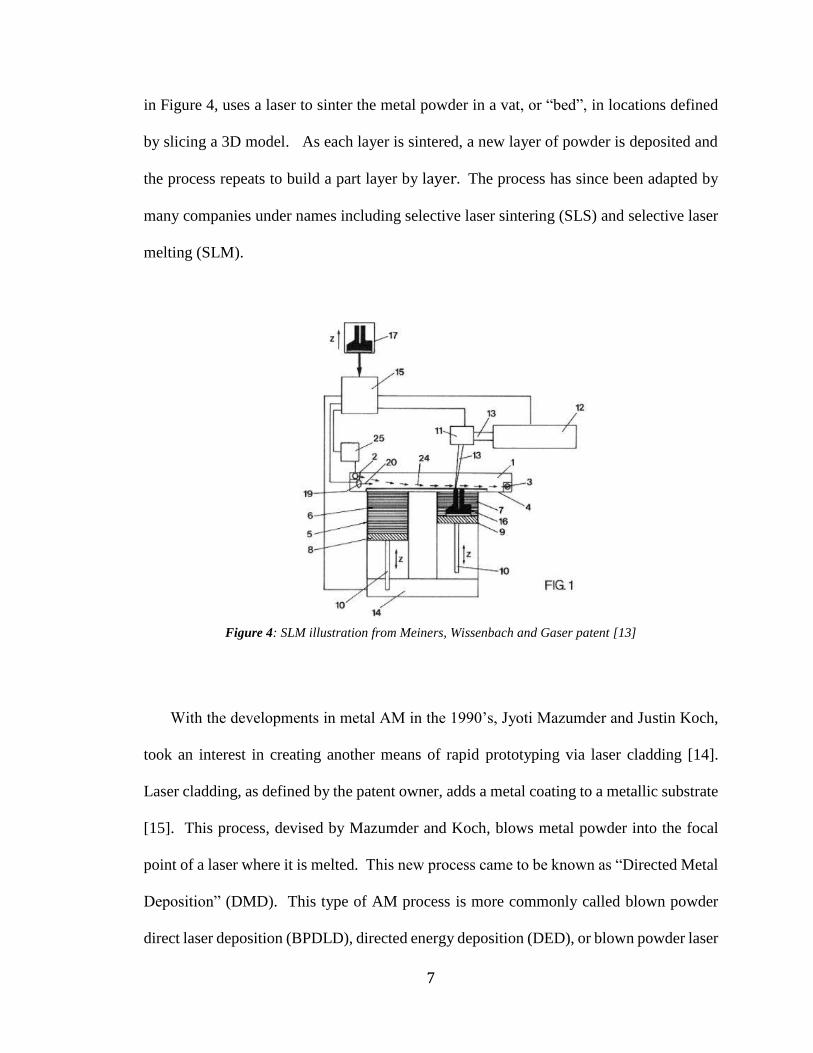
in Figure 4, uses a laser to sinter the metal powder in a vat, or “bed”, in locations defined
by slicing a 3D model. As each layer is sintered, a new layer of powder is deposited and
the process repeats to build a part layer by layer. The process has since been adapted by
many companies under names including selective laser sintering (SLS) and selective laser
melting (SLM).
Figure 4: SLM illustration from Meiners, Wissenbach and Gaser patent [13]
With the developments in metal AM in the 1990’s, Jyoti Mazumder and Justin Koch,
took an interest in creating another means of rapid prototyping via laser cladding [14].
Laser cladding, as defined by the patent owner, adds a metal coating to a metallic substrate
[15]. This process, devised by Mazumder and Koch, blows metal powder into the focal
point of a laser where it is melted. This new process came to be known as “Directed Metal
Deposition” (DMD). This type of AM process is more commonly called blown powder
direct laser deposition (BPDLD), directed energy deposition (DED), or blown powder laser
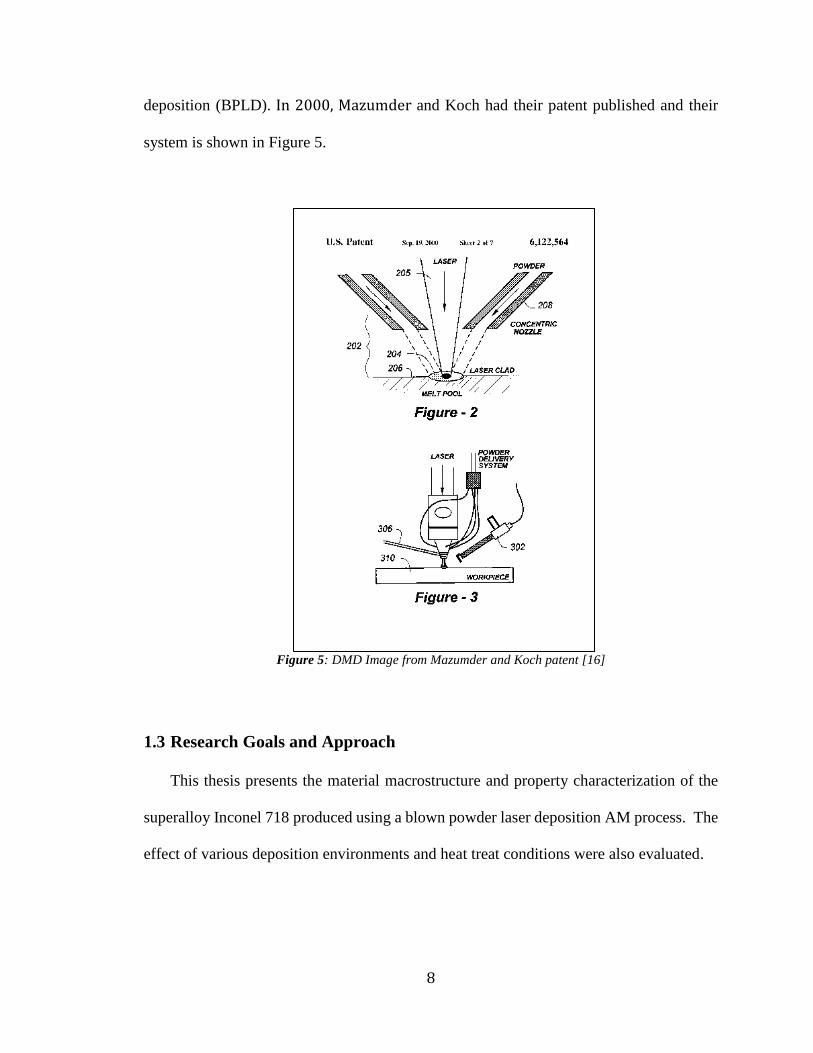
8
deposition (BPLD). In 2000, Mazumder and Koch had their patent published and their
system is shown in Figure 5.
Figure 5: DMD Image from Mazumder and Koch patent [16]
1.3 Research Goals and Approach
This thesis presents the material macrostructure and property characterization of the
superalloy Inconel 718 produced using a blown powder laser deposition AM process. The
effect of various deposition environments and heat treat conditions were also evaluated.

9
With the growing interest in the utilization of AM to manufacture components, the
relationship between the macrostructure and mechanical properties must be understood to
guide safe engineering design practices. The material characterization and properties
undertaken in this study is representative of, but not limited to, the information needed to
support design and modeling efforts by industry to better understand the resulting material
properties of AM processes.

10
CHAPTER II
Literature Review
2. 1 Inconel 718 Overview
Inconel alloy 718 is a precipitation strengthened austenitic nickel (Ni) based super
alloy. It is primarily used in applications where retention of strength is needed at high
temperatures or in corrosive environments, or a combination of the two. Table 1
summarizes the elemental composition of Inconel 718 and Table 2 summarizes the phases
present and their chemical formula.
Table 1: The Chemistry of Inconel 718 (%) [17]
Nickel (Ni) 50.00 – 55.00
Chromium (Cr) 17.00 – 21.00
Iron (Fe) Balance
Niobium (Nb) 4.75 – 5.50
Molybdenum (Mo) 2.80 – 3.30
Titanium (Ti) 0.65 – 1.15
Aluminum (Al) 0.20 – 0.80
Cobalt (Co) 1.00 Max
Carbon (C) 0.08 Max
Manganese (Mn) 0.35 Max
Silicon (Si) 0.35 Max
Phosphorus (P) 0.015 Max
Sulfur (S) 0.015 Max
Boron (B) 0.006 Max
Copper (Cu) 0.30 Max
11
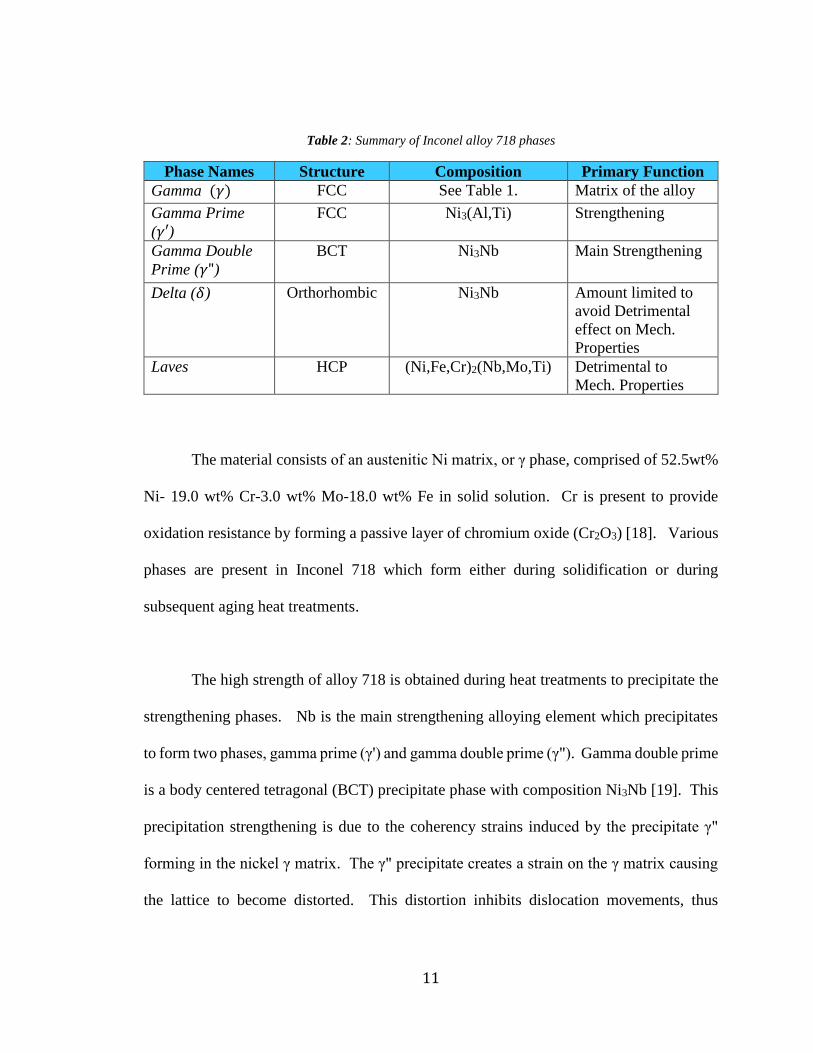
Table 2: Summary of Inconel alloy 718 phases
Phase Names Structure Composition Primary Function
Gamma (𝛾) FCC See Table 1. Matrix of the alloy
Gamma Prime
(𝛾′) FCC Ni3(Al,Ti) Strengthening
Gamma Double
Prime (𝛾")
BCT Ni3Nb Main Strengthening
Delta (𝛿) Orthorhombic Ni3Nb Amount limited to
avoid Detrimental
effect on Mech.
Properties
Laves HCP (Ni,Fe,Cr)2(Nb,Mo,Ti) Detrimental to
Mech. Properties
The material consists of an austenitic Ni matrix, or γ phase, comprised of 52.5wt%
Ni- 19.0 wt% Cr-3.0 wt% Mo-18.0 wt% Fe in solid solution. Cr is present to provide
oxidation resistance by forming a passive layer of chromium oxide (Cr2O3) [18]. Various
phases are present in Inconel 718 which form either during solidification or during
subsequent aging heat treatments.
The high strength of alloy 718 is obtained during heat treatments to precipitate the
strengthening phases. Nb is the main strengthening alloying element which precipitates
to form two phases, gamma prime (γ') and gamma double prime (γ"). Gamma double prime
is a body centered tetragonal (BCT) precipitate phase with composition Ni3Nb [19]. This
precipitation strengthening is due to the coherency strains induced by the precipitate γ"
forming in the nickel γ matrix. The γ" precipitate creates a strain on the γ matrix causing
the lattice to become distorted. This distortion inhibits dislocation movements, thus

12
increasing the strength of the material [20]. Figure 6 shows the γ" precipitates (white) in
the γ matrix (black).
Identification of the primary strengthening phase has been questioned in the
literature and evolved over the years of research [20 - 22]. A parallel was found between
the identification of the main strengthening phase and the advancements in testing
equipment and procedures. Literature in the mid 1960’s and earlier state that the primary
strengthening phase was the γ' Ni3(Al,Ti) phase. Eiselstein analyzed the residue left from
electrolytic dissolving of a specimen using X-ray diffraction which revealed a face centered
cubic (FCC) crystalline structure. The residue was then analyzed chemically and the age
hardening precipitate was identified as γ' [21].
Figure 6: Micrograph of γ” precipitates (white) in γ matrix (black) [21]
13
Later work suggests that the γ", a BCT structure, is the primary strengthening
mechanism and can be detected via x-ray diffraction and transmission electron microscopy
(TEM) dark field analysis [20] [22]. The advancement in testing equipment and
technologies appear to advance the understanding of the material. It is also worth noting
that the γ' phase has been found to strengthen the material as well but at a lesser amount
due to the smaller volume fraction of 4% in comparison to the 15% of γ" [20].
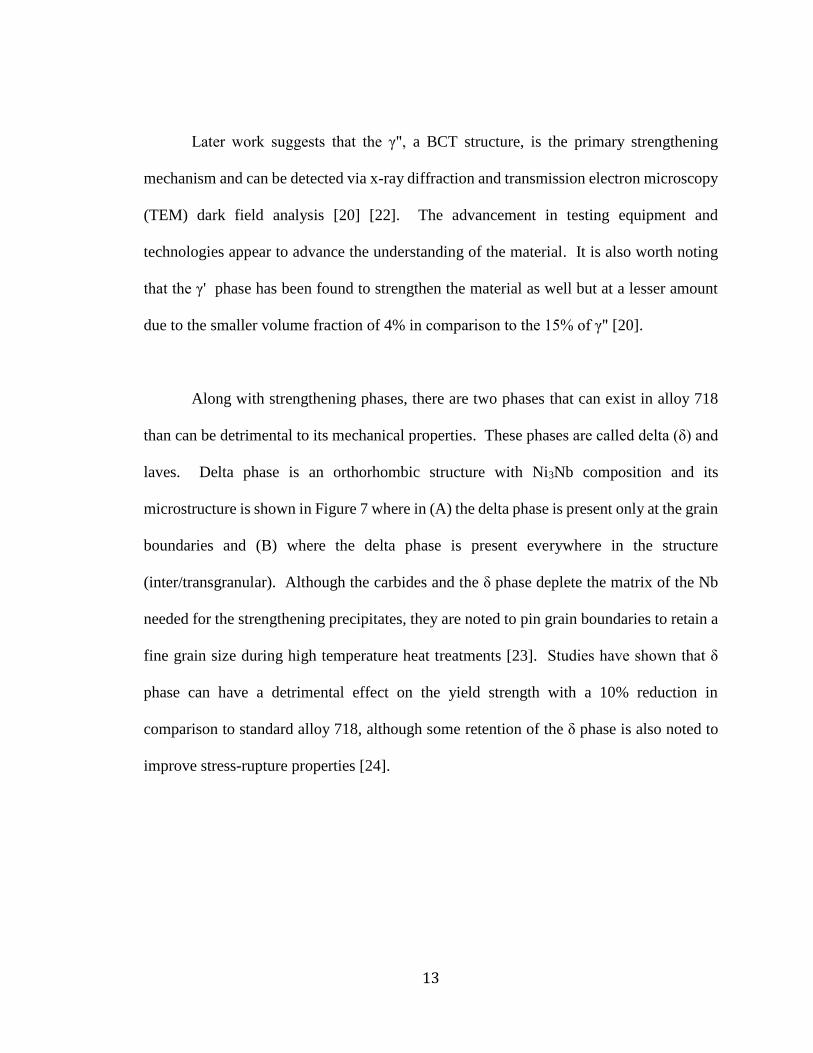
Along with strengthening phases, there are two phases that can exist in alloy 718
than can be detrimental to its mechanical properties. These phases are called delta (δ) and
laves. Delta phase is an orthorhombic structure with Ni3Nb composition and its
microstructure is shown in Figure 7 where in (A) the delta phase is present only at the grain
boundaries and (B) where the delta phase is present everywhere in the structure
(inter/transgranular). Although the carbides and the δ phase deplete the matrix of the Nb
needed for the strengthening precipitates, they are noted to pin grain boundaries to retain a
fine grain size during high temperature heat treatments [23]. Studies have shown that δ
phase can have a detrimental effect on the yield strength with a 10% reduction in
comparison to standard alloy 718, although some retention of the δ phase is also noted to
improve stress-rupture properties [24].
14
The major detrimental phase on the mechanical properties of the alloy is the Laves
phase. Laves is a brittle intermetallic hexagonally closed packed structure with
(Ni,Fe,Cr)2(Nb,Mo,Ti) composition. The mechanical properties of alloy 718 can be
reduced by Laves phase in several ways. The most dominant being the fracture of the
phase due to its inherent brittleness. This phase also depletes the matrix of Nb needed to
precipitate the alloy’s strengthening phases. Laves is usually a result of segregation
occurring during solidification, although it can also form in solid state [25]. Figure 8 shows
scanning electron microscopy (SEM) images microstructure of Laves phase forming at the
core of the dendrites.
Since Inconel 718 is precipitation strengthened, it is referred to as a heat treatable
alloy. There are several standard heat treatment for this particular alloy. Table 3 lists
several of the heat treatment standards for various applications in which a customer can
Figure 7: Delta phase macrostructure with optical microscopy [23]

15
directly purchase the material in a variety of forms. Note that all these forms consist of
Inconel 718 in the wrought form in which it has been mechanically worked prior to heat
treatment.
Table 3: Heat Treatment Specifications for Inconel alloy 718 [17]
Standard Product Annealing temperature range
AMS 5596 Sheet, Strips, and Plates
927-1010℃ Anneal and Age AMS 5662 &
5663
Bars, Forgings, and Rings
AMS 5589 Seamless Tubing
AMS 5664 Bars, Forgings, and Rings
1038-1066℃ Anneal and Age AMS 5597 Sheet, Strips, and Plates
AMS 5590 Seamless Tubing
NACE MR 0175 Oil Field Applications
Figure 8: Laves Microstructure [33]

16
Heat treatments are critical for alloy 718 to reach its full strength potential. Figure
9 shows a time-temperature-transformation (TTT) curve of Inconel 718. Both γ' and γ" are
metastable, transforming into δ at temperatures in excess of 650°C (1200°F) which limits
its high temperature usage [26]. Laves phase has been reported to form at temperatures in
excess of 980°C (1800°F) [25].
Figure 9: TTT diagram of Inconel 718 [26]
2.2 Additive Manufacturing
AM is defined by the American Society for Testing and Materials (ASTM) standard
F2792 as, “A process of joining materials to make objects from 3D model data, usually
layer upon layer, as opposed to subtractive manufacturing methodologies. ”
17
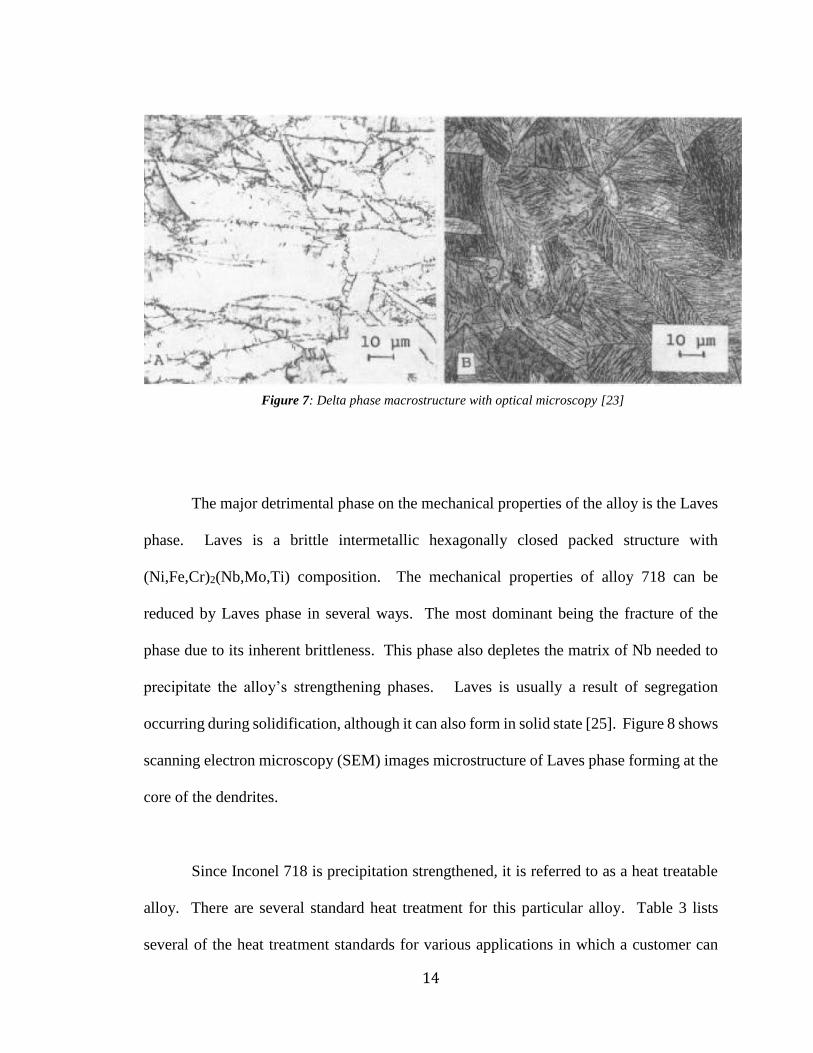
Directed energy deposition is a blown powder type AM process in which a stream
of flowing powder is focused into the focal point of a laser and melted onto a substrate.
Figure 10 illustrates this process and its components. The powder is delivered from a
hopper by an inert carrier gas and into a nozzle. The nozzle acts as the delivery vessel in
which the powder is focused to a set point above the substrate material. A conical style
nozzle is illustrated in this scenario. The laser beam is focused to the same point as the
powder in order to melt the powder in order to start the deposition process.
Powder and Laser Focus point
Powder Passages
Deposited Material
Substrate Material
Coaxial Nozzle
Figure 10: DMD Process and components
18
CHAPTER III
Experimental Procedure
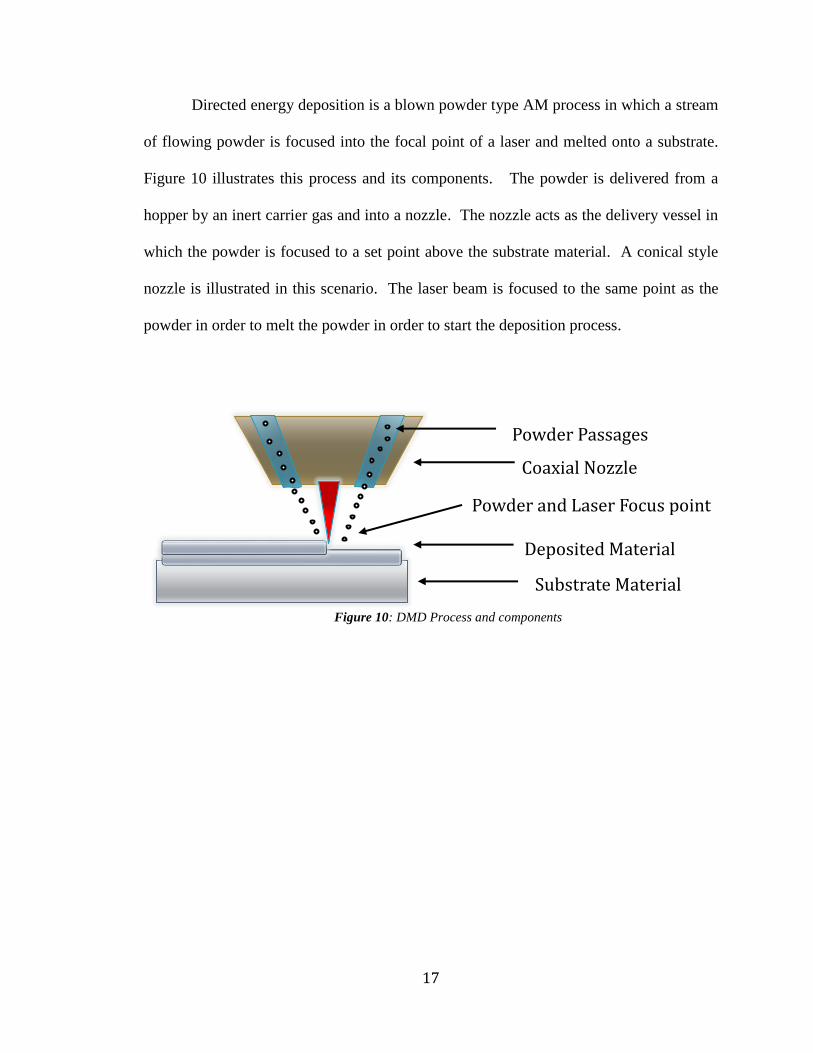
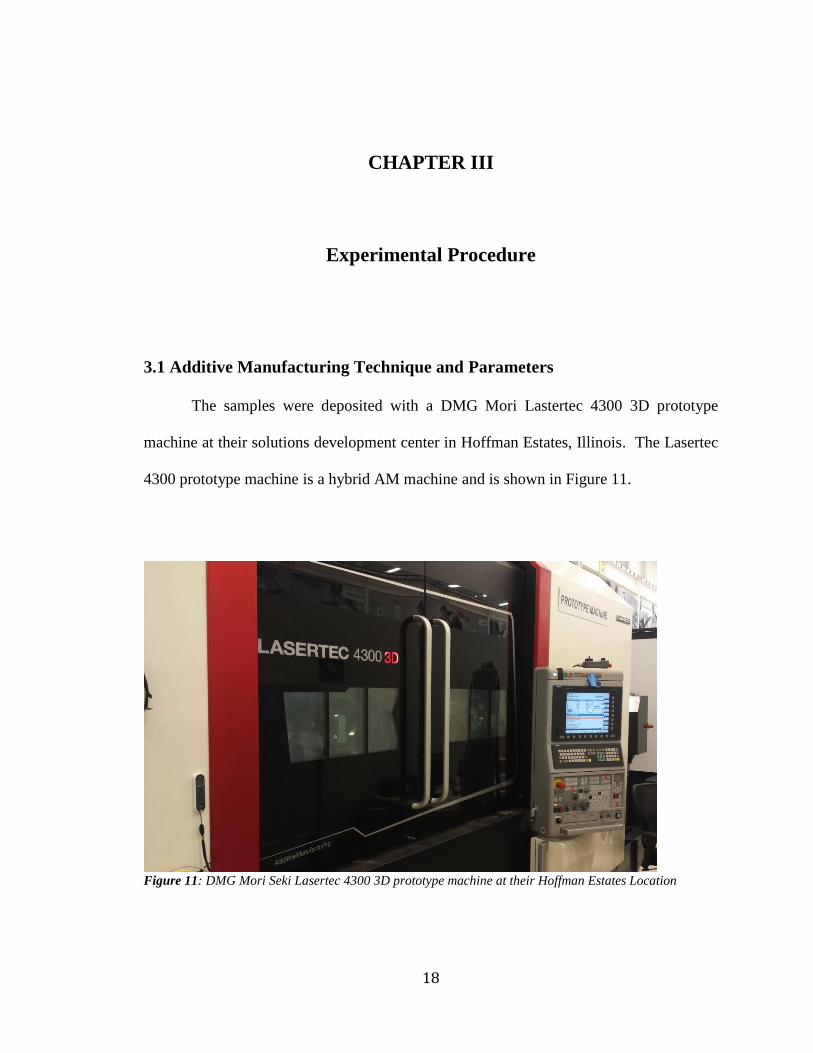
3.1 Additive Manufacturing Technique and Parameters
The samples were deposited with a DMG Mori Lastertec 4300 3D prototype
machine at their solutions development center in Hoffman Estates, Illinois. The Lasertec
4300 prototype machine is a hybrid AM machine and is shown in Figure 11.
Figure 11: DMG Mori Seki Lasertec 4300 3D prototype machine at their Hoffman Estates Location

19
The term hybrid means that the machine has the capability to perform traditional
subtractive machining and AM all in one machine. The Lasertec prototype is a turn mill
CNC platform with a blown powder deposition head added. The machine was equipped
with a 2000W Laserline diode laser system, a custom in house manufactured powder
nozzle, and an Oerlikon Metco dual powder hopper feeder.
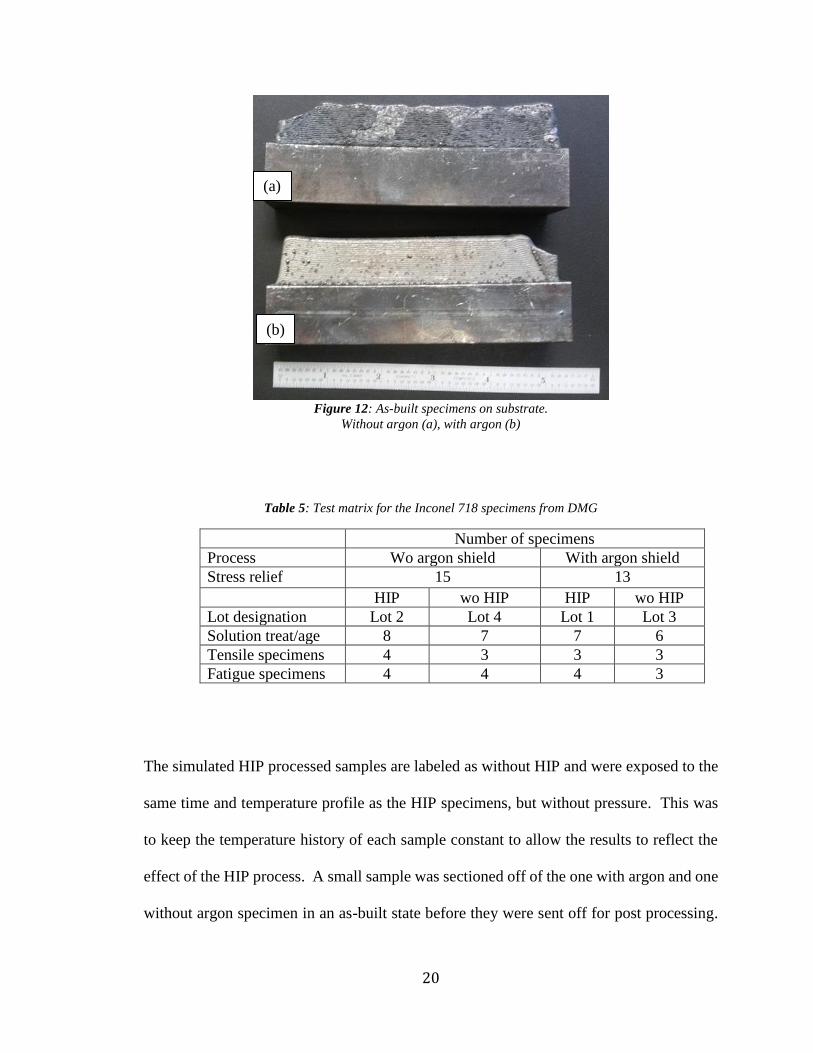
Rectangular prism shaped Inconel 718 samples, as shown in Figure 12 were
deposited onto 1045 steel substrates. Table 4 shows the parameters used to perform the
deposition of these samples. A total of 28 samples were deposited for this study using
Micro-Melt® 718 powder with average size of 100 m (-140+325M). These powders
were produced by argon gas atomization.
Table 4: Deposition Parameters
Deposition Parameters
Laser Power 1550 W
Laser spot size 4 mm
Powder Feed Rate 30 g/min
Layer Height 0.85 mm
The test matrix is shown in Table 5 which lists the samples, their heat treatment conditions,
and tests conducted. When depositing these samples, some were deposited with the argon
shielding and others without to investigate the effect on the material properties. The post
processing of these samples included stress relief, hot isostatic pressing (HIP), simulated
HIP process, followed by solution and aging heat treatments.
20
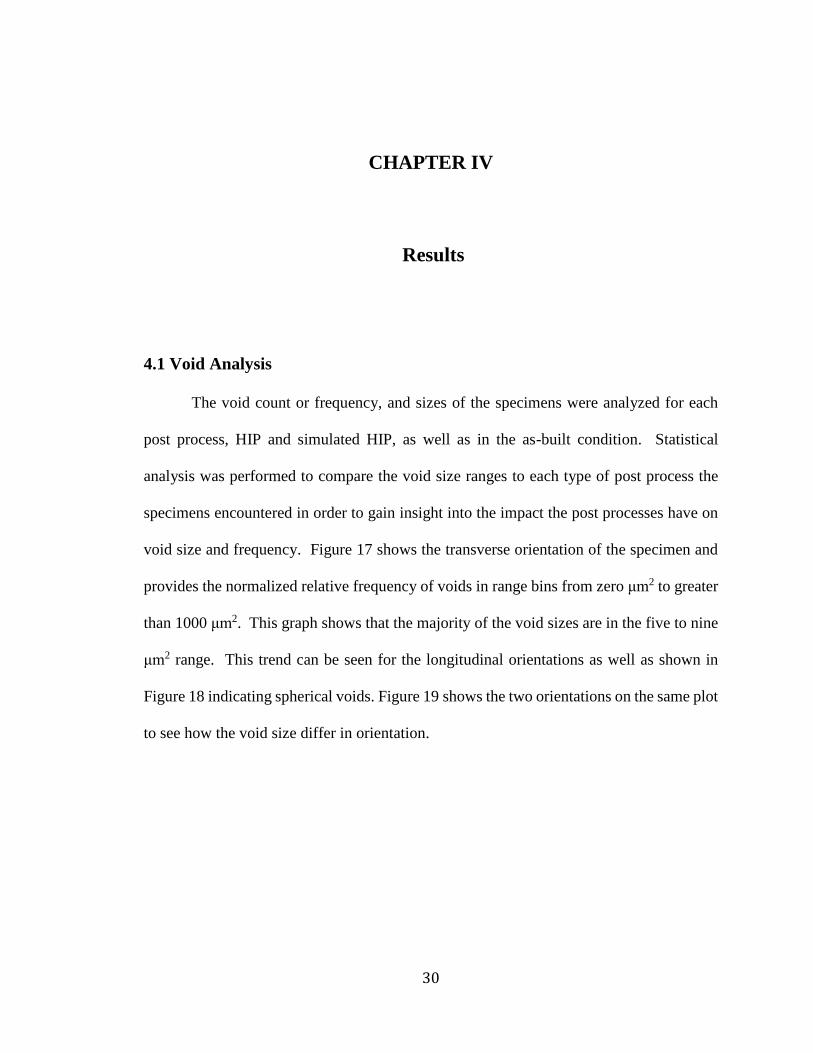
Table 5: Test matrix for the Inconel 718 specimens from DMG
Number of specimens
Process Wo argon shield With argon shield
Stress relief 15 13
HIP wo HIP HIP wo HIP
Lot designation Lot 2 Lot 4 Lot 1 Lot 3
Solution treat/age 8 7 7 6
Tensile specimens 4 3 3 3
Fatigue specimens 4 4 4 3
The simulated HIP processed samples are labeled as without HIP and were exposed to the
same time and temperature profile as the HIP specimens, but without pressure. This was
to keep the temperature history of each sample constant to allow the results to reflect the
effect of the HIP process. A small sample was sectioned off of the one with argon and one
without argon specimen in an as-built state before they were sent off for post processing.
(b)
(a)
Figure 12: As-built specimens on substrate.
Without argon (a), with argon (b)

21
This was done to enable the comparison of the HIP and HT specimens to as-built conditions
so that any effects the shielding gas may have on the material can be analyzed during void
analysis and metallography.
3.2 Heat Treatments
The specimens were machined into cylinders prior to heat treatment in accordance
with the American Society for Metals (ASM) standard 5664. Although not in ASM 5664,
additional steps of SR and HIP were added to the heat treatment. In processing of AM
components, a stress relief cycle is usually implemented to reduce residual stresses that
could distort the part. A HIP process is used to reduce voids inherent in the process. As
noted in Table 5, not all of the samples went through the HIP process prior to the HT. The
ones that did not undergo HIP used a simulated HIP process using the same temperature
and time profile, but without the pressure. Table 6 lists the HIP and HT parameters used
on the specimens. Note where the environment could not be controlled, the specimens
were wrapped in stainless steel foil to minimize oxidation. As the cylinders were processed,
specimens were retained after each step of the HTs to allow metallographic
characterization to document macrostructural changes.
Table 6: HIP and HT parameters used on the specimens
Stress Relief: 1066°C ± 14°C for 90 minutes -5 ± 15 minutes, inert atmosphere
HIP: 1121°C to 1163°C for 4 hours ± 1 hour, 102 ± 2 MPa, cool in inert
atmosphere to below 427°C
Solution Treat: 1066°C ± 14°C for 1 hour in inert atmosphere, cool at a rate of air
cooling or faster
Aging: 760°C ± 8°C for 10 hours ± 0.5 hour, furnace cool to 649°C ± 8°C
and hold until total aging time is 20 hours, furnace cool

22
3.3 Metallographic Preparation
All the specimens were sectioned for metallography using a Buehler Abrasimet 250
saw and Allied blades. The sections were mounted in Allied black phenolic mounting
powder (#135-10007) using a Simplimet 1000 automatic mounting press machine with
parameters shown in Table 7.
Table 7: Macro mounting parameters
Specimen Mounting Parameters
Heat Time 1 min
Cool Time 5 min
Pressure 4100 psi
Temperature 120°F to 360°F in 20°F Increments
The samples were cut in two orientations to show the transverse (1-6) and
longitudinal (7-12) orientations of the build as illustrated in Figure 13. The mounted
specimens were ground and polished using a Struers Tegramin-20 automatic grind
and polisher. Silicon Carbide (SiC) papers and Alumina (Al2O3) powders were used per
the parameters listed in Table 8. Images were taken of the as-polished specimens for an
analysis of the void content.

23
Figure 13: Cut plan and picture locations of the two orientations studied
After imaging for the void analysis, the specimens were etched using waterless
Kalling’s to reveal the macrostructure. Prior to etching, each sample was freshly polished
with the same final polishing parameters from before to remove the passivation layer. After
polishing, the specimens were immediately rinsed with water and then isopropyl alcohol
followed by a quick drying with heated air before going into the etchant. The process time
of cleaning off the polishing compound after the fresh polish and getting the sample into
the etchant took less than ten seconds. A submerge and swab technique was used to etch
the samples. The swabbing was done with a cotton swab. Each sample was etched for a
total of three minutes with swabbing every 30 seconds.

24
Table 8: Grinding and polishing parameters used
Microscopy Grind and Polish Parameters
Grit Paper/Pad Force
[N]
Time
[min]
Head &
Table
Speed
[RPM]
Table
Rotation
Direction
Water Flow
Initial
Grind
240 SiC 20 3 150/300 Counter
Rotating
Heaviest
laminar
stream
2nd
Grind
600 SiC 20 3 150/150 Co-
Rotating
Smallest
steady
laminar
stream
3rd
Grind
800 SiC 20 3 150/150 Co-
Rotating
Smallest
steady
laminar
stream
4th
Grind*
1200 SiC 20 3 150/150 Co-
Rotating
Smallest
steady
laminar
stream
1st
Polish
1 μm Final A pad
with Al2O3
20 6 150/150 Co-
Rotating
~ 1 drip/sec
Final
Polish
0.5
μm
Final A pad
with Al2O3
20 6 150/150 Co-
Rotating
~ 1 drip/sec
* Preformed this grind twice, changing the pad each time.
3.4 Void analysis
An evaluation was done to determine if the microscope magnification selected
would bias the void analysis due to their resolution of certain size voids and field of view
effects on void count. Images were taken of the un-etched samples. Images of an as-built
and a HIP processed specimen were compared to investigate the effects on void density
frequencies taken over a range of magnifications. Six images of each transverse and
longitudinal orientation at the same relative locations of both samples, as seen in Figure
13, were taken at 5x, 10x, and 20x magnification using a Zeiss Vert A1 light microscope.

25
The images were analyzed using Image J, an image processing software, to identify the
void count and size of each void detected from 4 pixels in size up to infinity. The void size
frequencies were normalized and each magnification compared to one another as shown in
Figures 14. The 10x magnification was chosen after reviewing the results based on range
of sizes and count of voids that were detected.
Figure 14: Normalized void size frequencies
Each of the ten samples listed in Table 9 had both transverse and longitudinal
orientations imaged in relatively the same location. The locations on the macros that the
images were taken are shown in Figure 13.
0%
10%
20%
30%
40%
50%
60%
0-4 5-9 10-14 15-19 20-24 25-29
Re
ali
tiv
e F
req
ue
ncy
Bin Range (μm2)
Normalized Data ComparisonVoid Area (μm2)
5x
10x
20x
Objective

26
Table 9: List of specimen types analyzed for void analysis
Void Analysis Specimens
As built with Argon Shield
As Built without Argon Shield
With HIP with Argon Shield
With HIP without Argon Shield
With HIP with Argon Shield with Heat treat
With HIP without Argon Shield with Heat treat
Without HIP with Argon Shield
Without HIP without Argon Shield
Without HIP with Argon Shield with Heat treat
Without HIP without Argon Shield with Heat treat
The macro layout shown in Figure 13 from section 3.4 show locations 1 through 6 are the
transverse orientation and 7 through 12 are the longitudinal orientation. Image J software
was utilized to aid in the count and sizing of the voids in the specimens.
3.5 Macrostructure Characterization
After completing the void analysis, the specimens were etched as discussed in
section 3.4. Images of the specimens were taken using a Zeiss Vert A1 light microscope.
Representative macrostructures from those listed in Table 9 were imaged in the
longitudinal and transverse orientations as shown in Figure 13. Images and findings are
discussed later in the results section 4.2.

27
3.6 Tensile Testing
Samples were machined at NASA MSFC into round sub-sized specimens in
compliance with ASTM E8 as shown in Figure 15.
Figure 15: Round sub-sized tensile specimen mechanical drawing
There were four kinds of samples tested as summarized in Table 4. Half the samples used
argon purge during the build. Of these, half of each subsequently went through a HIP
process. All 28 samples were SR and subsequently HT per ASM 5664.
The tensile axis of the specimens was aligned with the build plane (X-Y). All
tensile tests were conducted on an Instron 5985 electro-mechanical machine. Stress
measurements were based on loads obtained from the machines 250 kN load cell and
specimen dimension measurements. All tests were run in displacement control at a
constant crosshead velocity of 0.00196 mm/min (0.050 in/min) in accordance with ASTM
standard E8.

28
3.7 High Cycle Fatigue Testing
Out of the 28 total samples that were deposited for this study, 15 were machined at
NASA Marshall Space Flight Center in compliance with ASTM E466 to be high cycle
fatigue (HCF) tested as summarized in Table 4. The specimen geometry is shown in
Figure 16.
Figure 16: High cycle fatigue specimen mechanical drawing
The samples were designated to “Lots” to designate whether they had an argon purge
during the build and whether they went through a HIP cycle. All 28 samples were SR and
subsequently HT per ASM 5664.
The HCF testing was performed on a MTS Landmark servo-hydraulic machine
equipped with a 100kN load cell. The HCF tests were run in axial force control at 10 Hz
with R = 0.1 in a room temperature environment. The stress levels tested were 689.5 MPa,
551.6 MPa, and 275.8 MPa. These test values were chosen based from the tensile results

29
to not exceed the yield strength of the material and to also attempt a life time endurance
measurement.
Fracture surfaces of all HCF specimens were imaged using a Keyence VHX-6000
system. This optical microscope has a large depth-of-field to obtain 3D images in addition
to the height measurements.
30
CHAPTER IV
Results
4.1 Void Analysis
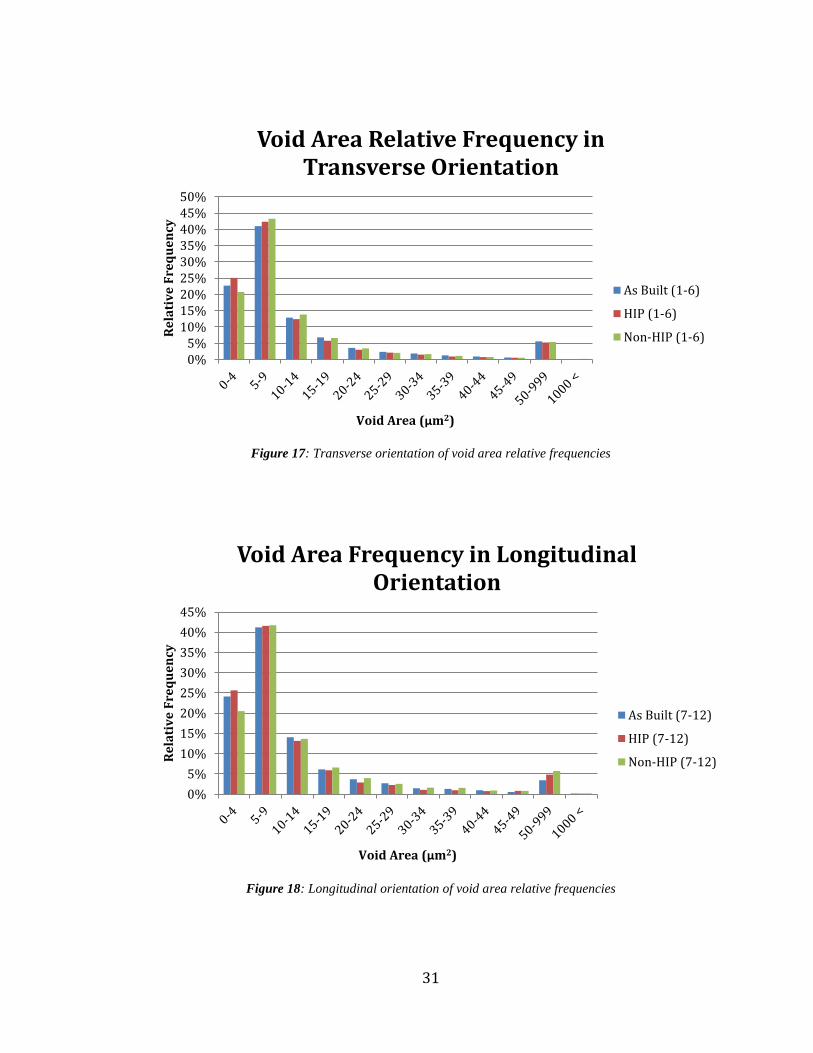
The void count or frequency, and sizes of the specimens were analyzed for each
post process, HIP and simulated HIP, as well as in the as-built condition. Statistical
analysis was performed to compare the void size ranges to each type of post process the
specimens encountered in order to gain insight into the impact the post processes have on
void size and frequency. Figure 17 shows the transverse orientation of the specimen and
provides the normalized relative frequency of voids in range bins from zero μm2 to greater
than 1000 μm2. This graph shows that the majority of the void sizes are in the five to nine
μm2 range. This trend can be seen for the longitudinal orientations as well as shown in
Figure 18 indicating spherical voids. Figure 19 shows the two orientations on the same plot
to see how the void size differ in orientation.
31
Figure 17: Transverse orientation of void area relative frequencies
Figure 18: Longitudinal orientation of void area relative frequencies
0%5%
10%15%20%25%30%35%40%45%50%
Re
lati
ve
Fre
qu
en
cy
Void Area (μm2)
Void Area Relative Frequency in Transverse Orientation
As Built (1-6)
HIP (1-6)
Non-HIP (1-6)
0%
5%
10%
15%
20%
25%
30%
35%
40%
45%
Re
lati
ve
Fre
qu
en
cy
Void Area (μm2)
Void Area Frequency in Longitudinal Orientation
As Built (7-12)
HIP (7-12)
Non-HIP (7-12)

32
Figure 19: Transverse and Longitudinal orientations of void area relative frequencies
As shown, the void sizes do not seem to be affected by orientation as each of the
orientations, when comparing like samples, only differ within 3% of each other except in
the 0-4µm2 range where there is a 5% difference between the non-HIP longitudinal
specimens and the longitudinal specimens that underwent HIP. This graph also shows that
the majority of the voids in the samples analyzed are in the five to nine micrometer range.
Further statistical analysis was performed in order to gain better insight into the effects of
the post processes on the void sizes. Figure 20 shows a box and whisker distribution of the
void’s areas in each orientation.
0%
5%
10%
15%
20%
25%
30%
35%
40%
45%
50%
Re
lati
ve
Fre
qu
en
cy
Void Area (μm2)
Void Area Relative Frequencies
As Built (1-6)
As Built (7-12)
HIP (1-6)
HIP (7-12)
Non-HIP (1-6)
Non-HIP (7-12)

33
Figure 20: Box and whisker showing void area distributions
It can be seen that the samples that have gone through the HIP process show a smaller
mean area and overall smaller size distribution in comparison to as-built and the simulated
HIP specimens. It is interesting to note that the as-built mean size and HIP mean void sizes
are very similar.
As summarized in Table 5, some of the specimens analyzed were deposited with
Argon shielding gas and some without. The void size and relative frequency of the shielded
vs. non-shielded specimens were statistically analyzed to see if there were any differences
in the voids that may be attributed by the shielding gas. As shown in Figure 21, the void
sizes and frequencies appear to be within 5% of each other in every bin.

34
Figure 21: Argon Shielded vs. Non-shielded Relative Void Frequency
4.2 Metallography
Metallography analysis of the as-built macrostructure show that the macrostructure
has a large portion of dendritic formations in it. These dendritic formations are irregular
throughout each position of both orientations and can be seen highlighted within the yellow
circle of Figure 22. This dendritic macrostructure is seen in both orientations of the as-
built samples. Figure 23 shows the as-built sample in the longitudinal orientation.
0%
5%
10%
15%
20%
25%
30%
35%
40%
45%R
ela
tiv
e F
req
uen
cy
Void Area (µm2)
Void Area Relative Frequency of Argon Shielded vs Non-
Shielded Specimen Deposition
No Argon
With Argon

35
Figure 22: As-built no shielding gas macrostructure in transverse orientation at position 3 showing
dendritic morphology
Figure 23: As-built no shielding gas macrostructure in longitudinal orientation at position 11 showing
dendritic morphology

36
When comparing the two previous images which were deposited without argon shielding
gas to the macrostructure of a sample that was deposited with the shielding gas, the
macrostructure appears different. Figure 24 and Figure 25 show images of the
macrostructure from the same position as Figure 22 and Figure 23 but on samples deposited
with argon shielding gas.
Figure 24: As-built with shielding gas macrostructure in transverse orientation at position 3
Comparing the images, it can be seen that there is a significant difference in the
macrostructure especially in the longitudinal orientation. There appears to be a reduction
in the dendritic morphology in the macrostructure when the samples were deposited with
the shielding gas.
37
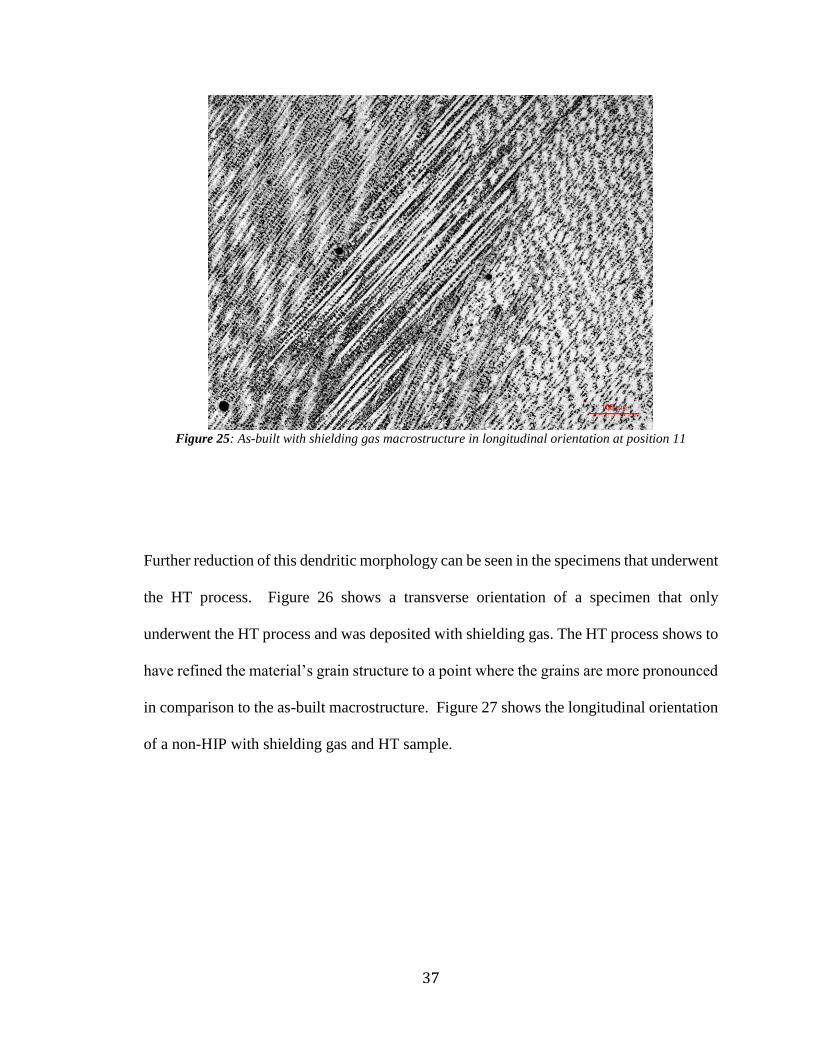
Figure 25: As-built with shielding gas macrostructure in longitudinal orientation at position 11
Further reduction of this dendritic morphology can be seen in the specimens that underwent
the HT process. Figure 26 shows a transverse orientation of a specimen that only
underwent the HT process and was deposited with shielding gas. The HT process shows to
have refined the material’s grain structure to a point where the grains are more pronounced
in comparison to the as-built macrostructure. Figure 27 shows the longitudinal orientation
of a non-HIP with shielding gas and HT sample.

38
Figure 26: No HIP with shielding gas with HT transverse orientation at position 3
Figure 27: No HIP with shielding gas with HT longitudinal orientation position 10

39
The images would suggest that grain refinement has taken place as a result of the HT
process in the specimens. When comparing the non-HIP samples that underwent HT and
were deposited with shielding gas to those that underwent the same post processing but
were deposited without shielding gas, negligible differences were observed with the
macrostructure. Figure 28 shows a non-HIP with HT and deposited without shielding gas.
Figure 28: No HIP no shielding gas with HT transverse orientation position 3
Other than the cracks that are evident in the image, the appearance of the
macrostructure is comparable to that of the ones that were deposited with shielding gas.
Some samples were processed with HIP only. A representative image of the
macrostructure of those samples can be seen in Figure 29.

40
Figure 29: With HIP with shielding gas no HT transverse orientation position 4
Without the HT, it can be seen that he grain structure is not as defined in the transverse
orientation as those in in HT samples. Although, in the longitudinal orientation, there is
some grain refinement. Figure 30 shows the grain structure that formed as a result of the
HIP process.

41
Figure 30: With HIP with shielding gas no HT longitudinal orientation position 9
The dendritic structure as seen prominent in the as-built macrostructure has been reduced
after the HIP and HT processes.
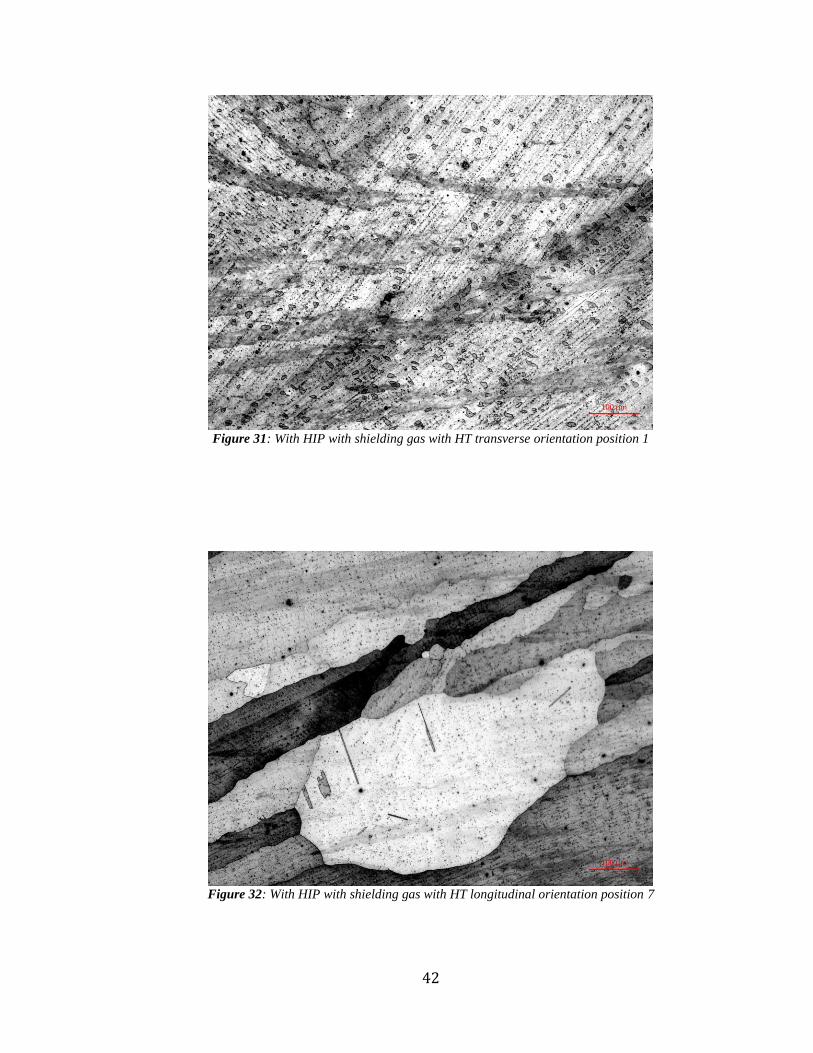
The specimens that went through the HIP and heat treatment show the same
reduction of the dendritic morphology as seen in the HIP only specimens. Figure 31 shows
disperse circular structures scattered throughout the image. The longitudinal orientation
shows more pronounced grain structure and less of the circular structures observed in
Figure 32.
42
Figure 31: With HIP with shielding gas with HT transverse orientation position 1
Figure 32: With HIP with shielding gas with HT longitudinal orientation position 7

43
4.3 Tensile Testing
Samples with different post and build processes were tensile tested to evaluate their
mechanical properties. The Ultimate Tensile Strength (UTS), yield strength (YS) and
elongation results are shown in Figures 33, 34, and 35 respectively. Each plot compares
the different processed specimens against the reported wrought properties [17].
Figure 33: Ultimate tensile strength results compared to wrought properties
The results show that the HIP process combined with argon shielding gas are close to near
net wrought strength properties. The samples without the HIP process and that were
deposited without shielding gas produced the lowest UTS after testing.
The yield strength of the material after testing shows again that the samples that
were deposited with the shielding gas and underwent HIP as part of the HT process have a
greater yield strength then the other samples, comparable to wrought properties [17].
1050
1100
1150
1200
1250
1300
UT
S (
MP
a)
Ultimate Tensile Strength
With Hip No Argon
With HIP With Argon
No HIP No Argon
No HIP With Argon
Wrought

44
Figure 34: Yield strength results compared to wrought properties
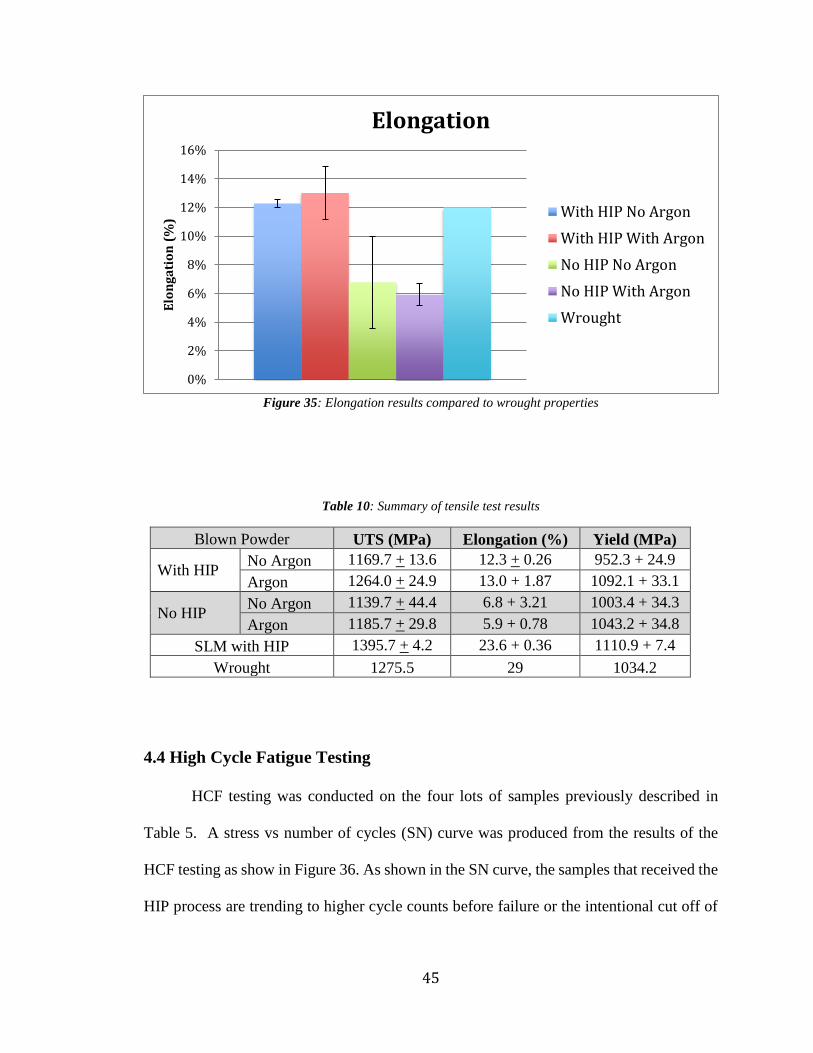
The elongation results of the material are shown in Figure 35. The samples that did
not go through the HIP post process have a reduction of about 6% in elongation in
comparison to the samples that did receive the HIP post process. The use of Argon purge
during the build did not appear to affect the elongation. The samples that received the HIP
post process show elongation results in line with wrought properties from the literature.
850
900
950
1000
1050
1100
1150
Yie
ld (
MP
a)
Yield Strength
With HIP No Argon
With HIP With Argon
No HIP No Argon
No HIP With Argon
Wrought
45
Figure 35: Elongation results compared to wrought properties
Table 10: Summary of tensile test results
Blown Powder UTS (MPa) Elongation (%) Yield (MPa)
With HIP No Argon 1169.7 + 13.6 12.3 + 0.26 952.3 + 24.9
Argon 1264.0 + 24.9 13.0 + 1.87 1092.1 + 33.1
No HIP No Argon 1139.7 + 44.4 6.8 + 3.21 1003.4 + 34.3
Argon 1185.7 + 29.8 5.9 + 0.78 1043.2 + 34.8
SLM with HIP 1395.7 + 4.2 23.6 + 0.36 1110.9 + 7.4
Wrought 1275.5 29 1034.2
4.4 High Cycle Fatigue Testing
HCF testing was conducted on the four lots of samples previously described in
Table 5. A stress vs number of cycles (SN) curve was produced from the results of the
HCF testing as show in Figure 36. As shown in the SN curve, the samples that received the
HIP process are trending to higher cycle counts before failure or the intentional cut off of
0%
2%
4%
6%
8%
10%
12%
14%
16%
Elo
ng
ati
on
(%
)
Elongation
With HIP No Argon
With HIP With Argon
No HIP No Argon
No HIP With Argon
Wrought
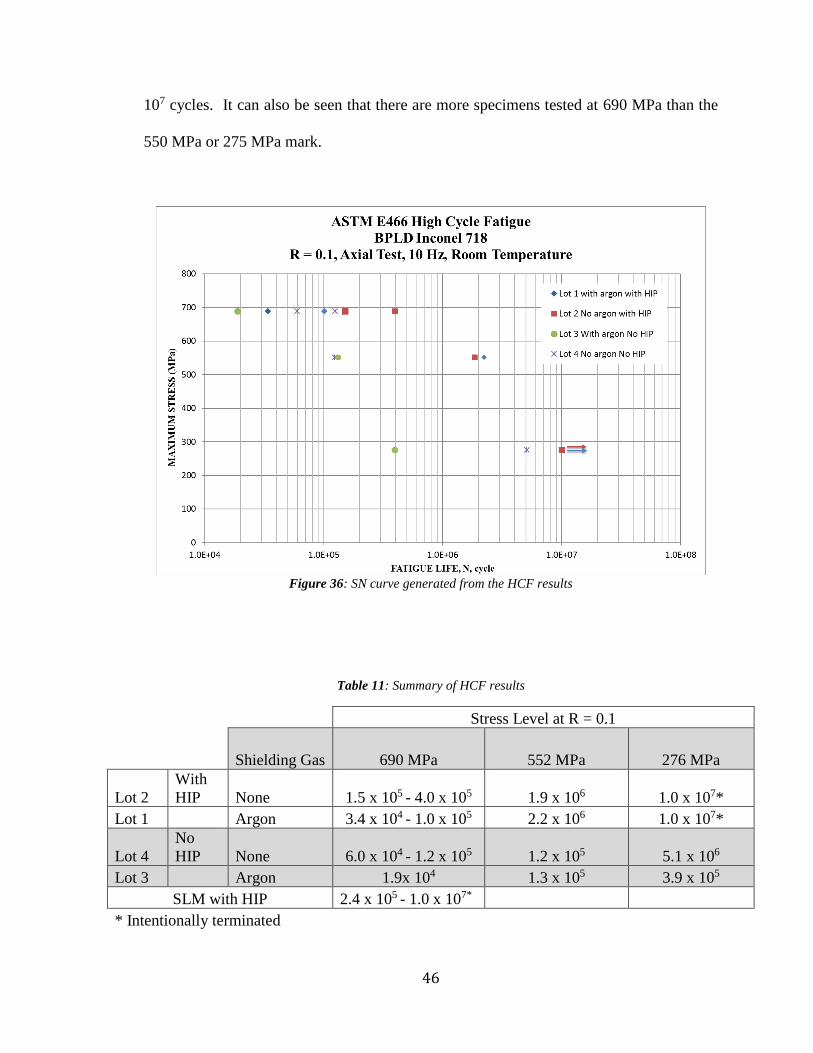
46
107 cycles. It can also be seen that there are more specimens tested at 690 MPa than the
550 MPa or 275 MPa mark.
Figure 36: SN curve generated from the HCF results
Table 11: Summary of HCF results
Stress Level at R = 0.1
Shielding Gas 690 MPa 552 MPa 276 MPa
Lot 2
With
HIP None 1.5 x 10⁵ - 4.0 x 10⁵ 1.9 x 10⁶ 1.0 x 10⁷*
Lot 1 Argon 3.4 x 10⁴ - 1.0 x 10⁵ 2.2 x 10⁶ 1.0 x 10⁷*
Lot 4
No
HIP None 6.0 x 10⁴ - 1.2 x 10⁵ 1.2 x 10⁵ 5.1 x 10⁶
Lot 3 Argon 1.9x 10⁴ 1.3 x 10⁵ 3.9 x 10⁵
SLM with HIP 2.4 x 10⁵ - 1.0 x 10⁷*
* Intentionally terminated

47
The decision was made to use the samples that were to be tested at the 415 MPa
mark and test them at 690 MPa due to the Lot 1 sample tested failing at around where the
non-HIP samples did. With the limited number of samples to test it was important to gain
more confidence in the HIP process specimen’s trends after seeing the other stress levels
trends.
When looking at the Lot 1 HIP samples and comparing the 690 MPa stress level to
the 550 MPa level, the two fracture surfaces seem very similar in appearance. Figure 37
and 38 show the fracture surfaces of specimens built with argon shielding and underwent
the HIP process that were cycled at 690 MPa and 550 MPa, respectively.
Figure 37: Lot 1 690 MPa HCF fracture surface

48
Figure 38: Lot 1 550 MPa HCF fracture surface
The small black dots scattered on the surfaces of Figures 37 and 38 are voids in the material
from the deposition process. The surfaces have a jagged topology indicative of a
moderately ductile failure. Figure 39 shows an orthographic view of the fracture surface
of a specimen that was deposited with argon shielding gas, underwent the HIP process, and
tested at the 690 MPa stress state.
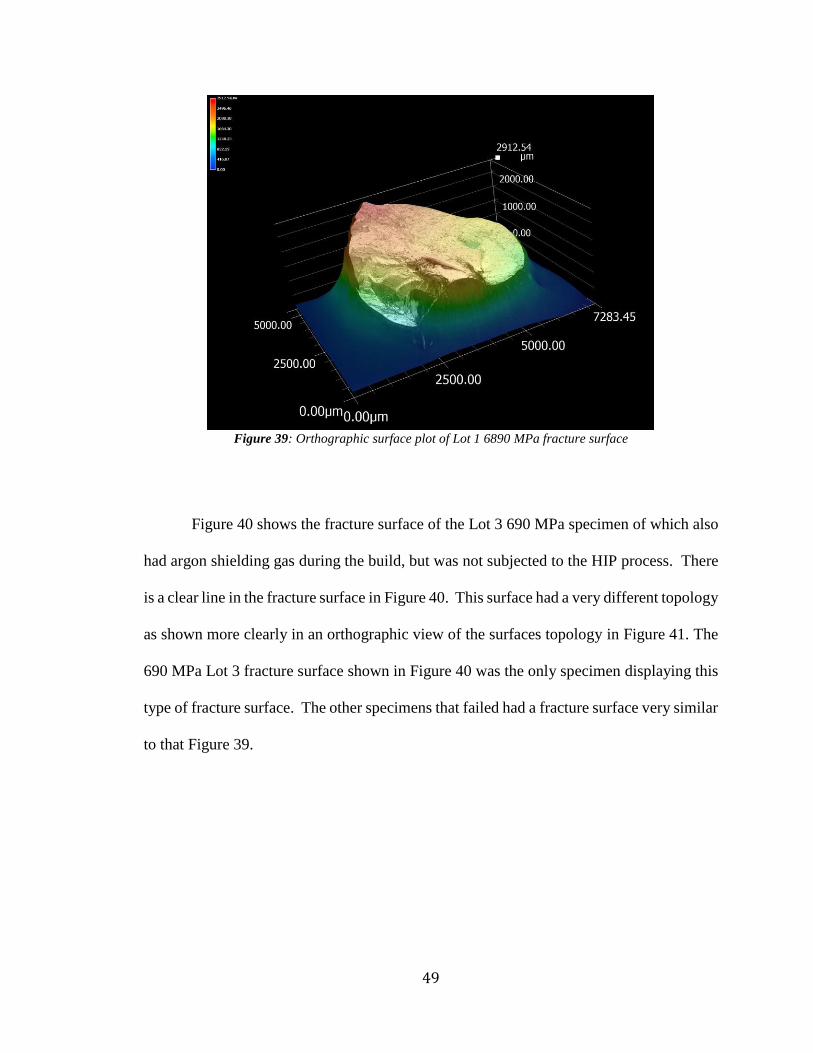
49
Figure 39: Orthographic surface plot of Lot 1 6890 MPa fracture surface
Figure 40 shows the fracture surface of the Lot 3 690 MPa specimen of which also
had argon shielding gas during the build, but was not subjected to the HIP process. There
is a clear line in the fracture surface in Figure 40. This surface had a very different topology
as shown more clearly in an orthographic view of the surfaces topology in Figure 41. The
690 MPa Lot 3 fracture surface shown in Figure 40 was the only specimen displaying this
type of fracture surface. The other specimens that failed had a fracture surface very similar
to that Figure 39.

50
Figure 40: Lot 3 690 MPa HCF fracture surface
Figure 41: Orthographic surface plot of Lot 3 690 MPa fracture surface

51
CHAPTER V
Discussion
5.1 Void Analysis
The void analysis of all the specimens analyzed show that roughly 43% of the void
sizes are in the range of 5 to 9µm2. The analysis also shows that there is a reduction in
void size when the specimens go through a HIP post process. Figure 42 coincides with
what the statistical data shows that there is a reduction of void size with the specimens that
underwent HIP when comparing to the as-build specimens.
Figure 42: As-built transverse orientation position 3 (a) vs HIP transverse orientation position 3 (b)
a b.

52
While there is a reduction in void size for the specimens that underwent the HIP
post process, there is a slight enlargement to the void sizes in the specimens that only
underwent the HT post-process. It can be seen in Figure 20 that the non-HIP specimens,
which went through the HT only, show a 10% increase in their median void sizes. It is
speculated that the increase in the void size for these specimens is related to the expansion
of trapped gas inside the voids. This speculation was drawn from investigating the void
analysis images. It can be seen in Figure 43 that some of the voids have what appears to
be white spots in the bottom center. This is the reflection of light from the microscope and
means that the void has a relatively smooth interior. Voids with smooth interior surfaces
typically result from trapped gas. These reflections have been reported to correlate with
the presence of trapped gas [27].
Figure 43: No-HIP with shielding gas no HT transverse orientation position 1 showing light reflection
indicating trapped gas

53
To explore the sources of trapped gas in the specimens, the void sizes and relative
frequencies of the samples that were deposited with and without argon shielding gas were
analyzed. Figure 21 shows about a 5% difference between the void sizes in the shielded
vs. un-shielded specimens, thus it doesn’t appear that gas shielding is related to the voids
observed. It has been reported in the literature that argon gas can become trapped in the
powder stock itself due to the atomization process used to manufacture the powders [28-
29]. The size of the void in Figure 43 was measured to determine if the powder used could
have contained trapped gas as a result of the gas atomization manufacturing process of the
powder. The void size in Figure 43 was 26µm in diameter. Thus it is feasible that this
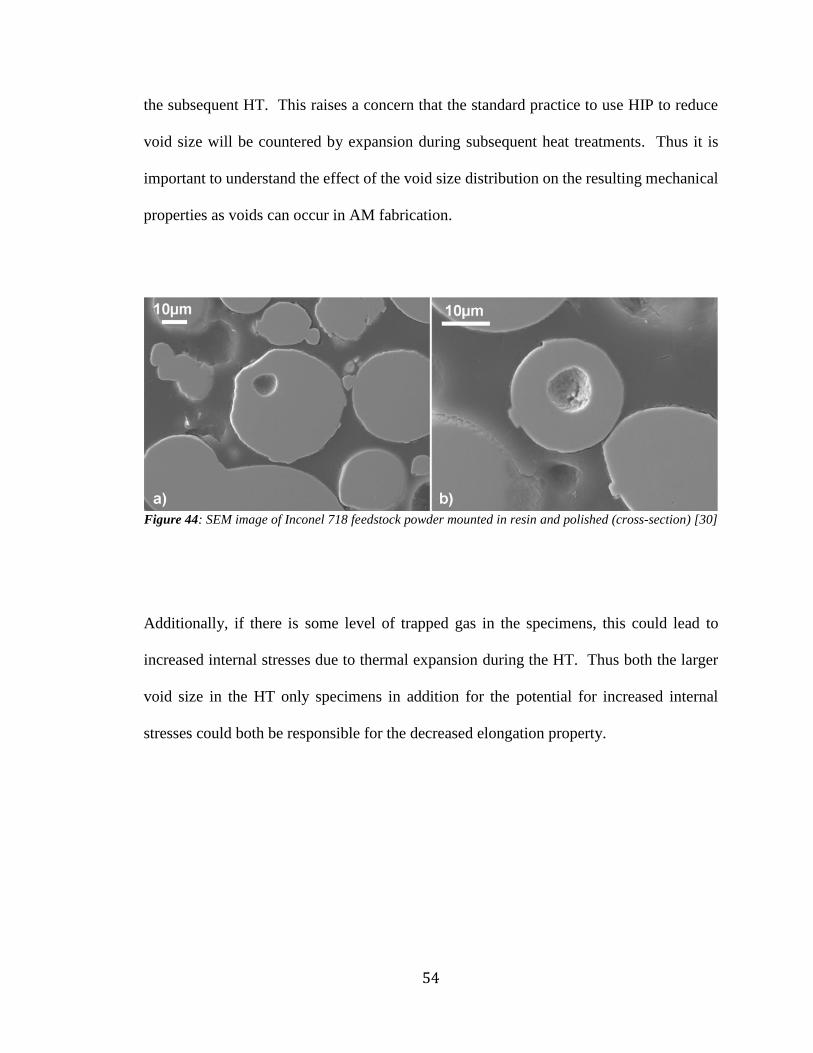
void could result be from trapped gas in the starting powder feedstock. As shown in Figure
44, SEM images of mounted and polished Inconel 718 feedstock from the literature show
interior voids roughly 10µm in diameter which are believed to contain argon. Figure 44
(a) shows the results of the author’s investigations and that voids were already in the
powder feedstock. Figure 44 (b) also show that the spherical voids in the feedstock
powders can be different sizes where in some cases 38.6 vol.-% of the powder particle is
hollow [30]. The powder size used for the deposition of the specimens in this study ranged
from 46 to 106µm in diameter. With this larger powder size distribution (PSD) relative to
ones used in SLM (15 to 56 µm), there is greater potential for the feedstock to contain
voids due to the increased surface area [31]. Knowing that any gas trapped inside a void
would expand during HT, this gas expansion is believed to be related to the increase in size
after the HT process without HIP. Thus it is believed that the void from Figure 43 is most
likely due to trapped gas inherent in the argon gas atomized feedstock used. Voids in the
specimens that had undergone HIP most likely were decreased in size and then grew during
54
the subsequent HT. This raises a concern that the standard practice to use HIP to reduce
void size will be countered by expansion during subsequent heat treatments. Thus it is
important to understand the effect of the void size distribution on the resulting mechanical
properties as voids can occur in AM fabrication.
Figure 44: SEM image of Inconel 718 feedstock powder mounted in resin and polished (cross-section) [30]
Additionally, if there is some level of trapped gas in the specimens, this could lead to
increased internal stresses due to thermal expansion during the HT. Thus both the larger
void size in the HT only specimens in addition for the potential for increased internal
stresses could both be responsible for the decreased elongation property.

55
5.2 Macrostructure
The as-built macrostructure of the specimens show a predominant dendritic
morphology in both orientations of the build. This dendritic morphology is reduced in the
specimens that underwent the HIP and other HT processes, even though the processing
time and temperatures were held constant. It is also interesting to note that the specimens
deposited with argon shielding gas also had reduced dendrite morphology. This could be
due to the quenching effect of the argon which would result in faster solidification.
Following the HT processes, evidence of the grain structure becomes more pronounced.
5.3 Mechanical Properties
The tensile testing results show that the effects of not using argon shielding gas can
have adverse effects on the material properties of the specimens. The specimens that were
deposited with shielding gas and received the HIP post process have improved material
properties when comparing across the specimens to the wrought published properties.
When analyzing the elongation however, there was a ~5 to 6% drop in elongation of the
non-HIP specimens in comparison to the ones that received the HIP post process. It is
speculated that this drop in elongation is due to the increased void size of the specimens
who only went through the HT post process. Void analysis shows that the void size
increased in the specimens who only went through the HT post process. This increase in
void size could be the cause of the drop in elongation due to its effects of reducing the
effective total area inside the material. The results of the tensile testing also show that the

56
specimens that were deposited with the argon shielding gas and when through the HIP and
HT post process have strength, yield, and elongation properties that are on par with those
of published wrought material.
It has been shown in the literature that the particle size distribution (PSD) may play
a factor in the mechanical properties of components processed with a BPLD system. The
material’s mechanical properties can vary with PSD in SLM processed components and
results from experiments show that a narrower PSD shows significant improvements to
both mechanical properties and surface finish [31-32]. However, it should be noted that the
powder size used for manufacturing the material specimens for this study were larger than
that typically used in SLM. So, the presented comparison between the mechanical
properties of the samples manufactured by BPLD and SLM does not consider the effect of
PSD on mechanical properties.
The results of the HCF test show a trend that specimens who have received the HIP
post process have longer cyclic lives than those which did not receive the HIP post process.
57
CHAPTER VI
Conclusions The following conclusions regarding the material characterization of Inconel alloy 718 can
be drawn from the results and discussion chapters 4 and 5 respectfully prior to these
conclusions.
1. Void analysis shows that the HIP post process causes a 4% reduction in void size,
while the specimens who only underwent HT showed an increase of 5% in void
size when compared to as-built specimens.
2. The as-built macrostructure of the material has predominant dendritic morphology
in both the transverse and longitudinal orientations. These dendritic structures are
reduced and the material’s grains start to become defined after the HT processes.
3. The ultimate strength, yield strength, and elongation of the specimens that had
undergone HIP as part of the HT process, have material properties that are on par
with wrought properties published.

58
4. Use of argon shielding in the fabrication of the specimens also had higher UTS and
YS, but not much change in the elongation.
5. Elongation of specimens that did not undergo HIP were roughly 6% lower than the
specimens that did undergo HIP and wrought properties.
6. Some of the voids in the specimens were observed to have smooth interior surfaces
as shown by the reflection of light from the microscope during imaging. Smooth
interiors usually result from trapped gas which could result from the gas shielding
or initial feedstock. Review of the void size and relative frequencies of the argon
shielded vs. non-shielded specimens did not show a correlation. However, since
voids have been reported in the literature for larger argon atomized powder
feedstock, this is believed to have persisted during AM processing and is related to
the voids observed.
7. It is speculated that the drop in the elongation property of the HT only specimens
correlates with the larger void size. In addition, expansion of trapped gases within
these voids could also increase the internal stresses. Statistical data shows the
mean average void size of the HT only specimens is 10% larger than that of the
HIP specimens and 7% larger than that of the as-built specimens.

59
8. The HCF data starts to show a trend that suggests that the specimens that underwent
HIP have a higher cycle count before failure in comparison to the specimens that
did not receive the HIP post process.
9. The blown powder metal laser deposition or DMD AM process is a very feasible
process for the manufacturing of larger components in comparison to SLM build
box sizes. The review of the material properties in this thesis that came off a
prototype machine with early development build parameters shows great potential
for improvement and coupled the process’s larger build box, DMD is a great tool
for the AM toolbox.
60
CHAPTER VII
Future Work
Although using light microscopy is generally a good first step into being able to
characterize a material, it is limited in the depth of resolution needed to make definitive
conclusions on what is being seen. More in depth microscopy such as with the use of a
transmission electron microscope (TEM) and x-ray diffraction would be the next steps to
take in order to better understand and characterize the material and definitively record the
phases present with this process. Also using techniques such as Electron Backscatter
Diffraction (EBSD) could be used with in situ heating to study the transformations in the
material such as, recrystallization and precipitate formation. The knowledge gained from
this study could aid in the understanding of the microstructural evolution of the material
and by knowing how the material behaves at certain temperatures, the data could be used
to aid in improved deposition parameters.
With only a limited number of samples in which to fatigue test, more specimens to
HCF test would be great in order to draw more definitive conclusions about the trends of
the material’s behavior when comparing the post processes. Early on with the HCF testing
it was seen that some of the HIP specimens failed with cycle times that were fewer than
those that did not receive the HIP post process at higher stress states. This finding caused

61
the samples that were slated for 413.7 MPa testing to be used at 689.5 MPa in order to gain
more data points at this higher stress state in the attempt to gain more insight into why
some HIP specimens failed before the non-HIP specimens. With groups such as the
turbomachinery designers as NASA Marshall Space Flight Center developing turbo pumps
that exceed 90,000 rpm and are made with AM processes, more HCF data could potentially
give those designers better design limitations in order to refine their designs. More in depth
fracture surface analysis could also aid in determining any effects that void sizes had on
the material during fatigue testing and potentially aid in better deposition parameters.
Powder characterization such as particle morphology, PSD, density, and flowability
would be a great follow up study to this thesis. BPLD typically uses larger powder sizes
than that of SLM and seeing as the PSD has effects on the mechanical properties, density,
and surface roughness of SLM processed components, experiments looking into the effects
of PSD on BPLD would lead to knowing whether or not BPLD is affected by the varying
sizes and if so, how.
Finally, with the roughly 6% reduction in elongation between the HIP and the HT
only specimens during tensile testing, an investigation into why the reduction took place
would be beneficial. After reviewing images that showed there was gas trapped in some
of the voids and researching its effects on mechanical properties as well as how other AM
process suffered due to varying PSDs, determining if one or both had effects on the material
would be beneficial to future studies.
62
References
[1] L. E. Murr, "Frontiers of 3D Printing/Additive Manufacturing_From Human Organs to Aircraft Fabrication," Journal of Materials Science & Technology, vol. 32, no. 10, pp. 987-995, 2016.
[2] [Online]. Available: https://www.nasa.gov/sites/default/files/files/3.pdf. [Accessed 26 November 2016].
[3] [Online]. Available: https://gcd.larc.nasa.gov/about/space-technology-roadmap/#.Vs4Lwc_2aic. [Accessed 25 2 2016].
[4] [Online]. Available: https://www.nasa.gov/centers/marshall/news/news/releases/2015/successful-nasa-rocket-fuel-pump-tests-pave-way-for-3-d-printed-demonstrator-engine.html. [Accessed 10 12 2017].
[5] P. S. J. Nowacki, "Producibility of brazed high-dimension centrifugal compressor impellers," Journal of Materials Processing Technology, vol. 133, no. 1-2, pp. 174-180, 2003.
[6] "Rotech Pumps & Systems Inc.," [Online]. Available: http://www.rotechpumps.com/basic-differences-between-open-and-closed-impellers-in-centrifugal-pumps. [Accessed 4 2 2018].
[7] [Online]. Available: https://ntrs.nasa.gov/archive/nasa/casi.ntrs.nasa.gov/20160006986.pdf. [Accessed 28 12 2017].
[8] [Online]. Available: https://www.concept-laser.de/en/products/machines.html. [Accessed 3 1 2018].

63
[9] I. Torre, "The origins of stone tool technology in Africa: a historical perspective," Philosophical Transactions: Biological Sciences, vol. 366, no. 1567, pp. 1028-1037, 2011.
[10] C. W. Hull, "Apparatus for production of three-dimensional objects by stereolithography". USA Patent 4575330 A, 11 March 1986.
[11] W. Meiners, K. Wissenbach and A. Gasser, "Selective Laser Sintering at Melting Temperature". USA Patent 6215093 B1, 27 October 1997.
[12] J. Mazumder, D. Dutta, N. Kikuchi and A. Ghosh, "Closed loop direct metal deposition: art to part," Optics and Lasers in Engineering, vol. 34, no. 4-6, pp. 397-414, 2000.
[13] N. B. Livsey, "Application of mettalic coatings to metallic substrates". USA Patent 4269868 A, 25 February 1980.
[14] J. Koch and J. Mazumder, "Apparatus and methods for monitoring and controlling multi-layer cladding". USA Patent 6122564 A, 19 September 2000.
[15] "Special Metals Inconel Alloy 718," [Online]. Available: http://www.specialmetals.com/assets/documents/alloys/inconel/inconel-alloy-718.pdf. [Accessed 1 November 2016].
[16] B. Gilroy, "Kinetic Theory of Inhibition and Passivation in Electrochemical Reactions," The Journal of Physical Chemistry, vol. 69, no. 4, pp. 1259-1267, 1965.
[17] J. Brooks and P. Bridges, "Metallurgical Stability of Inconel Alloy 718," in Superalloys, Birmingham, 1988.
[18] A. Devaux, L. Naze, R. Molins, A. Pineau, A. Organista, J. Guedou, J. Uginet and P. Heritier, "Gamma Double Prime Precipitation Kinetic in Alloy 718," Materials Science and Engineering, vol. 486, no. 1-2, pp. 117-122, 2008.
[19] H. Eiselstein, "Metallurgy of a Columbian-Hardened Nickel-Chromium-Iron Ally," Amerian Society for Testing and Materials, pp. 62-79, 1965.
[20] D. Paulonis, J. Oblak and D. Duvall, "Precipitation in Nickel-Based Alloy 718," American Society of Metals, vol. 62, no. 3, pp. 611-622, 1969.
[21] Y. Desvallees, M. Bouzidi and N. Beaude, "Delta Phase in Inconel 718: Mechanical Properties and Forging Process Requirments," The Minerals, Metals, and Materials Society, pp. 281-291, 1994.
64
[22] R. Hall, "The Metallurgy of Alloy 718," Journal of Basic Engineering, vol. 89, no. 3, pp. 511-516, 1967.
[23] J. J. Schirra, R. H. Caless and R. W. Hatala, "The Effect of Laves Phase On The Mechanical Properties of Wrought and Cast+HIP Inconel 718," The Minerals, Metals, and Materials Society, pp. 375-388, 1991.
[24] R. G. Thompson, J. R. Dobbs and D. E. Mayo, "The effect of heat treatment on microfissuring in alloy 718," Weld J., vol. 65, pp. 299-304, 1986.
[25] A. Sterling, N. Shamsaei, B. Torries and S. M. Thompson, "Fatigue Behaviour of Additively Manufactured Ti-6Al-4V," Proceda Engineering, no. 133, pp. 576-589, 2015.
[26] W. Tillman, C. Schaak, J. Nellesen, M. Schaper, M. Aydinoz and K. Hoyer, "Hot isostatic pressing of IN718 components manufactured by selective laser melting," Additive Manufacturing, vol. 13, pp. 93-102, 2017.
[27] A. B. Spierings, N. Herres and G. Levy, "Influence of the Particle Size Distribution on Surface Quality and Mechanical Properties in AM Steel Parts," Rapid Prototyping, vol. 17, no. 3, pp. 195-202, 2011.
[28] [Online]. Available: https://www.nasa.gov/centers/marshall/news/news/releases/2016/nasa-rocket-fuel-pump-tests-pave-way-for-methane-fueled-mars-lander.html. [Accessed 10th December 2017].
[29] [Online]. Available: https://www.nasa.gov/exploration/systems/sls/3d-printed-rocket-injector.html. [Accessed December 10th 2017].
[30] B. Hofer, K.-U. Volker and F. Bigolin, "Effect of argon on HIP parts, permissible values and concentration determination," Powder Metallurgy, vol. 55, no. 5, pp. 329-332, 2012.
[31] C. Schaak, W. Tillmann, M. Schaper and M. Aydinoz, "Process Gas Infiltration in Inconel 718 Samples during SLM Processing," 13 8 2016. [Online]. Available: http://www.rtejournal.de/ausgabe-13-2016/4403. [Accessed 13 2 2018].
[32] L. L. Parimi, A. R. G, D. Clark and M. M. Attallah, "Microstructural and texture development in direct laser fabricated in718," Materials Characterization, vol. 89, pp. 102-111, 2014.

65
[33] P. Gradl, W. Brandsmeier, D. Alberts, B. Walker and J. A. Schneider, "Manufacturing Process Developments for Large Scale Regeneratively-cooled Channel Wall Rocket Nozzles," in JANNAF, Phoenix, 2016.
[34] Q. B. Nguyen, M. L. S. Nai, Z. Zhu, C.-N. Sun, J. Wei and W. Zhou, "Characteristics of Inconel Powders for Powder-Bed Additive Manufacturing," Engineering, vol. 3, pp. 695-700, 2017.