macroeconomie policy and performance - st. louis fed · chapter 2 macroeconomie policy and...
TRANSCRIPT

CHAPTER 2
Macroeconomie Policyand Performance
THE U.S. ECONOMY PERFORMED very well in 1998. Real outputincreased 3.7 percent at an annual rate over the first three quarters ofthe year, once again exceeding the predictions of most forecasters.Nonagricultural jobs increased by about 2.9 million during the year,and the average unemployment rate for the year dropped to 4.5 per-cent, its lowest level since 1969 (Chart 2-1). The consumer price indexrose by only 1.6 percent, its second smallest increase since 1964 (Chart2-2), and other measures of inflation were even more muted.
Yet the turmoil in foreign economies that began in the summer of1997 did not leave the U.S. economy unscathed. Net exports declinedsharply during 1998, as a result of slow or negative economic growth ina number of the United States' trading partners and a substantial risein the foreign exchange value of the dollar since early 1997. Moreover,during the late summer and fall, domestic financial conditions, whichhad been highly conducive to economic growth for several years,became much less favorable. Investors' sudden flight from risky assetsreduced some businesses' access to capital and raised the cost ofborrowing for others.
Despite these dampening forces, the economic expansion maintainedconsiderable momentum. A significant factor underlying this strongperformance was the continued practice of responsible fiscal policy:1998 will be remembered as the year the Federal Government record-ed its first unified budget surplus since 1969. The surplus contributedto the low level of interest rates during the year, increased the capitalavailable for private investment, and provided a more stable backdropfor private economic decisions. Monetary policy also provided animportant boost to the economy. The Federal Reserve held overnightinterest rates steady for much of the year, but it reduced rates threetimes in quick succession when the financial environment deterioratedin the fall. Following the Federal Reserve's actions, financial stressesin the United States abated considerably, with risk premiums ininterest rates declining once again and the issuance of corporatedebt picking up.
The first section of this chapter reviews the course of the U.S. econ-omy during 1998. The next section focuses on developments in domes-tic financial markets, which were exceptionally turbulent last year.
43
Digitized for FRASER http://fraser.stlouisfed.org/ Federal Reserve Bank of St. Louis

Chart 2-1 Unemployment RateIn 1998 the average unemployment rate fell to its lowest level since 1969.
Percent
12
10
60:Q1 63:Q1 66:Q1 69:Q1 72:Q1 75:Q1 78:Q1 81:Q1 84:Q1 87:Q1 90:Q1 93:Q1 96:Q1
Source: Department of Labor (Bureau of Labor Statistics).
Chart 2-2 Inflation RateInflation remained low in 1998, with the consumer price index recording its secondsmallest rise since 1964.Percent
16
14
12
10
60:Q1 63:Q1 66:Q1 69:Q1 72:Q1 75:Q1 78:Q1 81:Q1 84:Q1 87:Q1 90:Q1 93:Q1 96:Q1
Note: Data are four-quarter percent changes in the CPI.Source: Department of Labor (Bureau of Labor Statistics).
44
Digitized for FRASER http://fraser.stlouisfed.org/ Federal Reserve Bank of St. Louis

Then the chapter explores two other macroeconomic topics that havereceived a lot of attention recently: the boom in business equipmentinvestment during the past several years, and the "year 2000" probleminvolving computers. The final section of the chapter analyzes the out-look for the U.S. economy. When the economic expansion continuedthrough December, it became the longest recorded peacetime expan-sion. The Administration expects the expansion to continue during1999, albeit at a more moderate pace.
THE YEAR IN REVIEW
Real gross domestic product (GDP) increased 3.7 percent at an annu-al rate between the fourth quarter of 1997 and the third quarter of1998 (the latest period for which data were available when this Reportwent to press). Preliminary data suggest that GDP growth likelyremained in this neighborhood in the fourth quarter, bringing growthfor the year as a whole close to that recorded in 1996 and 1997. Onceagain, business investment in equipment made a substantial contribu-tion to GDP growth, while a larger drag from net exports was offset bya stepup in household spending on goods, services, and housing fromits already robust pace of the previous several years.
THE STANCE OF MACROECONOMIC POLICY
Both fiscal policy and monetary policy made vital contributions tothe excellent performance of the U.S. economy during 1998.
Fiscal PolicyThe passage of the Omnibus Budget Reconciliation Act of 1993
marked the beginning of a significant shift toward fiscal restraint bythe Federal Government. The Balanced Budget Act of 1997 put inplace the additional policies needed to bring the budget into sustainedbalance. In fiscal 1998 (October 1997 through September 1998), theFederal Government capped 6 years of dramatic budget improvementby recording the first budget surplus since 1969. The $69 billion sur-plus was the largest as a share of GDP since 1957. The goal of elimi-nating the budget deficit by 2002 was accomplished 4 years ahead ofschedule. Net interest payments—the fiscal burden imposed by thelarge deficits of the past—remain substantial, however, at 15 percentof total expenditures and 3 percent of GDP in fiscal 1998. Excludingthese payments, the "primary" budget balance, the difference betweentax revenue and expenditures for current needs, reached a surplus ofmore than $300 billion.
Although the attainment of a budget surplus marks a major fiscalmilestone, the case for continued fiscal responsibility remains strong.Demographic trends point to an aging of the population that will
45
Digitized for FRASER http://fraser.stlouisfed.org/ Federal Reserve Bank of St. Louis

significantly increase expenditures on Social Security and governmenthealth programs over the next several decades. The emergence of abudget surplus offers the opportunity to prepare for this challenge.Indeed, the unified budget surplus includes the current excess ofreceipts over benefit payments in the Social Security system, whichamounted to $99 billion in fiscal 1998. (Apart from the Social Securitysystem, the Federal Government had a deficit of $30 billion in 1998,producing the unified surplus of $69 billion.) The Administration hasstated that none of the unified surplus should be used until the futuresolvency of Social Security is assured. The President has repeatedlyreaffirmed this commitment to "save Social Security first," and he pre-sented a specific proposal for Social Security reform in his recent Stateof the Union address.
Monetary Policy
In conducting monetary policy during 1998, the main focus of theFederal Reserve's concerns shifted from a potential reversal of thefavorable trend of inflation to a potential weakening of economic activ-ity. When the year began, the target Federal funds rate—the ratebanks charge each other for overnight loans—stood at 5.5 percent,where it had been for the preceding 9 months. However, the surge ineconomic growth during the first several months of the year height-ened the concern of the Federal Open Market Committee (FOMC, theFederal Reserve's principal monetary policy decisionmaking body) thatintensifying use of the economy's resources might lead to a buildup ofinflationary pressures. The FOMC did not adjust the Federal fundsrate in response, but it noted in March that a tightening of monetarypolicy was more likely than an easing in the months ahead.
Despite a slowing of growth in the second quarter, the FOMCbelieved that the balance of risks still pointed to the possibility of ris-ing inflation over time. It therefore maintained a bias toward futuremonetary tightening. Indeed, labor costs accelerated during 1998 in avery tight labor market. However, the rapid deterioration in financialconditions in the late summer and fall persuaded the Federal Reservethat a much less restrictive monetary policy was appropriate. TheFOMC dropped its bias toward tightening at its August meeting, cutthe Federal funds rate by 25 basis points (0.25 percentage point) at itsSeptember meeting, did so again in mid-October in an unusualbetween-meeting move, and lowered the funds rate yet again at itsNovember meeting. In both October and November the FederalReserve Board also cut the discount rate—the rate it charges banks toborrow from the Fed—by 25 basis points, to maintain the discountrate's traditional position below the funds rate. The easing of monetarypolicy was not a reaction to any observed weakness of economic activi-ty but rather a preemptive or forward-looking action intended to sus-tain the expansion. The cumulative 75-basis-point reduction in the
46
Digitized for FRASER http://fraser.stlouisfed.org/ Federal Reserve Bank of St. Louis

target Federal funds rate brought that rate to 4.75 percent, its lowestvalue in 4 years.
TURMOIL IN FINANCIAL MARKETSThe past year was a tumultuous one in U.S. financial markets. The
first half of the year witnessed an extension of the highly favorableconditions that had prevailed over the previous several years. Yieldson intermediate- and long-term Treasury securities moved in a fairlynarrow band that was centered a little below the levels that had pre-vailed during the latter part of 1997. Most households and firmsenjoyed ample access to credit on good terms. Meanwhile equity pricesrose sharply, with most major indexes hitting record highs in Julythat ranged from 17 to 28 percent above their values at the beginningof the year.
Financial conditions during the second half of the year were lessfavorable. In mid-August Russia devalued the ruble and effectivelydefaulted on its domestic debt, marking a new round of the financialcrisis in emerging markets that had begun in Southeast Asia a yearearlier. As the international financial turmoil worsened, investors'desire to shift their portfolios away from emerging marketeconomies—a trend that had been apparent over the previous year—intensified, and they began to shy away from all but the safest andmost liquid assets in the markets of the industrial countries. (Chapter6 discusses developments in international financial markets atlength.) Among U.S. assets, the shift of investor preferences awayfrom private securities and toward government securities caused thedifference, or spread, between private and Treasury yields to spikeupward. Yields on higher quality corporate debt were little changed(although the spread between these yields and Treasury yieldswidened as the latter fell), but businesses with lower credit ratingsfaced much higher costs of borrowing. Moreover, issuance of corporatedebt slowed sharply, banks tightened terms and standards on busi-ness loans (although the volume of lending actually increased signifi-cantly), and stock prices dropped steeply.
Financial conditions improved markedly after mid-October, partly inresponse to the Federal Reserve's interest rate reductions. Riskspreads narrowed, debt issuance accelerated, and stock marketsrebounded to new highs. Nevertheless, some American businessesapparently faced more limited access to credit and a higher cost of bor-rowing at the end of 1998 than at the beginning of the year.
COMPONENTS OF SPENDINGAs already noted, real GDP increased at an annual rate of 3.7 per-
cent between the fourth quarter of 1997 and the third quarter of 1998(Table 2-1), close to the pace of the previous 2 years. Quarterly output
47
Digitized for FRASER http://fraser.stlouisfed.org/ Federal Reserve Bank of St. Louis
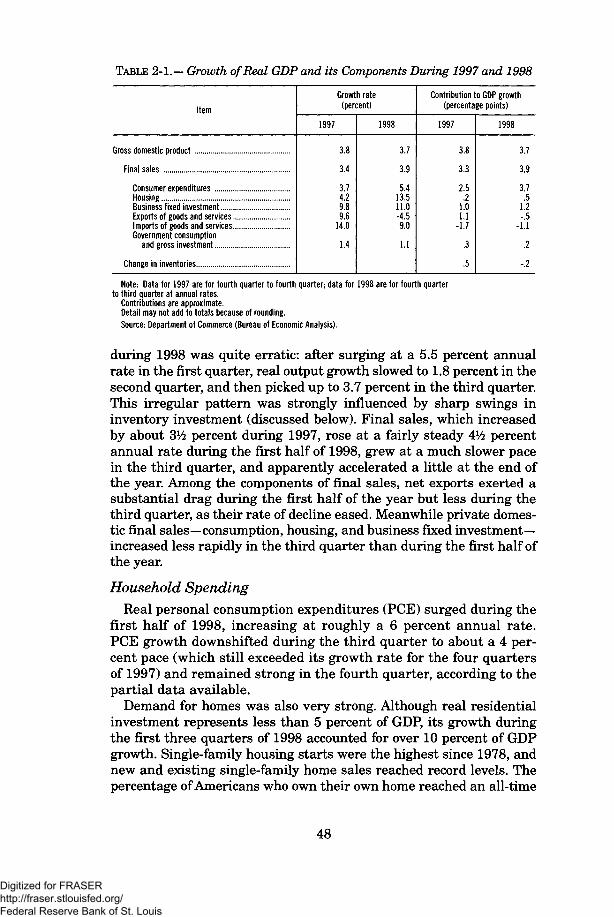
TABLE 2-1.— Growth of Real GDP and its Components During 1997 and 1998
Item
Gross domestic product
Final sales
Consumer expendituresHousingBusiness fixed investment .. ..Exports of goods and servicesImports of goods and servicesGovernment consumption
and gross investment
Change in inventories
Growth rate(percent)
1997
3.8
3.4
3.74.29.89.6
14.0
1.4
1998
3.7
3.9
5.413.511.0-4.59.0
1.1
Contribution to GDP growth(percentage points)
1997
3.8
3.3
2.5.2
1.01.1
-1.7
.3
.5
1998
3.7
3.9
3.7.5
1.2-.5
-1.1
.2
-.2
Note: Data for 1997 are for fourth quarter to fourth quarter; data for 1998 are for fourth quarterto third quarter at annual rates.
Contributions are approximate.Detail may not add to totals because of rounding.Source: Department of Commerce (Bureau of Economic Analysis).
during 1998 was quite erratic: after surging at a 5.5 percent annualrate in the first quarter, real output growth slowed to 1.8 percent in thesecond quarter, and then picked up to 3.7 percent in the third quarter.This irregular pattern was strongly influenced by sharp swings ininventory investment (discussed below). Final sales, which increasedby about 3V2 percent during 1997, rose at a fairly steady 4% percentannual rate during the first half of 1998, grew at a much slower pacein the third quarter, and apparently accelerated a little at the end ofthe year. Among the components of final sales, net exports exerted asubstantial drag during the first half of the year but less during thethird quarter, as their rate of decline eased. Meanwhile private domes-tic final sales—consumption, housing, and business fixed investment—increased less rapidly in the third quarter than during the first half ofthe year.
Household SpendingReal personal consumption expenditures (PCE) surged during the
first half of 1998, increasing at roughly a 6 percent annual rate.PCE growth downshifted during the third quarter to about a 4 per-cent pace (which still exceeded its growth rate for the four quartersof 1997) and remained strong in the fourth quarter, according to thepartial data available.
Demand for homes was also very strong. Although real residentialinvestment represents less than 5 percent of GDP, its growth duringthe first three quarters of 1998 accounted for over 10 percent of GDPgrowth. Single-family housing starts were the highest since 1978, andnew and existing single-family home sales reached record levels. Thepercentage of Americans who own their own home reached an all-time
48
Digitized for FRASER http://fraser.stlouisfed.org/ Federal Reserve Bank of St. Louis
high of 66.8 percent in the third quarter (the latest period for whichdata are available). Growth in homeownership was especially fast forgroups that have been underrepresented in the past, such as blacksand Hispanics.
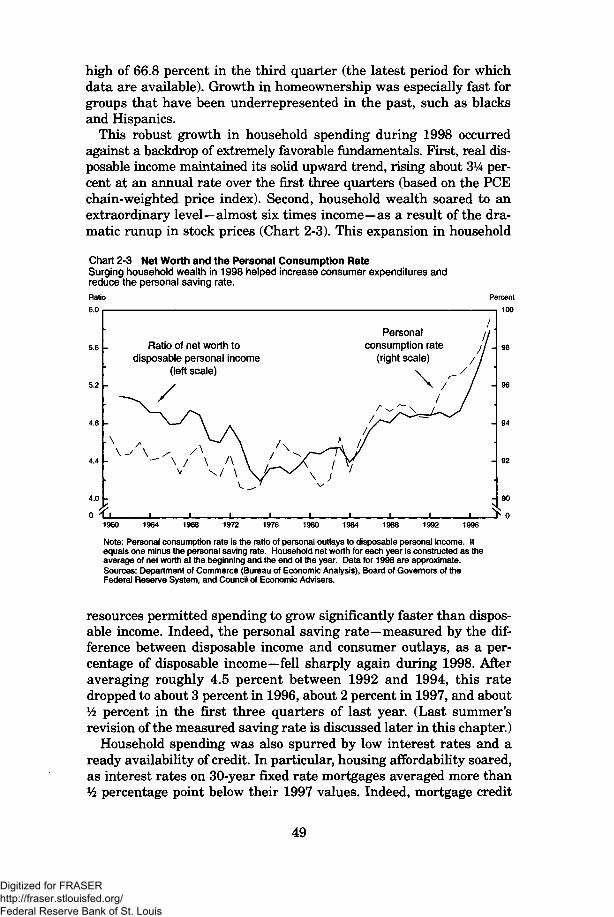
This robust growth in household spending during 1998 occurredagainst a backdrop of extremely favorable fundamentals. First, real dis-posable income maintained its solid upward trend, rising about 3% per-cent at an annual rate over the first three quarters (based on the PCEchain-weighted price index). Second, household wealth soared to anextraordinary level—almost six times income—as a result of the dra-matic runup in stock prices (Chart 2-3). This expansion in household
Chart 2-3 Net Worth and the Personal Consumption RateSurging household wealth in 1998 helped increase consumer expenditures andreduce the personal saving rate.Ratio
6.0
5.2
4.0
0 :
Percent
100
Ratio of net worth todisposable personal income
(left scale)
Personalconsumption rate
(right scale)
1960 1964 1968 1972 1976 1980 1984 1992 1996
Note: Personal consumption rate is the ratio of personal outlays to disposable personal income. Itequals one minus the personal saving rate. Household net worth for each year is constructed as theaverage of net worth at the beginning and the end of the year. Data for 1998 are approximate.Sources: Department of Commerce (Bureau of Economic Analysis), Board of Governors of theFederal Reserve System, and Council of Economic Advisers.
resources permitted spending to grow significantly faster than dispos-able income. Indeed, the personal saving rate—measured by the dif-ference between disposable income and consumer outlays, as a per-centage of disposable income—fell sharply again during 1998. Afteraveraging roughly 4.5 percent between 1992 and 1994, this ratedropped to about 3 percent in 1996, about 2 percent in 1997, and about% percent in the first three quarters of last year. (Last summer'srevision of the measured saving rate is discussed later in this chapter.)
Household spending was also spurred by low interest rates and aready availability of credit. In particular, housing affordability soared,as interest rates on 30-year fixed rate mortgages averaged more thanl/2 percentage point below their 1997 values. Indeed, mortgage credit
49
Digitized for FRASER http://fraser.stlouisfed.org/ Federal Reserve Bank of St. Louis
expanded more rapidly during the first three quarters of 1998 (the lat-est available data) than in any year since 1990. Over the same period,consumer credit grew at a somewhat faster rate than in 1997 but wellbelow the torrid pace of 1994 and 1995. Total household debt appearsto have increased faster than disposable income in 1998 for the sixthyear in a row. Nevertheless, delinquency rates on consumer loansremained close to their 1997 values, and delinquency rates on mort-gages stayed quite low. Personal bankruptcy filings reached a newrecord high in the third quarter of 1998, but the rate of increase overthe preceding year was well below the pace recorded between 1995 andmid-1997.
Last year's Economic Report of the President included an extendeddiscussion of the long-term upward trend in the bankruptcy rate. Dur-ing 1998 the Congress considered various proposals to reform thebankruptcy law, and both the House and the Senate passed reformbills; however, the two houses were unable to agree on a compromisebill that incorporated the Administration's key principles for bank-ruptcy reform. The Administration supports reform of the bankruptcylaw that would require both debtors and creditors to act more respon-sibly: troubled debtors who can repay a portion of their debts should doso, but creditors should treat debtors fairly, in keeping with the credi-tors' superior expertise and bargaining power.
Consumer sentiment was buoyant during 1998, probably reflectingboth the favorable fundamentals and expectations for continued eco-nomic growth. The consumer sentiment index of the Survey ResearchCenter at the University of Michigan posted its highest reading inmore than 30 years in early 1998. This optimism waned somewhat inthe fall, but the Michigan index finished the year near the top of itshistorical range.
Business InvestmentReal business fixed investment grew extremely rapidly during the
first half of 1998, increasing over 15 percent at an annual rate, andthen rose at a slower pace, on average, in the second half of the year.Sharp gains in purchases of producers' durable equipment (PDE)accounted for more than the total advance in business fixed invest-ment during the first three quarters. Real PDE investment increasedabout 16 percent at an annualized rate over that period, exceeding itsrobust average annual growth rate over the preceding 3 years of 11percent. Among its components, spending on computers and peripher-al equipment surged 75 percent in real terms over the first three quar-ters of 1998 (annualized), and real spending on communications equip-ment jumped about 20 percent (annualized). (The causes andconsequences of the recent boom in equipment investment are dis-cussed further below.) Real PDE was little changed in the third quar-ter but apparently increased strongly again in the fourth quarter. Both
50
Digitized for FRASER http://fraser.stlouisfed.org/ Federal Reserve Bank of St. Louis
the third-quarter deceleration and the fourth-quarter pickup likelyreflected fluctuations in motor vehicle sales.
Business investment in structures fell a bit in real terms during thefirst three quarters of 1998. Office construction was boosted by low anddeclining vacancy rates, but other commercial construction was slug-gish, and industrial construction was held down by ample factorycapacity. Spending in this category may also have been dampened by atightening in available financing during the third quarter, althoughconditions in the commercial mortgage-backed securities marketimproved noticeably by the end of the year.
Investment in business inventories varied dramatically across thefirst three quarters of 1998. Inventories increased $91 billion in realterms at an annual rate in the first quarter, and the stepup in inven-tory investment relative to the fourth quarter of 1997 contributed over1 percentage point to the annualized increase in first-quarter GDP.However, several quarters of strong inventory growth apparently per-suaded businesses to reduce their rate of stockpiling in the secondquarter; in addition, a strike at the Nation's largest automaker led to adecline in motor vehicle inventories. All told, the sharply lower rate ofinventory accumulation in the second quarter subtracted over 2*6. per-centage points from second-quarter GDP growth. Inventory accumulationran at a moderate pace during the third quarter.
GovernmentFederal Government consumption expenditures and gross invest-
ment contracted in real terms over the first three quarters of 1998, fol-lowing a real decline during 1997. This measure of government spend-ing, which is included in GDP, differs from unified budget outlays in anumber of ways. Among the most important differences are that theGDP measure includes the depreciation of government capital anddoes not include transfer payments, interest, or grants to State andlocal governments. Defense purchases represent about two-thirds ofFederal consumption expenditures and gross investment. During thefirst three quarters of last year, a roughly 2 percent annualizeddecrease in defense spending more than offset a roughly 1 percentannualized increase in the smaller category of nondefense spending.
Consumption expenditures and gross investment by State and localgovernments moved up over 2 percent at an annual rate over the sameperiod, just below the average pace of the previous several years.Strong growth of household income boosted income tax collections con-siderably, and most State governments today appear to be in goodfinancial condition.
International InfluencesIn 1998 the Federal Reserve Board replaced its traditional index of
the foreign exchange value of the dollar with several new ones. New
51
Digitized for FRASER http://fraser.stlouisfed.org/ Federal Reserve Bank of St. Louis
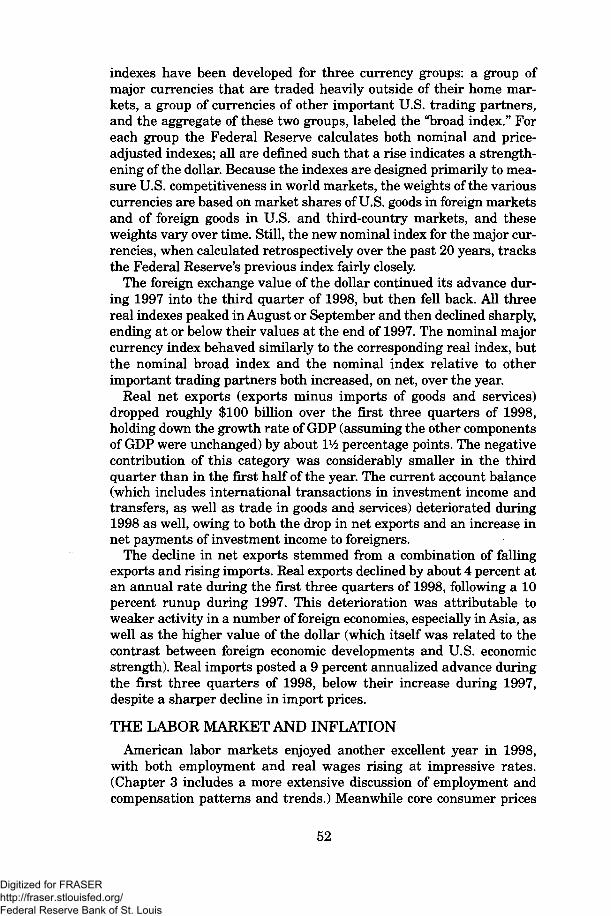
indexes have been developed for three currency groups: a group ofmajor currencies that are traded heavily outside of their home mar-kets, a group of currencies of other important U.S. trading partners,and the aggregate of these two groups, labeled the "broad index." Foreach group the Federal Reserve calculates both nominal and price-adjusted indexes; all are defined such that a rise indicates a strength-ening of the dollar. Because the indexes are designed primarily to mea-sure U.S. competitiveness in world markets, the weights of the variouscurrencies are based on market shares of U.S. goods in foreign marketsand of foreign goods in U.S. and third-country markets, and theseweights vary over time. Still, the new nominal index for the major cur-rencies, when calculated retrospectively over the past 20 years, tracksthe Federal Reserve's previous index fairly closely.
The foreign exchange value of the dollar continued its advance dur-ing 1997 into the third quarter of 1998, but then fell back. All threereal indexes peaked in August or September and then declined sharply,ending at or below their values at the end of 1997. The nominal majorcurrency index behaved similarly to the corresponding real index, butthe nominal broad index and the nominal index relative to otherimportant trading partners both increased, on net, over the year.
Real net exports (exports minus imports of goods and services)dropped roughly $100 billion over the first three quarters of 1998,holding down the growth rate of GDP (assuming the other componentsof GDP were unchanged) by about l1^ percentage points. The negativecontribution of this category was considerably smaller in the thirdquarter than in the first half of the year. The current account balance(which includes international transactions in investment income andtransfers, as well as trade in goods and services) deteriorated during1998 as well, owing to both the drop in net exports and an increase innet payments of investment income to foreigners.
The decline in net exports stemmed from a combination of fallingexports and rising imports. Real exports declined by about 4 percent atan annual rate during the first three quarters of 1998, following a 10percent runup during 1997. This deterioration was attributable toweaker activity in a number of foreign economies, especially in Asia, aswell as the higher value of the dollar (which itself was related to thecontrast between foreign economic developments and U.S. economicstrength). Real imports posted a 9 percent annualized advance duringthe first three quarters of 1998, below their increase during 1997,despite a sharper decline in import prices.
THE LABOR MARKET AND INFLATIONAmerican labor markets enjoyed another excellent year in 1998,
with both employment and real wages rising at impressive rates.(Chapter 3 includes a more extensive discussion of employment andcompensation patterns and trends.) Meanwhile core consumer prices
52
Digitized for FRASER http://fraser.stlouisfed.org/ Federal Reserve Bank of St. Louis
(that is, excluding food and energy prices) increased at their slowestpace since the 1960s.
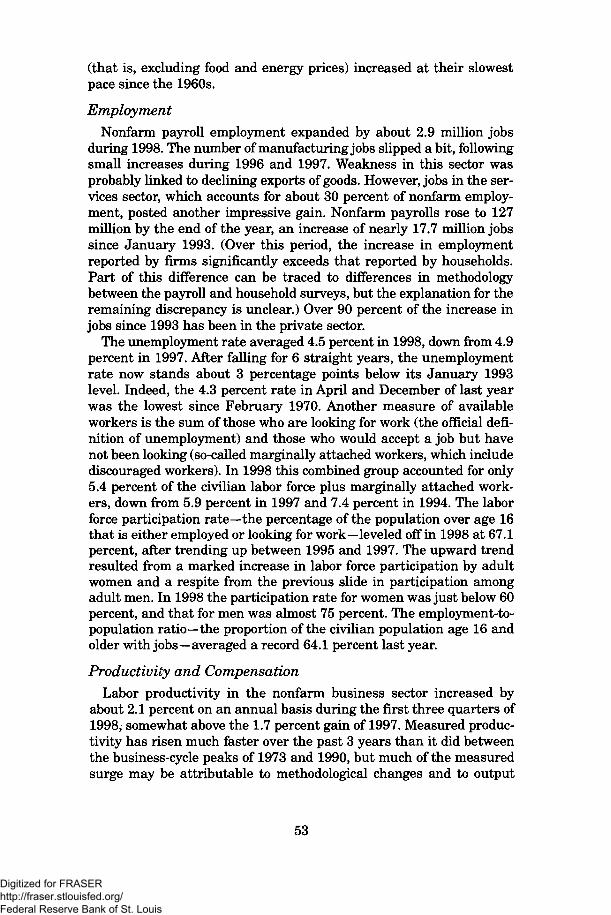
EmploymentNonfarm payroll employment expanded by about 2.9 million jobs
during 1998. The number of manufacturing jobs slipped a bit, followingsmall increases during 1996 and 1997. Weakness in this sector wasprobably linked to declining exports of goods. However, jobs in the ser-vices sector, which accounts for about 30 percent of nonfarm employ-ment, posted another impressive gain. Nonfarm payrolls rose to 127million by the end of the year, an increase of nearly 17.7 million jobssince January 1993. (Over this period, the increase in employmentreported by firms significantly exceeds that reported by households.Part of this difference can be traced to differences in methodologybetween the payroll and household surveys, but the explanation for theremaining discrepancy is unclear.) Over 90 percent of the increase injobs since 1993 has been in the private sector.
The unemployment rate averaged 4.5 percent in 1998, down from 4.9percent in 1997. After falling for 6 straight years, the unemploymentrate now stands about 3 percentage points below its January 1993level. Indeed, the 4.3 percent rate in April and December of last yearwas the lowest since February 1970. Another measure of availableworkers is the sum of those who are looking for work (the official defi-nition of unemployment) and those who would accept a job but havenot been looking (so-called marginally attached workers, which includediscouraged workers). In 1998 this combined group accounted for only5.4 percent of the civilian labor force plus marginally attached work-ers, down from 5.9 percent in 1997 and 7.4 percent in 1994. The laborforce participation rate—the percentage of the population over age 16that is either employed or looking for work—leveled off in 1998 at 67.1percent, after trending up between 1995 and 1997. The upward trendresulted from a marked increase in labor force participation by adultwomen and a respite from the previous slide in participation amongadult men. In 1998 the participation rate for women was just below 60percent, and that for men was almost 75 percent. The employment-to-population ratio—the proportion of the civilian population age 16 andolder with jobs—averaged a record 64.1 percent last year.
Productivity and CompensationLabor productivity in the nonfarm business sector increased by
about 2.1 percent on an annual basis during the first three quarters of1998, somewhat above the 1.7 percent gain of 1997. Measured produc-tivity has risen much faster over the past 3 years than it did betweenthe business-cycle peaks of 1973 and 1990, but much of the measuredsurge may be attributable to methodological changes and to output
53
Digitized for FRASER http://fraser.stlouisfed.org/ Federal Reserve Bank of St. Louis
growth that was above the economy's long-run potential. (Recentdevelopments in productivity are discussed at greater length below.)
Compensation rose significantly during 1998. The employment costindex (ECI, a measure of wages, salaries, and employer costs foremployee benefits) for workers in private industry moved up 3.6 per-cent (annualized) during the first three quarters of the year (accordingto the latest available data), continuing its acceleration of the previousseveral years. Wages and salaries increased 4.1 percent at an annualrate, while benefits climbed 2.4 percent. For the 12-month period end-ing in September 1998, compensation growth in construction and man-ufacturing was quite close to that during the previous 12-month peri-od, but compensation growth in the service-producing industriespicked up sharply. The acceleration in compensation was especiallypronounced in the finance, insurance, and real estate sector, likelyreflecting bonuses and commissions associated with higher volumes ofstock trading, mortgage refinancing, and other financial sector activity.
Other measures of compensation also showed substantial gains dur-ing 1998. For example, average hourly earnings increased 3.8 percentover the year. Unlike the ECI, this series excludes benefits and coversonly production and nonsupervisory workers, among other differences.
Because consumer prices increased so little during 1998, these nom-inal compensation gains translated into appreciable advances in realcompensation. The increase in the ECI less the increase in the con-sumer price index (CPI) was 2.1 percent during the first three quartersof 1998, compared with the solid 1.7 percent gain during 1997. Theincrease in real average hourly earnings during the year was 2.4 per-cent, slightly above the 1997 growth rate, which was the fastest inmore than two decades.
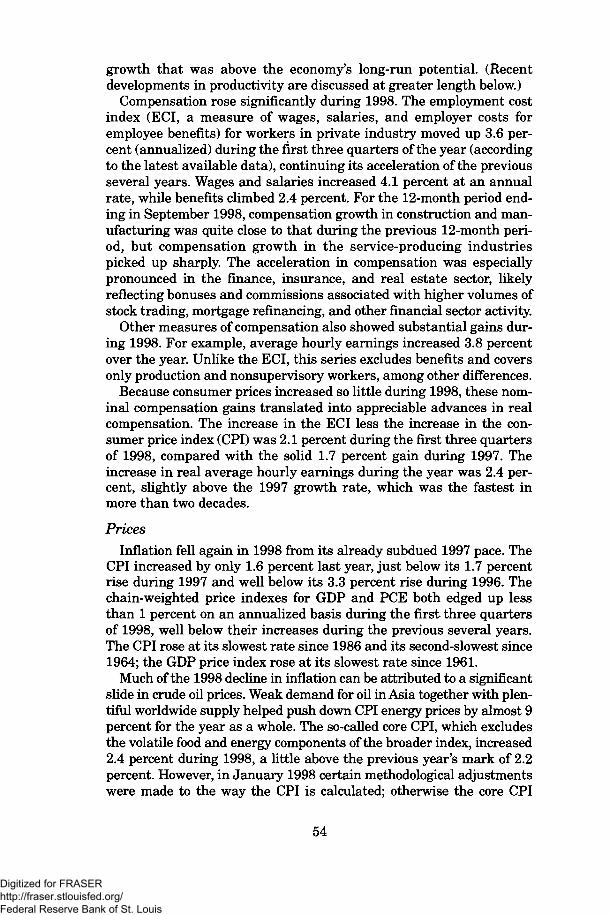
PricesInflation fell again in 1998 from its already subdued 1997 pace. The
CPI increased by only 1.6 percent last year, just below its 1.7 percentrise during 1997 and well below its 3.3 percent rise during 1996. Thechain-weighted price indexes for GDP and PCE both edged up lessthan 1 percent on an annualized basis during the first three quartersof 1998, well below their increases during the previous several years.The CPI rose at its slowest rate since 1986 and its second-slowest since1964; the GDP price index rose at its slowest rate since 1961.
Much of the 1998 decline in inflation can be attributed to a significantslide in crude oil prices. Weak demand for oil in Asia together with plen-tiful worldwide supply helped push down CPI energy prices by almost 9percent for the year as a whole. The so-called core CPI, which excludesthe volatile food and energy components of the broader index, increased2.4 percent during 1998, a little above the previous year's mark of 2.2percent. However, in January 1998 certain methodological adjustmentswere made to the way the CPI is calculated; otherwise the core CPI
54
Digitized for FRASER http://fraser.stlouisfed.org/ Federal Reserve Bank of St. Louis

probably would have increased by about 2.6 percent last year, almost %percentage point faster than during 1997. On the other hand, coreprices as measured by the chain-weighted price index for PCE excludingfood and energy decelerated during 1998; this index increased by only1.2 percent at an annual rate in the first three quarters of the year, com-pared with a 1.6 percent rise during 1997. The CPI and PCE priceindexes differ in both coverage and methodology (as discussed later inthis chapter). But by either measure, core inflation has dropped, on net,over the past several years. Indeed, core inflation has been lower duringthe past few years than at any time since the mid-1960s.
Several factors have helped to hold down core inflation despite thestrong growth of aggregate demand and very tight labor markets. (Theforecast section of this chapter further explores the reasons for recentlow inflation.) Part of the reason why wage increases have not putmore pressure on prices has been rapid productivity growth. In addi-tion, corporate profits stand at roughly their largest share of nationalincome during the past 30 years, and some wage increases have beenoffset by reduced profit growth of late. Another important contributionto low inflation has been declining prices of nonoil imports, as excesscapacity in Asia and depreciating foreign currencies have encouragedforeign producers to reduce the dollar prices of their goods. Beyondtheir direct impact on the prices paid for imports, these overseas devel-opments have discouraged domestic producers from raising theirprices as much as they might have otherwise. Inflation has probablyalso been restrained by the strong increase in industrial capacity in theUnited States during this expansion. Although the unemployment ratewas at a 29-year low in 1998, the average rate of capacity utilization inindustry during the year was about equal to its long-term average.
Low inflation readings in 1998 were reinforced by a continued slidein expected inflation. Actual inflation depends on expectations of infla-tion, because the wage and price increases sought by workers andfirms are influenced by the prices they expect to pay for other goods.According to the University of Michigan's survey of households, themedian expectation for annual inflation over the next 5 to 10 years wasabout 2.8 percent in the fourth quarter of 1998, slightly below the late-1997 figure of 3.1 percent and well below the 3.6 percent reading of 6years ago. Long-term inflation expectations of professional forecastersare even lower, according to the survey conducted by the FederalReserve Bank of Philadelphia, but have fallen by a similar amount inrecent years.
FINANCIAL MARKETS
Through much of the current expansion, falling interest rates andrising equity prices have provided important support to real economicactivity. Indeed, the disruptions to foreign financial markets and
55
Digitized for FRASER http://fraser.stlouisfed.org/ Federal Reserve Bank of St. Louis

institutions that began in 1997 initially improved financial conditionsin the United States, as shifting portfolio preferences helped to furtherreduce U.S. interest rates and boost U.S. equity prices. The resultingstrength in domestic consumption and investment offset at least someof the dampening effect of the drop in net exports. However, the wors-ening of international conditions in the summer of 1998 changed thedomestic financial situation dramatically. An intensified "flight to qual-ity" by lenders and investors restricted businesses' access to credit andraised the average cost of their borrowing. But by the end of the year asignificant easing of monetary policy and somewhat greater confidencein the international economic outlook had produced a substantialimprovement in financial conditions.
THE EFFECT OF RISK ON INTEREST RATES ANDEQUITY PRICES
Many of the developments in financial markets over the past sever-al years have been linked to changing perceptions of risk. Therefore, tounderstand these developments, one must begin with the basic rela-tionships among risk, interest rates, and equity prices. All ownershipof financial assets involves risk, and because people generally want tominimize the uncertainty they face, they will hold riskier assets only ifthose assets pay higher expected returns. As a result, changes inperceived risk require adjustments in expected returns.
Consider debt securities, such as bonds. All bonds are subject to mar-ket risk, or the possibility that current yields, and therefore prices, willchange to reflect changes in market conditions. Because bondholdersgenerally receive fixed payments, increases in prevailing interest ratesreduce, and decreases raise, the value of outstanding bonds. Mostbonds are also subject to credit risk, or the possibility that the issuerwill default on the bond's interest payments or on repayment of thebond's face value. Commercial paper—short-term debt securitiesissued by corporations—also has credit risk, but because of its shortmaturity it faces little market risk. Bank loans often have repaymentterms similar to those of bonds, and therefore banks face both marketrisk and credit risk on their loans.
U.S. Treasury securities have essentially no credit risk, becausepeople believe that the Federal Government will always meet itslegal obligations. All private debt securities do have credit risk, andtherefore the yields on those securities exceed the "risk-free" yieldon Treasury debt. Private credit rating agencies assess the likeli-hood of default by private borrowers. Higher rated debt is deemed"investment-grade," whereas lower rated debt is called "specula-tive," "high-yield," or "junk." Changes in perceived riskiness affectthe spreads between yields on these private debt issues and therisk-free Treasury yield.
56
Digitized for FRASER http://fraser.stlouisfed.org/ Federal Reserve Bank of St. Louis

Equities clearly involve risk as well. A simple model of equity pricingsets the price of a share of stock equal to the present discounted valueof future dividends payable on that share. One risk facing equityhold-ers, therefore, is that of changes in a company's dividends, which areoften related to sustained changes in its earnings. Decreases in expect-ed earnings growth reduce a stock's price-earnings ratio, or the price ofa share as a multiple of the company's current earnings. Another riskfor equityholders is that of changes in the discount rate that investorsapply to future earnings. One can view the discount rate as the sum ofthe risk-free interest rate and a risk premium; increases in either com-ponent reduce the price of a share and thus the price-earnings ratio.
The average return to owning equity has exceeded the averagereturn to owning debt securities over most long historical periods inthe United States. Between 1946 and 1995, for example, the extrareturn from holding a portfolio of shares that matches the Standard &Poor's (S&P) 500 composite index (an index of share prices of 500large, publicly traded U.S. firms) instead of a portfolio of Treasury billsaveraged almost 7 percent per year. Because equity returns are morevariable than bond returns, it is not surprising that equity returns aregenerally higher. But the difference in returns—the equity premium—has been larger on average than can be explained by stocks' greaterriskiness and economists' traditional assumptions about investorbehavior. The explanation for its size remains something of a mystery.
CHANGING RISK PERCEPTIONS AND FINANCIALMARKET DEVELOPMENTS
The behavior of debt and equity markets during much of the currentexpansion suggests a substantial fall in the perceived riskiness of U.S.financial assets. Although this apparent trend in risk perceptions abat-ed in the summer of 1997, when financial crises enveloped several EastAsian economies, it did not reverse in significant measure until thelate summer and fall of 1998, when risk premiums increased at analarming rate. By the end of the year, risk premiums were decliningagain but remained much higher than when the year began.
Setting the Stage: The Reduction in Perceived Risk Prior toMid-1997
In early 1997 both debt and equity markets reflected a significantrelaxation in investors' concern about the riskiness of financial assetsover the previous several years. Comparing instruments of similarmaturity, the spread between the average yield on Baa-rated corporatebonds (Baa is the rating of the median corporate bond in terms of out-standing volume) and the 30-year Treasury yield was little changedbetween the first half of 1993 and the first half of 1997. However, thespread between the yield on high-yield bonds and the 10-year Treasuryyield fell by about 1% percentage points between those two periods,
57
Digitized for FRASER http://fraser.stlouisfed.org/ Federal Reserve Bank of St. Louis

and spreads between bank loan rates and the Federal funds ratedropped as well. Equities also may have benefited from lower risk pre-miums, as a tremendous bull market raised price-earnings ratiosappreciably between late 1994 and early 1997. However, isolating theeffect of changes in risk perceptions on equity prices during this periodis difficult, because a surge in stock analysts' forecasts of earningsgrowth probably also contributed to the price rise.
The observed reduction in risk premiums could have been caused byeither an increased willingness to bear risk or a reduction in theamount of perceived risk. Because preferences toward risk probablyadjust slowly, the latter explanation is much more likely. But why didrisk perceptions change in this way? One possibility was growing spec-ulation that the U.S. economy had entered a "new era," in which fastertrend growth of real output, lower inflation, and business cycles ofsmaller amplitude or less frequency would be the norm. Another possi-bility was a strengthening belief that countries around the worldwould continue to move toward capitalism. Such a move might reducethe riskiness of certain investments in the United States, by improvingaccess to overseas markets or limiting the danger of international con-flict. The spread of capitalism might also raise the expected return toinvestments in developing countries; indeed, Table 6-1 and Chart 6-1in Chapter 6 document a substantial increase in the flow of funds todeveloping countries before 1997.
A Flight to QualityIn the summer of 1997 perceptions of risk began to change. As
emerging market economies in East Asia faltered, investors' desiredportfolios shifted toward U.S. assets. The actual quantities of domesticand foreign assets in their portfolios adjusted slowly, because manycommitments are long term, and in any case, international capitalflows must be balanced by trade in goods and services and investmentincome in any given year. However, asset prices adjusted quickly, withyields and exchange rates moving to dampen potential capital flows.Increased demand for U.S. assets, combined with an improving Feder-al budget outlook and downward revisions to expected inflation,pushed U.S. interest rates down between mid-1997 and mid-1998. Inchoosing among domestic assets, investors became a little more cau-tious, but the widening of risk spreads was generally quite limited.
Equity prices were little changed, on balance, during the second halfof 1997 but surged again during 1998. The S&P 500 jumped 22 percentbetween the beginning of 1998 and mid-July, and the NASDAQ com-posite (an index of over-the-counter stocks, including those of manystartup and high-technology companies) rose 28 percent. Many stockvaluation measures moved further beyond their historical ranges. Forexample, the ratio of stock price to lagging four-quarter earnings forthe S&P 500 reached almost 29 at the end of the second quarter, the
58
Digitized for FRASER http://fraser.stlouisfed.org/ Federal Reserve Bank of St. Louis
highest level in at least 40 years and almost double its average valuesince 1956. Nor did low interest rates on risk-free securities fullyexplain this phenomenon. The gap between the earnings-price ratio(the inverse of the price-earnings ratio) and the real 10-year Treasuryyield—the latter measured by the difference between the nominal 10-year rate and long-term inflation expectations in the PhiladelphiaFederal Reserve's survey of professional forecasters—was among thesmallest in many years.
The extraordinary valuation of equities may have been partly attrib-utable to stock analysts' expectations of very fast earnings growth.However, some market observers worried that these expectations wereunrealistic: national income had been rising more rapidly than manyeconomists believed was sustainable, and corporate profits alreadyrepresented a larger share of national income than usual. Indeed,accelerating compensation of workers left profits in the third quarter of1998 (the latest available data) slightly below their year-earlier level.
Stresses in U.S. Financial MarketsThe flight to quality intensified dramatically during the late summer
and fall of last year. The effective default on Russian government debtin August made clear that the dangers of financial turmoil—and thelimited ability of international efforts to control that turmoil—were notconfined to East Asia. In particular, the Russian debacle heightenedfears of large-scale capital outflows from Latin America, where someeconomies were, like Russia, facing large fiscal deficits. The resultinguncertainty about future economic and financial conditions around theworld caused a sudden, stunning shift in desired portfolios towardsafer assets.
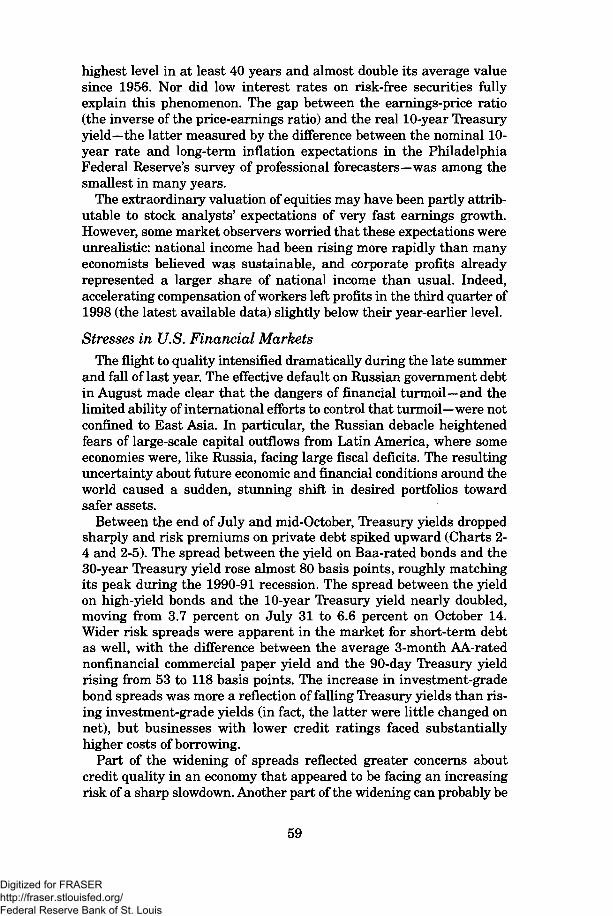
Between the end of July and mid-October, Treasury yields droppedsharply and risk premiums on private debt spiked upward (Charts 2-4 and 2-5). The spread between the yield on Baa-rated bonds and the30-year Treasury yield rose almost 80 basis points, roughly matchingits peak during the 1990-91 recession. The spread between the yieldon high-yield bonds and the 10-year Treasury yield nearly doubled,moving from 3.7 percent on July 31 to 6.6 percent on October 14.Wider risk spreads were apparent in the market for short-term debtas well, with the difference between the average 3-month AA-ratednonfinaneial commercial paper yield and the 90-day Treasury yieldrising from 53 to 118 basis points. The increase in investment-gradebond spreads was more a reflection of falling Treasury yields than ris-ing investment-grade yields (in fact, the latter were little changed onnet), but businesses with lower credit ratings faced substantiallyhigher costs of borrowing.
Part of the widening of spreads reflected greater concerns aboutcredit quality in an economy that appeared to be facing an increasingrisk of a sharp slowdown. Another part of the widening can probably be
59
Digitized for FRASER http://fraser.stlouisfed.org/ Federal Reserve Bank of St. Louis

Chart 2-4 Yields on Treasury SecuritiesLong- and intermediate-term Treasury yields declined in 1997 and then fell in thesummer and fall of 1998. Short-term yields also fell sharply in the second half of 1998.
Jan-89 Jan-90 Jan-91 Jan-92 Jan-93 Jan-94 Jan-95 Jan-96 Jan-97 Jan-98
Source: Department of the Treasury.
Chart 2-5 Risk SpreadsYield spreads between private securities and Treasury securities increaseddramatically in the summer and fall of 1998.Percentage points
11
Jan-89 Jan-90 Jan-91 Jan-92 Jan-93 Jan-94 Jan-95 Jan-96 Jan-97 Jan-98
Note: The investment-grade spread is the average yield on Baa-rated corporate securities less the30-year Treasury yield. The high-yield spread is the average yield on high-yield bonds less the 10-yearTreasury yield.Sources: Department of the Treasury, Moody's Investors Service, and Merrill Lynch.
60
Digitized for FRASER http://fraser.stlouisfed.org/ Federal Reserve Bank of St. Louis
attributed to the lesser liquidity of private issues at a time whenheightened uncertainty created larger liquidity premiums; we returnto this issue shortly. In addition, less risk-averse investors (such ashedge funds, discussed later in this chapter) faced more cautiouslenders during this period, which reduced their ability to purchaseriskier or less liquid securities.
Market conditions also worsened along several other dimensions.Issuance of new debt dropped precipitously, with public offerings ofnonfinancial corporate bonds falling roughly by half between July andSeptember. In the high-yield sector, issuance virtually ceased inAugust and September. Dealers were reluctant to manage new offer-ings into the fall, probably because of the heightened uncertainty infinancial markets and greater difficulty in placing new securities.Some firms substituted bank loans for financing in the securities mar-ket, and business lending by banks boomed. However, banks were notimmune to the rising economic uncertainty, and they tightened theirbusiness loan standards and terms.
A further worrisome development was the increasing illiquidity ofdebt markets, especially after mid-September. Bid-ask spreadswidened substantially, and dealers were less willing to enter intolarge transactions at posted rates. The price of liquidity climbed, too.So-called on-the-run Treasury securities are the most recently issuedof a given maturity, and they are traded much more actively than off-the-run securities. Because of this greater liquidity, on-the-run issuesusually offer yields that are a few basis points below off-the-run yieldsof similar maturity, but this gap widened considerably for 30-yearbonds in late September. In addition, the yield spread between theTreasury's on-the-run conventional debt and its less liquid inflation-indexed debt fell much more sharply during this period than didsurvey measures of inflation.
Equity prices slumped as well. Between July 17 and August 31, boththe S&P 500 and the NASDAQ lost about one-fifth of their value,falling a little below their levels at the beginning of the year. The Rus-sell 2000 index of small-capitalization stocks had lagged behind othermajor indexes since the spring, and by the end of August it stood near-ly 23 percent below its value at the beginning of the year. Equityissuance by nonfinancial corporations declined sharply in late summeras well.
These gyrations in financial markets took a toll on financial institu-tions. Share prices of money-center banks (which include some of thelargest commercial banks) and investment banks fell much moresharply than the broad equity indexes, in the face of rising concernabout exposure to emerging markets, the quality of loan portfolios, andpossible losses from securities trading activities. Nevertheless, theunderlying strength of the commercial banking system—whichenjoyed generally high profits, low delinquency and charge-off rates,
61
Digitized for FRASER http://fraser.stlouisfed.org/ Federal Reserve Bank of St. Louis
and ample capital—may have helped contain the financial marketdeterioration. However, several hedge funds lost large sums of money,and one very large fund narrowly averted default (as discussed in thenext section).
All of these developments raised fears of a credit crunch that couldhave significantly limited firms' access to external financing and there-by slowed capital investment and GDP growth. (Household borrowingdid not appear to be hampered by market conditions, as mortgagerates declined and banks reported no change in terms or standards onconsumer loans.) As already noted, the FOMC cut the Federal fundsrate by 1A percentage point at the end of September, but market partic-ipants' desire for safety and liquidity showed no sign of diminishing. Inresponse, the FOMC cut the funds rate by a further 1A point in mid-October, explaining that "growing caution by lenders and unsettledconditions in financial markets more generally are likely to berestraining aggregate demand in the future." The October drop in thefunds rate was the first policy change between regularly scheduledFOMC meetings since 1994, suggesting to market participants thatthe Federal Reserve had taken an aggressive easing posture.
Calm RestoredAfter this second rate cut, the stresses in financial markets began to
abate. Risk and liquidity premiums fell back a little, and debt issuancepicked up in both the investment-grade and the high-yield sectors. TheFOMC made a third ^-point cut in the Federal funds rate at itsNovember meeting, noting that, despite an improving situation infinancial markets, "unusual strains" were still present.
Financial market conditions stabilized further during the remainderof the year, and growth in bank loans eased as borrowers returned tothe capital markets. Nevertheless, risk spreads remained significantlywider than when the year began, and Treasury yields stayed low. Theyield on Baa-rated corporate debt was little changed in 1998, but thaton high-yield debt increased by about 1% percentage points. Banksreported a further tightening of loan terms and standards in Novem-ber, but average interest rates on their commercial and industrialloans were lower in late 1998 than in late 1997.
Equity markets were little changed, on net, between the end ofAugust and early October, but from there they climbed rapidly to newhighs (Chart 2-6). Between October 8 and year's end, the S&P 500gained 28 percent and the NASDAQ 55 percent. For the year as awhole the S&P 500 and the NASDAQ were up 27 and 40 percent,respectively, but the Russell 2000 lost 3 percent. The Wilshire 5000,the broadest index of U.S. equity prices, finished 1998 roughly 22 per-cent above its value at the end of 1997, achieving its fourth consecutiveyear of double-digit increases.
62
Digitized for FRASER http://fraser.stlouisfed.org/ Federal Reserve Bank of St. Louis
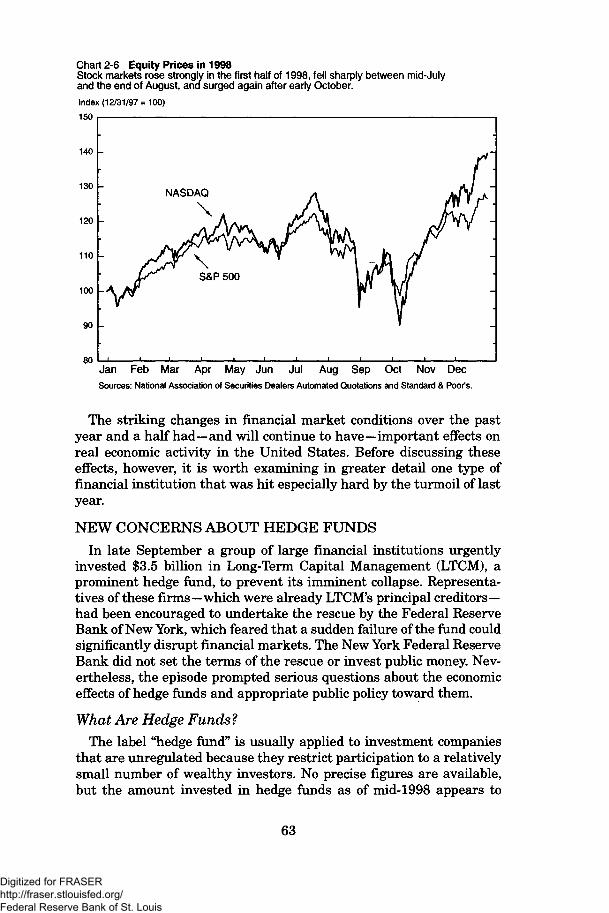
Chart 2-6 Equity Prices in 1998Stock markets rose strongly in the first half of 1998, fell sharply between mid-Julyand the end of August, and surged again after early October.
Index (12/31797 = 100)
150
140
130 *~ NASDAQ
120
110
100
90
80
\
Jan Feb Mar Apr May Jun Jul Aug Sep Oct Nov DecSources: National Association of Securities Dealers Automated Quotations and Standard & Poor's.
The striking changes in financial market conditions over the pastyear and a half had—and will continue to have—important effects onreal economic activity in the United States. Before discussing theseeffects, however, it is worth examining in greater detail one type offinancial institution that was hit especially hard by the turmoil of lastyear.
NEW CONCERNS ABOUT HEDGE FUNDS
In late September a group of large financial institutions urgentlyinvested $3.5 billion in Long-Term Capital Management (LTCM), aprominent hedge fund, to prevent its imminent collapse. Representa-tives of these firms—which were already LTCM's principal creditors—had been encouraged to undertake the rescue by the Federal ReserveBank of New York, which feared that a sudden failure of the fund couldsignificantly disrupt financial markets. The New York Federal ReserveBank did not set the terms of the rescue or invest public money. Nev-ertheless, the episode prompted serious questions about the economiceffects of hedge funds and appropriate public policy toward them.
What Are Hedge Funds ?The label "hedge fund" is usually applied to investment companies
that are unregulated because they restrict participation to a relativelysmall number of wealthy investors. No precise figures are available,but the amount invested in hedge funds as of mid-1998 appears to
63
Digitized for FRASER http://fraser.stlouisfed.org/ Federal Reserve Bank of St. Louis

have been around $300 billion. Hedge funds follow a variety of invest-ment strategies, but they often make combinations of transactionswith various counterparties designed to focus their risk exposure oncertain specific outcomes. (Derivative instruments, such as futuresand options, can be an efficient way to structure these transactions,but are not the only way.) For example, if a fund expects the yieldspread between mortgage-backed securities and U.S. Treasuries todecline, it can buy the former and sell the latter short (which meansselling securities that the fund has borrowed but does not own). Iden-tical movements in the yields of the two types of securities will be awash for the fund, but a narrowing of the yield spread will make it aprofit by increasing the value of the mortgage-backed securities rela-tive to the Treasuries. Of course, this focusing of risk does not elimi-nate risk, as an unexpected widening of the spread will create a loss forthe fund.
Hedge funds can play a useful economic role by bearing risk thatwould otherwise be borne by more risk-averse businesses and individ-uals. Hedge funds can also reduce inefficiencies in asset pricing byexploiting discrepancies in prices relative to economic fundamentals orhistorical norms. Their activity causes these discrepancies to narrow,increasing liquidity by ensuring that other market participants canbuy and sell securities at consistent prices.
LTCM had made a variety of investments all over the world, focusedprimarily on the expectation that various financial market spreadsand volatilities would converge to their historical norms. Instead, theflight to quality in 1998 increased volatility and sharply widened riskand liquidity spreads in many markets simultaneously, causing manyof LTCM's bets to lose money. Compounding these bad outcomes wasthe huge amount of borrowing that LTCM had used to finance itstransactions; through this heavy leveraging of its equity capital, thefund had raised its return when its investment decisions were correct,but had also reduced its margin for error. Before its final crisis, LTCMhad only $4 billion or so of equity capital, but over $100 billion inassets and sizable positions in futures contracts, forward contracts,options, and swaps.
If LTCM had defaulted, its creditors and counterparties could andprobably would have tried to cover their losses by selling the collateralLTCM had pledged to them. The counterparties would also have triedto rehedge newly exposed positions, which would have put additionalstrains on markets at a time when risk and liquidity premiums werealready rising sharply. Because many of LTCM's investment positionswere quite specialized, or were large relative to the markets in whichthey traded, rapid liquidation and rehedging by counterparties wouldprobably have caused big swings in some market prices. The New YorkFederal Reserve Bank was especially concerned not about the directlosses that creditors and counterparties would have incurred, but
64
Digitized for FRASER http://fraser.stlouisfed.org/ Federal Reserve Bank of St. Louis

about the potential impact of large price movements on other invest-ments by these firms and on the investments of the many individualsand institutions not associated with LTCM.
By investing several billion dollars of new capital in LTCM, its prin-cipal creditors and counterparties prevented the firm's immediatedefault. These firms probably saved money as a result, becauseunwinding LTCM's portfolio gradually was expected to be much lessdisruptive to markets and prices than a sudden liquidation.
Regulation of Hedge Funds
The near collapse of LTCM raised questions about the proper regu-latory stance toward hedge funds and other institutions that activelytrade securities and derivative instruments. Currently, hedge fundsface far less regulatory scrutiny than do many other financial institu-tions. No government agency is charged with their direct supervision.For example, hedge funds are exempt from the Investment CompanyAct of 1940 (which provides for regulation of mutual funds) because oftheir restrictions on participation. However, hedge funds' creditors andcounterparties provide some degree of "market regulation" by evaluat-ing the funds' collateral, investment positions, and equity capitalbefore doing business with them. The care exercised by these creditorsand counterparties is, in turn, monitored to some extent by the gov-ernment regulators of those institutions. These regulators include theFederal Reserve Board and the Office of the Comptroller of the Cur-rency (OCC) for banks, the Securities and Exchange Commission(SEC) for broker-dealers, and the Commodity Futures TradingCommission (CFTC) for futures commission merchants.
Of course, lending institutions' techniques for managing their creditrisks are not perfect, and market regulation cannot prevent all prob-lems arising from hedge funds. Moreover, some financial firms that arelikewise largely unregulated, such as certain broker-dealer affiliates,also engage in leveraged trading strategies. Following the near col-lapse of LTCM, the Secretary of the Treasury called on the President'sWorking Group on Financial Markets, which he chairs, to study theimplications of the operations of firms such as LTCM and their rela-tionships with their creditors. (This working group was established byexecutive order in 1988. Its members are the Secretary of the Treasury,the Chairman of the Board of Governors of the Federal Reserve Sys-tem, the Chairman of the SEC, and the Chairperson of the CFTC.Additional participants are the Federal Deposit Insurance Corpora-tion, the Office of Thrift Supervision, the New York Federal ReserveBank, the OCC, the National Economic Council, and the Council ofEconomic Advisers.)
Should there be more government regulation of hedge funds andother highly leveraged financial institutions? One justification for reg-ulating financial institutions generally is to reduce systemic risk—the
65
Digitized for FRASER http://fraser.stlouisfed.org/ Federal Reserve Bank of St. Louis
chance of a general breakdown in the functioning of financial markets.This risk arises largely from the asymmetry of information that isintrinsic to capital markets. Because market participants have diffi-culty judging the financial health of institutions, they cannot fullyunderstand the risk of their investments. Moreover, bad news aboutone firm can have a contagion effect on others, reducing their access tocapital as well. This spillover effect may have been exacerbated byfinancial innovation, which has linked the fortunes of financial insti-tutions in ever more complex and subtle ways. Further, when financialinstitutions fail, asset prices in illiquid markets may overshoot theirlong-run values.
But even if market participants had better information and morefully understood the risks of their investments, they might take morerisk than is socially desirable. Of course, every firm has an incentiveto restrain its risk taking in order to protect its capital, and firm man-agers have an incentive to protect their own investments in the firm.However, no firm has an incentive to limit its risk taking in order toreduce the danger of contagion for other firms. In addition, somefirms take more risk because of deposit insurance, which makes iteasier for banks to attract depositors without having to demonstratefinancial soundness. Some very large firms may take additional riskbecause they believe that the government views them as "too big tofail" and would step in to prevent their collapse.
The collapse of LTCM might have posed a larger systemic risk thanthe collapse of almost any other hedge fund at almost any other time.Few institutions are as large or as leveraged as LTCM was, and themarket strains that its default would have provoked would have beenespecially severe during the extreme worldwide flight to quality andliquidity that occurred last fall. One can argue that the risk man-agement practices of both hedge funds themselves and the firmswith which they deal should give more weight to the likelihood ofsuch unusual events, and indeed the experience of 1998 may havechastened financial institutions in this regard.
Despite the risks just described, determining the appropriateness ofgovernment regulation of hedge funds and other leveraged institutionsis not straightforward. The study by the President's working group,expected to be completed early this year, will address a number of pos-sible regulatory issues, including disclosure and leverage. With respectto disclosure, it appears that LTCM's creditors lent to the fund on thebasis of insufficient information, or failed to analyze adequately theinformation they had. Market participants now appear to be demand-ing more disclosure from hedge funds, which is a positive development.The working group is exploring whether the government shouldrequire additional disclosure to counterparties, creditors, investors,regulators, or the public.
66
Digitized for FRASER http://fraser.stlouisfed.org/ Federal Reserve Bank of St. Louis
With respect to leverage, the degree of LTCM's leverage caused therisks in its portfolio to be transmitted more rapidly to other marketparticipants. Creditors to hedge funds now appear to be reducing theamount of leverage they are willing to provide, which is another posi-tive development. In addition, bank regulators can employ their exist-ing regulatory tools to induce banks to make more prudent decisions.The working group is evaluating whether the government should domore to discourage excessive leverage, and if so, what specific stepsmight be appropriate.
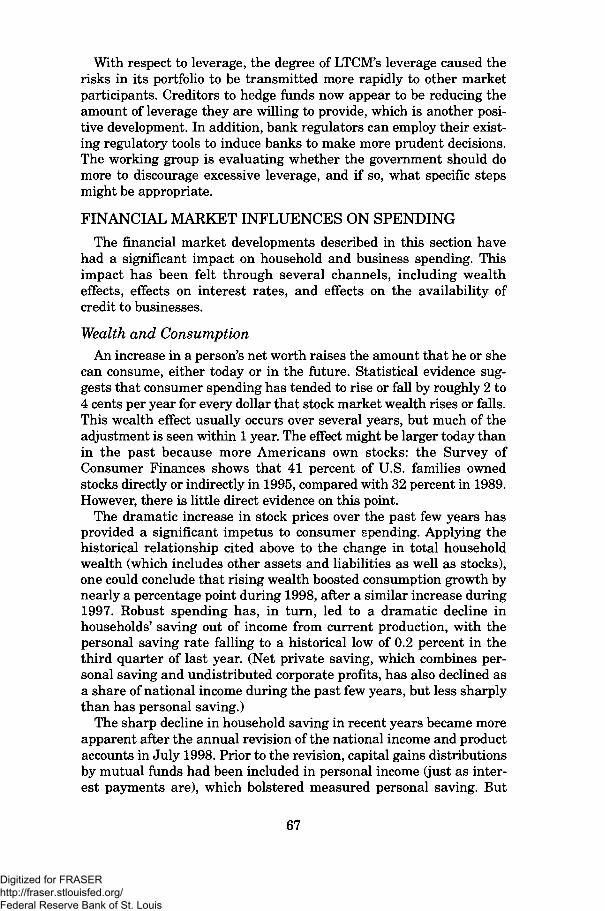
FINANCIAL MARKET INFLUENCES ON SPENDINGThe financial market developments described in this section have
had a significant impact on household and business spending. Thisimpact has been felt through several channels, including wealtheffects, effects on interest rates, and effects on the availability ofcredit to businesses.
Wealth and ConsumptionAn increase in a person's net worth raises the amount that he or she
can consume, either today or in the future. Statistical evidence sug-gests that consumer spending has tended to rise or fall by roughly 2 to4 cents per year for every dollar that stock market wealth rises or falls.This wealth effect usually occurs over several years, but much of theadjustment is seen within 1 year. The effect might be larger today thanin the past because more Americans own stocks: the Survey ofConsumer Finances shows that 41 percent of U.S. families ownedstocks directly or indirectly in 1995, compared with 32 percent in 1989.However, there is little direct evidence on this point.
The dramatic increase in stock prices over the past few years hasprovided a significant impetus to consumer spending. Applying thehistorical relationship cited above to the change in total householdwealth (which includes other assets and liabilities as well as stocks),one could conclude that rising wealth boosted consumption growth bynearly a percentage point during 1998, after a similar increase during1997. Robust spending has, in turn, led to a dramatic decline inhouseholds' saving out of income from current production, with thepersonal saving rate falling to a historical low of 0.2 percent in thethird quarter of last year. (Net private saving, which combines per-sonal saving and undistributed corporate profits, has also declined asa share of national income during the past few years, but less sharplythan has personal saving.)
The sharp decline in household saving in recent years became moreapparent after the annual revision of the national income and productaccounts in July 1998. Prior to the revision, capital gains distributionsby mutual funds had been included in personal income (just as inter-est payments are), which bolstered measured personal saving. But
67
Digitized for FRASER http://fraser.stlouisfed.org/ Federal Reserve Bank of St. Louis

these distributions do not represent income from current production,and the revised data correctly exclude them from income. The revisionlowered the measured personal saving rate, and by a greater amountin more recent years because capital gains distributions by mutualfunds were greater. However, the revision had no effect on privatesaving, because the markdown of personal saving was automaticallyoffset by an increase in the measured undistributed profits of themutual fund industry.
Interest Rates and ConsumptionChanges in interest rates affect household spending through various
channels. Consider a decline in rates. This tends to boost the value ofstocks and bonds, which has a wealth effect on consumption as dis-cussed above. In addition, lower rates encourage spending on houses,automobiles, and other durable goods often bought on credit, whilereducing the return on new saving. Moreover, a decline in interestrates augments homeowners' cash flow by reducing payments onadjustable rate mortgages and spurring mortgage refinancing. At thesame time, however, lower interest rates work to reduce spending inseveral ways. Household cash flow is diminished by a drop in interestincome, and people who are saving to reach a target level of wealthneed to save more to reach that target. On balance, lower rates proba-bly stimulate household spending, and higher rates probably dampenit, but the magnitude of these effects is unclear.
Nominal interest rates on Treasury securities reached unusually lowlevels last year. For example, for the year as a whole, the average10-year Treasury yield was the lowest since 1967, and at the peak ofthe financial market stress in early October the 10-year yield touchedits lowest value since 1964. Real Treasury yields (as measured by thedifference between nominal yields and survey measures of inflationexpectations) were also low, although less exceptionally so. Interestrates facing household borrowers did not fall as sharply as did Trea-sury rates last year; for example, interest rates on consumer loansfrom commercial banks were only slightly lower in 1998 than in 1997,and credit card rates were roughly unchanged. But rates on fixed ratemortgages averaged more than Vi percentage point lower in 1998 thanin 1997.
Financial Conditions and Business InvestmentFor several years through mid-1998, businesses enjoyed ready
access to external funding on favorable terms. This circumstance wasone of the factors encouraging the brisk pace of capital investment, asreported in the following section. Last year's sudden flight to qualitychanged this situation abruptly, raising borrowing costs for some busi-nesses and limiting others' ability to borrow. However, one should notoverstate the impact of these developments on economic activity. As
68
Digitized for FRASER http://fraser.stlouisfed.org/ Federal Reserve Bank of St. Louis
noted earlier, investment-grade borrowers faced essentially the samecost of long-term debt capital at the end of 1998 as at the beginning,although riskier borrowers saw their borrowing costs rise. Financialmarkets and institutions continued to funnel substantial funds to busi-nesses. Moreover, most businesses do not face an overwhelming bur-den of servicing existing debt. The aggregate debt-service burden fornonfinancial corporations—measured as the ratio of net interest pay-ments to cash flow—fell roughly by half between 1990 and 1996 andthen slipped a little further in the following 2 years.
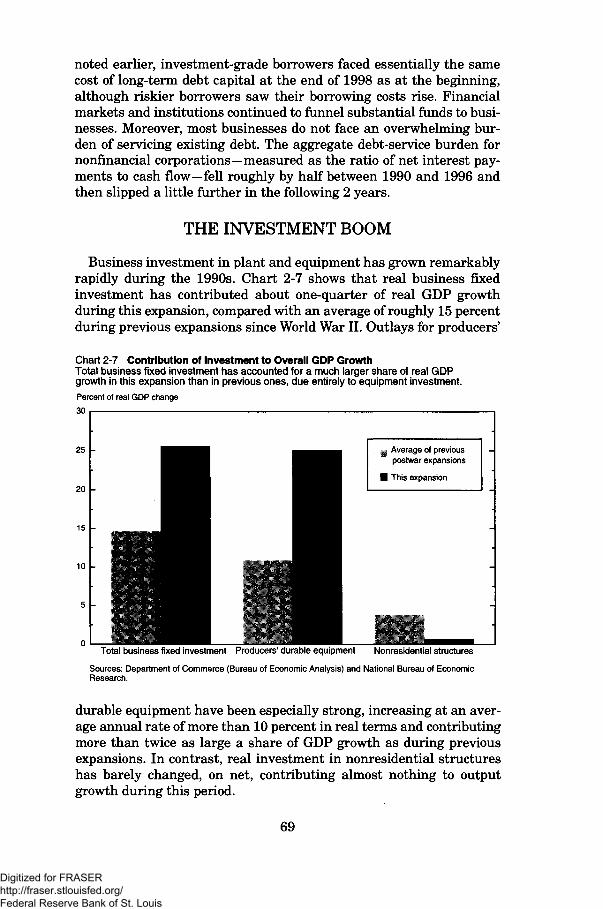
THE INVESTMENT BOOM
Business investment in plant and equipment has grown remarkablyrapidly during the 1990s. Chart 2-7 shows that real business fixedinvestment has contributed about one-quarter of real GDP growthduring this expansion, compared with an average of roughly 15 percentduring previous expansions since World War II. Outlays for producers'
Chart 2-7 Contribution of Investment to Overall GDP GrowthTotal business fixed investment has accounted for a much larger share of real GDPgrowth in this expansion than in previous ones, due entirely to equipment investment.Percent of real GDP change
30
Average of previouspostwar expansions
Total business fixed investment Producers' durable equipment Nonresidential structures
Sources: Department of Commerce (Bureau of Economic Analysis) and National Bureau of EconomicResearch.
durable equipment have been especially strong, increasing at an aver-age annual rate of more than 10 percent in real terms and contributingmore than twice as large a share of GDP growth as during previousexpansions. In contrast, real investment in nonresidential structureshas barely changed, on net, contributing almost nothing to outputgrowth during this period.
69
Digitized for FRASER http://fraser.stlouisfed.org/ Federal Reserve Bank of St. Louis

CAUSES OF THE BOOMThe pace of investment depends on decisions made by myriad indi-
vidual firms, each reacting to a variety offerees. Still, one can identifyat least four general factors that have contributed to the recent surgein investment.
Rapid Output Growth
One key factor is the rapid growth of output during the past severalyears. In a simple model, a firm's desired capital stock depends on itsexpected sales, as well as on the cost of capital and other factors. Anincrease in expected sales induces an increase in desired capital, whichrequires investment. The level of investment thus depends on thechange in sales; if one views sales as the rate at which firms are dis-tributing their products, the change in sales is an acceleration of thatrate, and this sort of model is therefore called an "accelerator model."
A pure accelerator model expresses aggregate investment only as afunction of output growth, typically with several lags built in to cap-ture both a gradual adjustment of sales expectations and a gradualadjustment of the capital stock to its desired level. The capital stockadjusts gradually because firms often choose to install new capitalslowly, in order to reduce the cost of installation. Research using moreelaborate accelerator models shows that they can explain a large shareof the variation in equipment investment over the past severaldecades, and a smaller share of the variation in building of nonresi-dential structures. Of course, the observed correlation between outputgrowth and investment reflects not only the influence of the former onthe latter but also the reverse: strong investment also boosts output.Nevertheless, strong demand outside of the investment sector in recentyears has clearly helped to boost investment demand through thisaccelerator effect.
Robust ProfitsA second factor underlying strong investment has been robust cor-
porate profits. Although profit growth waned in 1998, economic profits(defined as book profits adjusted for changes in inventory valuationand for capital consumption) represented almost 12 percent of nation-al income in the first three quarters of 1998, well above the 1980s peakof about 9 percent. (Profits peaked at over 14 percent of nationalincome in the 1960s.) The increasing share of profits in nationalincome over the past 5 years is mirrored by a declining share of netinterest payments (Chart 2-8); the sum of these components now rep-resents roughly the same portion of national income as during the1980s. Thus, much of the runup in profits has been simply a shift incapital income from debtholders to equityholders. After-tax profits—which represent the funds available for payments to stockholders and
70
Digitized for FRASER http://fraser.stlouisfed.org/ Federal Reserve Bank of St. Louis
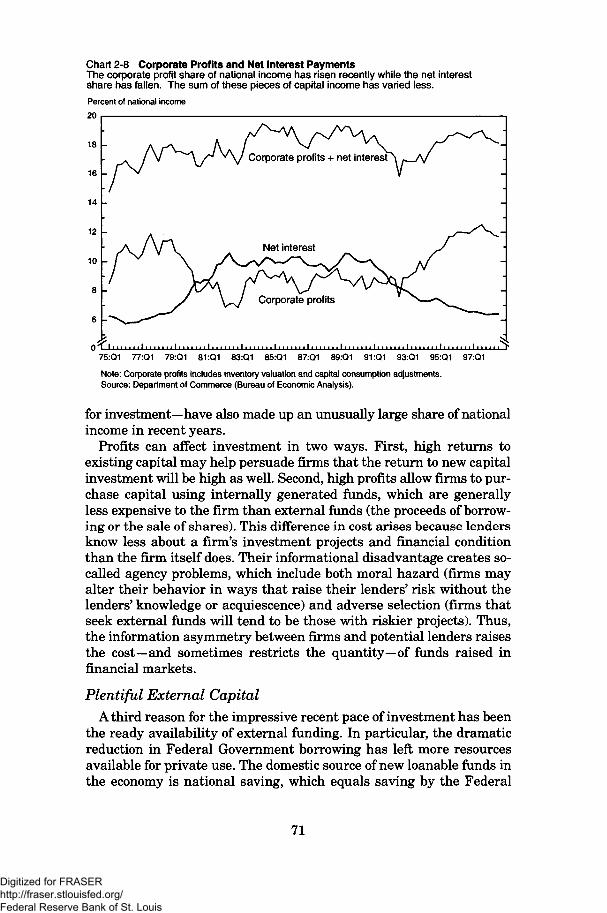
Chart 2-8 Corporate Profits and Net Interest PaymentsThe corporate profit share of national income has risen recently while the net interestshare has fallen. The sum of these pieces of capital income has varied less.
Percent of national income
20
Corporate profits + net interest
75:Q1 77:Q1 79:Q1 81:Q1 83:Q1 85:Q1 87:Q1 89:Q1 91:Q1 93:Q1 95:Q1 97:Q1
Note: Corporate profits includes inventory valuation and capital consumption adjustments.Source: Department of Commerce (Bureau of Economic Analysis).
for investment—have also made up an unusually large share of nationalincome in recent years.
Profits can affect investment in two ways. First, high returns toexisting capital may help persuade firms that the return to new capitalinvestment will be high as well. Second, high profits allow firms to pur-chase capital using internally generated funds, which are generallyless expensive to the firm than external funds (the proceeds of borrow-ing or the sale of shares). This difference in cost arises because lendersknow less about a firm's investment projects and financial conditionthan the firm itself does. Their informational disadvantage creates so-called agency problems, which include both moral hazard (firms mayalter their behavior in ways that raise their lenders' risk without thelenders' knowledge or acquiescence) and adverse selection (firms thatseek external funds will tend to be those with riskier projects). Thus,the information asymmetry between firms and potential lenders raisesthe cost—and sometimes restricts the quantity—of funds raised infinancial markets.
Plentiful External CapitalA third reason for the impressive recent pace of investment has been
the ready availability of external funding. In particular, the dramaticreduction in Federal Government borrowing has left more resourcesavailable for private use. The domestic source of new loanable funds inthe economy is national saving, which equals saving by the Federal
71
Digitized for FRASER http://fraser.stlouisfed.org/ Federal Reserve Bank of St. Louis
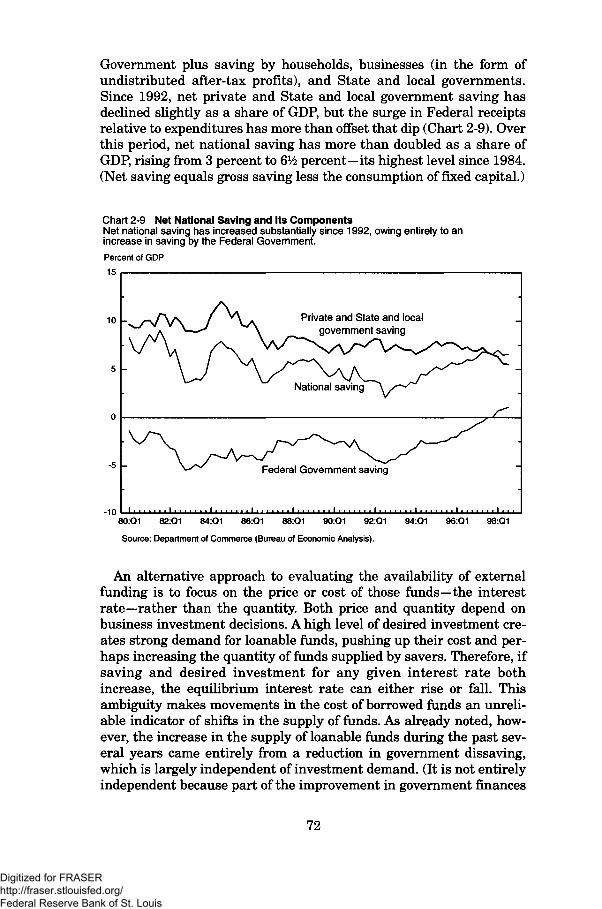
Government plus saving by households, businesses (in the form ofundistributed after-tax profits), and State and local governments.Since 1992, net private and State and local government saving hasdeclined slightly as a share of GDP, but the surge in Federal receiptsrelative to expenditures has more than offset that dip (Chart 2-9). Overthis period, net national saving has more than doubled as a share ofGDP, rising from 3 percent to 6% percent—its highest level since 1984.(Net saving equals gross saving less the consumption of fixed capital.)
Chart 2-9 Net National Saving and Its ComponentsNet national saying has increased substantially since 1992, owing entirely to anincrease in saving by the Federal Government.
Percent of GDP
15
10 Private and State and localgovernment saving
-5 Federal Government saving
-1080:Q1 82:Q1 84:Q1 86:Q1 88:Q1 90:Q1 92:Q1
Source: Department of Commerce (Bureau of Economic Analysis).
94:Q1 96:Q1 98:Q1
An alternative approach to evaluating the availability of externalfunding is to focus on the price or cost of those funds—the interestrate—rather than the quantity. Both price and quantity depend onbusiness investment decisions. A high level of desired investment cre-ates strong demand for loanable funds, pushing up their cost and per-haps increasing the quantity of funds supplied by savers. Therefore, ifsaving and desired investment for any given interest rate bothincrease, the equilibrium interest rate can either rise or fall. Thisambiguity makes movements in the cost of borrowed funds an unreli-able indicator of shifts in the supply of funds. As already noted, how-ever, the increase in the supply of loanable funds during the past sev-eral years came entirely from a reduction in government dissaving,which is largely independent of investment demand. (It is not entirelyindependent because part of the improvement in government finances
72
Digitized for FRASER http://fraser.stlouisfed.org/ Federal Reserve Bank of St. Louis

is attributable to the strong economy, which in turn is due partly tostrong investment.)
In addition to national saving, another source of funds for invest-ment is capital inflows from abroad. In the national income and prod-uct accounts, domestic investment equals national saving (plus a sta-tistical discrepancy) less net foreign investment, which is the amountthat domestic residents are lending abroad less the amount that for-eigners are lending to us. Net foreign investment has been significant-ly negative on average during this decade (that is, foreigners have beeninvesting more capital in the U.S. economy than Americans have beeninvesting abroad), as it was during the 1980s, providing additionalresources for domestic investment. As with private domestic saving,however, the net capital inflow depends partly on the demand forinvestment funds, so it cannot be considered an independent cause ofstrong investment.
Falling Computer Prices
A fourth factor spurring investment during the past several yearshas been a remarkable drop in the price of computers. (Prices havealso fallen for some other capital goods, although less dramatically.)Continued technological advances pushed down the chain-weightedprice index for business computers and peripheral equipment byabout 30 percent at an annual rate during the first three quarters of1998, following declines of around 25 percent during both 1996 and1997. The combination of falling prices, new products, more innova-tive applications of existing technology, and concerns about the year2000 problem (discussed later in this chapter) has sharply boostedoutlays in this area. Between the end of 1995 and the third quarter of1998, nominal computer spending increased roughly 30 percent, andreal computer spending tripled. Nominal computer spending is nowroughly twice what it was at the end of the 1980s, and real computerspending is about 12 times as large. This exceptional advance in realcomputer spending has comprised a significant part of growth in realequipment investment.
IMPLICATIONS OF THE INVESTMENT BOOM
The 1990s boom in business fixed investment has generated a sig-nificant increase in the Nation's stock of business capital. The largercapital stock has benefited the economy in two important ways: it hashelped restrain inflation by increasing industrial capacity, and it hashelped raise productivity.
Capacity Utilization and Inflation
When demand for resources in the economy exceeds supply, inflationusually results. The simplest measure of the utilization of laborresources is the unemployment rate. Inflation often rises when labor
73
Digitized for FRASER http://fraser.stlouisfed.org/ Federal Reserve Bank of St. Louis

markets are tight, because competition for workers among firms putsupward pressure on wages; if these wage increases are not matched byincreases in productivity, firms face higher costs of production andraise their prices as a result. Consequently, the unemployment rate isuseful in predicting inflation, although of course the relationship is farfrom perfect.
The simplest measure of the utilization of capital resources is thecapacity utilization rate. Inflation often rises when capacity utilizationis high because the marginal cost of production is higher in those situ-ations, and higher marginal costs can lead to higher prices. The capac-ity utilization rate reported by the Federal Reserve Board is the ratioof the actual level of output to a sustainable maximum level of output(or capacity), based on a realistic work schedule and normal downtime.The Federal Reserve produces these numbers for the industrial sector(manufacturing, mining, and utilities) only, using data from the Surveyof Plant Capacity collected by the Census Bureau. The correlationbetween the capacity utilization rate and acceleration of the core CPIis positive and fairly high, even though capacity utilization data applyto only a portion of the economy. (Because final demand for services ismore stable over the business cycle than final demand for goods, thefocus of capacity utilization on the goods-producing sector may not rep-resent a significant obstacle to predicting cyclical pressures for infla-tion.) In time-series models, capacity utilization is often an importantpredictor of inflation, and several studies have found that the nonac-celerating-inflation rate of capacity utilization (analogous to the nonac-celerating-inflation rate of unemployment, or NAIRU) is close to themean value of that series.
Despite the historical relationship between the unemployment rateand inflation, the very low unemployment rate of the past severalyears has not produced an increase in inflation. Indeed, core inflationhas dropped, on net, during this period. One factor that may havehelped hold down inflation is the rapid pace of investment, which hascaused total industrial capacity to grow faster in each of the past 4years than in any other year since 1967, when the series began. As aresult, capacity utilization has stayed fairly close to its long-runaverage since 1996 in spite of substantial output growth and risingutilization of labor resources.
ProductivityThe accumulation of capital boosts the productivity of labor through
capital deepening, or increases in the quantity or quality of capital perworker. New capital can also embody technological advances or innova-tive ways of organizing work that raise the productivity of both labor andcapital, known as multifactor productivity or total factor productivity.
The Bureau of Labor Statistics breaks down growth in potentialoutput into changes in the quantity of labor and changes in labor
74
Digitized for FRASER http://fraser.stlouisfed.org/ Federal Reserve Bank of St. Louis
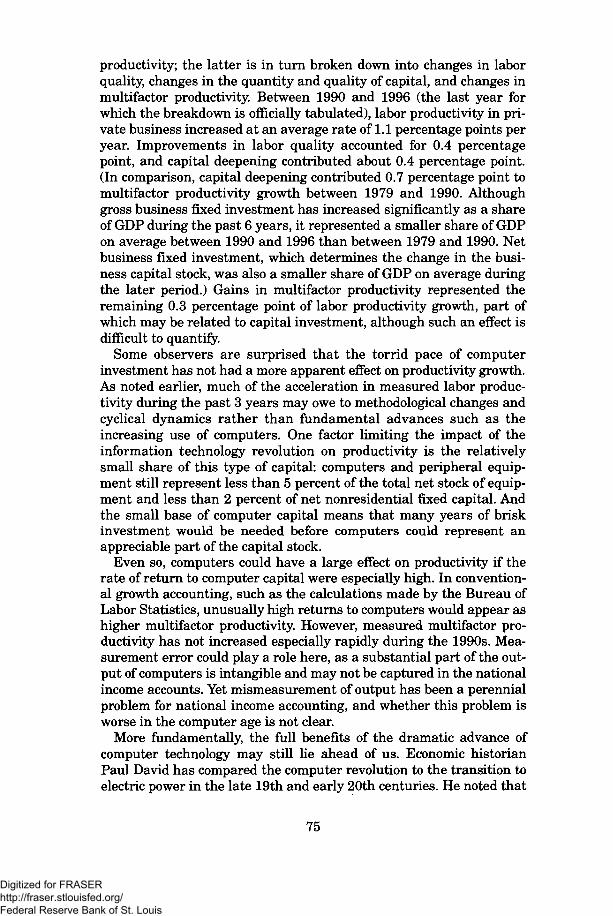
productivity; the latter is in turn broken down into changes in laborquality, changes in the quantity and quality of capital, and changes inmultifactor productivity. Between 1990 and 1996 (the last year forwhich the breakdown is officially tabulated), labor productivity in pri-vate business increased at an average rate of 1.1 percentage points peryear. Improvements in labor quality accounted for 0.4 percentagepoint, and capital deepening contributed about 0.4 percentage point.(In comparison, capital deepening contributed 0.7 percentage point tomultifactor productivity growth between 1979 and 1990. Althoughgross business fixed investment has increased significantly as a shareof GDP during the past 6 years, it represented a smaller share of GDPon average between 1990 and 1996 than between 1979 and 1990. Netbusiness fixed investment, which determines the change in the busi-ness capital stock, was also a smaller share of GDP on average duringthe later period.) Gains in multifactor productivity represented theremaining 0.3 percentage point of labor productivity growth, part ofwhich may be related to capital investment, although such an effect isdifficult to quantify.
Some observers are surprised that the torrid pace of computerinvestment has not had a more apparent effect on productivity growth.As noted earlier, much of the acceleration in measured labor produc-tivity during the past 3 years may owe to methodological changes andcyclical dynamics rather than fundamental advances such as theincreasing use of computers. One factor limiting the impact of theinformation technology revolution on productivity is the relativelysmall share of this type of capital: computers and peripheral equip-ment still represent less than 5 percent of the total net stock of equip-ment and less than 2 percent of net nonresidential fixed capital. Andthe small base of computer capital means that many years of briskinvestment would be needed before computers could represent anappreciable part of the capital stock.
Even so, computers could have a large effect on productivity if therate of return to computer capital were especially high. In convention-al growth accounting, such as the calculations made by the Bureau ofLabor Statistics, unusually high returns to computers would appear ashigher multifactor productivity. However, measured multifactor pro-ductivity has not increased especially rapidly during the 1990s. Mea-surement error could play a role here, as a substantial part of the out-put of computers is intangible and may not be captured in the nationalincome accounts. Yet mismeasurement of output has been a perennialproblem for national income accounting, and whether this problem isworse in the computer age is not clear.
More fundamentally, the full benefits of the dramatic advance ofcomputer technology may still lie ahead of us. Economic historianPaul David has compared the computer revolution to the transition toelectric power in the late 19th and early 20th centuries. He noted that
75
Digitized for FRASER http://fraser.stlouisfed.org/ Federal Reserve Bank of St. Louis

the productivity gains from the electrification of manufacturing werenot large at first but became quite substantial several decades afterthe opening of the first central power station. Box 2-1 examines thehypothesis that rising productivity follows major technical innovationswith a considerable lag, and considers whether productivity patternsin the information age are likely to mirror those that followed thewidespread adoption of electrical power.
MACROECONOMIC IMPLICATIONSOF THE Y2K PROBLEM
It is now less than a year until the widely anticipated arrival of theyear 2000 problem, called Y2K for short (or, more colorfully, the "mil-lennium bug" or "millennium bomb"). Many older computer programs,including those running on microprocessors embedded in other elec-tronic products, encode the current year using only the last two digits.Thus, when January 1, 2000, arrives, they may fail to recognize "00" as
Box 2-1.—The Electrical Re volution, the Computer Revo-lution, and Productivity
Although the electric dynamo was invented well before the turnof the century, it did not seem to fuel large gains in productivityuntil many years later. One economic historian reports that tJ*S*productivity grew more slowly between 1&9Q and 1913 than previ-ously, but it increased rapidly between 1919 and 1929, and heattributes half of the acceleration in manufacturing productivityrelative to the preceding decade to growth in electric motor capac-ity. Drawing a parallel between this episode and the spread ofcomputing technology in our own time^ he argues that an extend-ed process of technological diffusion may now be under way, whichmay yield large productivity gains in the future. Others havenoted similar lagged productivity effects following the introduc-tion of steam power and the development of the automobile.
The slow diffusion of electric power may be explained primarilyby the need to build new factories and redesign manufacturingprocesses in order to take full advantage of the new technology.Many manufacturers would have gained little from simply replac-ing a large steam power unit with a large electric power unit inthe same factory. Substantial cost savings were available overtime from building new factories: electric-powered factories couldbe single-story and less sturdy, machinery could be reconfiguredmore easily, and the flexibility of wiring meant that portionsof plants could be shut down individually. However, newconstruction was generally unprofitable until existing plants had
76
Digitized for FRASER http://fraser.stlouisfed.org/ Federal Reserve Bank of St. Louis
the year 2000, mistaking it instead for 1900. The result could be incor-rect output or total system failure. Although it sounds to many at firstlike a trivial matter, of interest only to computer engineers and pro-grammers, in fact the Y2K problem is potentially extremely serious,given the central role that computer technology has taken in our lives.Problems caused by the Y2K bug in one company, industry, or sectormay have widespread consequences in others.
There are many conceivable Y2K disaster scenarios. Most involvedisruptions to some critical infrastructure that links the rest of theeconomy together, such as transportation systems, power distributiongrids, or telecommunications or financial networks. Such disruptionswould likely have effects that are more than proportionate to the sizeof the sector directly affected. Some observers warn that in January2000 planes may stop flying, telephone traffic may be disconnected,financial transactions may not go through, power grids may shutdown, and so on. Others have worried that Social Security recipientsmight not receive their checks (although, as Box 2-2 notes, the Social
Box 2-1.—continued
depreciated. In addition, a relatively loose industriallabor marketat the turn of the century kept the price of labor low and discour-ajpNl manufacturers from substituting capital for labor. Realwages in the United States did not rise enough to motivate signif-icatit expansion of the capital stock until immigration fromEurope was curtailed during World War I, Lastly, implementingthe new processes throughout the economy required a consider-able supply of specialized talent—electrical engineers and factoryarchitects experienced in the new designs—which developed onlyslowly.
Whether productivity in the information age will follow thepath of productivity in the electric age remains to be seen. Theintroduction of computer technology is similar in many ways tothe transition to electric power. Integrating computers into thework environment is not a straightforward matter: firms areclearly still adapting the organization of work to take maximumadvantage of the new technology At the same time, the diffusionof computers differs from the spread of electricity in importantways. For example, computers have already spread through theeconomy much faster than electric power did, at least in partbecause of their plunging prices. The historical analogy isintriguing and has appealing implications, but even its mainproponent warns against taking it too literally It is simply toosoon to know whether the computer revolution will generate asurge in productivity growth ahead.
77
Digitized for FRASER http://fraser.stlouisfed.org/ Federal Reserve Bank of St. Louis
Box 2-2.—Preparing Federal Systems for the Year 2000The Federal Government is a sufficiently large player in the
economy that a failure of its own operations due to the Y2K prob-lem would cause great inconvenience and hardship to many Amer-icans, even if it did not impact the macroeconomy. The FederalGovernment operates some of the largest, most complex computersystems in the world, which provide services to millions of Ameri-cans. At the Social Security Administration (SSA) alone, informa-tion systems track annual earnings for more than 125 millionworkers, take 6 million applications for benefits each year, andmake monthly benefit payments to 48 million Americans. TheFederal Government also exchanges vast amounts of informationwith the States, which administer key Federal programs such asthe food stamp program, Medicaid, and unemployment insurance.
Preparing Federal systems for the year 2000 is an enormouschallenge, and agencies have mounted aggressive efforts to ensurethat their critical services will not be disrupted. SSA was the firstagency to begin work on the Y2K problem, as long ago as 1989. By1995 several agencies had Y2K projects under way and were shar-ing information with each other about their efforts. In 1995 theOffice of Management and Budget (OMB) formed an interagencycommittee, which it asked the SSA to chair, to coordinate the var-ious Federal efforts. In 1996 the Chief Information Officers Coun-cil was assigned the responsibility of building on and overseeingthe committee's work.
Since early 1997 the OMB has produced quarterly reports onagencies* progress in assessing, remediating, testing, and imple-menting critical systems. The Administration has established agoal of having all critical systems compliant by March 1999. As ofNovember 15,1998, 61 percent were already compliant, up from27 percent a year earlier. A small percentage of critical systems
Security Administration is already Y2K-compliant) and even thathospital life-support systems might shut down.
Huge efforts to address the Y2K problem have been under way forsome time, especially in large corporations and financial markets andin the U.S. Government (see Box 2-2 on Federal Y2K efforts; see alsoBox 5-3 in Chapter 5, on the Administration's initiative to encourageY2K information sharing among companies). The American economy islarge, diverse, and resilient, and people will find ways around thosedisruptions that, despite everyone's best efforts, will inevitably occur.But it is essential to guard against complacency. Some, in particularsome smaller companies and some State and local governments, havenot yet gotten the message.
78
Digitized for FRASER http://fraser.stlouisfed.org/ Federal Reserve Bank of St. Louis
Box 2-2.—continuedare not expected to meet the March goal, and their agencies havebeen instructed to produce specific benchmarks showing how theywill complete work on these systems before January 1, 2000, andto create contingency plans where necessary.
Federal payment systems are of particular concern to the publicand the economy. Social Security and veterans' benefits systemsare already compliant, and the Internal Revenue Service appearswell on its way to being able to collect and process tax returns andissue refunds in a timely manner. For Medicare, which continuesto face major system challenges, the Health Care FinancingAdministration is developing contingency plans to ensure thathealth care funding is not disrupted. State-run systems foradministering Federal benefit programs play a critical role in dis-tributing a wide range of benefits, and a few States are receivingincreased attention from Federal agencies.
The OMB also works with agencies to ensure that they haveadequate financial resources to address the problem. In the fall of1998 the Congress provided a $3.35 billion emergency fund toensure that unanticipated Y2K funding needs are met and that nosystem will fail for lack of financial resources.
In February 1998 the President's Council on Year 2000 Conver-sion was created to coordinate the Federal Government's Y2Kefforts. The council works with the OMB to ensure that agenciesare making the most effective use of their financial and humanresources to prepare their systems. The council is also concernedwith reaching out beyond the Federal Government to promoteaction on the problem and to offer support to Y2K efforts in theprivate sector, by State, local, and tribal governments, and byinternational entities.
Some foreign countries have only recently gotten the message aswell. Thus concern has shifted recently to the international dimension.Y2K problems can be transmitted not just from one company to anoth-er, but also from one country to another. Australia and Canada areclassed with the United States among those countries relatively faralong in their remedial efforts. But some European countries havebeen diverted by another large information processing task, namely,that of converting their information systems to deal with the newEuropean currency, the euro, which came into existence in January1999. In many countries, preparations are not as far along as theyshould be. The reassuring notion that developing countries are not yetas dependent on computers as are many industrial countries is
79
Digitized for FRASER http://fraser.stlouisfed.org/ Federal Reserve Bank of St. Louis
outweighed by the fact that their equipment is likely to be older andtherefore may contain more of the old two-digit coding.
Those companies and countries that only began to address the Y2Kproblem in 1998 now find themselves in a race against time. And anythat have still not begun to deal with the problem will probably findtheir efforts have come too late. In such cases, business continuityplanning to minimize probable disruptions is particularly necessary.
A few Wall Street forecasters have assigned high odds to the likeli-hood that the Y2K problem will lead to a serious global recession. Suchforecasts seem excessively dire. Even if disruptions turn out to bemore serious than most analysts expect, they will most likely show upprimarily as inconveniences and losses in certain sectors. It is less like-ly that they would manifest themselves as the sort of economy-widemacroeconomic disturbances that can lead to a recession. In otherwords, aggregate economic statistics such as GDP and employmentwill probably not reflect Y2K effects to any noticeable extent. However,it would be unwise to state categorically that a Y2K recession is not inthe cards. Computer technology is so pervasive in our lives that it isdifficult to predict all the possible sources of danger.
Some effects on the demand side of the economy can reasonably bepredicted—indeed, they are already upon us. First, the need to addressthe Y2K problem is already boosting demand for computer hardwareand software, both to retrofit older machines and programs and to pur-chase new equipment that is Y2K-compliant. From a review of quar-terly 10-K reports filed by Fortune 500 firms, the Federal ReserveBoard has estimated that these large companies will spend a total of$50 billion on Y2K fixes. Indeed, this spending probably helps explainwhy real investment in computers and peripheral equipment in late1998 was running more than 60 percent above its level a year earlier.Sometime later in 1999, it is likely that a tendency for firms to freezetheir systems, so as not to be caught in midstream when January 1,2000, arrives, will work to moderate Y2K spending. Thereafter a sec-ond burst of pent-up computer spending may occur, especially if newY2K-related problems are revealed.
The Y2K problem is also increasing demand for the services of com-puter programmers. This effect should reverse after 2000, if all goeswell, but it is likely to persist for some time after January 1. Not onlymay unanticipated glitches be discovered and need to be fixed, butcompanies are also likely to face a backlog of upgrade tasks that theyhad postponed in order to divert programming resources to Y2K issues.Economists at the Federal Reserve Board have pointed out that theincreased demand for computer goods and services may not be showingup in GDP, to the extent that it takes the form of firms reallocatingtheir own computer support services to work on the problem. To thecontrary, they point to a negative effect on productivity resulting fromthe diversion of resources from what would otherwise be investment in
80
Digitized for FRASER http://fraser.stlouisfed.org/ Federal Reserve Bank of St. Louis
new productive capacity, and they estimate a loss to U.S. productivitydue to such diversion of 0.1 to 0.2 percent per year in 1998 and 1999.
Uncertainty over the performance of information and delivery sys-tems might lead firms to stockpile inventories in the runup to Janu-ary 2000. Uncertainty has a positive effect on the demand for inven-tories at every stage of production, from raw materials such as oil andother mineral and agricultural products to retailers' inventories ofconsumer goods. The Y2K inventory effect should provide a clearboost to GDP in the fourth quarter of 1999, offset by a correspondingnegative effect in early 2000. But this possibility implies no particulardistortion of economic activity and calls for no particular policyresponse. Given the intrinsic uncertainty created by Y2K, it is ratio-nal and sensible, even optimal, for companies to take the precaution ofadding a bit to inventories ahead of time. There is no reason to pre-sume that this tendency to stockpile will be greater, or that it will beless, than what is appropriate.
Disturbances in the financial sector are also possible. The demandfor cash balances, like the demand for inventories, is affected by uncer-tainty. Risk-averse people may withdraw more than the usual amountof money from automatic teller machines on the way to their NewYear's Eve parties this year. As any macroeconomic textbook shows, anincrease in the demand for cash without an increase in its supply canhave a contractionary effect on the economy. Unlike the other factors,however, this one is easily accommodated. The Federal Reserve hasalready made arrangements to ensure that banks have the currencythey need to satisfy a surge in demand. Thus, an increased demand forcash is one part of the macroeconomic equation that need not be asource of concern.
Effects on the supply side—notably in the infrastructure sectorsmentioned above—are the source of the more alarming scenarios andare much harder to predict. It is here that the greatest risks lie. Thereis no way to evaluate, for example, whether the prospect of Y2K glitch-es in the financial sector will stoke irrational end-of-millenniumunease to the point of provoking self-confirming volatility in securitiesmarkets. Banks have reported that Y2K compliance is already animportant factor in their decisions to extend credit in certain foreigncountries, particularly in Asia and Eastern Europe, where countriesare thought to be among the least well prepared for the Y2K problem.A tightening of bank lending in these regions could accentuate thecapital scarcity arising from the recent flight to quality.
There is no way of knowing the odds that the Y2K problem will leadto a recession. Even those who issue pessimistic forecasts admit freelythat they are purely subjective judgments. This is not the sort of prob-lem that lends itself to formal modeling; macroeconomic models simplyare not built to address one-time scenarios such as a Y2K debacle.Moreover, if one knew enough about all the potential problems to
81
Digitized for FRASER http://fraser.stlouisfed.org/ Federal Reserve Bank of St. Louis

construct an accurate forecasting model, one would also know enoughto go out and fix them. But as always, the unpredictable problems arethe hardest to predict.
One can look to historical precedent—past disruptions of trans-portation or power systems due to strikes, weather events, or techno-logical failures, for example—to see if anything can be learned aboutthe macroeconomic spillover effects. Such an analysis is encouraging.Table 2-2 reports over 20 major disasters that occurred in the UnitedStates between 1971 and 1995, most of them weather-related, togeth-er with estimates of their monetary damages. The adverse impacts onbuildings and property, even leaving aside the tremendous human toll,were often large: over 1 percent of GDP each in the cases of HurricaneAndrew in 1992 and the Northridge, California, earthquake in 1994. Ineconomic terms these damages represent a loss in future consumption;resources must be diverted to replace or repair the capital stock that
TABLE 2-2. —Disaster Damage: National Income and Product AccountsEstimates of Value of Structures and Equipment Destroyed
Disaster
EarthquakeHurricane AgnesFloodTornadoes
Flood, dam collapseWindstorms floodFloodsTornadoesHurricanes David and Frederick
MudslidesRiotsMount St Helens eruptionHurricane IwaFloodsHurricane Alicia ..Hurricanes Elena and GloriaTropical Storm JuanHurricane KateFloodsHurricane HugoEarthquake
FireHurricane AndrewHurricane InikiWinter StormFloodsEarthquakeHurricane Opal
Area affected
CaliforniaMiddle AtlanticMississippiAlabama, Indiana, Kentucky, Ohio,
TennesseeIdahoKentucky, Virginia, West VirginiaAlabama, Mississippi, North DakotaArkansas, TexasAlabama, Mississippi
CaliforniaMiami (Florida)Oregon, WashingtonHawaiiArkansas, MissouriTexasAtlantic and Gulf CoastsGulf CoastAtlantic CoastAtlantic CoastNorth and South CarolinaLoma Prieta (California)
Oakland (California)Florida and LouisianaHawaii24 Eastern States9 Midwestern StatesNorthridge (California)Florida plus 9 Southern States
Impact on NIPAs
Period
1971:11972: II1973: II
1974: II1976: II1977: 111979: II1979: II1979: III
1980: 11980: II1980: II1982: IV1982: IV1983: III1985: III1985: IV1985: IV1985: IV1989: III1989: IV
1991: IV1992: III1992: III1993: I1993: III1994: I1995: IV
Valuedestroyed(billions of
1992 dollarsat annual rates)1
1.720.26.3
1.91.42.8
}3,
4.6
1.5)»';:;4.3
}4,
17.815.8
6.163.9
7.97.98.2
74.88.6
1 Reflected as additions to consumption of fixed capital.Source: Department of Commerce (Bureau of Economic Analysis).
82
Digitized for FRASER http://fraser.stlouisfed.org/ Federal Reserve Bank of St. Louis

has been lost or damaged. Yet in most cases the reduction in the capi-tal stock had only a limited impact on current sales and production, sothat the disruption did not show up in the national statistics on output,income, or employment for the year. The same is true of strikes, eventhose that affect the communications or transportation infrastructure.The 1997 strike against the Nation's leading private package deliveryservice, for example, in the end had little discernible impact on GDP, inpart because firms and individuals found other ways to ship theirpackages. Americans are, after all, very adaptable. Also, output that islost in one month is often made up the next.
To be sure, it could be dangerous to generalize from these prece-dents. A disruption that affected the entire country, or that lastedmore than a few weeks, would offer less scope for substitution. Buteven when a failure of major power cables cut power to the centralbusiness district of New Zealand's largest city for 2 months last year,the estimated effect on the year's GDP growth was small in the end.
To summarize, even if Y2K disruptions turn out to be on the seriousside, they will most likely show up primarily as inconveniences andlosses in some sectors, and not in noticeable macroeconomic terms. Asurvey of 33 professional forecasters reported an average expectationthat the Y2K problem and efforts to address it would add 0.1 percent toeconomic growth in 1999 and subtract 0.3 percent in 2000. Given typi-cal yearly fluctuations in GDP, it would be hard to identify effects ofthis magnitude after the fact. The huge efforts now under way, both inthe government and in the corporate sector, should make a truly seri-ous disruption, let alone a recession, less likely. Again, however, it isimportant to avoid complacency. We should all redouble our preventiveefforts, to keep from having to put the adaptability of the economy tothe test.
NEAR-TERM OUTLOOK AND LONG-RUN FORECAST
THE ADMINISTRATION FORECASTThe Administration projects GDP growth over the long term at
roughly 2.4 percent per year—a figure consistent with the experienceso far during this business cycle as well as with reasonable growthrates of the economy's supply-side components. One method for esti-mating the economy's potential growth is an empirical regularityknown as Okun's law, which can be illustrated by a scatter diagram(Chart 2-10). The diagram plots the four-quarter change in the unem-ployment rate against the four-quarter growth rate for real output.According to Okun's law, the unemployment rate falls when outputgrows faster than its potential rate, and rises when output growth fallsshort of that rate. The rate of GDP growth consistent with a stableunemployment rate is interpreted as the rate of potential growth and
83
Digitized for FRASER http://fraser.stlouisfed.org/ Federal Reserve Bank of St. Louis

is estimated as the location where the fitted line in Chart 2-10 crossesthe horizontal axis—in this case around 2.5 percent.
COMPONENTS OF LONG-TERM GROWTH
Labor ForceIn the long term, the growth rate of the economy is determined pri-
marily by the growth of its main supply-side components: population,labor force participation, the workweek, and labor productivity(Table 2-3). Of these, the most easily understood is the civilian working-
Chart 2-10 Estimation of Potential GDP Growth by Okun's LawReal GDP growth in excess of its potential rate lowers the unemployment rate.Potential growth is estimated to be around 2.5 percent.Change in unemployment rate (percentage points)
1.5
1991
1990
1992
1995
2.5% potential growth1993
0.0 0.5 1.0 1.5 2.0 2.5 3.0 3.5 4.0 4.5 5.0Output growth (percent)
Note: Change in unemployment rate is the fourth-quarter to fourth-quarter change in thedemographically adjusted unemployment rate. Output growth is the fourth-quarter to fourth-quarterpercent change in the geometric mean of the income- and product-side measures of GDP. Pre-1995growth rates have been adjusted for methodological changes. GDP growth in 1998 is estimated.Sources: Department of Commerce (Bureau of Economic Analysis), Department of Labor (Bureau ofLabor Statistics), and Council of Economic Advisers.
age population (the number of Americans aged 16 and over), which hasgrown at a 1.0 percent annual rate over the past 8 years. Officialprojections by the Bureau of the Census point to a growth rate of 1.0percent per year through 2008 for this segment of the population.
The labor force participation rate—the percentage of the working-age population that is working or seeking work—was little changed in1998, after notable increases in the 2 previous years. Although no read-ily apparent explanation emerges for the year-to-year pattern, theresurgence of strong GDP growth in 1996 (following a slower year), theexpansion of the earned income tax credit, and the welfare reform lawpassed in the summer of 1996 probably all contributed to the increasein participation that year and in 1997. Welfare reform required Statesto move more of their public assistance caseload into work or work-related
84
Digitized for FRASER http://fraser.stlouisfed.org/ Federal Reserve Bank of St. Louis
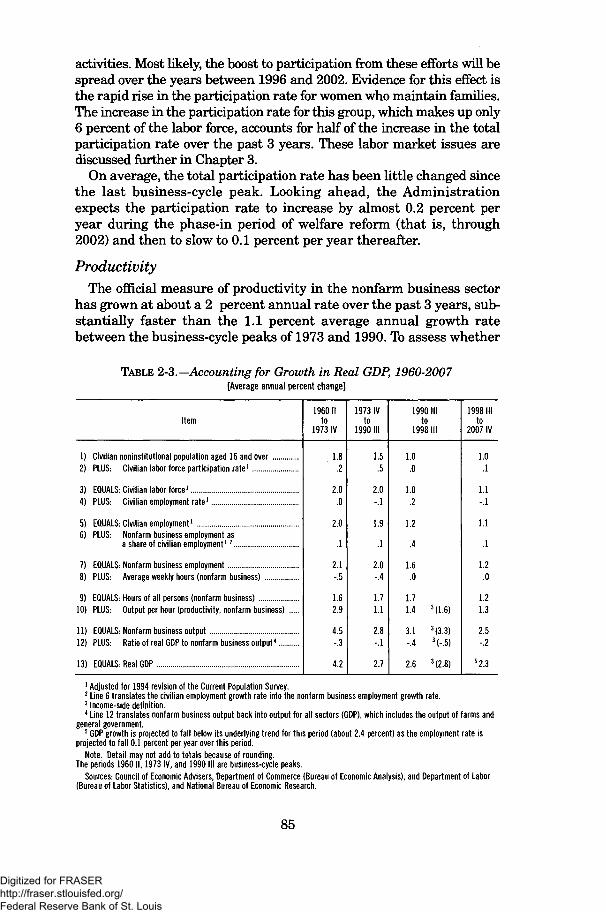
activities. Most likely, the boost to participation from these efforts will bespread over the years between 1996 and 2002. Evidence for this effect isthe rapid rise in the participation rate for women who maintain families.The increase in the participation rate for this group, which makes up only6 percent of the labor force, accounts for half of the increase in the totalparticipation rate over the past 3 years. These labor market issues arediscussed further in Chapter 3.
On average, the total participation rate has been little changed sincethe last business-cycle peak. Looking ahead, the Administrationexpects the participation rate to increase by almost 0.2 percent peryear during the phase-in period of welfare reform (that is, through2002) and then to slow to 0.1 percent per year thereafter.
ProductivityThe official measure of productivity in the nonfarm business sector
has grown at about a 2 percent annual rate over the past 3 years, sub-stantially faster than the 1.1 percent average annual growth ratebetween the business-cycle peaks of 1973 and 1990. To assess whether
TABLE 2-3.—Accounting for Growth in Real GDP, 1960-2007[Average annual percent change]
Item
1) Civilian noninstitutional population aged 16 and over2) PLUS- Civilian labor force participation rate1
3) EQUALS: Civilian labor force1
4) PLUS: Civilian employment rate1
5) EQUALS-. Civilian employment1
6) PLUS: Nonfarm business employment asa share of civilian employment1 2
7) EQUALS: Nonfarm business employment8) PLUS- Average weekly hours (nonfarm business)
9) EQUALS- Hours of all persons (nonfarm business)10) PLUS: Output per hour (productivity, nonfarm business)
11) EQUALS- Nonfarm business output12) PLUS: Ratio of real GDP to nonfarm business output4
13) EQUALS- Real GDP
1960 IIto
1973 IV
1.82
2.0.0
2.0
1
2.1-5
162.9
4 5-.3
42
1973 IVto
1990 III
1.55
2.0-.1
1.9
.1
2.0-4
171.1
2.8-.1
2.7
1990 IIIto
1998 III
1.00
102
12
4
16o
1 71.4 3(1.6)
31 3 (33)-.4 3(-.5)
2 6 3 (2 8)
1998 IIIto
2007 IV
1.01
1.1-.1
1.1
.1
1.20
121.3
2.5-.2
5 2.3
1 Adjusted for 1994 revision of the Current Population Survey.2 Line 6 translates the civilian employment growth rate into the nonfarm business employment growth rate.3 Income-side definition.4 Line 12 translates nonfarm business output back into output for all sectors (GDP), which includes the output of farms and
general government.5 GDP growth is projected to fall below its underlying trend for this period (about 2.4 percent) as the employment rate is
projected to fall 0.1 percent per year over this period.Note. Detail may not add to totals because of rounding.
The periods 1960 II, 1973 IV, and 1990 III are business-cycle peaks.Sources: Council of Economic Advisers, Department of Commerce (Bureau of Economic Analysis), and Department of Labor
(Bureau of Labor Statistics), and National Bureau of Economic Research.
85
Digitized for FRASER http://fraser.stlouisfed.org/ Federal Reserve Bank of St. Louis

the recent surge in productivity represents an increase in long-termtrend growth, several measurement issues must be addressed, as wellas the cyclical behavior of productivity. One such issue concerns thedecision to switch to geometric price indexes for some components ofconsumption. This decision, announced by the Bureau of Labor Statis-tics for the CPI starting in 1999, was first implemented by the Depart-ment of Commerce with last year's annual revisions to the nationalincome and product accounts. (The Department of Commerce used theexperimental CPI series that the Bureau of Labor Statistics beganreleasing in 1997.) The new methodology raised the measured annualgrowth rates of real nonfarm output and productivity by roughly 0.2percentage point per year for 1995 and subsequent years. The changedid not apply to earlier years, because last year's annual revision didnot reach back that far. If the same methods were applied to earlieryears, as they probably will be with the next benchmark revision, theaverage annual rate of productivity growth since 1973 might be 1.3percent rather than the 1.1 percent officially reported.
A second measurement issue concerns whether real output is bestmeasured on the product side (the official method) or on the incomeside of the national accounts, or by a mixture of the two. Since 1993,the average annual growth rates of the income-side measures of outputand productivity have been 0.5 percentage point higher than the offi-cial product-side measures. Because both sides of the accounts containuseful information, the Administration's (unofficial) estimate includesthe information from both these series by averaging them—as hasbeen done in Chart 2-11.
Other, more fundamental measurement issues exist as well. Box 2-3discusses attempts to include environmental benefits in measures ofnational income, as would be required for a truly comprehensivemeasure of economic welfare.
In the long term, productivity increases with training, technologicalinnovation, and capital accumulation. But productivity growth alsoshows considerable variation over the business cycle, typically fallingbelow its trend during recessions, then growing faster than trend dur-ing the middle of an expansion, and finally falling again in advance ofthe business-cycle peak, as it did between the peaks of 1980 and 1990.This cyclical behavior can be captured by a model in which firms onlypartially adjust toward their desired level of employment in any quar-ter, because hiring and firing are costly. As shown in Chart 2-11, a sim-ulation from this model shows that the above-trend growth of produc-tivity in recent years is consistent with strong output growth and anunderlying trend rate of 1.3 percent.
The most straightforward conclusion is that the trend growth oflabor productivity has not changed much during the post-1973 periodand that recent productivity growth reflects primarily cyclical factors.Since 1994, on the other hand, labor productivity has grown faster
86
Digitized for FRASER http://fraser.stlouisfed.org/ Federal Reserve Bank of St. Louis

Chart 2-11 Actual Versus Simulated Productivity GrowthThe recent behavior of productivity is consistent with strong output growth and a1.3 percent trend.Chained 1992 dollars per hour (ratio scale)
32
Simulated
Actual
1.3 percent trend
1981 1983 1985 1987 1989 1991 1993 1995 1997
Note: Productivity has been adjusted for methodological changes and is defined as the average of theincome- and product-side measures.Sources: Department of Commerce (Bureau of Economic Analysis), Department of Labor (Bureau ofLabor of Statistics), National Bureau of Economic Research, and Council of Economic Advisers.
than under the simulation, and it remains possible that the growthrate of trend labor productivity has risen recently. Weighing these pos-sibilities, the Administration has projected long-term annual growth oflabor productivity at 1.3 percent, but will closely monitor productivitydata over the next year for further evidence of a stronger growth rate.
Box 2-3.—Accounting for the EnvironmentEconomists have long realized that GDP is a measure of market
output, not of national welfare. By design, changes in GDP pri-marily reflect the value of goods and services as measured in themarketplace, excluding changes in leisure time, health status,environmental quality, and other aspects of well-being. Recently,concerns over sustainable development have sparked interest inexpanding the system of national income accounts to include mea-sures of environmental quality and the stock of natural resources.Some people worry that economic development may entail a dete-rioration of environmental quality and a depletion of naturalresources, causing national well-being to fall even as measuredGDP rises. Proposals for a "green GDP" attempt to address thisdesire for a more comprehensive scorecard on well-being and envi-ronmental sustainability.Incorporating environmental and natural resource assets into aunified system of national income accounts is exceedingly difficult,
87
Digitized for FRASER http://fraser.stlouisfed.org/ Federal Reserve Bank of St. Louis

Box 2-3.—continuedhowever. Important aspects of environmental quality must first bemeasured in physical units, which then must somehow be trans-lated into a common economic measure (dollars). There is littleagreement about how to value many aspects of environmentalquality, or even on methods for establishing such values. Forexample, setting a dollar value on the health and aesthetic bene-fits of lowering air pollution raises a host of difficult philosophicaland technical issues.
These problems have led most countries to abandon the quest toincorporate the environment formally into GDP. An alternativefavored by Eurostat, the statistical office of the European Union,is to report only physical measures of different aspects of environ-mental quality. This approach makes no attempt to aggregatethese various estimates into a common unit of measure, and noattempt to estimate green GDP. Rather, separate accounts trackvarious measures of environmental quality individually.
An intermediate approach, used by the United Nations Systemof Environmental and Economic Accounting and in prototypeaccounts developed by the United States, is a system of satelliteaccounts to account for certain important aspects of environmen-tal quality. These accounts, although developed to be consistentwith the system of national income accounts, are not restricted tothe same definitions and methods. This flexibility allows them tofocus on issues of particular interest and to be tailored to availableinformation. As information and methods of valuation improve,the system of satellite accounts would move closer to a unified setof economic and environmental accounts.
The satellite accounts approach allows the system of nationalincome accounts to address two fundamentally different needs.There will always be a need for a frequently updated measure ofmarket-based goods and services for both government and the pri-vate sector, which GDP fulfills. A broader measure of well-being isalso needed, even though it is likely to be less precise and avail-able less frequently, and this the satellite accounts can provide.Fortunately there is no need to choose between them.
INFLATION: FLAT OR FALLING?
The key to the longevity of this expansion has been low inflation.Direct measures of the strain on productive capacity, such as theunemployment rate and the capacity utilization rate, play a role indetermining whether the economy has reached the limits of its capacity.
Digitized for FRASER http://fraser.stlouisfed.org/ Federal Reserve Bank of St. Louis

But in the last analysis, it is the direction of inflation that signalswhether or not the capacity limit has been breached. Over the past 2years, low and stable inflation has allowed decisionmakers, both inbusiness and in government, to focus primarily on growth rather thanon bottlenecks.
In addition to its importance for policy decisions, the level and direc-tion of inflation are important variables in long-term economic andbudget projections. In this context it is important to note the gap thathas developed between inflation as measured by the CPI and the mea-sures of inflation included in the national income accounts. The broad-est measure of inflation for goods and services produced in the UnitedStates is the chain-weighted price index for GDP, which increasedonly 1.0 percent over the four quarters ending in the third quarter of1998, almost a percentage point below its year-earlier pace. In con-trast, the CPI posted a larger increase--and less of a deceleration—over the past year, despite a much larger weight for petroleum prices,which fell during the year. The difference becomes striking when onefocuses on the contrast between two price measures that appear tohave the same coverage: the price index from the national incomeaccounts for personal consumption expenditures excluding food andenergy (the core PCE), and the CPI excluding food and energy (thecore CPI). As Chart 2-12 shows, the core CPI inflation rate has beenroughly flat for the past year at about 2.4 percent, whereas that of thecore PCE has slowed to 1.1 percent for the four quarters ending inthe third quarter of 1998, from a 1.9 percent increase during theyear-earlier period. Furthermore, the difference that has opened upbetween these two series has no historical precedent. What couldcause such a divergence?
More than half of the deceleration in the core PCE over the past yearis accounted for by price imputations. National income accountantsimpute prices for components of the consumer market basket for whichthere is no nationally collected price measure. These items include lot-teries, insurance, and financial intermediation. One of these imputedprices (that for "free" checking accounts) slowed sharply over the pastyear. Because these imputations tell us little about the course of infla-tion, it is more useful to focus on an index that excludes imputations(Chart 2-12).
Excluding imputations, the index for the core PCE still shows lowerinflation than does the core CPI, and a gap between the series hasopened up over the past few years. The major sources of the differenceare in the treatment of medical care and housing. The price index formedical care in the PCE, which was formerly an aggregation of mostlyCPI components, has now shifted toward an aggregation of compo-nents from the producer price index. Over the four quarters ending inthe third quarter of 1998, medical prices in the PCE index haveincreased much less (2.2 percent) than the CPI measure of the same
89
Digitized for FRASER http://fraser.stlouisfed.org/ Federal Reserve Bank of St. Louis

Chart 2-12 Three Measures of Core InflationInflation as measured by the core CPI was flat in 1998. In contrast, the core PCEmeasure fell, although less so excluding imputations.
Percent
6
Core CPI
Core PCEchain price index
Core PCEchain price index
excluding imputationsi . . . i . . . i . . . i . . . i . . . i .
88:Q1 89:Q1 90:Q1 91:Q1 92:Q1 93:Q1 94:Q1 95:Q1 96:Q1 97:Q1 98:Q1
Note: Inflation is measured as the four-quarter percent change in the three measures.Sources: Department of Commerce (Bureau of Economic Analysis), Department of Labor (Bureau ofLabor Statistics), and Council of Economic Advisers.
concept (3.5 percent). Although the increase in housing prices is simi-lar in both indexes (because the PCE housing index uses CPI sources),housing is twice as important in the CPI as in the PCE price index.This difference in weight, together with an increase in the price ofhousing relative to the overall index, means that housing has also beena source of the difference between the CPI and PCE inflation mea-sures. At this time, with no compelling reason to prefer one index tothe other, it is best to keep an eye on both.
In addition to the price index of the core PCE, other price indexesfrom the national income accounts are increasing at or below an annu-al rate of 1 percent per year. One of these, the price index for nonfarmbusiness output (which is aggregated from consumption prices as wellas prices of other spending components) increased at only a 0.5 percentannual rate in the past four quarters. Can this low rate persist?
Whatever the rate of inflation today, in the long run the inflation ofbusiness prices will likely gravitate toward the rate of increase intrend unit labor costs—that is, the increase in hourly compensationless the rate of trend productivity growth. Until recently, one measureof trend unit labor costs (namely, the ECI measure of hourly compen-sation, described earlier in the chapter, less the trend in productivity)has closely matched the rate of price increases in the nonfarm businesssector (Chart 2-13). However, a large gap has opened up recently, withthe ECI-based measure of trend unit labor costs increasing at a rate of2.5 percent over the past four quarters (a 3.8 percent increase in
90
Digitized for FRASER http://fraser.stlouisfed.org/ Federal Reserve Bank of St. Louis
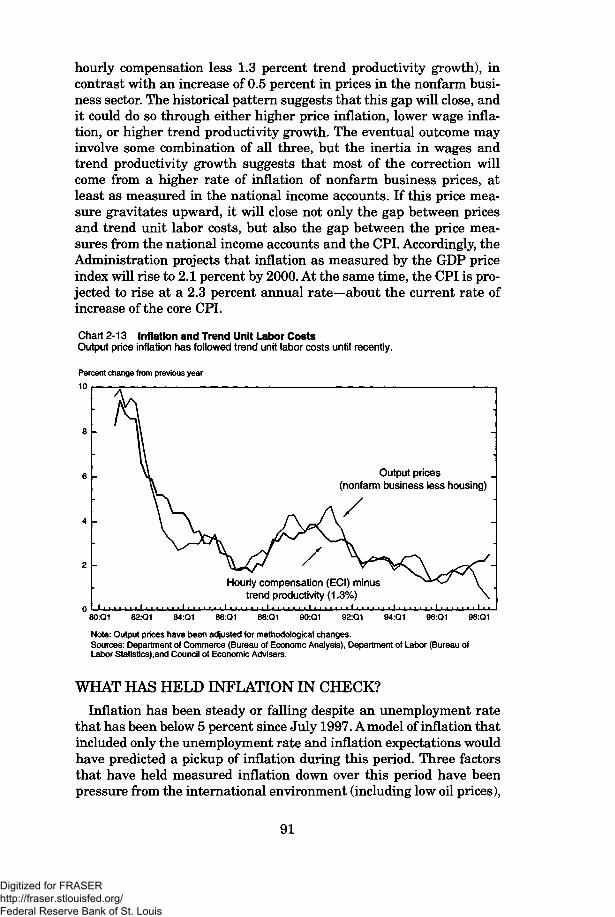
hourly compensation less 1.3 percent trend productivity growth), incontrast with an increase of 0.5 percent in prices in the nonfarm busi-ness sector. The historical pattern suggests that this gap will close, andit could do so through either higher price inflation, lower wage infla-tion, or higher trend productivity growth. The eventual outcome mayinvolve some combination of all three, but the inertia in wages andtrend productivity growth suggests that most of the correction willcome from a higher rate of inflation of nonfarm business prices, atleast as measured in the national income accounts. If this price mea-sure gravitates upward, it will close not only the gap between pricesand trend unit labor costs, but also the gap between the price mea-sures from the national income accounts and the CPI. Accordingly, theAdministration projects that inflation as measured by the GDP priceindex will rise to 2.1 percent by 2000. At the same time, the CPI is pro-jected to rise at a 2.3 percent annual rate—about the current rate ofincrease of the core CPI.
Chart 2-13 Inflation and Trend Unit Labor CostsOutput price inflation has followed trend unit labor costs until recently.
Percent change from previous year
10
Output prices(nonfarm business less housing)
Hourly compensation (ECI) minustrend productivity (1.3%)
80:Q1 82:Q1 84.-Q1 86:Q1 88:Q1 90:Q1 92:Q1 94:Q1 96:Q1 98:Q1
Note: Output prices have been adjusted for methodological changes.Sources: Department of Commerce (Bureau of Economc Analysis), Department of Labor (Bureau ofLabor Statistics),and Council of Economic Advisers.
WHAT HAS HELD INFLATION IN CHECK?Inflation has been steady or falling despite an unemployment rate
that has been below 5 percent since July 1997. A model of inflation thatincluded only the unemployment rate and inflation expectations wouldhave predicted a pickup of inflation during this period. Three factorsthat have held measured inflation down over this period have beenpressure from the international environment (including low oil prices),
91
Digitized for FRASER http://fraser.stlouisfed.org/ Federal Reserve Bank of St. Louis

a level of capacity utilization that is low relative to the unemploymentrate, and certain methodological changes in the official measure ofinflation. But even taking these factors into account, the unemploy-ment rate associated with stable inflation (the nonaccelerating-inflation rate of unemployment, or NAIRU) has probably edged lower.
Conditions in the international environment have restrained infla-tion. The foreign exchange value of the dollar has risen substantiallyover most of the past 3 years, both oil and nonoil import prices havebeen falling, and exporters of U.S. goods face stiff competition. On theimport side, prices of nonpetroleum goods have fallen at about a 4 per-cent annual rate, on average, during the past 3 years (Chart 2-14).
Chart 2-14 Export and Import Prices Versus the CPI and GDP Price IndexExport and import price declines have held down inflation.
Four-quarter percent change
10
Chain price index ofexported goods ' Chain price index of imported
nonpetroleum goods
87:Q1 88:Q1 89:Q1 90:Q1 91:Q1 92:Q1 93:Q1 94:Q1 95:Q1 96:Q1 97:Q1 98:Q1
Sources: Department of Commerce (Bureau of Economic Analysis) and Department of Labor (Bureauof Labor Statistics).
With the share of nonpetroleum imports at about 15 percent of con-sumption, these imports account for about 0.6 percentage point of thereduction in consumer price inflation. Meanwhile exporters of U.S.goods have cut prices by about 3V2 percent per year over the past 3years, presumably to match stiff competition abroad. With goodsexports at about 8 percent of GDP, export prices have subtracted about0.3 percentage point from the inflation rate as measured by the GDPprice index. In recent months the dollar has retraced some of its appre-ciation of the 1995-98 period, and so the damping effect on inflationmay not be as forceful over the medium term.
Capacity in manufacturing, mining, and utilities has grown at a 51Apercent annual rate over the past 3 years, outpacing growth in
92
Digitized for FRASER http://fraser.stlouisfed.org/ Federal Reserve Bank of St. Louis
production at 434 percent. Consequently, the capacity utilization ratehas dropped to a level that is now I index point below its long-termaverage of 82.1 percent of capacity. This slack in capacity is the legacyof a sustained high level of industrial investment and stands in sharpcontrast to the tightness in labor markets. Over most of the postwarera, slack in capacity has moved with the unemployment rate, and sothese two measures usually tell much the same story. However, in cur-rent circumstances the excess industrial capacity offsets some of thetightness in labor markets.
A final reason for the slowing of reported price indexes has beenmethodological changes to both the CPI and the indexes used in thenational income accounts (Box 2-4). In general, these changes havereduced the measured rate of inflation. For the CPI, methodologicalchanges made from 1995 through 1998 reduced the rate of CPI infla-tion by about 0.44 percentage point. Changes to be introduced in 1999and 2000 will reduce it by an additional 0.24 percentage point.
Box: 2-4.—Methodological Changes to Price MeasurementThe Bureau of Labor Statistics (BLS) and the Bureau of Eco-
nomic Analysis (BEA) have recently made several methodologicalchanges that have improved the accuracy of the consumer priceindex and the price indexes in the national income accounts. Oneof these changes goes into effect this year (Table 2-4). Most of theimprovements made by the BLS have reduced the measuredincrease in the CPI, and many will also affect the deflation ofnominal output and therefore raise the growth rate of measuredreal GDP. Changes made through 1998 include the substitution ofgeneric drugs when patents expire on proprietary brands; the cor-rection of a problem in rotating new stores into the surveythrough a procedure called "seasoning" (a problem that was cor-rected first in the food category and later in other categories ofgoods); a modification of the formula for measuring increases inrent; a change to measuring prices on hospital bills rather thanthe prices of hospital inputs; a switch to measuring computerprices by the computers' intrinsic characteristics ("hedonies"); andan update of the market basket from one based on the 1982-84period to one based on 1993-95. A change scheduled for this year isthe use of geometric rather than arithmetic means to address sub-stitution bias within categories; next year the BLS will bring inthe results of more frequent rotation of the items sampled in cate-gories with many new product introductions.
The combined effect of the changes made through 1998 has beento lower the CPI inflation rate by 0.44 percentage point per year.
93
Digitized for FRASER http://fraser.stlouisfed.org/ Federal Reserve Bank of St. Louis
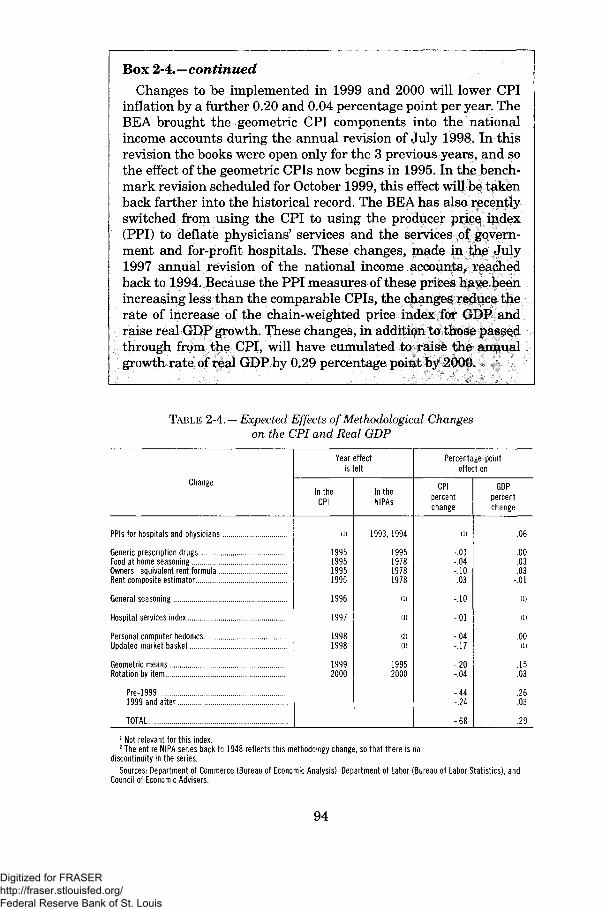
Box 2-4.—continuedChanges to be implemented in 1999 and 2000 will lower CPI
inflation by a further 0.20 and 0.04 percentage point per year. TheBE A brought the geometric CPI components into the nationalincome accounts during the annual revision of July 1998. In thisrevision the books were open only for the 3 previous years, and sothe effect of the geometric CPIs now begins in 1995. In the bench*mark revision scheduled for October 1999, this effect will be takenback farther into the historical record. The BEAhas also recentlyswitched from using the CPI to using the producer price index(PPI) to deflate physicians' services and the services of govern-ment and for-profit hospitals. These changes, made in the July1997 annual revision of the national income accounts, reachedback to 1994. Because the PPI measures of these prices have beenincreasing less than the comparable CPIs, the changes reduce therate of increase of the chain-weighted price index for GDP andraise real GDP growth. These changes, in addition to those passedthrough from the CPI, will have cumulated to raise the annualgrowth rate of real GDP by 0.29 percentage point by 2000.
TABLE 2-4. — Expected Effects of Methodological Changeson the CPI and Real GDP
Change
PPIs for hospitals and physicians
Generic prescription drugsFood at home seasoningOwners equivalent rent formulaRent composite estimator
General seasoning
Hospital services index
Personal computer hedonicsUpdated market basket . .. .
Geometric meansRotation by item
Pre-19991999 and after
TOTAL
Year effectis felt
In theCPI
(i)
1995199519951995
1996
1997
19981998
19992000
In theNIPAs
1993, 1994
1995197819781978
(i)
(i)
(2)
(1)
19952000
Percentage-pointeffect on
CPIpercentchange
(i)
-.01-.04-.10.03
-.10
-.01
-.04-.17
-.20-.04
-.44-.24
-.68
GDPpercentchange
.06
.00
.03
.03-.01
(i)
(i)
.00(1)
.15
.03
.26
.03
.29
1 Not relevant for this index.2 The entire NIPA series back to 1948 reflects this methodology change, so that there is no
discontinuity in the series.Sources: Department of Commerce (Bureau of Economic Analysis), Department of Labor (Bureau of Labor Statistics), and
Council of Economic Advisers.
94
Digitized for FRASER http://fraser.stlouisfed.org/ Federal Reserve Bank of St. Louis

A proper accounting for these changes can explain in part the recentlow inflation in terms of the CPI (although not that in terms of theGDP price index). The rest can be explained by some combination oflow nonoil import prices, low oil prices, and a downtick in the NAIRU.But it is as yet impossible to know exactly which combination of thesefactors is the right one.
THE NEAR-TERM OUTLOOKBoth supply- and demand-side considerations argue for some mod-
eration in real GDP growth from its rapid 3.7 percent annual pace ofthe past 3 years. On the supply side, the unemployment rate has fall-en by about 0.4 percentage point per year over the past 3 years, and itis questionable whether a further decline of this magnitude could beaccommodated without inflationary consequences. Labor force growthhas not kept up with demand for labor in the past 2 years, nor can it beexpected to keep up with a repetition of that kind of demand growth.
On the demand side, private consumption and fixed investment areexpected to grow less rapidly in 1999 than they did in 1998. Consump-tion, which constitutes two-thirds of demand, rose at more than a 5percent annual rate during the first three quarters of 1998. Growth ofconsumer spending, which was well in excess of the growth rate of dis-posable personal income, reflected the remarkable growth of stockmarket values. As a consequence, the saving rate fell almost 2 per-centage points over the year, finally dropping to near zero by year'send. Unless the stock market continues to surge, consumption is like-ly to grow at a more moderate pace. Continued real income growth islikely to motivate further, but smaller, consumption gains.
Business equipment investment grew at an extraordinary 26 per-cent annual rate in the first half of the year, the fifth consecutive yearof double-digit growth. Business purchases of computers accounted formuch of this growth; the rapid pace of innovation in the computerindustry is driving new investment, and prices have been fallingsharply. But equipment investment decelerated sharply in the thirdquarter of 1998. Investment in business structures has been about flatover the past year and a half. Low capacity utilization may be one fac-tor limiting investment growth. However, as long as the relative priceof equipment is falling, it is likely that business investment will con-tinue to grow faster than the economy as a whole.
Strong real income growth, together with the drop in mortgageinterest rates over the past year, is also buoying residential invest-ment. The 1.62-million-unit pace of housing starts in 1998 was thehighest in a decade. Even if mortgage rates remain around their cur-rent low levels, housing activity and residential investment are likelyto edge down because of demographic factors and the lack of pent-updemand after several years of strong growth.
95
Digitized for FRASER http://fraser.stlouisfed.org/ Federal Reserve Bank of St. Louis

Nonfarm manufacturing and trade inventories also grew rapidly in1998, but no faster than sales. The (nominal) inventory-to-sales ratiowas thus little changed over the year and remains at one of its lowestlevels ever (Chart 2-15). Nevertheless, if the components of finaldemand were to decelerate to a more modest rate in 1999, the level of
Chart 2-15 Inventory-to-Sales Ratio (Nonfarm Business)Despite recent strong stockbuilding, inventories remain lean with respect to sales.
Months' supply
3.2
3.0
2.8
2.6
2.4
2.2
53:Q1 57:Q1 61:Q1 65:Q1 69:Q1 73:Q1 77:Q1 81:Q1 85:Q1 89:Q1 93:Q1 97:Q1
Note: Based on data in current prices.Sources: Department of Commerce (Bureau of Economic Analysis) and National Bureau of EconomicResearch.
inventory investment would have to drop in order for this lean inventoryposture to be maintained.
Some restraint is likely to come from the international economy, asthe rise in the dollar over the past 3 years and the continued restruc-turing of several Asian economies have already weakened—and willcontinue to weaken—demand for American-made products. Becausethe direction of trade responds with a lag to changes in the exchangerate, the appreciation of the dollar over the past 2 years is likely toboost demand for imports and limit growth of exports in 1999. As aresult, net exports are likely to become more negative in 1999,although they probably will not decline as much as in 1998.
Up to now, the Asian economic crisis has not had the negative effecton the U.S. economy that was anticipated a year ago. The conse-quences of a larger-than-expected drop in import prices have offsetmuch of the direct loss of exports. On the one hand, American exportsto the Asian economies most affected by the crisis have fallen about$30 billion (in nominal dollars) since the second quarter of 1997.On the other hand, the weakness abroad has been a major factor in
96
Digitized for FRASER http://fraser.stlouisfed.org/ Federal Reserve Bank of St. Louis

lowering the price of imported crude oil, which has fallen almost $8 perbarrel from precrisis levels. Because the United States purchasesabout 3l/2 billion barrels of foreign petroleum and petroleum productsper year, the resulting $27 billion saving on the national oil import billoffsets almost all of the loss in exports to Asia. In addition, the drop innonpetroleum import prices and the price discipline imposed onexporters who compete in international markets have held down infla-tion by about half a percentage point, as discussed earlier. Low infla-tion has in turn allowed interest rates to be lower, and domesticdemand higher, than they would otherwise be.
A moderation in output growth to 2.0 percent is projected for the next 3years—about half a percentage point below the economy's long-termgrowth rate, but roughly in line with the consensus of professionaleconomic forecasters (Table 2-5). Over these 3 years the unemployment
TABLE 2-5. — Administration Forecast
Item
Nominal GDP
Real GDP (chain-type)
GDP price index (chain-type)
Consumer price index (CPI-U)
Unemployment rate (percent)
Interest rate, 3-month Treasury bills (percent) ...
Interest rate, 10-year Treasury notes (percent)
Nonfarm payroll employment (millions)
Actual
1997 19981999 2000 2001 2002 2003 2004 2005
Percent change, fourth quarter to fourth quarter
5.6
3.8
1.7
1.9
'4.5
'3.5
'.9
1.5
4.0
2.0
1.9
2.3
4.2
2.0
2.1
2.3
4.1
2.0
2.1
2.3
4.5
2.4
2.1
2.3
4.5
2.4
2.1
2.3
4.5
2.4
2.1
2.3
4.6
2.4
2.1
2.3
Calendar year average
4.9
5.1
6.4
122.7
4.5
4.8
5.3
2125.8
4.8
4.2
4.9
127.7
5.0
4.3
5.0
129.2
5.3
4.3
5.2
130.5
5.3
4.4
5.3
132.1
5.3
4.4
5.4
134.0
5.3
4.4
5.4
136.0
5.3
4.4
5.4
137.9
1 Forecast.2 Preliminary.Sources: Council of Economic Advisers, Department of Commerce (Bureau of Economic Analysis), Department of Labor
(Bureau of Labor Statistics), Department of the Treasury, and Office of Management and Budget.
rate is projected to edge up slowly to 5.3 percent—the middle ofthe range of unemployment compatible with stable inflation. There-after, the Administration's forecast is built around a growth rate ofpotential output of 2.4 percent per year. The Administration does notbelieve that 2.4 percent annual growth is the best the economy can do;rather, this projection reflects a conservative estimate of the effects ofAdministration policies to promote education and investment and tobalance the budget. The outcome could be even better—as indeed it
97
Digitized for FRASER http://fraser.stlouisfed.org/ Federal Reserve Bank of St. Louis
has been for the past 3 years. But the Administration's forecast is usedfor a very important purpose: to project Federal revenues and outlaysso that the government can live within its means. For this purpose,excessive optimism is dangerous and can stand in the way of makingdifficult but necessary budget decisions. On the other hand, excessivepessimism can force difficult decisions where none was required. In thefinal analysis, the only worthy objective is the creation of a soundforecast that points to the eventual outcome using all availableinformation as fully as possible.
As of December 1998, the current economic expansion, having lasted93 months, was the longest ever during peacetime and the secondlongest on record. There is no apparent reason why this expansion can-not continue. As the 1996 Economic Report of the President argued,expansions do not die of old age. Instead, postwar expansions haveended because of rising inflation, financial imbalances, or inventoryoverhangs. None of these conditions exist at present. The most likelyprognosis is therefore the same as last year's: sustained job creationand continued noninflationary growth.
98
Digitized for FRASER http://fraser.stlouisfed.org/ Federal Reserve Bank of St. Louis