macroeconomic shock synchronization in the east african community
TRANSCRIPT

Macroeconomic Shock Synchronization in the East African Community
Albert Mafusire and Zuzana Brixiova
No
156 - October 2012

Correct citation: Mafusire, Albert and Brixiova, Zuzana (2012), Macroeconomic Shock Synchronization In The
East African Community, Working Paper Series N° 156 African Development Bank, Tunis, Tunisia.
Steve Kayizzi-Mugerwa (Chair) Anyanwu, John C. Faye, Issa Ngaruko, Floribert Shimeles, Abebe Salami, Adeleke Verdier-Chouchane, Audrey
Coordinator
Working Papers are available online at
http:/www.afdb.org/
Copyright © 2012
African Development Bank
Angle de l’avenue du Ghana et des rues
Pierre de Coubertin et Hédi Nouira
BP 323 -1002 TUNIS Belvédère (Tunisia)
Tel: +216 71 333 511
Fax: +216 71 351 933
E-mail: [email protected]
Salami, Adeleke
Editorial Committee Rights and Permissions
All rights reserved.
The text and data in this publication may be
reproduced as long as the source is cited.
Reproduction for commercial purposes is
forbidden.
The Working Paper Series (WPS) is produced
by the Development Research Department
of the African Development Bank. The WPS
disseminates the findings of work in progress,
preliminary research results, and development
experience and lessons, to encourage the
exchange of ideas and innovative thinking
among researchers, development
practitioners, policy makers, and donors. The
findings, interpretations, and conclusions
expressed in the Bank’s WPS are entirely
those of the author(s) and do not necessarily
represent the view of the African Development
Bank, its Board of Directors, or the countries
they represent.

Macroeconomic Shock Synchronization in the East African Community
Albert Mafusire and Zuzana Brixiova 1
1 Albert Mafusire and Zuzana Brixiova are respectively Senior Country Economist, Southern Africa Resource Center
(SARC) and Economic Advisor, United Nations Development Program in Swaziland. This paper started when the authors
were with the Development Research Department of the African Development Bank. The authors thank Jan Babecky,
Ferdinand Bakoup, Amarakoon Bandara, Tonia Kandiero, Thierry Kangoye, Andreas Wӧrgӧtter, and an anonymous referee
for helpful comments. An earlier version was presented at the workshop organized by the Halle Institute for Economic
Research. Views expressed are those of the authors and do not necessarily reflect those of the AfDB or the UNDP. E-mail
addresses: [email protected] and [email protected] .
AFRICAN DEVELOPMENT BANK GROUP
Working Paper No. 156 October 2012
Office of the Chief Economist

Abstract
The East African Community (EAC)
economic integration has gained momentum
recently, with the EAC countries aiming to
adopt a single currency in 2015. This paper
evaluates empirically the readiness of the
EAC countries for monetary union. First,
structural similarity of the EAC countries is
measured in terms of similarity of
production and exports. Second, the
symmetry of shocks among the EAC
members is examined with structural VAR.
Both methods point to a low shock
synchronization in the EAC, suggesting that
the move to EAMU would need a thorough
evaluation and preparation. The paper
concludes with policies that would facilitate
the EAC regional economic integration,
including the possible eventual
establishment of a monetary union.
Keywords: shock synchronization; structural VAR; regional integration; East Africa.
JEL classification: E32; F42; C53

5
I. Introduction
Interest in regional integration in Africa has accelerated recently, reflecting a renewed political
will and increased resource flows for regional projects under the Extended Integrated Framework
and Aid-for-Trade initiatives. Integration measures in the East African Economic Community
(EAC) regained momentum in 2005, after some stagnation.2 Over the years, the members have
established closer economic links through a Free Trade Area (2001), a Customs Union (2005),
and a Common Market (2010). These efforts have paid off: a deeper regional integration and
trade within the EAC than in other African sub-regions have contributed to East Africa’s
resilience during the global financial crisis (GFC) in 2009 and 2010 and to overall fast growth
(Brixiova and Ndikumana, 2011; Guerguil et al., 2011, and Winston and Castellanos, 2011).
Given the progress with intra-regional trade, the objective of the EAC countries is the
establishment of the East African Monetary Union (EAMU), with the circulation of the single
currency in the summer of 2015. The March 2010 Joint Meeting of the EAC Ministers adopted
the road map for this goal, which includes milestones such the adoption of an Exchange Rate
Mechanism (ERM), creation of the regional central bank, and finally the establishment of the
EAMU. However, macroeconomic convergence in the EAC has been limited. Questions have
thus emerged about the countries’ readiness to join the EAMU within the agreed time frame,
especially in light of slow implementation of common market elements such as free mobility of
labor, capital and goods.3
This paper investigates whether the targeted speedy creation of the EAMU and the associated
loss of the ability to conduct counter-cyclical monetary policy could be too costly for the EAC
countries. Using the Optimal Currency Area (OCA) approach, it tests empirically the extent of
the shock synchronization among the EAC members.4 If the countries in the union have major
structural difference, common monetary police will have differential impacts that may not be
helpful to some members. These differences may reduce the benefits of the union by increasing
the volatility of business cycles.
The paper is organized as follows: After this Introduction, Section II highlights the progress with
regional integration in the EAC. In Section III the shock synchronization of the EAC is analyzed
using the indexes of structural similarity and the structural VAR model. Section IV draws policy
conclusions and recommendations for advancing regional integration in East Africa.
2 The EAC comprises of Kenya, Tanzania, Uganda, Rwanda and Burundi, with a combined population of 126.6
million people and a nominal GDP of USD73 billion in 2010. 3 Bøds (2001) concluded that most of Africa’s regional integration efforts lacked political will to be implemented,
and the countries continued to focus on relative national gains and sovereignty. While this general conclusion could
have been true at turn of the century, the renewed interest for deeper integration in East Africa this time around
seems to represent serious efforts for change. 4 The OCA analysis claims that membership of a currency union provides countries micro economic efficiency gains
at the cost of their relinquishing independent monetary and exchange rate policy. This approach is highly relevant
for economies with flexible exchange rates, such as the EAC countries.

6
II. Regional Convergence in the EAC: The Facts
II.1 Convergence Criteria
The OCA theory suggests the macroeconomic convergence as a precondition for forming a
monetary union (Mundell, 1961 and others). This applies also to the EAMU. The EAC
convergence process, measured mostly through macroeconomic criteria, has three stages: looser
macro stance during 2007-10; tighter one during 2011-2014, and the monetary union from 2015
on (Table 1).
Table 1: Macroeconomic Convergence Criteria in the EAC
<Stage
Indicator Stage 1: 2007 - 2010
Stage 2: 2011 -
2014 Stage 3: 2015
Pri
mary
Cri
teri
a Budget Deficit to
GDP ratio
Intr
oduct
ion o
f si
ngle
curr
ency
Excluding grants < 6% < 5%
Including grants < 3% < 2%
Inflation < 5% < 5%
External reserves > 4 months import cover > 6 months imports
Sec
on
da
ry C
rite
ria
Real exchange rate Stable
Interest rates Market based Market based
Real GDP growth > 7% > 7%
Debt
Reduced to sustainable
levels Sustainable levels
Savings to GDP
ratio > 20% > 20%
Current account
(excluding grants)
Consistent with debt
sustainability
Consistent with
debt sustainability
Banking
supervision and
regulations
Implementation of the 25
Core Principles
Payment and
settlement systems
Adhere to Core Principals
for Systematically
Important Systems
Source: Adapted from Opolot and Luvanda, 2009.

7
Macroeconomic convergence is crucial, but research on monetary integration suggests that
structural similarities among monetary union members are key for the unified impact of their
joint monetary policies. This is because the adoption of a single currency eliminates some of the
macro policies (monetary and exchange rate policy) that countries can use to adjust to economic
shocks.5 Instead, all countries in the monetary union are subject to the same monetary policy,
which would be more effective under synchronized shocks. Even when shocks are not
synchronized though, the monetary union can be economically advantageous if countries have
mobile labor markets (Mundell, 1961), a high degree of economic openness (McKinnon, 1963),
enabling business environment and diversification in production and consumption (Kenen,
1969).
Another stream of literature, pioneered, by Frankel and Rose (1998), argues that is that the OCA
is self-fulfilling ex post. It underscores that by reducing transactions costs and eliminating the
exchange rate risk, a common currency promotes intra-regional trade and synchronizes business
cycles, as countries’ economic institutions become similar. More recent work on the OCA
(Corsetti, 2009) posits that factors supporting monetary integration are financial sector
integration and counter-cyclical fiscal policy, which are both high among priorities of the EAC
policymakers.
II.2 Macroeconomic Performance
The EAC grew faster than the rest of the continent both before and during the GFC, the lack of
natural resources notwithstanding (Table 2).6 In spite of the negative impact of the GFC, East
Africa posted 5.8% real GDP growth in 2009 and has already recovered some of the lost growth
momentum in 2010 and 2012. Rwanda, Tanzania and Uganda have led the regional economic
expansion, alongside Ethiopia and Sudan. Kenya, which grew rapidly in 2006 and 2007, suffered
a setback in 2008 due to the violence that broke out after the elections at the end of 2007. Among
the EAC’s members, only Burundi’s growth has been low throughout the 2000s, reflecting in
part the country’s fragility.
Table 2. Real GDP growth in East Africa (EAC) and other Africa’s sub-regions 1/
2002-06 2007 2008 2009 2010 2011
(annual, in percent)
EAC 6.6 7.1 7.4 4.1 5.1 5.6
RoEA 2/ 2.9 7.3 3.2 4.1 4.7 4.3
West Africa 4.7 4.7 5.4 3.4 4.5 5.1
Northern Africa 4.9 4.5 4.1 2.7 4.6 3.4
Southern Africa 4.5 5.5 4.7 2.2 4.2 5.6
Central Africa 4.6 4.0 2.9 2.0 5.5 4.3
Source: Authors’ calculations based on the African Economic Outlook (AEO) 2012. 1/ Median values. 2/ Rest of
East Africa other than the EAC countries.
5 On the positive side, countries eliminate the economic costs related to the exchange rate fluctuations.
6 The discovery of oil and subsequent development of the resources has been changing Uganda’s position. Tanzania
also benefitted from rising gold prices although the sector is not the main driver of growth.

8
Overall macroeconomic performance was mixed. While inflation was in single digits in 2007, it
jumped to double digits due to increased food prices in 2008. Despite the global financial crisis’
dampening of the inflationary pressures in 2009, the inflation accelerated in 2010 and 2011 due
to droughts and rising food prices. On the positive side, external debt is sustainable and debt
payments are low, in part due to debt relief initiatives from mid-2000s. While the fiscal deficits
remained under control despite the stimulus packages adopted in 2009 and 2010, the relatively
sizeable trade and current account deficits continue to pose a challenge for macroeconomic
convergence of the EAC.
Meeting these convergence criteria has so far been elusive. An inspection of the performance of
the EAC member countries’ performance since 2000, relative to the convergence criteria, reveals
significant variations (Figure 1). Notwithstanding the high regional growth, only Tanzania and
Uganda have managed average GDP growth of more than 7% over the last four years to 2010.
There are down-side risks to growth in these two countries, especially when the growth has
largely been driven by resource-based exports or investments as in the case of Uganda.
Important threats for macroeconomic stability in the region persist. Inflation and exchange rates
in particular are still volatile. In August 2011 the annual inflation was in double digits – way
above the 5 percent target -- in Kenya, Uganda, and Tanzania, due to rising food prices. In 2009
and 2010 the budget deficits (after grants) of Kenya and Tanzania exceeded the 3 percent target
when counter-cyclical fiscal policies were adopted against the impacts of the global financial
crisis (Kasekende, et al., 2010). Ensuring adherence to macroeconomic targets in the absence of
any agreed rules therefore poses serious challenges to the proposed EAMU.
Figure 1. EAC Macroeconomic Performance Relative to Convergence Criteria
Source: AfDB Statistical database.
Even though all EAC countries fall into the low income category, substantial differences exist in
their levels of development. The different levels of development of the EAC countries and
divergence of their economic outcomes have been one of the arguments against speedy creation
2.6 3.0
5.8
9.68.8
12.7
8.49.5 9.6 9.7
-1.0
-4.3
-1.4
-3.5
-0.7
-13.2
-5.9 -5.8
-9.8
-4.3
-15
-10
-5
0
5
10
15
Burundi Kenya Rwanda Tanzania Uganda
GDP Growth Inflation Fiscal Balance Current Account
Inflation Target GDP Target Fiscal Target

9
of the EAMU.7 On the one side of the spectrum is Kenya, which is the most developed and the
largest EAC member. It is the regional trade hub, while its private enterprises lead the intra-
regional investment. Kenyan banks also operate across the region, with subsidiaries in Rwanda,
Tanzania and Uganda (AfDB, 2011).8
Nevertheless, the region’s financial sector is not yet sufficiently integrated. Although foreign
banks dominate in the EAC, their focus is largely on domestic markets. Despite the creation of a
regional Securities Regulatory Authority and partial capital account liberalization and the
encouragement of cross-listing; capital market cooperation and integration has been limited. For
instance, the November 2006 agreement between the Uganda Stock Exchange and the Kenya
Stock Exchange allowed cross-listing of blue-chip companies yet cost considerations prevented
most of the firms from doing so (World Bank, 2007). Following an example of Nigerian banks
that have entered the region, Kenyan banks have recently established operations in Rwanda,
Tanzania and Uganda. This development needs to be supported by an appropriate regulatory
framework, including through home country supervision and regulation.
More broadly, one of the arguments against speedy creation of the EAMU has been the different
levels of development of the EAC countries and their varied economic outcomes. For example,
the Burundi’s average import growth exceeded that of exports by a factor of 3 since 2003,
resulting in the current account deficit of 19.1 percent of GDP in 2008 – far above the other EAC
members. While inflation was in single digits until 2007, it jumped to almost 25 percent in 2008
due to the food crisis. The question arises if such divergent performance would reduce the
country’s benefits from the EAMU. Conversely, and as the experience of the euro area suggests,
unless Burundi strengthens its macroeconomic situation, its membership may destabilize the
EAMU.
II.3 Trade Flows, Structure and Barriers
According to the OCA criteria, rising intra-regional trade is consistent with the objective of
monetary integration, as a common currency would lead to substantial cuts in transaction costs
(McKinnon, 1963). In that aspect, the EAC countries fare well, as trade among the EAC
members has intensified prior to the GFC.
Specifically, the share of imports from Europe and other advanced economies has been falling
while the share of trade within the EAC is rising. About 20 percent of East African exports were
within the EAC during 2000-07 (Table 3). The average growth in intra-EAC exports exceeded
that of extra-EAC in Rwanda, Tanzania and Uganda (Figure 2). Still, average import growth
within the EAC has been lower than import growth from outside the region in Burundi, Kenya
and Rwanda, reflecting the dominance of basic consumer products in intra-regional trade, with
manufactures coming mostly from the outside. Kenyan exports to the region accounted for
almost 65 percent of the total intra-regional exports.
7 The euro introduction took much longer for countries of markedly greater structural similarity than exhibited by
the EAC countries. 8 Nevertheless barriers to the greater financial integration – one of the preconditions for successful monetary
integration – remain high and include capital flows restrictions (Wang, 2010).

10
Figure 2. Intra-EAC and Extra-EAC (ROW) Trade Growth, 2005 - 08 (4-year averages)
Source: Authors’ Calculations based on the IMF Direction of Trade Statistics Online Database.
Another key characteristic of East Africa that bodes well for formal economic integration is the
large share of informal trade in the region. For example, the share of the informal trade in total
trade in Uganda has increased markedly during 2000s. In fact, in 2009 the informal exports to the
EAC countries and other neighbors (Sudan, DRC) exceeded its total formal exports. The large
informal trade volume suggests that formal trade can expand further. To facilitate this process,
barriers to trade should be eliminated to reduce the informality and the related transactions cost.
Increasing the stock and quality of regional infrastructure is also needed to harness this
intraregional trade potential.
Despite the relatively large volume of trade among the EAC countries, significant challenges to
monetary integration remain, including the transaction costs for across-the border trade. Over the
medium term regional integration strategies need to develop complementarity in higher value
added products than basic agricultural commodities to raise the capacity of East African
countries’ to trade.9 Incentives to formalize will be important as informal firms find it more
difficult to innovate and adopt new technology. Modernizing immigration policies to facilitate
the flow of labor and address persistent skill shortages will be key to fostering intraregional
trade, which is likely to bring about greater structural similarities. Moreover, reducing volatility
of exchange rates would help increase trade and finance flows (Newfarmer and Söderbom,
2012).
9 Additional impediments to monetary integration in Kenya, Tanzania and Uganda are substantial financial barriers
such as restrictions on capital flows.

11
Table 3. Share of intra-regional and intra-Africa trade by RECs (million US$)
Source: ECA, AfDB and AUC (2010). Assessing Regional Integration in Africa IV: Enhancing Intra-African Trade,
Addis Ababa: ECA.
To achieve greater intra-regional trade and structural similarity -- and hence shock
synchronization -- barriers to trade within EAC need to be eliminated while common policies
towards the outside of the EAC should be adopted. The region’s trade agenda has thus a wider
scope than reducing intra-regional tariff barriers. Its current primary focus is on removing
2000 2003 2005 2007 2000-07
EAC total exports 3,053 4,133 5,984 7,788 4,951
intra EAC exports 689 879 1,075 1,385 957
% of total exp. 22.6 21.3 18 17.8 20
exports to rest of 286 457 664 1,037 572
% of total exp. 9.4 11.1 11.1 13.3 11.1
total exports to Africa 32 32.3 29.1 31.1 31.1
AMU total exports 49,048 54,933 99,669 139,040 77,883
intra UMA exports 1,094 1,338 1,886 3,076 1,698
% of total exp. 2.2 2.4 1.9 2.2 2.3
exports to rest of 80 14 216 1,770.00 460
% of total exp. 0.2 0 0.2 1.3 0.4
total exports to Africa 2.4 2.5 2.1 3.5 2.7
SADC total exports 47,772 55,998 89,058 133,525 74,735
intra SADC exports 4,296 5,484 7,454 11,678 6,512
% of total exp. 9 9.8 8.4 8.7 8.8
exports to rest of 1,230 1,879 2,731 3,740 2,193
% of total exp. 2.6 3.4 3.1 2.8 3
total exports to Africa 11.6 13.1 11.4 11.5 11.8
WAEMU total exports 6,662 9,850 12,661 15,039 11,166
intra WAEMU 741 1,076 1,390 1,917 2,063
% of total exp. 11.1 10.9 11 12.7 11
exports to rest of 947 1,194 1,879 2,731 1,658
percent of total 14.2 12.1 14.8 18.2 14.8
total exports to Africa 25.3 23 25.8 30.9 25.9
CEMAC total exports 8,361 11,552 22,944 29,898 16,683
intra CEMAC 96 146 198 304 177
% of total exp. 1.1 1.3 0.9 1 1.1
exports to rest of 220 282 483 580 382.3
percent of total 2.6 2.4 2.1 1.9 2.5
total exports to Africa 3.8 3.7 3 3 3.6

12
structural – mostly non-trade -- barriers to competitiveness and trade.10
Besides its traditional
objectives (removing quotas and tariffs), trade policy of the EAC thus now strives to strengthen
the members ‘soft’ and ‘hard’ infrastructure so as to enable them to leverage their relative
comparative advantages. The focus on relative comparative advantages would also help diversify
the EAC product mix and could enhance the scope for intra-regional trade along the value
chains.11
Figure 3. The Real GDP growth and inflation in the EAC, 1980 - 2011
3a. The EAC: Inflation (%) 3b. The EAC: Real GDP Growth (%)
-50
0
50
100
150
200
250
1980 1985 1990 1995 2000 2005 2010
Burundi
Kenya
Rwanda
Tanzania
Uganda
-50
-40
-30
-20
-10
0
10
20
30
1980 1985 1990 1995 2000 2005 2010
Burundi
Kenya
Rwanda
Tanzania
Uganda
Source: AEO 2012 and IMF WEO database (as of April 2012).
Sections below test the degree of shock synchronization among the EAC countries formally,
adopting simple correlation and structural vector auto-regression analysis (SVAR) methods on
the real GDP growth and inflation data during 1981 - 2009. Moreover, given the increased
formal intra-regional trade and high informal trade within the EAC countries, the empirical
analysis will also examine the endogeneity of the OCA hypothesis. This will be carried out by
subdividing the period into two sub-periods: before and after 1990.
III.1 Correlation of Economic Activity is low
First, we examine the degree of synchronization of economic shocks between the EAC countries
using correlations for output growth and inflation for all pairs of countries. Pair-wise correlations
of the real GDP growth and inflation during 1981 – 2009 are mostly positive, albeit low, and
increased during 1990 - 2009 (Figure 4). This result informs the split in the data in estimations
below, which also accounts for periods of high inflation in the series for Tanzania and Uganda.
10
For linkages between competitiveness, trade and FDI in Africa, please see Blanke et al. (2011). 11
To promote intra-regional trade, the revised EAC Protocol aimed at gradual reduction in tariffs for goods
classified under category B, i.e. agricultural products, building materials, plastics, wood and paper, textiles, iron and
steel and other manufactures. No tariffs were to be charged on category A products. An annual 2 percent reduction
in tariffs was agreed with the objective of complete elimination of the tariffs by 2010.

13
The high levels of inflation are not observed after 1990 (Figure 3b). Volatility in GDP growth
and inflation also decreased since 1990.
Figure 4a. Pair-wise correlations between the real GDP growth in the EAC countries
Figure 4b. Pair-wise correlations between the inflation rates in the EAC countries
Source: Authors’ calculations based on the AEO and IMF WEO database.
III.2 Structural Similarity Indexes indicate growing similarity
a. Structural Similarity Measured by Value Added
The structural similarity of production between the EAC members and Kenya is measured in
terms of Bray-Curtis index.12
Denoting ijx to be the share of sector i in the total value added of
country j, and ikx denoting the share of sector i in total value added of Kenya. The countries in
12
Kenya, the largest and most developed economy in the region, was chosen as the reference point for the degree of
convergence.

14
this case being (i) the EAC members other than Kenya and (ii) Kenya, and N as total number of
sector, the index is defined as:
N
i
ikij
N
i
ikij
ij
xx
xx
d
1
1 (1)
The index takes values between [0,1]. The index is a measure of distance, and hence lower
values indicate a greater structural similarity between sectoral contributions to total values added
in (i) the EAC members other than Kenya and (ii) Kenya. According to this index, the EAC’s
production structure – measured by six categories (agriculture, industry, construction, trade,
other private sector services, social services) – has converged to that of Kenya over the past
twenty years. Most of the convergence occurred during 1990s though, with stagnation
afterwards. Moreover, in all countries except Uganda and Kenya, the share of agriculture is 30
percent or more of the output. The large share of similar low value production in countries’ GDP
inhibits trade and regional integration.
Figure 5. Bray-Curtis Similarity Index: Kenya and other EAC members, 1991 - 2010
Source: Authors’ calculations based on data from the UN national account statistics.
b. Structural Similarity Measured by Exports
Despite increasing intra-regional trade, the EAC countries exhibit export dissimilarities. Indices
presented in Table 4 show no evidence of export similarities between Kenya and the other EAC
members. Following Xu and Song (2002) the indices focus on the market domain, where the
objective is to compare the similarity between Kenya’s exports and those of the other EAC

15
countries. The indices, where ikx is the export of good k by country i, and jkx are Kenya’s
exports of good k, are obtained as follows:
∑{[
] [
]}
The index ranges between 0 and 100, where zero and 100 denote no similarity and perfect
similarity, respectively. For both years, Burundi’s and Rwanda’s exports to the EAC are the least
similar to those of Kenya while there is very limited similarity between the latter’s exports and
those of Tanzania and Uganda (Table 4). Table 4 Export Similarity Indices between Kenya and those of the other EAC Members
Year Burundi Rwanda Tanzania Uganda
2009 1.4 2.4 14.0 19.6
2010 0.7 2.7 25.1 19.2
Source: Authors’ calculations.
III.3 Structural VAR Approach
This section applies a two-variable structural VAR (SVAR) framework to assess suitability of
the EAC countries for monetary union. The economic shocks experienced by the EAC countries
are decomposed into supply and demand shocks and their correlations examined. The section
also examines whether the supply and demand shocks have become more synchronized over
time.
The SVAR framework was developed by Blanchard and Quah (1989) and utilized by Bayoumi
and Eichengreen (1993) to analyze the suitability of European monetary integration. More
recently, it was applied by Fidrmuc and Korhonen (2003) and Brixiova, et al, (2010), among
others, to assess the degree of synchronization of countries of Central and Eastern Europe with
the Eurozone. In the Asian context this approach was utilized for example, by Zhang et al.
(2004), among others.
III.2.1 The AD-AS Model
The shock synchronization model is based on a two variable (output growth and inflation)
aggregate demand-aggregate supply (AD-AS) macroeconomic framework. The AD-AS
framework assumes that fluctuations in real output, ty , and the price level, tp , are due to supply
and demand shocks. In this framework the long run aggregate supply curve is vertical at the full
employment level of output, but the short run one is upwards sloping due to sticky wages.13
In
the EAC context, it is worthwhile to note that as all members have removed most price controls,
prices in the goods and services markets are best characterized as flexible. However, wages are
13
Real wages initially decline with price increases, leading to higher employment and output. With a lag (in the long
run), real wages adjust to their initial value.

16
sticky due to the presence of minimum wages and the role of public sector wages as a reference
point for private sector wage levels. Moreover, unemployment in the region remains high.14
As discussed above, in this AD-AS framework, the responses of real output and the price level to
positive demand and supply shocks can be summarized as follows (Table 5):15
Table 5. Expected Dynamic Responses for the AD-AS Framework
Type of shock Short Run Long Run
Output response to Positive AS shock Positive Positive
Positive AD shock Positive None
Price response to Positive AS shock Negative Negative
Positive AD shock Positive Positive
III.2.2 Estimation Results
Data
We use annual and seasonally unadjusted data on real GDP and inflation from the five EAC
countries for the period 1980 - 2009. The data was obtained from the African Development Bank
online data platform. To avoid any spurious relationships the Ng-Perron unit-root test was used
to determine the process generating the data series. This test was used because experiences in the
application of the Augmented-Dickey-Fuller (ADF) and Phillip-Perron (PP) unit root tests have
shown that they are affected by finite sample power and size problems.16
Specific attention was
given to the lag truncation criterion, with the optimal lag determined as one. The results of the
stationarity and estimation tests are presented in Annex B. Overall, output growth and inflation
series from the five countries were found to be stationary while inflation data for Tanzania and
Uganda only became stationary after the first difference.
Correlations of Demand and Supply Shocks
Table 6 gives correlation coefficients of the supply and demand shocks (the SVAR error terms)
between Kenya and the other EAC countries. Only recently the EAC members agreed on
convergence criteria and none of them has satisfied them so far, making Kenya a natural anchor.
Table 6a. Correlation of shocks between Kenya and the EAC-4 (1981 – 2009)
Country Supply shock Demand shock
Burundi 0.0940 0.2429
Rwanda 0.0011 0.2779
Tanzania 0.1207 0.2510
Uganda 0.0113 -0.3034
14
While the depiction of the short-run AS relationship as a reduced form mark-up price-setting equation of a
disequilibrium labor market has been questioned, Rao (2007), Boyd (2010) and others have supported it. 15
Identification of supply and demand shocks is detailed in Annex A. 16
DeJong, et al (1992) has shown that the ADF and PP tests can result in rejecting the alternative hypothesis of
stationarity. On the other hand, the ADF and PP tests are also known to suffer from severe size distortions leading to
bias towards rejecting the null hypothesis of non-stationarity (Schwert, 1989).

17
Table 6b. Correlation of shocks between Kenya and the EAC-4 (1990 – 2009)
Country Supply shock Demand shock
Burundi 0.0432 0.1714
Rwanda -0.0122 0.2101
Tanzania -0.1574 0.5142*
Uganda -0.0677 -0.0302 Source: Authors’ calculations. * Indicates statistical significance. Note: Kenya is the reference country in the
comparisons.
Table 6a shows the limited degree of shock synchronization between the EAC-4 (Burundi,
Rwanda, Uganda, and Tanzania) and Kenya during 1981-2009. While most shocks are positively
correlated, the correlation coefficients are low and none of them is statistically significant.
Moreover, the demand shock has an opposite effect in Uganda. The results are not surprising in
light of the major disparities in macroeconomic performances of the EAC countries, especially
before 2000.
Impulse Response
This section utilizes impulse response function to examine responses of the EAC countries to the
supply and demand shocks in terms of size and the speed of the adjustment. The larger the size
of the shock and the slower the adjustment, the more costly it would be for a country to maintain
membership in monetary union.
An examination of the impulse response functions (Figure 6) suggests that while demand shocks
have no effect on the long-run output in Burundi, Rwanda and Uganda, adjustment to such
shocks takes a minimum of six years. Such slow adjustment points to rigidities in the business
environments and labor markets (greater wage stickiness, for example). Moreover, past demand
shocks in Tanzania and Kenya seem to have a long-lasting effect on output, suggesting that these
were accompanied by supply shocks (i.e. increases in government spending accompanied by
greater outlays on infrastructure, which could increase the countries’ potential outputs).
On the other hand, and as predicted by the AD-AS framework, a positive income/output shocks
appear to have long-run effects on inflation in all EAC countries, with the greatest impacts in
Uganda and Tanzania. These two countries have exhibited higher than the average regional
variability in inflation. In general as low – income countries with high income propensity to
consume, the EAC members may experience self-reinforcing effects when income shocks occur.
Specifically, a positive income shock may lead to higher demand response that is reflected in
rising prices.

18
Figure 6: Accumulated Impulse Responses to Shocks
6a. Burundi: Accumulated response of inflation 6b. Burundi: Accumulated response of GDP growth
to supply shock (one SD in GDP growth) to demand shock (one SD in inflation)
6c. Kenya: Accumulated response of inflation 6d. Kenya: Accumulated response of GDP growth
to supply shock (one SD in GDP growth) to demand shock (one SD in inflation)
6e. Rwanda: Accumulated response of inflation 6f. Rwanda: Accumulated response of GDP growth
to supply shock (one SD in GDP growth) to demand shock (one SD in inflation)
-2
-1
0
1
2
3
4
5
-2
-1
0
1
2
3
4
5
1 2 3 4 5 6 7 8 9 10
Response of GDPB to INFB
-8
-4
0
4
8
-8
-4
0
4
8
1 2 3 4 5 6 7 8 9 10
Response of INFB to GDPB
-1
0
1
2
3
-1
0
1
2
3
1 2 3 4 5 6 7 8 9 10
Response of GDPK to INFK
-8
-4
0
4
8
12
-8
-4
0
4
8
12
1 2 3 4 5 6 7 8 9 10
Response of INFK to GDPK
-10
-5
0
5
10
15
20
-10
-5
0
5
10
15
20
1 2 3 4 5 6 7 8 9 10
Response of GDPR to INFR
-15
-10
-5
0
5
10
-15
-10
-5
0
5
10
1 2 3 4 5 6 7 8 9 10
Response of INFR to GDPR
19
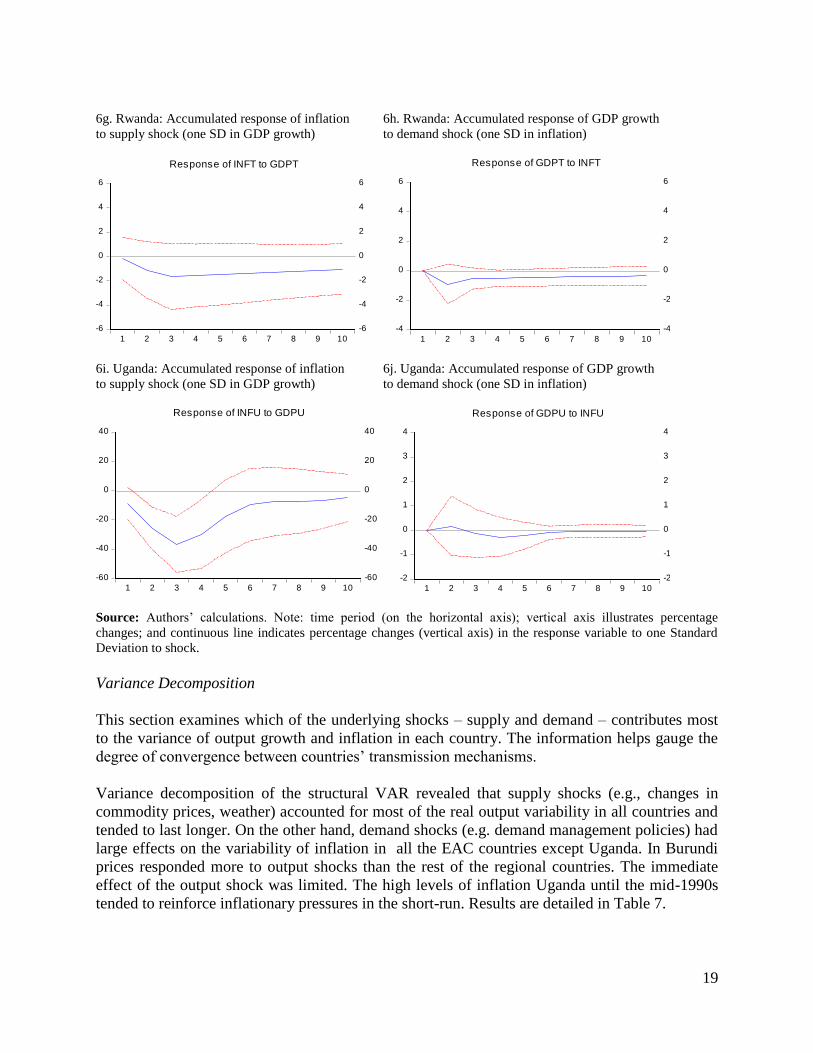
6g. Rwanda: Accumulated response of inflation 6h. Rwanda: Accumulated response of GDP growth
to supply shock (one SD in GDP growth) to demand shock (one SD in inflation)
6i. Uganda: Accumulated response of inflation 6j. Uganda: Accumulated response of GDP growth
to supply shock (one SD in GDP growth) to demand shock (one SD in inflation)
Source: Authors’ calculations. Note: time period (on the horizontal axis); vertical axis illustrates percentage
changes; and continuous line indicates percentage changes (vertical axis) in the response variable to one Standard
Deviation to shock.
Variance Decomposition
This section examines which of the underlying shocks – supply and demand – contributes most
to the variance of output growth and inflation in each country. The information helps gauge the
degree of convergence between countries’ transmission mechanisms.
Variance decomposition of the structural VAR revealed that supply shocks (e.g., changes in
commodity prices, weather) accounted for most of the real output variability in all countries and
tended to last longer. On the other hand, demand shocks (e.g. demand management policies) had
large effects on the variability of inflation in all the EAC countries except Uganda. In Burundi
prices responded more to output shocks than the rest of the regional countries. The immediate
effect of the output shock was limited. The high levels of inflation Uganda until the mid-1990s
tended to reinforce inflationary pressures in the short-run. Results are detailed in Table 7.
-4
-2
0
2
4
6
-4
-2
0
2
4
6
1 2 3 4 5 6 7 8 9 10
Response of GDPT to INFT
-6
-4
-2
0
2
4
6
-6
-4
-2
0
2
4
6
1 2 3 4 5 6 7 8 9 10
Response of INFT to GDPT
-2
-1
0
1
2
3
4
-2
-1
0
1
2
3
4
1 2 3 4 5 6 7 8 9 10
Response of GDPU to INFU
-60
-40
-20
0
20
40
-60
-40
-20
0
20
40
1 2 3 4 5 6 7 8 9 10
Response of INFU to GDPU

20
Table 7: Variance Decompositions – Full Sample
GDP growth
Period
Variance to Supply
Shock
Variance
to Demand Shock
Variance to Supply
Shock
Variance to Demand
Shock
Variance to Supply
Shock
Variance to Demand
Shock
Variance to Supply
Shock
Variance to Demand
Shock
Variance to Supply
Shock
Variance to Demand
Shock
Burundi Kenya Rwanda Tanzania Uganda
1 100.0 0.0 90.8 9.2 100.0 0.0 100.0 0.0 100.0 0.0
2 81.3 18.6 91.1 8.9 75.4 24.6 92.7 7.3 99.8 0.2
3 81.4 18.6 91.0 8.9 74.1 25.9 90.5 9.5 99.7 0.3
4 81.4 18.6 90.3 9.7 73.5 26.5 88.6 11.4 99.1 0.9
5 81.4 18.6 89.9 10.1 73.6 26.4 86.9 13.1 98.8 1.2
6 81.4 18.6 89.9 10.1 73.7 26.3 85.6 14.4 98.7 1.3
7 81.4 18.6 89.9 10.1 73.7 26.3 84.5 15.5 98.7 1.3
8 81.4 18.6 89.9 10.1 73.6 26.4 83.5 16.5 98.7 1.3
9 81.4 18.6 89.9 10.1 73.6 26.4 82.7 17.3 98.7 1.3
10 81.4 18.6 89.9 10.1 73.6 26.4 82.1 17.9 98.7 1.3
Inflation
Period
Variance to Supply
Shock
Variance to Demand
Shock
Variance to Supply
Shock
Variance to Demand
Shock
Variance to Supply
Shock
Variance to Demand
Shock
Variance to Supply
Shock
Variance
to Demand Shock
Variance to Supply
Shock
Variance to Demand
Shock
1 7.7 92.3 1.3 98.7 1.0 99.0 0.1 99.9 9.0 91.0
2 29.8 70.2 5.7 94.3 18.7 81.3 3.7 96.3 44.2 55.8
3 34.2 65.8 5.7 94.3 21.5 78.5 8.4 91.6 68.5 31.5
4 34.7 65.3 6.7 93.3 22.4 77.6 10.7 89.3 75.3 24.7
5 35.1 64.9 7.4 92.6 22.5 77.5 12.2 87.8 76.8 23.2
6 35.4 64.6 7.6 92.4 22.5 77.5 13.2 86.8 76.9 23.1
7 35.5 64.5 7.6 92.4 22.5 77.5 13.8 86.2 77.0 23.0
8 35.7 64.3 7.6 92.4 22.5 77.5 14.3 85.7 77.2 22.8
9 35.6 64.4 7.6 92.4 22.5 77.5 14.7 85.3 77.4 22.6
10 35.6 64.4 7.6 92.4 22.5 77.5 15.0 84.9 77.5 22.5
Note: Inf = Inflation; Q = Output
III. Conclusions and Policy Recommendations
Would the EAC countries need to give up macroeconomic stabilization capacity when
establishing a common currency? We apply the OCA approach to gain some insights into this
issue. The actual practice of monetary integration is underpinned by a diverse set of factors,
including politics, increased credibility of monetary policy and more favorable expectations.
Given this complexity, there is no (and cannot be) a “benchmark correlation coefficient” that
would determine that the shock correlation of a country with potential monetary zone is
sufficient for it to benefit from a common currency. Still, given the EAC’s low -- albeit
increasing -- synchronization of shocks and business cycles as well as the rigidities in the
business environment and underdeveloped infrastructure, costs of a premature adoption of
common currency in the region are likely to exceed its benefits.
The OCA approach is only one angle that countries consider when deciding whether or not to
proceed with monetary integration, where the revealed shock asymmetry cautions against hasty
implementation of a joint currency. The asymmetry underscores the importance of developing
broader adjustment mechanisms other than monetary and exchange rate policies. Labor and
21
product market flexibility, and integration of financial markets are critical before establishing the
EAMU. These mechanisms are crucial not only for the EAC’s monetary integration, but also the
creation of a prosperous and economically well connected region that could compete in the
global economy.
Moreover, the recent experience from the euro zone indicates that besides fiscal union, banking
union with joint supervision and regulation of systemically important financial institutions is an
important element for preventing currency crises. Recent debates among the EAC policymakers
indicate a preference for establishing a regional central bank that would control all the financial
institutions in the region. These topics, so far unexplored for the EAC, could be addressed in
future research.
The lack of macroeconomic convergence strengthens the case against a hurried transition into a
monetary union in the EAC. Given the divergent macroeconomic outcomes in the EAC
countries, structural reforms, including closing infrastructure gaps, and harmonized
macroeconomic policies that would raise synchronization of business cycles need to be in place
before a move to monetary union. In that context, the role of appropriately prudent and
coordinated fiscal policy cannot be emphasized enough. As the example of the Eurozone shows,
a well-functioning fiscal transfer system (or union) may be needed for the longer-term viability
of monetary union.17
Strengthening institutions charged with coordinating the regional
integration agenda and increased information sharing within the region are needed. Basic rules
for the regional bloc would help in this regard.
Currie, et al (1989) established that policy coordination was problematic unless it was based on a
rules-based framework. A rules-based framework, if properly implemented, engenders some
discipline among member countries and reduces the risk of bad policies being pursued. The
Eurozone debt crisis is a good example of weakly enforced rules and inadequate policy
coordination.
In light of the shock asymmetries in the EAC, policy coordination as currently pursued bodes
well for achieving macroeconomic convergence. However, the linear approach to deepening
regional integration is problematic. First, the economies are structurally different and at different
stages of development. Second, intraregional trade within the region is still very low, which in
itself could be a reflection of structural asymmetry. Strengthening institutions and improving the
infrastructure that supports a competitive production system and trade is therefore central to
deepening regional integration.
Production asymmetries aside, the compensation framework is set to mitigate the likely varied
impacts that countries will experience while implementing the EAC protocol. The resources for
compensation could come under pressure if the transition to the EAMU is hurried. This
compensation process – if well managed and timed - will allow member countries to transform
structurally and respond to regional opportunities through the optimal utilization of their
comparative advantages.
17
The EAC established a fund to compensate those countries that may face losses in implementing the EAC
protocol.

22
References
African Development Bank (2011), ‘Eastern Africa Regional Integration Strategy Paper’,
September, AfDB: Tunis.
Barro, R. and D.B. Gordon, (1983), ‘A Positive Theory of Monetary Policy in a Natural Rate
Model,’ Journal of Political Economy, 91, pp. 589 – 610.
Bayoumi T., Eichengreen B. (1993), ‘Shocking Aspects of European Monetary Integration,’ In
Torres F., Giavazzi F. (eds), Adjustment and Growth in the European Monetary Union, 193-229,
Cambridge University Press, Cambridge, UK
Blanchard O. and Quah D. (1989), ‘Dynamic efficiency of aggregate demand and supply
disturbances’, American Economic Review, Vol. 79, 655-673.
Blanke, J.; Brixiova, Z.; Dadush, U., Gurcanlar, T. and Iarossi, G. (2011), ‘Competitiveness,
Trade and FDI in Africa’, In Africa Competitiveness Report 2011, World Economic Forum,
World Bank and African Development Bank.
Boyd, D. (2010) ‘Comment: The Nature of the AD/AS model based on the IS/LM Model,’
Cambridge Journal of Economics, 34: 587-590.
Brixiova, Z., Morgan, M. H. and Wörgötter, A. (2010) ‘On the Road to Euro: How Synchronized
is Estonia with the Eurozone? European Journal of Comparative Economics, Vol. 7 (July), 203-
227.
Brixiova, Z. and Ndikumana, L. (2011), ‘East Africa’s Resilience during the Global Financial
Crisis: Lessons and Policies’, Paper presented at the 2011 ASSA Annual Meetings (Denver,
January).
Corsetti, G. (2009), ‘A Modern Reconsideration of the Theory of Optimal Currency Areas’,
CEPR Discussion Paper, 6712.
Curie, D., Holtham, G. and Hughes, G. (1989) ‘The Theory and Practice of International Policy
Coordination: Does Coordination Pay?’ CPER Discussion Paper No. 325.
de Haans, J. and H. Berger (2003), ‘How to tie your hands: A currency board vs. an independent
central bank,’ in: A. W. Mulineux and V. Murinde (eds.) Handbook of International Banking.
Fidrmuc, J. and Korhonen, I. (2003) ‘Similarity of Supply and Demand Shocks between the Euro
Area and the CEECs,’ Economic Systems, Vol. 46: 45-62.
Frankel, J. A. and Rose, A. K. (1998) 'The Endogeneity of the Optimum Currency Area Criteria',
Economic Journal 108: 1009-1025.

23
Guerguil, M. et al. (2011), ‘The East African Community: Taking Off?’ in Regional Economic
Outlook: Sub-Saharan Africa (May), IMF: Washington, DC.
Kasekende, L.; Brixiova, Z. and Ndikumana, L. (2010), ‘Africa: Africa’s Counter-cyclical
Response to the Crisis’, Journal of Globalization and Development, Issue 1, Article 16.
Kenen P.B. (1969), ‘The Theory of Optimum Currency Areas: An Eclectic View’, In Mundell
and Swoboda (eds.), Monetary Problems of the International Economy, University of Chicago
Press, Chicago, IL.
Lai, E. L.-C. (2008) ‘Theory of International Policy Coordination in the Protection of Ideas,’ in
Frontiers of Economics and Globalization Maskus, K. E. (eds) Elsevier.
McKinnon R. I. (1963), ‘Optimum currency areas’, American Economic Review, Vol. 53(4),
717-725.
Mundel, R. (1961) ‘A Theory of Optimum Currency Areas’, American Economic Review 51: 557
– 565.
Newfarmer, R. and Söderbom, M. (2012), ‘Rwanda and the East Africa Monetary Union’,
International Growth Center (March).
Opolot, J. and Luvanda, E. (2009) ‘Macroeconomic Convergence in the East African
Community: Progress and Implications for the Proposed Monetary Union,’ Bank of Uganda
Working Papers.
Rao, B. B. (2007) ‘The nature of the AD - AS model based on the ISLM model,’ Cambridge
Journal of Economics, 31: 413-422.
Wang, Y. D. (2010), ‘Measuring Financial Barriers among East African Countries’, IMF
Working Paper WP/10/194.
Winston, S. and Castellanos, C. (2011), ‘Trade in East Africa’, Finance & Development,
December 2011, Vol. 48, No. 4.
World Bank (2007), ‘Financial Sector Integration in Two Regions of Sub-Saharan Africa’,
January, Washington DC.
Xu, X. and Song, L. (2002), ‘Export Similarity and Pattern of East Asian Development,’ in
Lloyd, P. and Zhang, X. (eds.) China in the Global Economy, Edward Elgar, 145–164.
Zhang, Z.; Sato, K. and McAleer, M. (2004), ‘Asian Monetary Integration: Structural VAR
Approach’, Mathematics and Computers in Simulations, Vol. 64, 447 – 458.

24
Annex A. The AD-AS Framework and Identification of Supply and Demand Shocks
Formally, the AD-AS framework is described as:
(A1)
(A2)
(A3)
where is (the log of) output in period t, and is (the log of) output expected in period t
given information at t-1. Similarly, is (the log of) price level in period t, while is (the
log of) price level expected at t-1. The superscripts S and D represent supply and demand,
and and denote the (serially uncorrelated) structural aggregate supply and structural
aggregate demand shock, respectively.
Equation (A1) is the AS curve, where output increases with unexpected increases in the positive
supply shocks and price level. The AD in (A2) increases with its expected value and positive
demand shocks. In (A1) – (A3) the long-run independence of nominal and real variables are
independent in the long run, as the short run AS curve is upward sloping, but the long-run AS
curve is vertical. System (A1) – (A3) can be written as:
(A4)
The joint process of changes in real output and prices can be represented by an infinite moving
average representation of a vector of two variables -- real output and prices) and a vector of
supply and demand shocks:
(A5)
where , , and is the lag operator. The matrices represent the impulse
response functions that transmit effects of the shocks to the variables (elements of ). A finite
version of (A5) can be estimated as VAR:
S
tttttt
S
t pEpyEy 11
D
tt
D
ttt
D
t pyEpy )(1
D
t
S
tt yyy
ty tt yE 1
tp tt pE 1
S
tD
t
D
t
S
t
tt
tt
t
t
pE
yE
p
y
.
1
1
1
111
1
1
1
ti
i
i
tttot ALAAAX
0
2211 .....
t
t
t
yX
D
t
S
t
t
iL
iA
tX

25
(A6)
(A7)
The matrices can be estimated from 0ABA ii and 0
00
ABAi
i
i
i
. The regression residuals
, consist of the underlying structural supply and demand shocks . Since these
shocks are not observed, they need to be identified from the VAR residuals. The equations (A5)
– (A7) describe the relationship between the estimated residuals (e) and the original shocks ( ),
which can be written as :
(A8)
where is the effect of shock j on variable i. Therefore we need to know the elements of to
calculate the underlying supply and demand shocks. From (A4), the variance-covariance matrix
of the VAR residuals is given by:
(A9)
Since estimation of the VAR yields , the identification of the
structural model requires four restrictions being imposed on the VAR. Standard assumptions are
that , that is variability of the demand and supply shocks is equal and normalized
to unity, and that the shocks to aggregate demand and supply are uncorrelated with each other,
In addition, the long-run neutrality restriction implies that cumulative effect of
demand shocks on output must be zero, that is (demand shocks has no permanent
impact on output). Alternatively, the last restriction can be written as
Finally, model assumptions that positive demand shock will raise
prices in both short and long run, while positive supply shock will lower them are below used for
interpreting the results of the model.
ytjt
k
j
jjt
k
j
jt ebyby
0
)(12
0
)(11
ptjt
k
j
jjt
k
j
jt ebyb
0
)(22
0
)(21
iB
yte pte S
t
D
t ,
tot Ae
D
t
S
t
t
yt
aa
aa
e
e
.2221
1211
ija 0A
tyt ee ,
2212
2111
2
2
2221
1211..
)(),(
)()(
aa
aa
aa
aa
eVareeCov
eeCoveVar
DSD
SDS
ptptyt
ptytyt
),(),(),( tytptyt eeCoveVareVar
1,1 22 DS
.0),( DSCov
0)(1
12
j
ja
.0)1()]1(1[ 12222212 baba

26
Annex B Tests for Stationarity and Residual Normality
Ng-Perron Stationarity Statistics
Notes: ** Stationary after differencing once
Example of the VAR Residual Normality Tests for Tanzania
Component Skewness Chi-sq df Prob.
1 1.940304 16.94151 1 0.0000
2 0.645145 1.872955 1 0.1711
Joint 18.81446 2 0.0001
Component Kurtosis Chi-sq df Prob.
1 8.575759 34.97522 1 0.0000
2 3.098419 0.010897 1 0.9169
Joint 34.98612 2 0.0000
Component Jarque-Bera df Prob.
1 51.91673 2 0.0000
2 1.883852 2 0.3899
Joint* 53.80058 4 0.0000
* Null Hypothesis that residuals are multivariate normal cannot be rejected using the joint Jarque-Bera test.
Country Variable
1981 - 2009 1990 - 2009
Burundi GDP Growth -9.27826 -6.83788
Inflation -12.7881 -8.72226
Kenya GDP Growth -11.1380 -8.29530
Inflation -10.1670 -6.60626
Rwanda GDP Growth -13.8411 -9.31760
Inflation -8.94909 -10.8064
Tanzania GDP Growth -10.9057 -8.79786
Inflation -1.60702** -2.30190**
Uganda GDP Growth -9.08951 -644.906
Inflation -4.65552** -6.29288
*Ng-Perron (2001) Table 1
Asymptotic critical values
1% -13.8000
5% -8.10000
10% -5.70000

27
VAR Lag Order Selection Endogenous variables: Lag FPE AIC SC HQ
0 1172.426 12.74250 12.84001 12.76954
GDPB, INFB 1 857.4511* 12.42739* 12.71992* 12.50853*
2 949.3369 12.52059 13.00814 12.65581
3 1180.660 12.71885 13.40142 12.90817
4 1493.049 12.91679 13.79438 13.16019
0 403.3516 11.67548 11.77299 11.70252
GDPK, INFK 1 315.3601* 11.42715* 11.71968* 11.50828*
2 400.6108 11.65781 12.14536 11.79304
3 502.4777 11.86458 12.54715 12.05389
4 440.8077 11.69682 12.57441 11.94023
0 30860.12 16.01289 16.11040 16.03993
GDPR, INFR 1 6900.221* 14.51274* 14.80527* 14.59387*
2 8017.876 14.65425 15.14180 14.78948
3 9004.647 14.75052 15.43309 14.93984
4 9819.409 14.80033 15.67792 15.04373
0 1224.112 12.78564 12.88315 12.81269
GDPT, INFT 1 180.9008* 10.87138* 11.16391* 10.95251*
2 248.4010 11.17987 11.66742 11.31509
3 305.0350 11.36545 12.04802 11.55477
4 409.8930 11.62411 12.50170 11.86751
0 32088.84 16.05193 16.14944 16.07898
GDPU, INFU 1 6352.749 14.43007 14.72260* 14.51121
2 7307.924 14.56154 15.04909 14.69676
3 5839.882 14.31749 15.00006 14.50681
4 4557.396* 14.03272* 14.91031 14.27612*
* indicates lag order selected by the criterion
LR: sequential modified LR test statistic (each test at 5% level)
FPE: Final prediction error
AIC: Akaike information criterion
SC: Schwarz information criterion
HQ: Hannan-Quinn information criterion.

28
Recent Publications in the Series
nº Year Author(s) Title
155 2012 John Page
Youth, Jobs, and Structural Change:
Confronting Africa’s “Employment Problem”
154 2012 Thouraya Triki and Ousman Gajigo Credit Bureaus and Registries and Access to Finance: New
Evidence from 42 African Countries
153 2012 Cedric Achille Mbenge Mezui Accessing Local markets for Infrastructure: Lessons for Africa
152 2012 Alain Kabundi Dynamics of Inflation in Uganda
151 2012 Dick Durevall and Bo Sjö The Dynamics of Inflation in Ethiopia and Kenya
150 2012 Mthuli Ncube, Abebe Shimeles and
Audrey Verdier-Chouchane South Africa’s Quest for Inclusive Development
149 2012 John C. Anyanwu Accounting for Poverty in Africa: Illustration with Survey
Data from Nigeria
148 2012
John C. Anyanwu, Yaovi Gassesse Siliadin
and Eijkeme Okonkwo
Role of Fiscal Policy in Tackling the HIV/AIDS Epidemic
in Southern Africa
147 2012 Ousman Gajigo, Emelly Mutambastere and
Guirane Nadiaye
Gold Mining in Africa: Maximization Economic returns for
countries
146 2012 Pietro Calice, Victor M. Chando and
Sofiane Sekioua
Bank Financing to Small and Medium Enterprises In East
Africa: Findings of A Survey In Kenya, Tanzania, Uganda
And Zambia